Article

A Novel Integrated q-Rung Fuzzy Framework for Biomass Location Selection with No Apriori Weight Choices

by
Raghunathan Krishankumar
1,
Arunodaya Raj Mishra
2,
Pratibha Rani
3,
Fausto Cavallaro
4,* and
Kattur Soundarapandian Ravichandran
5
1
Department of Computer Science and Engineering, Amrita School of Computing, Amrita Vishwa Vidyapeetham, Coimbatore 641105, India
2
Department of Mathematics, Government College Raigaon, Satna 485441, India
3
Department of Engineering Mathematics, Koneru Lakshmaiah Education Foundation, Vaddeswaram 522302, India
4
Department of Economics, University of Molise, Via De Sanctis, 86100 Campobasso, Italy
5
Department of Mathematics, Amrita School of Physical Sciences, Amrita Vishwa Vidyapeetham, Coimbatore 641105, India
*
Author to whom correspondence should be addressed.
Sustainability 2023, 15(4), 3377; https://doi.org/10.3390/su15043377
Submission received: 16 January 2023 / Revised: 6 February 2023 / Accepted: 6 February 2023 / Published: 12 February 2023
(This article belongs to the Special Issue Sustainable Biofuels Production from Biomass)

Abstract

:
Biomass is a promising form of clean energy that could be utilized worldwide for huge household demand. As the world is constantly fighting climate change and carbon emissions, the adoption of biofuels for households minimizes the ill effects on the ecosystem from households. A recent report from IndiaSpend shows that Indian households bring approximately 3.78 tonnes/capita of carbon, which includes electricity, consumables, and food sources. To bring a balance between utilization demand and ecofriendliness within the household, biomass is an attractive option. Location for producing biomass is a crucial decision problem as it involves multiple criteria that are competing and conflicting with one another. Previous studies on location selection for biomass cannot promptly model uncertainty and consider hesitation and interactions of experts and criteria. To handle these issues, a novel integrated decision approach is put forward. Initially, a generalized orthopedic structure is adapted to model uncertainty from three dimensions. Further, the weights of experts and criteria are determined via variance measure and the CRITIC method. A ranking procedure is put forward with combined compromise solution formulation for rational selection of biomass production location. The usefulness of the developed framework is testified by using a case example and comparison with extant approaches, revealing the superiorities and limitations of the framework.

1. Introduction

World leaders are tirelessly working toward carbon footprint reduction/eradication with the prime focus to handle climate change within the planet [1,2]. Energy and its demand within countries are increasing day by day, and to meet the demand, fossil fuels are abundantly extracted and utilized, which causes adverse harm to the ecosystem. A report by Statista (www.statista.com, dated: 7 November 2022) shows that the world energy demand has constantly grown, with over 23,900 terawatt/hour used in 2019. Furthermore, a report from International Energy Agency called the World Energy Outlook 2020 shows that the effect of the COVID-19 pandemic has slowed down the pace of clean energy transformation and countries are moving toward sustainable transformation within 2030. Additionally, the report claims that despite the drastic reduction of carbon traces, the planet still requires extra reduction to combat the ill effects of climate change (www.iea.org, dated: 7 November 2022).
To strike a balance between energy demand and sustainability, countries started shifting their focus toward clean energy forms rather than fossil fuels. Clean energy forms are not only ecofriendly but also renewable. This shift in energy production and utilization brings many promising benefits to the ecosystem [3]. Biomass is one such promising source of clean energy that could crucially and effectively help household demands [4,5]. Though there are some positive aspects on one side for biomass, on the other hand, there is an issue of air pollution, which must be addressed for better adoption of the quickly regrowing renewable form of energy [6]. Due to the pros and cons of biomass utilization, the problem is critical and crucial for better promotion of such energy in the market/business.
Researchers infer that biomass energy has merits but, at the same time, has some challenges such as pollution and bacterial infection which must be addressed to make the energy form more viable and useful. As discussed above, the report from IndiaSpend (https://science.thewire.in/environment/india-carbon-emissions-rich-poor-households/, accessed on 22 January 2023) infers that approximately 3.78 tonnes/capita of carbon emissions come from Indian households (metro cities of India), via consumables, electricity, and food sources, which could contribute to issues in sustainability adoption, and use of biomass can be a useful way out from this issue. One affordable solution is to select a suitable location for biomass production and transmission of the produced energy to diverse destinations. Crucially, the location selection for biomass generation involves multiple criteria that must be effectively managed for trade-offs and diversity. As a result, the problem can be viewed from the perception of multicriteria decision-making (MCDM), wherein a set of experts consider different candidate locations for biomass production and provide their rating on these locations based on different competing criteria with the final objective of ranking these locations for the production purpose [7].
Before presenting the research gaps for location selection for biomass, it is essential to discuss the technologies that yield biofuels from biomass. Popular technologies are transesterification, Fischer-Tropsch synthesis, and fermentation, where the process and idea to generate biofuel is different from biomass. In the transesterification approach, the oils from plants and animal fats are treated with alcohol along with a catalyst such as an enzyme, acid, or alkali for biodiesel generation. Similarly, fermentation is the process where sugar is converted to ethanol via bacterial influence. Ethanol is obtained after the water distillation [8,9,10,11] process, and, in the case of the cellulosic form, cellulose is first converted to sugar and then ethanol is extracted. In the Fischer-Tropsch method, biomass is gasified to yield syngas. Hydrocarbons have been produced that help in ethane and methane generation.
In developing countries such as India, biomass adoption provides a feasible clean source for meeting the demand of households. A report from the Ministry of New and Renewable Energy (https://mnre.gov.in/bio-energy/current-status, accessed on 29 January 2023) claims that almost 70% of the people in India depend on biomass for their energy source and around 32% of the primary energy demand is addressed via this energy form. Around 750 million metric tonnes of biomass is available in India every year, and to match the urgent demand for energy and to reach carbon neutrality, the expansion of bioenergy production is substantial (www.mnre.gov.in, accessed on 21 January 2023). Exploration of a suitable location for biomass production is observed as an important decision problem, and studies in the literature discussed in the next section reveal certain applications and research gaps. In the application context, location selection (i) allows sustainable and effective production of biomass energy; (ii) promotes rational placement of residential zones for people of that locality; and (iii) encourages public in and around the location to plan strategies and mechanisms to render support to the sustainable initiative. Further, the research gaps identified are: (i) uncertainty is inevitable in such decision problems, and capturing them effectively/flexibly is lacking; (ii) importance of experts who play a crucial role in the decision problem are not methodically determined; (iii) hesitation and inconsistency in the distribution of preferences is not well captured in such decision-making processes; (iv) interaction of criteria and consideration of experts’ importance is not widely explored during criteria weight determination; and (v) consideration of criteria type and different compromise solutions during ranking of locations for biomass production still needs to be explored.
Driven by these gaps, some contributions are put forward, such as:
  • The q-Rung fuzzy data method is considered for rating locations and criteria, which offers experts a flexible window for expressing their opinions in terms of membership, nonmembership, and hesitancy. By adjusting the factor q , the opinion window can be expanded or shrunk.
  • Importance of experts is methodically determined via a variance approach that not only considers variability distribution in preferences but also captures the hesitation of experts during the rating process.
  • Furthermore, weights of criteria are calculated based on a procedure devised with criteria importance through intercriteria correlation (CRITIC) formulation so that the interaction of criteria and the importance of experts are considered effective.
  • Finally, a ranking procedure is developed based on the combined compromise solution (CoCoSo) approach that considers multiple compromise solutions forms and criteria types during the rank assessment.
The remaining sections are prepared in the following way: In Section 2, we present the comprehensive literature review about biomass site selection through mathematical models and q-Rung ortho-pair fuzzy-driven decision models that provide clarity on the application and method contexts. In Section 3, the main methodology is put forward that focuses on the implementation of the model and contains basic concepts, followed by a weight determination procedure for experts and criteria along with a ranking algorithm for determining the suitability of locations for biomass production. Section 4 presents a case example of location selection for biomass that describes the usefulness of the developed approach along with comparative study and sensitivity analysis in Section 5 to understand the efficacy of the developed approach. Finally, in Section 6, a conclusion with future directions is presented.

2. Literature Review

In the current part of the study, we present the studies in the literature that are related to the several concepts to this study.

2.1. Biomass Location Selection

Bojić et al. [12] studied a mathematical model to solve the location-allocation problem of solid biomass power plants for the region with defined biomass potentials and targeted total electric capacity. Zhao and Li [13] proposed a biobjective 0–1 integer programming model for biomass power plant locations, taking into consideration the pollutant emissions during biomass feedstock transportation. In addition, they considered the economic and environmental benefits of both plant locating and biomass feedstock supply systems. A hybridized fuzzy model has been investigated by Cebi et al. [14] for determining the most suitable location for a biomass power plant. Their model combined the analytic hierarchy process, opinion aggregation method, and information axiom method from a fuzzy perspective. A hybrid decision support framework is presented by combining the geographical information system (GIS) and fuzzy-DEMATEL approach for identifying and prioritizing suitable locations for biomass plants [7]. An integrated fuzzy multicriteria analysis based on the GIS tool was developed for the optimal locating of biomass energy plants [15]. Their proposed model not only identified the optimal locations for biomass energy plants but also considered the road networks and spatially distributed biomass availability. Guler et al. [16] assessed locations for biomass in Turkey by extending the best-worst approach to the fuzzy context. Further, in [17], a framework to identify the most suitable locations for siting new hybridized concentrated solar biomass plants in New South Wales, Australia, was put forward. The findings underlined New South Wales’s superb deployment potential for hybridized concentrated solar biomass plants. Atici et al. [18] extended the analytical hierarchy process in the fuzzy context for rational selection of locations of sustainable biomass production in power plants. Zhao et al. [19] identified and prioritized the suitable locations for building expensive biomass plants with maximum productivity and return. For this purpose, they proposed a fuzzy TOPSIS framework based on the GIS tool and applied it to a case study of biomass power plant construction location problems by taking into consideration the environmental, economic, technical, social, and risk criteria. Gao et al. [20] developed a game-theory-based weight method for macrosite selection for biomass cogeneration along with a factor extraction mechanism. Afkharni et al. [21] applied GIS-driven fuzzy BWM and TOPSIS for location selection of biofuel production from farm practices in Fars province. Kengpol et al. [22] presented fuzzy-based AHP along with TOPSIS for sustainably evaluating locations for biomass power plants. Da silva Romero et al. [23] presented a GIS-based fuzzy logic concept for area identification for biorefinery with spatial and multifactor data.

2.2. q-Rung Orthopair Fuzzy Models for MCDM

To handle the vagueness more precisely, Atanassov [24] extended the fuzzy set theory to the “intuitionistic fuzzy set (IFS)” theory, which simultaneously considers the membership, nonmembership, and hesitance degrees information. In IFS, the sum of the degrees of membership and nonmembership is restricted to unity. To overcome the drawback of IFS theory, Yager [25] illustrated the concept of “Pythagorean fuzzy set (PFS)”, in which the square sum of degrees of membership and nonmembership is less than or equal to unity. After the pioneering works of [26], the PFS theory makes rich contributions to several new theories and applications.
Later on, Yager [27] proposed a “q-Rung ortho-pair fuzzy set (q-ROFS)” that poses the three degrees of uncertainty with the constraint that the q t h powers sum of the membership and nonmembership degrees is less than or equal to unity, where q     1 . As the generalized form of FSs, IFSs, and PFSs, the q-ROFSs have more capability to handle the higher degree of the vagueness of real-life applications. Since its appearance, lots of articles have presented an aggregation of the q-Rung ortho-pair fuzzy (q-ROF) information [28,29,30,31,32].
Peng et al. [33] came up with diverse operational laws, score functions, and a distance-based approximation approach under q-ROFS for rational decision-making. Work from [34] developed an innovative q-ROF framework because of the mass assignment of features using bidirectional encoder representations using transformers. Krishankumar et al. [35] prepared a combined model with variance-VIKOR with q-ROF data for green supplier evaluation to achieve sustainable supply chains. Work from [36] designed a decision support system by considering the discrimination measure and combined compromise solution with q-ROF information. In that study, the authors further implemented their approach to the selection of a third-party logistics provider from the sustainability viewpoints. Krishankumar et al. [37] put forward an integrated decision method with TODIM for a suitable selection of renewable energy sources in India for meeting the demand of people. Yang et al. [38] investigated a novel cloud-based q-ROF multicriteria decision support system for evaluating the green distribution transformer manufacturing process. The findings concluded that resource and energy utilization and green technology innovation are the most important criteria to enhance the excellence of green distribution transformer manufacturing. Further, medical apps were evaluated through a hybrid q-ROF decision-making methodology [39] that combined the Shapley value with MCDM methods, Zhenyuan integral, the best-worst method, and two optimization methods with q-ROF information. The industrial filtration technologies were assessed [40] based on a new collaborative q-ROF decision-making framework. Their findings indicated that the cyclo-filter technology is the most optimum choice among the others.
Mishra and Rani [41] presented a framework with the additive ratio assessment (ARAS) approach under q-ROFS with information measures for the evaluation of recycling partners. Mishra et al. [42] proposed a new entropy and divergence measures-based decision-making method for evaluating an appropriate solid waste disposal method from a q-ROF perspective. Zolfani et al. [43] extended the “VlseKriterijumska optimizacija I kompromisno resenje in Serbian (VIKOR)” approach to the q-ROF context for the rational selection of a country regarding a supportive global supply chain strategy. Deveci et al. [44] introduced a hybrid decision-making framework with the MEREC, the SWARA, and the WISP models for prioritizing sustainable public transportation in the metaverse under the q-ROFS context. Krishankumar et al. [45] presented a model under q-ROFS for healthcare waste treatment assessment by extending the “evaluation-based on distance from average solution (EDAS)” approach. Zhang et al. [46] introduced a q-ROF multiple criteria decision-making methodology from imprecise and vagueness perspectives and presented its application on two numerical examples of open datasets. Xin et al. [47] designed an innovative framework based on the SWARA technique and the Complex Proportional Assessment (COPRAS) approach to evaluate the challenges that may arise for supply chain 4.0 in the q-ROFSs setting. Krishankumar et al. [48] prepared a framework with SWOT and a regret-comprehensive approach for the rational selection of IoT service providers for monitoring pollution in a smart city. Bai et al. [49] developed a new decision-making methodology to address the decision problem related to the risk in supply chains of the manufacturing industry by combining the SWARA and a combined compromise solution (CoCoSo) methodology for q-ROF data.
Work from [50] evaluated the IoT risks for supply chains by utilizing SWARA and ARAS under the q-ROFS context. Entropy-based MULTIMOORA was put forward [51] to evaluate the critical success factors of implementing blockchain technology in supply chains under the q-ROFS context. Zhu et al. [52] gave a novel decision framework by extending entropy, rank sum, and ARAS in the q-ROFS context to evaluate the critical success factors for dynamic enterprise risk management in varied-sized enterprises with small and medium scales. Yang et al. [53] put forward AHP and partitioned Bonferroni mean with q-ROFS data for low-carbon fuel selection for sustainable growth and development. Kausar et al. [54] presented CODAS under the q-ROFS context for innovative diagnosis of cancer. Krishankumar and Ecer [55] prepared an integrated CRADIS approach with q-ROFS for IoT service provider evaluation toward sustainable transportation applications. Seker et al. [56] extended COPRAS to interval-based q-ROFS for risk assessment in the context of the COVID-19 situation. Qiyas et al. [57] put forward the Dombi fusion operator under the Sine-hyperbolic q-ROFS context for a hospital case study for postcare for cerebrovascular disease. Xu [58] assessed bike-sharing suppliers by extending the Einstein operator and TOPSIS for an interval-valued q-ROFS context.

2.3. Insights

Based on the review presented above, it can be noted that (i) in terms of the relationships among different previous studies, all models of Section 2.1 perform decision-making for appropriate location/site selection of biomass; (ii) the relationship with the models in Section 2.2 is the preference information (q-Rung ortho-pair fuzzy set), which is adopted by different models to solve different MCDM problems; (iii) the differences that readers can infer from Section 2.1 are in terms of the methodology proposed by different researchers for selection and the case example that is being focused. Evidently, from [8,9,10,11,12,13,14,15], the claim can be witnessed, as researchers propose mathematical models in the form of multiobjective programming models, or MCDM models, with case application in specific provinces of a country; (iv) similarly, the differences that readers could infer from Section 2.2 are in terms of different methods for weight calculation, rank estimation, and MCDM applications, which can be observed from [20,21,22,23,24,25,26,27,28,29,30,31,32,33,34,35,36,37,38,39,40,41,42,43,44]. Apart from these relationships and differences, it can be seen that the process of selecting a suitable location/site for biomass production is an interesting decision problem that is driven by multiple criteria, and the generalized fuzzy set plays an important role in the MCDM process by effectively modeling uncertainty.

3. Methodology

This section firstly presents some rudimentary ideas and then proposes a new q-ROF decision methodology.

3.1. Preliminaries

Some rudimentary ideas pertaining to the development of the integrated approach is provided below:
Definition 1 [16].
T X is a finite set, and T N T X is also finite. Then, T N ¯ is an IFS in T X , such that
T N ¯ = t x , μ T N ¯ t x , υ T N ¯ t x | t x ϵ T X
where   μ T N ¯ t x , υ T N ¯ t x , and π T N ¯ t x = 1 μ T N ¯ t x + υ T N ¯ t x , μ T N ¯ t x ,   υ T N ¯ t x are the membership, nonmembership, and hesitancy grades,   μ T N ¯ t x , υ T N ¯ t x , and π T N ¯ t x are considered in the unit interval, and μ T N ¯ t x + υ T N ¯ t x 1 .
Definition 2 ([19]).
T X is as before and t x T X . Then, the q-ROFS Q R on T X is considered as
Q R = t x , μ Q R t x , υ Q R t x | t x ϵ T X
where   μ Q R t x   a n d   υ Q R t x are in the unit interval describing grades of membership and nonmembership.   π Q R t x is the hesitancy degree. Furthermore, 0 μ Q R t x q + υ Q R t x q 1 with q 1 . When q = 1 , we obtain IFS [16], and when q = 2 , we obtain PFS [17].
Note 1: From now, Q R = μ α , υ α   α = 1 , 2 , , τ is termed as a “q-Rung orthopair fuzzy number (q-ROFN)”. Collectively, they form q-ROFS.
Definition 3.
Q R 1 and Q R 2 are two qROFN. Arithmetic operations with qROFN are given by
Q R 1 Q R 2 = 1 1 μ 1 q 1 μ 2 q 1 / q , υ 1 υ 2
Q R 1 η = μ 1 η , 1 1 υ 1 q η 1 / q ,   η > 0
η Q R 2 = 1 1 μ 2 q η 1 / q , υ 2 η ,   η > 0
Q R 1 Q R 2 = μ 1 μ 2 , 1 1 υ 1 q 1 υ 2 q 1 / q
S Q R 2 = μ 2 q υ 2 q
A Q R 2 = μ 2 q + υ 2 q
Equations (3)–(8) denote the sum, power, scalar multiplication, multiplication, score, and accuracy functions, respectively.

3.2. Weights of Experts and Criteria

The weight component is a crucial parameter to be determined in the MCDM problems. Experts and criteria have a diverse nature that makes the decision problem interesting, and estimating the weights of these two entities becomes important for rational decision-making. Works from Kao [59] and Koksalmis and Kabak [60] clarify the significance of weight calculation for criteria and experts. From these works, it is inferred that the direct assignment of weights causes subjectivity and biases, which affects the decision process.
Driven by these studies, researchers explored the methodical aspect of weight estimation. Broadly, weights are determined via partial a priori information or fully unknown information. In the former context, some information about criteria/experts is needed, and this information is provided as a constraint to the optimization model for weight assessment [61]. The latter context deals with common methods such as the analytical hierarchy process [62], simple arithmetic weights [63], entropy measures [64], stepwise weighting [65], and similar methods. Compared to the latter approaches, in the former, there is an overhead of including additional information about each entity that may not be available in many practical decision problems. As a result, in the present study, the authors considered the latter context.
Common methods in the latter context determine weights objectively but cannot capture the interactions among parameters, and the variability in the choices/views is also not well modeled. Driven by the claim, in this section, we put forward a new variance-CRITIC integration for determining the weights of experts and criteria, respectively, by considerably mitigating the issues claimed. Notably, the variance measure supports understanding the variability in the distribution of preferences and captures the hesitation of experts during the choice/views-sharing process. Furthermore, the CRITIC approach objectively determines criteria weights by determining the inter-relationship among criteria and calculating the significance value of each criterion.
Steps for calculating weights of experts and criteria are provided below:
Step 1: P experts form O × N matrices by providing rating in the form of Likert scale values. O biomass production locations are rated based on N criteria, and, based on tabular values, the qualitative terms are converted to q-ROFNs.
Step 2: Apply Equation (8) for determining the accuracy measure of the rating information, which yields P accuracy matrices of O × N .
Step 3: Determine variance measure for each matrix by adopting Equation (9). A vector of 1 × P is obtained.
σ l 2 = j = 1 N     l = 1 P A Q R i j A Q R i ¯ 2 P 1
where A Q R l ¯ is the mean value of the accuracy measure.
Step 4: Apply Equation (10) to determine the weights of experts, which is a vector of 1 × P order.
λ l = σ l 2 l = 1 P σ l 2
where λ l is the weight of any expert l .
Step 5: Form opinion vectors of 1 × N order from P experts by collecting qualitative ratings that are further transformed to q-ROFN based on tabular values.
Step 6: Utilize Equation (8) to determine the accuracy of the values from Step 5 to form an accuracy matrix of P × N order.
Step 7: Determine the inter-relationship among criteria by using Equation (11), which yields a vector of 1 × P order.
ξ j 1 j 2 = l = 1 P A Q R l j A Q R j ¯ j 1 . A Q R l j A Q R j ¯ j 2 l = 1 P A Q R l j A Q R j ¯ j 1 2 . l = 1 P A Q R l j A Q R j ¯ j 2 2
where A Q R j ¯ is the mean value of accuracy.
Step 8: Calculate the significance value by considering interaction values from Step 7 and applying Equation (12).
S j = σ j 2 . j 2 ξ j 1 j 2
where σ j 2 is the variance measure of criterion j .
Step 9: Normalize the values from Step 8 to determine the weight vector of criteria that is of order 1 × N . Equation (13) is applied for the purpose.
w j = S j j S j
where w j is the criterion j t h weight. It may be noted that the weights of experts and criteria are in the unit interval, and they add to one. These weights are further used in the next section for ranking locations for biomass production.

3.3. Ranking Algorithm

The ranking is a potential step in the decision process that determines the rank values of each biomass production location and supports ordering the locations to aid policymakers and experts in hosting their project plan. As can be seen, alternative locations are diversely rated by experts based on competing criteria, and the ranking algorithm determines a suitable location from the candidate locations by considering the trade-offs among criteria.
CoCoSo [66] is one such ranking approach that aims to order alternative locations based on rating information from experts over diverse criteria. The main principle of the CoCoSo approach is the compromise solution theory [67], which closely resembles human-driven decision-making. From the CoCoSo formulation, it is clear that the approach (i) is simple and elegant; (ii) follows a compromise solution that mimics a human-driven decision process; (iii) considers three dimensions of compromise solution space viz. sum operator-, minimum operator-, and maximum operator-based rank values for locations.
Driven by these features, in this section, we utilize the CoCoSo formulation for presenting a rank algorithm with q-ROFNs.
Step 1: Collect preference data in the qualitative manner from experts to form P matrices of O × N that are transformed to their respective q-ROFNs. These data are considered from Section 3.2, and the weight vectors from Section 3.2 are considered in this section for rank determination.
Step 2: Apply Equation (14) to determine the aggregated preferences based on the data from Step 1.
Q R i j = l = 1 P μ i j λ l , l = 1 P υ i j λ l
where λ l is the weight of expert l . It can be noted that the values that come out of Equation (14) are in the q-ROFN form. As a result, the aggregated preference information is given as input to the next step.
Step 3: Use Equations (4) and (5) to determine the power value and scale multiplication value of each q-ROFN by considering the criteria weight vectors from Section 3.2 and aggregated q-ROFNs from Step 2. Based on the formulation, it is clear that q-ROFNs are obtained from this step and are fed to the forthcoming steps. Two matrices of the O × N order are generated.
Step 4: Apply Equations (15)–(17) to calculate the combined compromise values associated with each alternative location by considering sum, minimum, and maximum operators. Specifically, the normalized compromise values are determined via this equation that yields vectors of the 1 × O order.
T i 1 = j = 1 N A Q R i j 1 + A Q R i j 2 i = 1 O A Q R i j 1 + A Q R i j 2
T i 2 = j = 1 N A Q R i j 1 m i n i A Q R i j 1 + A Q R i j 2 m i n i A Q R i j 2
T i 3 = j = 1 N θ A Q R i j 1 + 1 θ A Q R i j 2 θ m a x A Q R i j 1 + 1 θ m a x A Q R i j 2
where θ is the strategy value in the range of 0 to 1, min . is the minimum operator, max . is the maximum operator, A . is the accuracy value.
Step 5: Rank values of each location alternative for biomass production are determined by Equation (18), which is a linear combination of vector values from Step 4.
T i = T i 1 . T i 2 . T i 3 1 / 3 + T i 1 + T i 2 + T i 3 3
where T i is the rank value of location alternative i . The alternative locations are ordered based on the rank values from Equation (18), and the higher the value, the higher the preference. So, the locations are arranged in nonincreasing order of their rank values.
The working model of the proposed framework is shown in Figure 1. From Figure 1, it is clear that the weights and ranking are methodically determined to reduce subjectivity and inaccuracies in the decision process. Additionally, the working model clarifies the flow of the framework which would aid in ease of understanding. Initially, experts provide their rating in the form of a Likert scale that is converted to q-ROFNs, and decision and weight matrices are formed. Later, the weights of experts and criteria are determined by the procedure proposed in Section 3.2, which presents variance and CRITIC methods for weight determination. These weight vectors, along with the decision matrices, are fed to the developed ranking model for determining the rank values of alternative locations for biomass production. The rank values are obtained for each candidate that could be used for ordering the locations.

4. Case Example

Recent reports from the Ministry of New and Renewable Energy indicate the promising utilization of biomass energy for satisfying domestic demand. It is estimated that India achieved the 10 GW target of biomass energy from its installed capacities as per the Mongabay.com web source (dated: 14 November 2022). Different states in India contribute to bioenergy production in different ways and rates. Tamil Nadu (TN) is one such state that makes a considerable contribution to biomass energy with close to 864 MW. It can be observed that TN is among the top five states in biomass production, following states such as Chhattisgarh, Madhya Pradesh, Gujarat, and Rajasthan as per mnre.gov.in (dated: 14 November 2022). Popular places in TN that pose biomass energy capacities are Hosur, Dharmapuri, Kongu, Kancheepuram, Mettupalayam, and similar places (source: eai.in, dated: 14 November 2022).
With the growing population, the nation is working on strategies and plans to develop modern technologies to make proper utilization of clean energy, which could not only feed the demand from people but also combat the acute change in climate and adverse effects of carbon footprint. Because of our sheer commitment to reduce carbon trace, India pledges an update of 45% reduction by 2030 (source: downtoearth.org.in, dated: 14 November 2022), and such contributions to clean energy production will move the nation one step closer to the ambitious goal. Works from Natarajan et al. [68] show that TN has good scope and a promising future in biomass-based clean energy production, and with the state being on top of the table in terms of clean energy production (source: investingintamilnadu.com, dated: 14 November 2022), the focus on biomass and other forms of sources are gaining attraction.
To expand the nation’s clean energy production, TN paves its way by generating 14 GW of power, which is close to 17.2% of India’s net power potential. Additional production plans via biomass will support the thirsty need for energy by the people of the country, and in this line, a location selection problem for biomass production is put forward in this section, which would certainly enhance the clean energy generation within the state and eventually for the country. The problem of site/location selection involves multiple factors/criteria that are competing and conflicting with one another. As a result, the problem is seen as an MCDM problem, where different experts rate diverse locations based on multiple competing criteria. The prime focus is to select a viable location for biomass production rationally. For this reason, a committee of three experts is constituted who have expertise in sustainability and renewable sources of energy with specific attention toward biomass-driven energy generation. These experts have six to seven years of experience in the energy domain and have worked on projects related to clean energies. A senior professor from the sustainable energy division, financial and audit personnel with expertise in energy economics, and an engineer from a startup energy firm constitute the committee. These experts search different places within TN and identify seven locations, which are further finalized to five potential locations based on prescreening of the sites. Different criteria associated with location selection are collected and noted based on literature studies, research, and discussion, which are then scored by experts to obtain a final list of nine potential criteria for rating the five locations. The nine criteria include socio-economic benefits, land use, jobs, public safety, distance from the residential zone, ecofriendliness, air/water pollution, security risk, and total cost. Typically, the last three criteria relate to cost type and the remaining criteria relate to benefits.
For simplicity, we to refer the five locations as I 1 , I 2 ,…, I 5 ; nine criteria as V 1 , V 2 ,…, V 9 ; and the experts in the committee as O 1 , O 2 , and O 3 , respectively. The procedure for rational selection of location is presented below in a stepwise manner for effective implementation purposes.
Step 1: Decision matrices are formed based on the rating given by three experts on five locations with respect to nine criteria. Qualitative grading is conducted via a Likert scale that is further converted to q-ROFN based on tabular values in Table 1 and Table 2.
Step 2: Calculate weights of experts by considering data from Step 1 and by applying the procedure from Section 3.2.
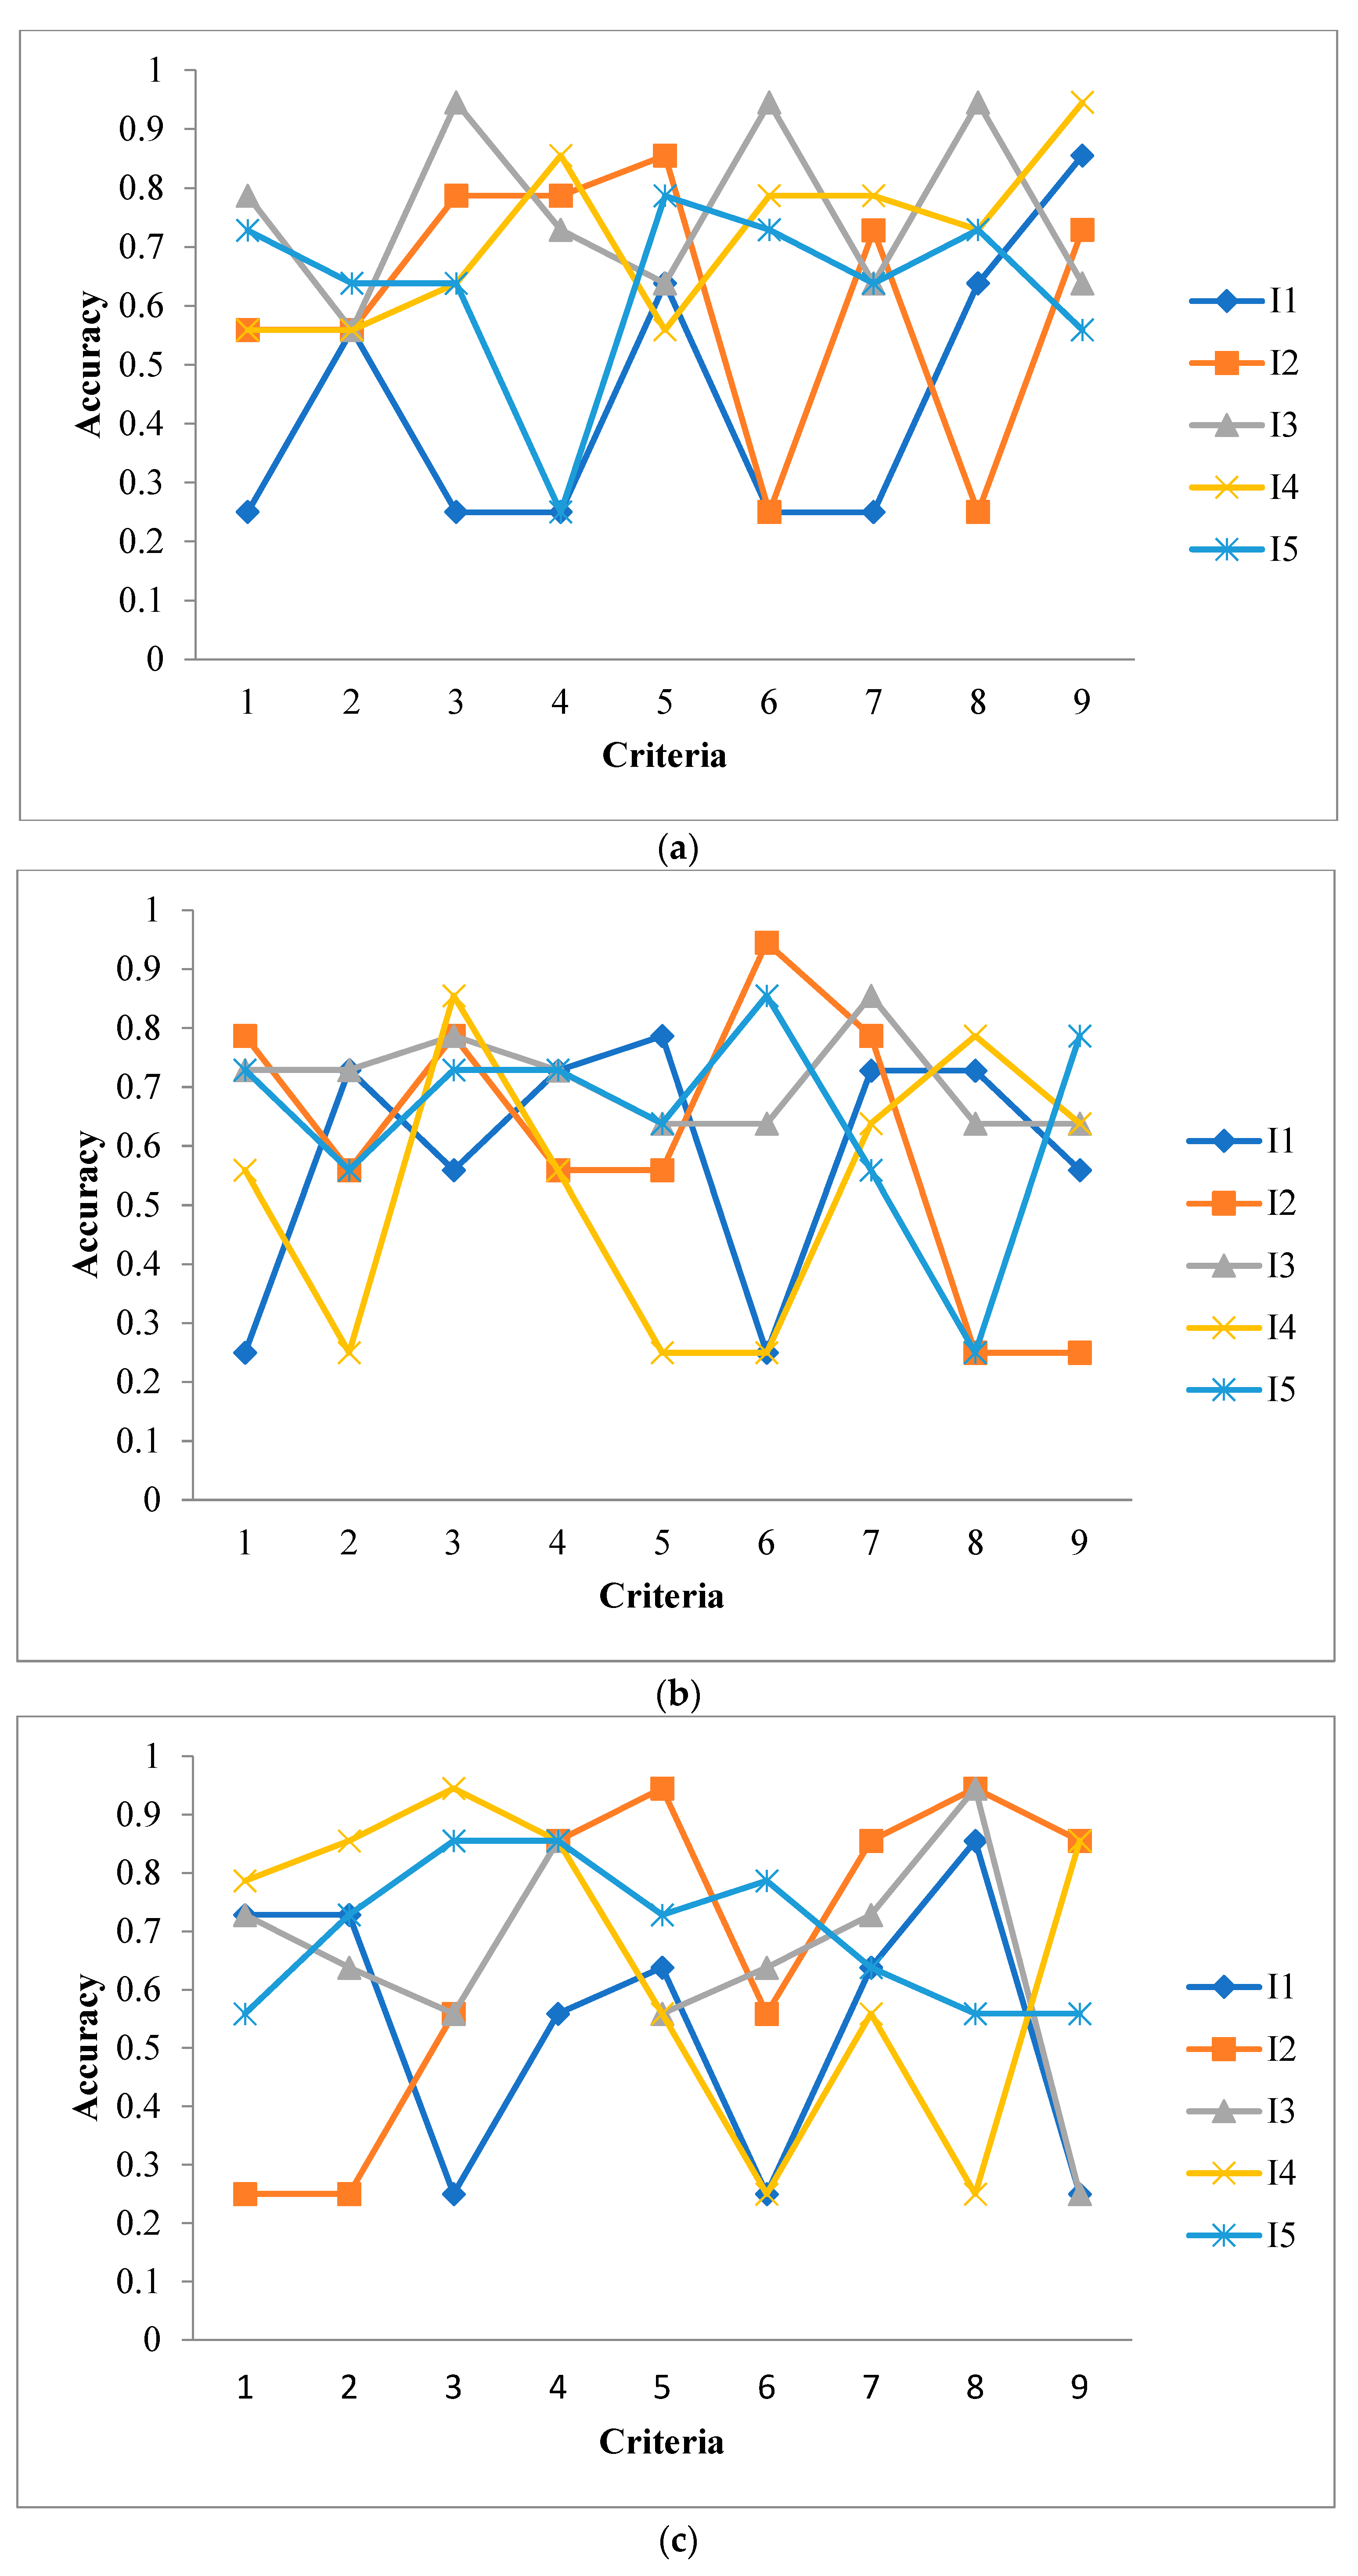
Figure 2 shows the accuracy values determined for the preference data from each expert P 1 to P 3 , which is fed to Equation (9) for determining the variance followed by normalization of the variance vector to obtain weight vectors of experts as 0.35, 0.29, and 0.36, respectively.
Step 3: Obtain the opinions from three experts on each criterion to determine the weights of the criteria by considering the procedure given in Section 3.2 (Table 3).
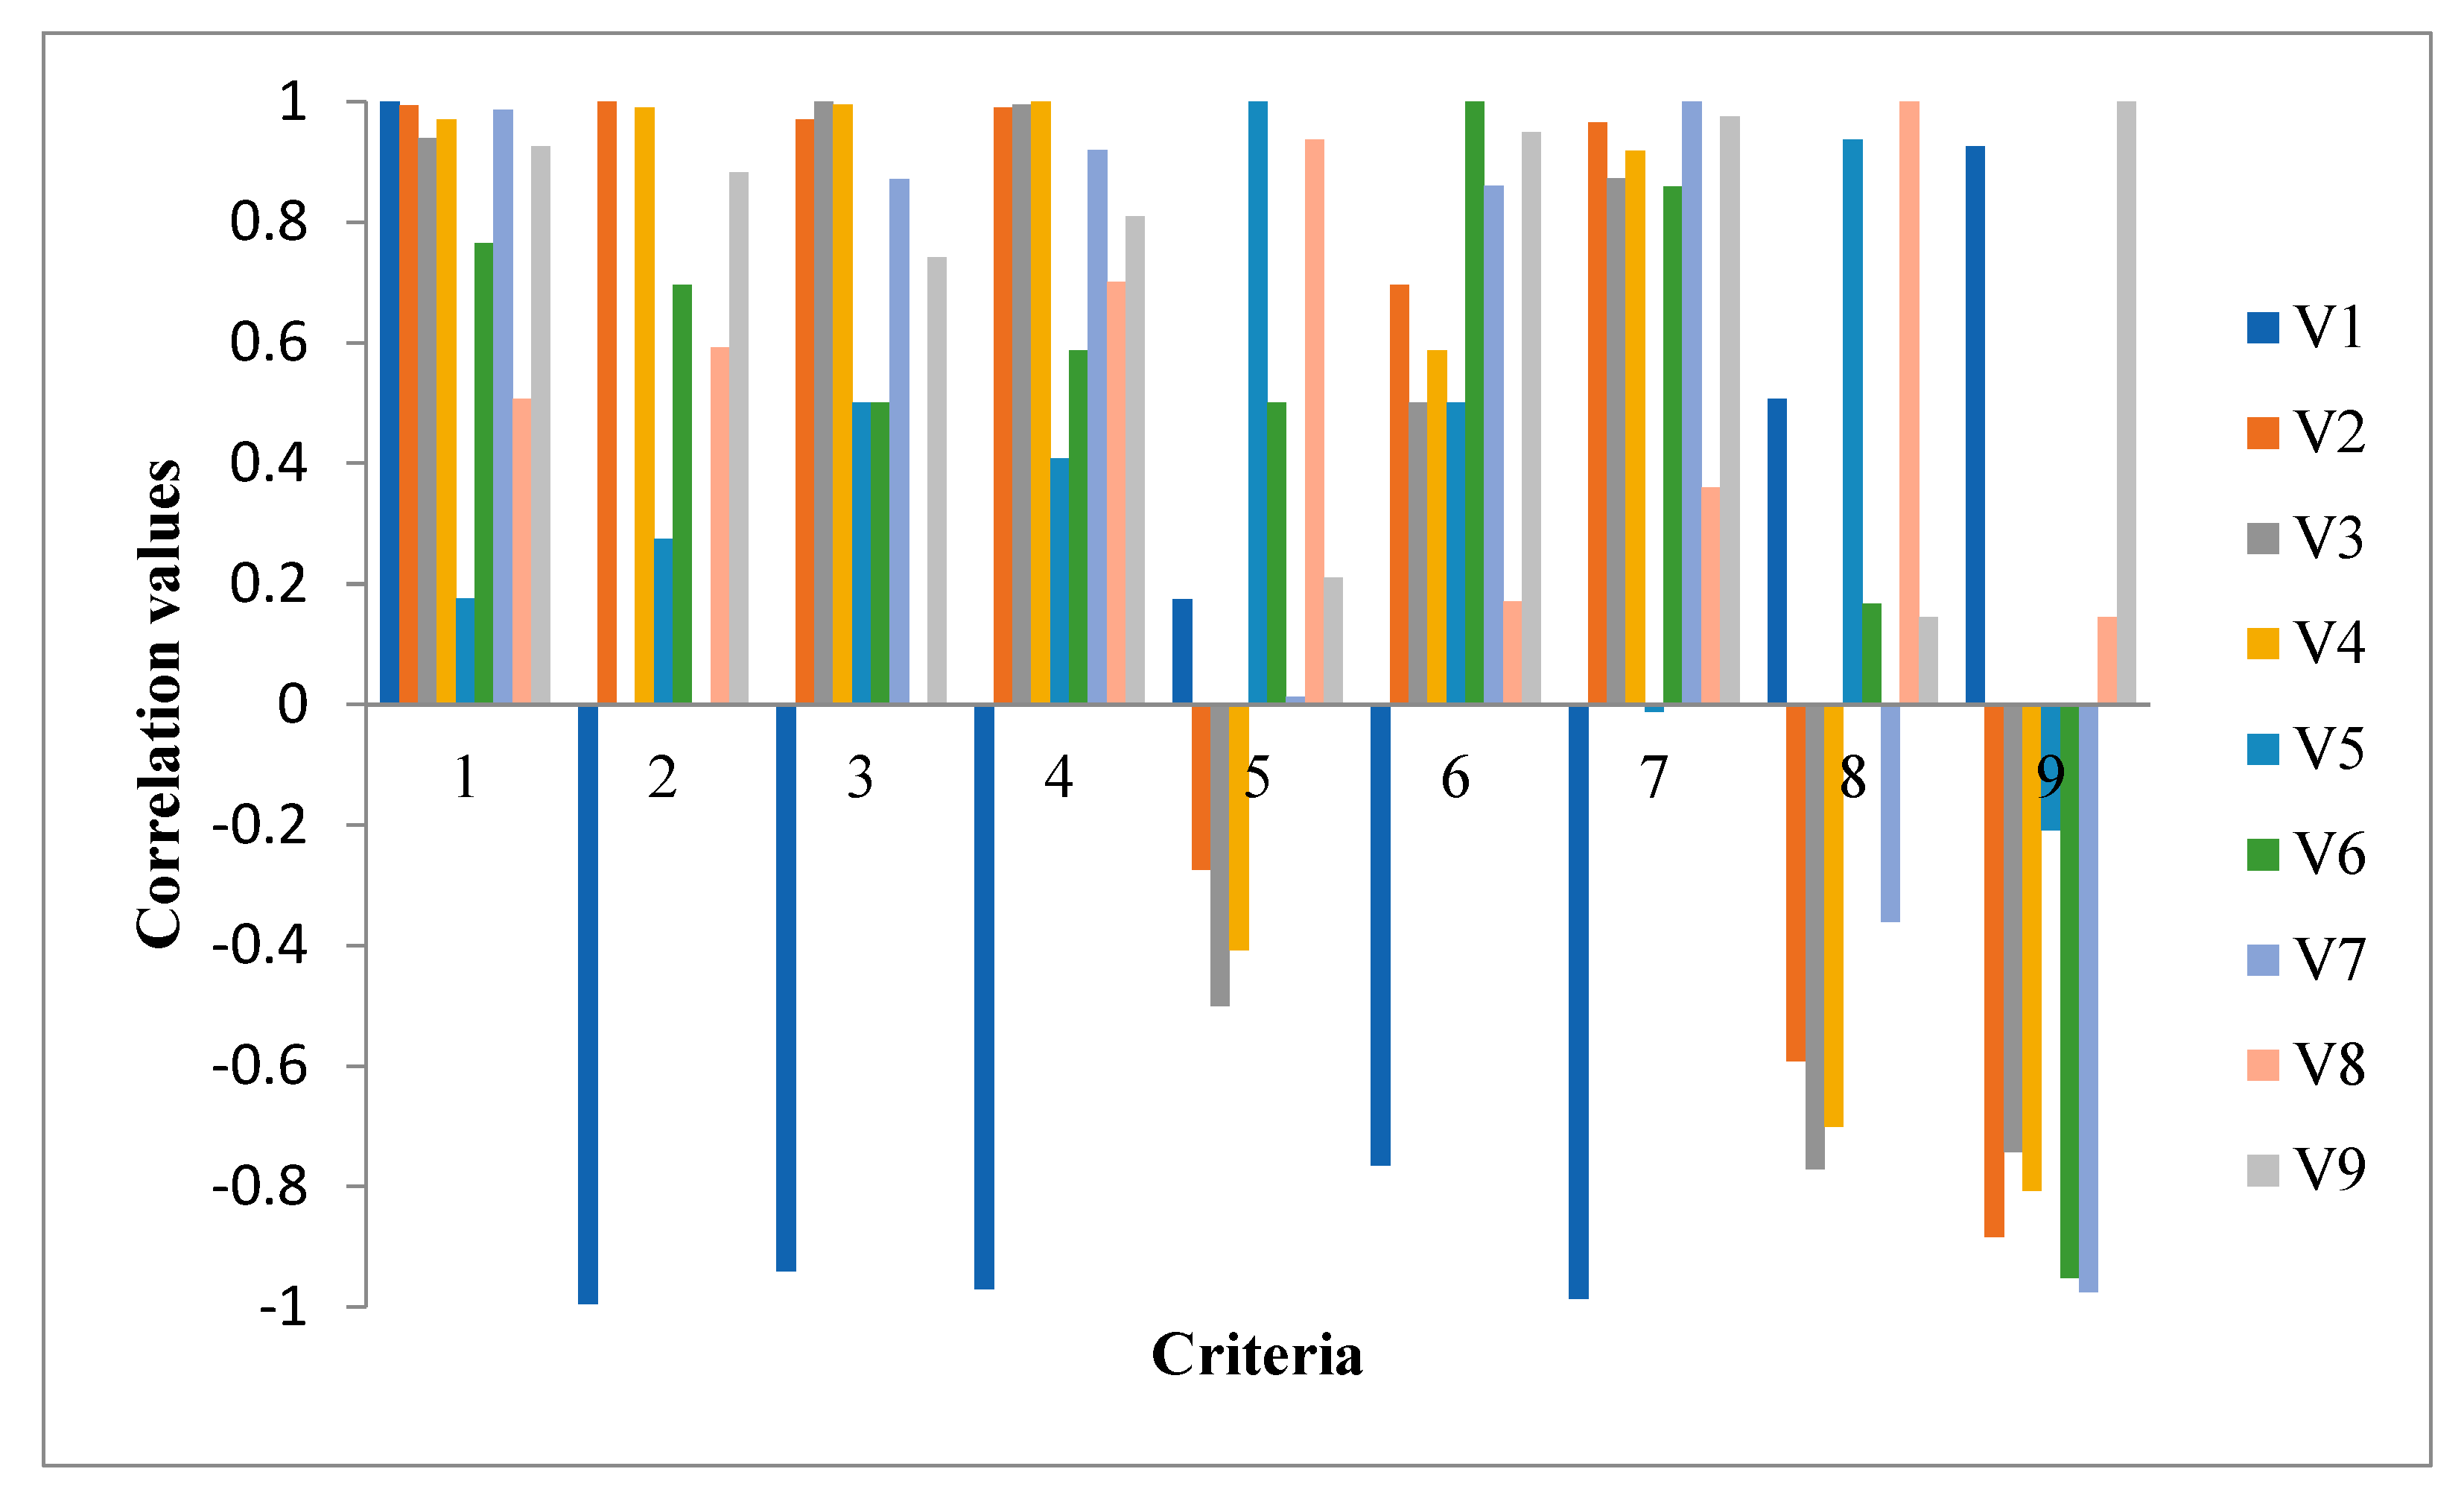
Equation (11) is used to calculate the inter-relationship among criteria that are depicted in Figure 3. By applying Equations (12) and (13), weights of criteria are determined based on the correlation and variance measures, and the value is given as 0.022, 0.043, 0.091, 0.30, 0.015, 0.009, 0.24, 0.20, and 0.065, respectively. The weight vectors of criteria and experts are fed as inputs to the upcoming step for rank determination.
Step 4: Rank the locations by considering data from Step 1, weights from Step 2 and Step 3, and procedure given in Section 3.3.
Equations (15)–(18) are applied to determine the parameters of the proposed ranking algorithm with CoCoSo formulation, and the values are shown in Table 4. Typically, from the formulation, it is inferred that the sum, minimum, and maximum operators are utilized for determining the compromise solutions that are finally combined to form a net rank of locations. Based on T i 1 , T i 2 , and T i 3 values, the net rank T i is determined for each location. From the T i values, the ordering is determined as I 2 I 3 > I 4 > I 1 > I 5 , and the viable options for biomass location to generate clean energy are locations I 2 and I 3 . Though, from the values, I 2 is highly preferred, it can be seen that the difference between rank values of I 2 and I 3 is minimum, and hence, both the locations are viable for production. Further, in the next section, sensitivity analysis is presented with respect to weights and strategy values.

5. Sensitivity Analysis and Comparative Discussion

This section showcases the efficacy of the proposed model in terms of robustness and consistency from the methodical aspect, and certain novel innovations of the model can be inferred from the application aspect. To realize the robustness of the model, we perform inter- as well as intrasensitivity analysis by altering the weights of criteria and strategy values. The strategy values are altered stepwise from 0.1 to 0.9 for two criteria weight cases viz. biased and unbiased cases. In the biased case, the weight vector determined by the procedure in Section 3.2 is considered, and in the unbiased context, equal weights are assigned to each criterion, and the rank values are determined based on the ranking algorithm.
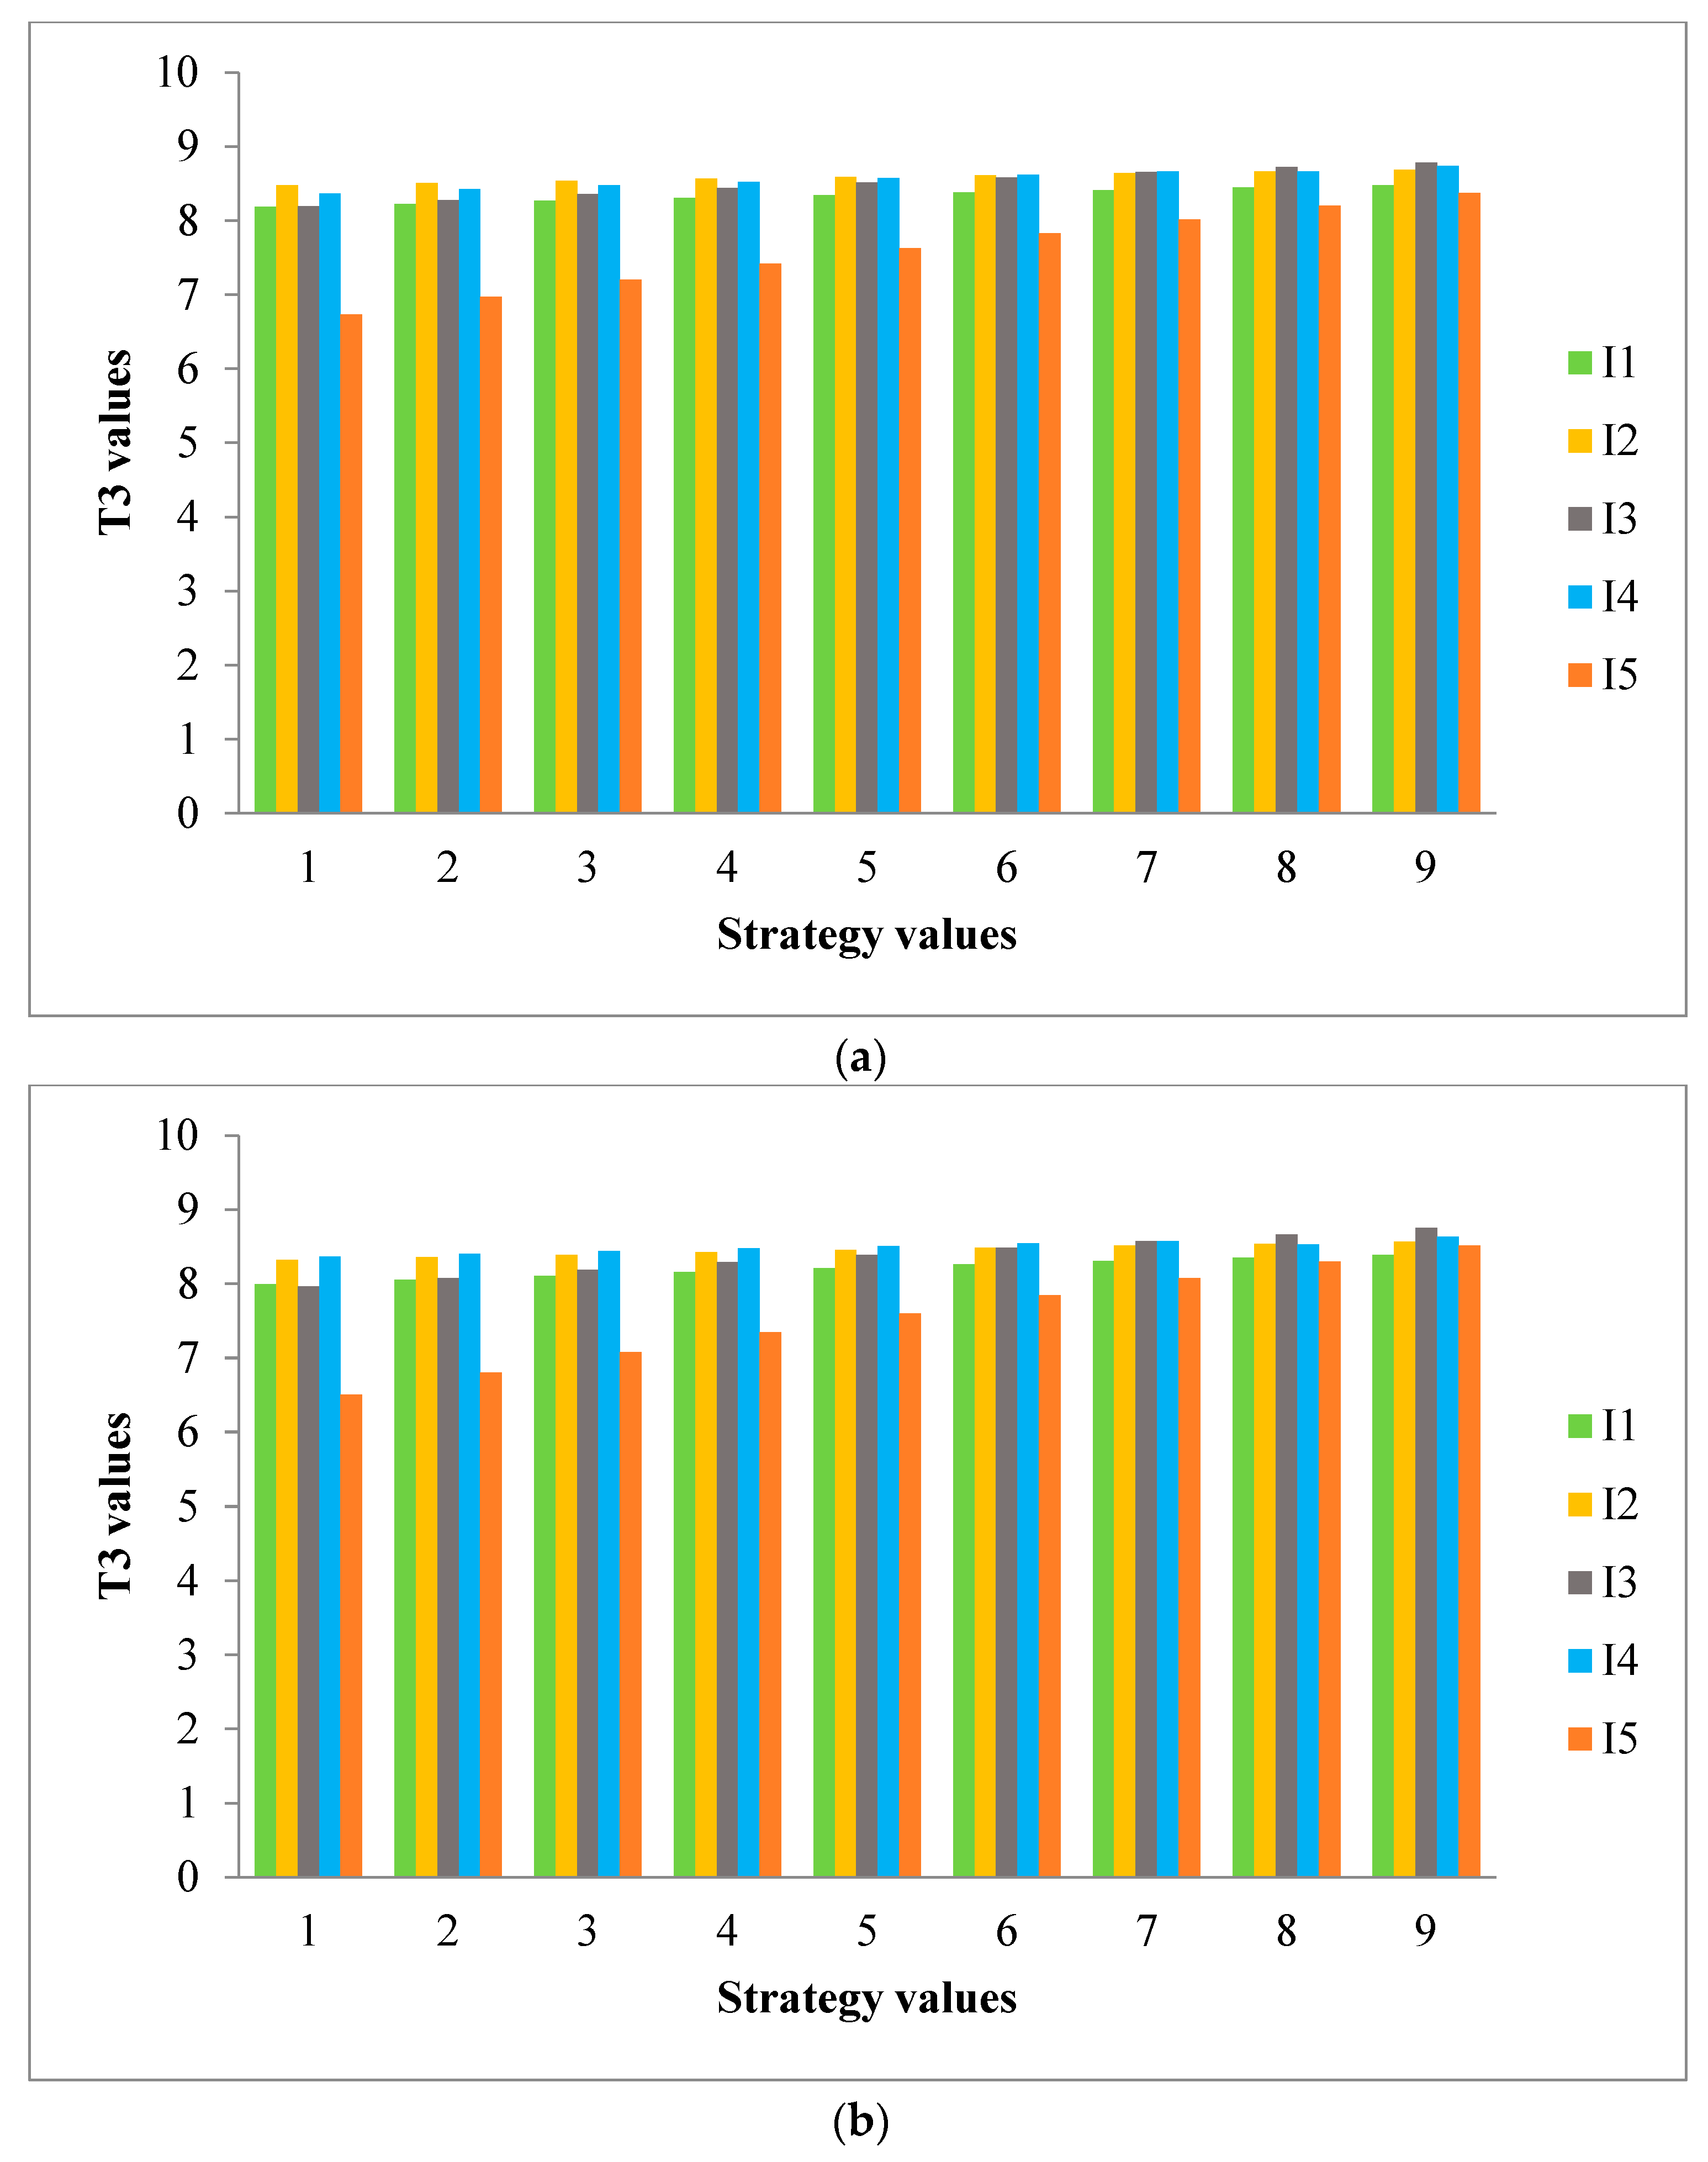
From the formulation, it can be seen that there is a focus on sum, minimum, and maximum operators, which yield compromise vectors for each location that are finally combined to realize the net ranking of the considered alternative locations for biomass production. Figure 4 clearly shows that though there is a change in the rank values, the ordering does not change and remains unaltered even after adequate changes are expressed for the strategy values. Intuitively, it can be noted that each parameter form has a certain level of influence on the net ranking of locations, and to realize the effect of maximum operator on the ordering of locations, a strategy-driven analysis is presented in the formulation that reflects the attitudinal behavior of experts in determining the rank values. Typically, values less than 0.5 are considered to be pessimistic, and those greater than 0.5 are considered to be optimistic, with 0.5 being the neutral state of experts. The maximum value from the scalar multiplied form and the power form of q-ROFNs are varied systematically to realize their effects on the ordering of locations. As an extension to the formulation, we can also apply strategy values to other operators and/or to the net ranking to determine the role of the attitudinal behavior of experts in rank estimation. With the proposed formulation, the net ranking is also unaltered, though there are changes in rank values even after criteria and strategy values are altered. In this line of thought, it can also be observed that the maximum operator reveals the maximum preference level assigned over a criterion for any arbitrary location alternative, thereby indicating the maximum spread of solution space for the criteria set, which can be effectively demonstrated with the experts’ strategy values that considerably vary the impact on scalar multiplication operation, and power operation has driven weighted preferences.
Furthermore, the proposed model is compared with other biolocation selection models such as those by Jayarathna et al. [69], Atici et al. [18], Guler et al. [16], Zhao et al. [19], and Jeong and Rameriz-Gomes [7] for realizing the efficacy of the proposed framework from the application aspect (Table 5).
Some novelties/innovations of the developed model are:
  • q-ROFN is the preferred style utilized by the framework to ease the process of preference elicitation and offer flexibility to experts to express their opinions in three degrees viz. membership, hesitancy, and nonmembership. Initially, a qualitative Likert scale rating is obtained from the expert team, which is later converted to the respective q-ROFNs with the view of mitigating subjective randomness. Unlike the other models, the proposed model could handle uncertainty effectively with the help of the factor q , which enables the broadening and shrinking of the preference window as required, and also model uncertainty from three dimensions, which is lacking in other extant models.
  • Further, the developed model reduces human intervention by methodically calculating parameters such as weights of experts, weights of criteria, and rank values of alternative locations, which minimizes the inaccuracies, subjectivity, and biases in the decision process.
  • Additionally, compared to the extant models, in the proposed model, criteria interactions are captured effectively along with the variability in the distribution of preferences, which mimics the hesitancy behavior of experts in the decision process. Such features enable the rational selection of locations for biomass production compared to the counter models.
  • The developed ranking algorithm considers both experts’ and criteria’s weights in its formulation, which is lacking in earlier models. Additionally, the formulation determines multiple compromise solutions via the sum, minimum, and maximum operation forms, which are combined to obtain the net rank values of alternative locations. The formulation is simple and elegant, with a close resemblance to human-driven decision-making that tries to identify solutions with the maximum gain in the solution space by considering alternatives with the maximum utility value that are determined from the scalar multiplied form and the power functions of the rating information.
  • Unlike the extant biomass location selection models, the current model reduces human intervention by calculating decision parameters methodically, which supports a reduction in inaccuracies, biases, and subjectivity.
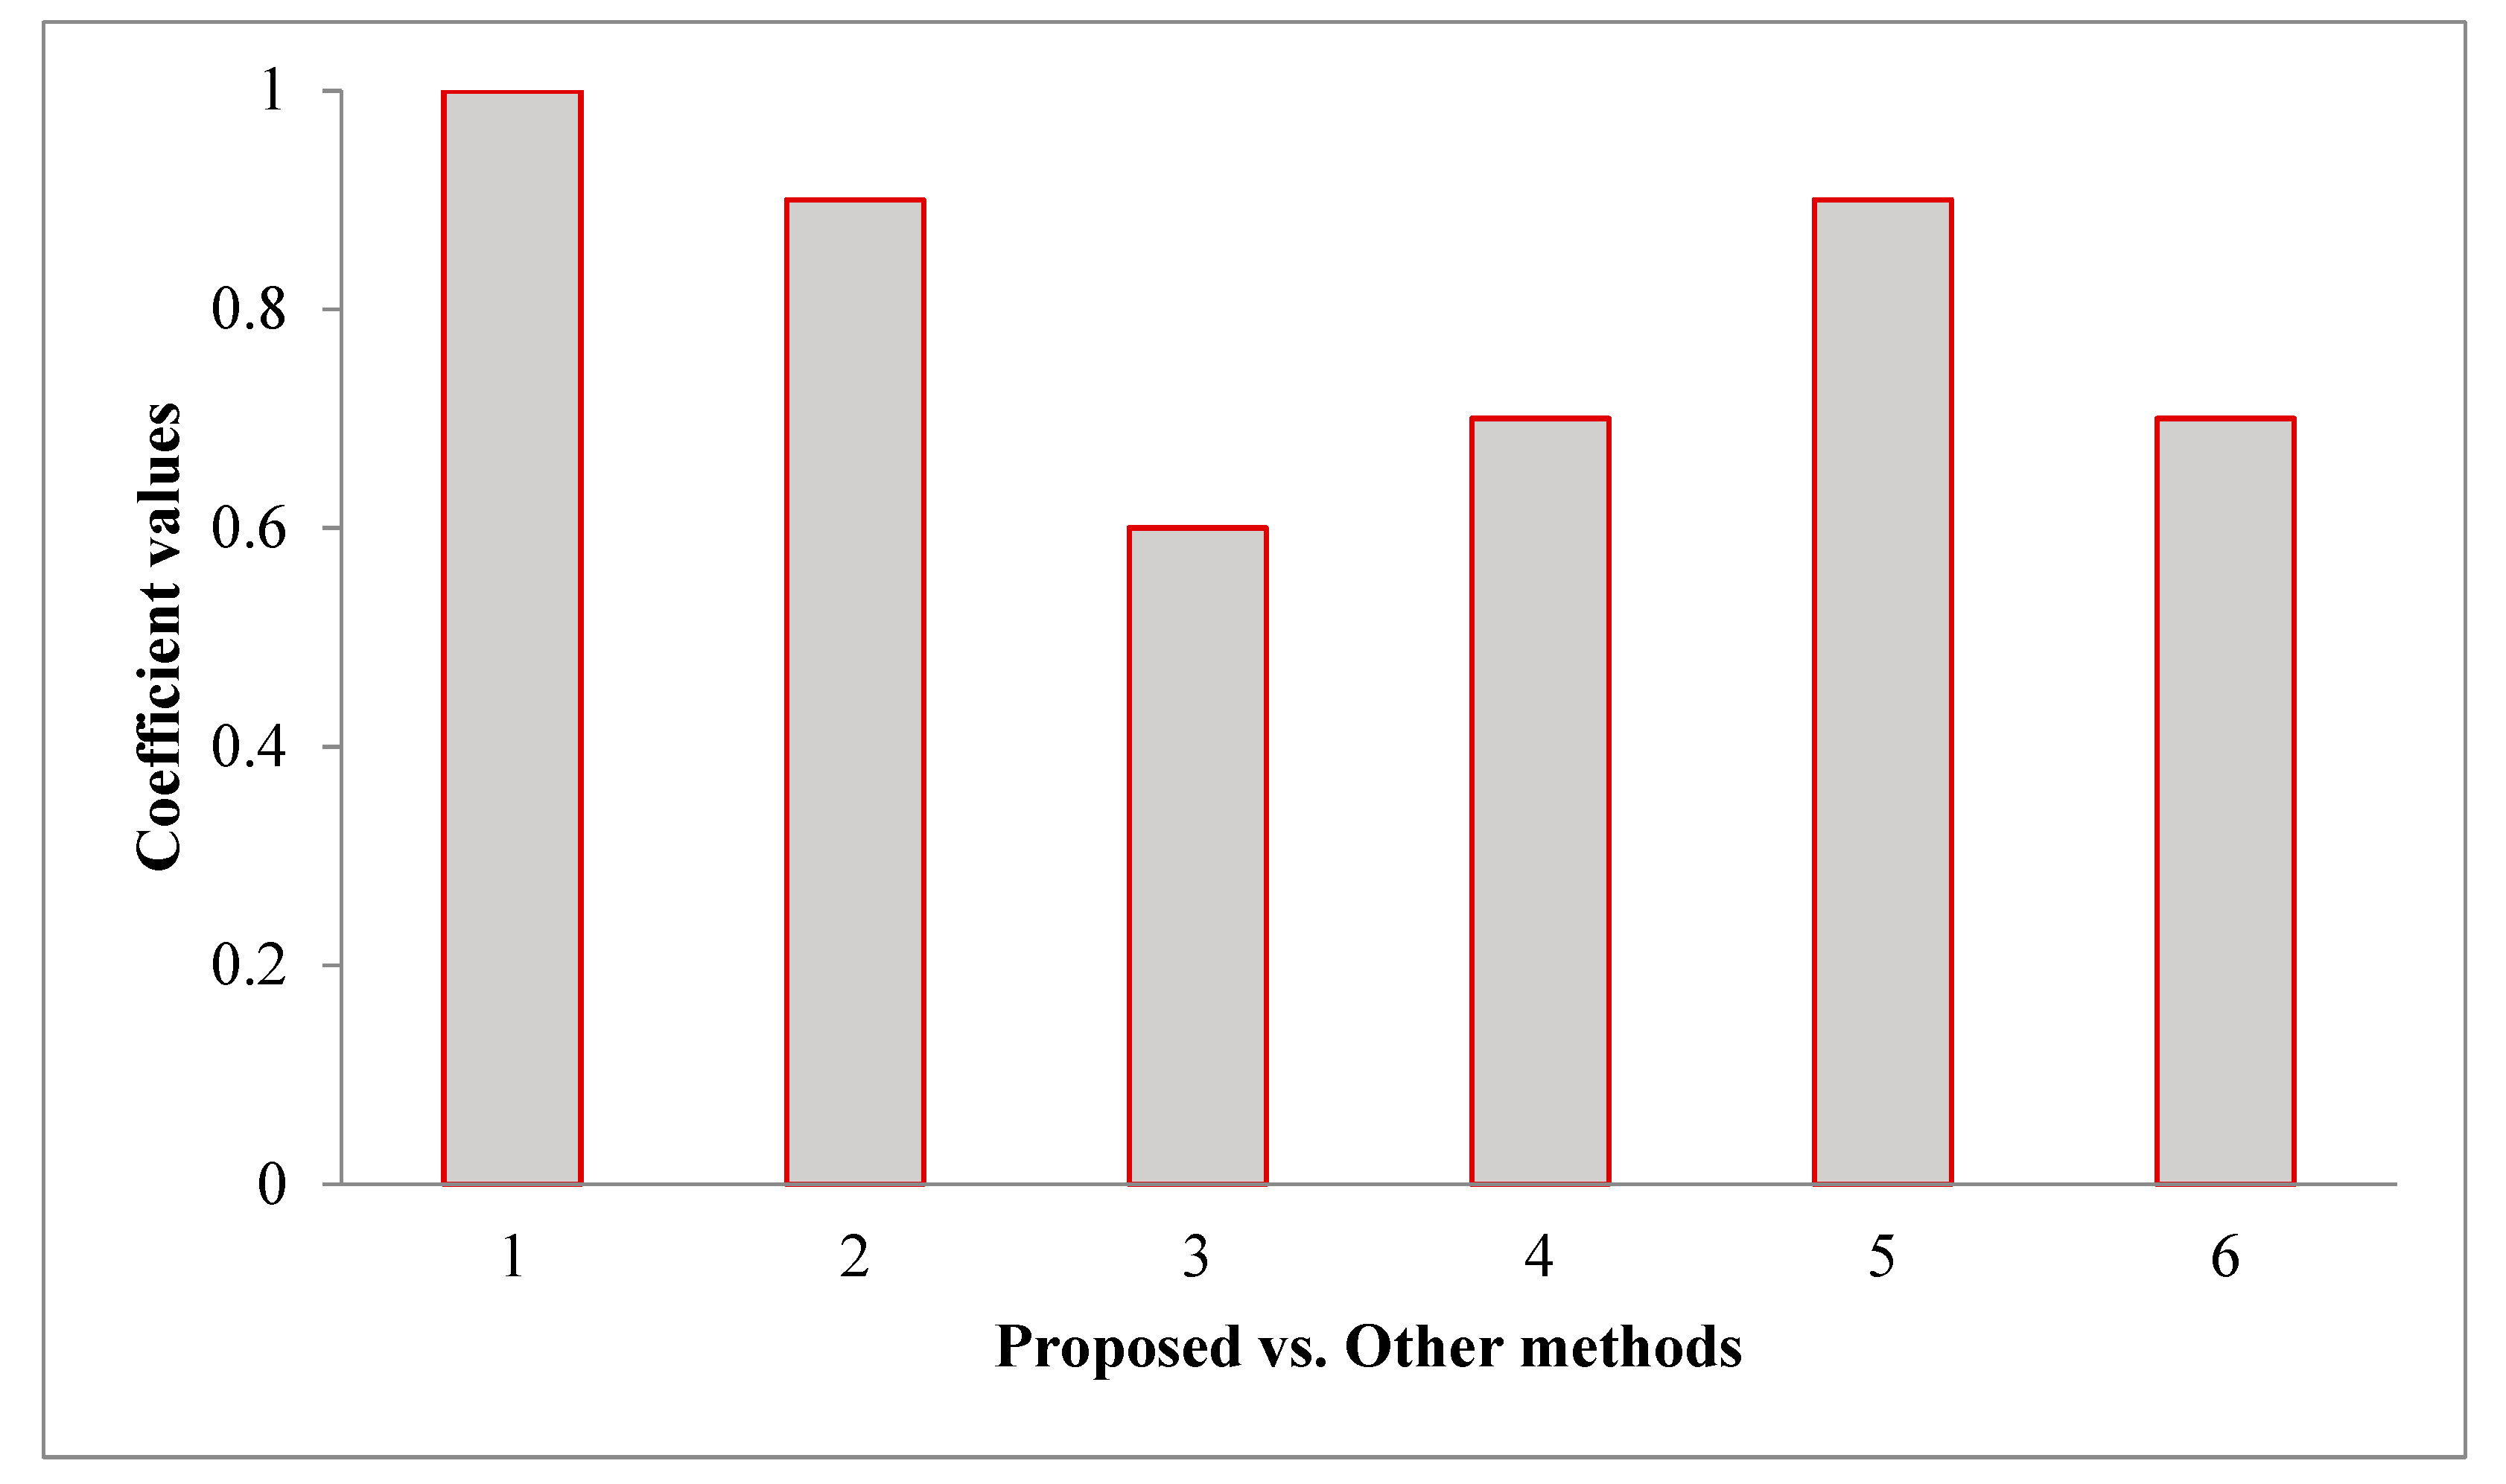
  • Along with the efficacy from the application aspect, we would like to extend the experiment to the methodical aspect as well. For this purpose, recent and relevant q-ROFN-based decision models such as those by Peng et al. [34], Wang et al. [22], Xin et al. [39], Zolfani et al. [35], and Mishra and Rani [33] are compared with the proposed model to realize the consistency effect of the proposed work with other methods. Rank vectors from each method are given to the Spearman correlation method to determine the correlation coefficient, and based on the experiment, we obtained values as 1.0, 0.90, 0.60, 0.70, 0.90, and 0.70, respectively (refer to Figure 5). Hence, it is observed that the proposed model is fairly consistent with the existing models and can rationally order alternative locations.

6. Conclusions

This research model is a valuable addition to the biomass domain that supports the rational selection of locations for biomass production. Human intervention is mitigated sensibly by methodical calculation of decision parameters, which reduces inaccuracies, subjectivity, and biases in the system. A flexible preference style with the notion of reducing subjective randomness is adopted in the proposed model along with effective capturing of experts’ hesitation and criteria interactions. Furthermore, a different compromise solution from the solution space is determined and combined to form the net rank vector of the locations for biomass production.
From the comparative investigation, it is clear that the proposed model is novel and poses merits over other models from the application aspect. Sensitivity analysis from the inter- and intraperspective shows the robustness of the model even after adequate changes are made to the criteria weights and strategy values. Additionally, Spearman rank correlation is performed on rank orders to determine the consistency of the model for others in the methodical aspect. Henceforth, the proposed work has merits from both the application and method aspects.
Some limitations of the model are: (i) partial information on decision parameters cannot be modeled by the present framework; (ii) data are assumed to be complete, which may not be always true, and so unavailable values cannot be handled by the proposed system; and (iii) the nature of criteria is not considered during rank estimation. Apart from the benefits, there are some limitations to be focused on. Certain implications to be noted are: (i) uncertainty is better handled from three degrees with the flexible factor q that could adjust the window promptly for effective preference elicitation; (ii) human intention is reduced by methodically calculating weights and ranks of decision parameters; (iii) experts and users must be trained so that they could effectively utilize the model and attain inferences from the model; (iv) the developed framework is ready to use and customize different decision problems in diverse sustainability/environmental zones based on the data fed to the system; and (v) finally, the model offers support to the experts and policymakers to understand the decision with the help of a mathematical base to the driven decision for the problem at focus.
In the future, the limitations of the proposed system can be addressed. Later, the developed model can be incorporated for diverse applications in the health, education, environment, economics, business, and engineering domains based on the preference data from experts. Additionally, plans are made to experiment with different sets from fuzzy and linguistic versions along with their probabilistic and interval variants. Finally, plans are made to integrate machine learning and recommender system concepts with decision frameworks for performing large-scale decision-making from diverse data sources and networks.

Author Contributions

Methodology, A.R.M.; Validation, F.C.; Formal analysis, R.K., P.R. and K.S.R.; Investigation, A.R.M.; Writing—original draft, R.K.; Writing—review & editing, P.R.; Supervision, K.S.R.; Project administration, F.C. All authors have read and agreed to the published version of the manuscript.

Funding

This research received no external funding.

Institutional Review Board Statement

Not applicable.

Informed Consent Statement

Not applicable.

Data Availability Statement

Not applicable.

Conflicts of Interest

The authors declare no conflict of interest.

Nomenclature

SymbolMeaning
μ Membership grade
υ Nonmembership grade
q Window parameter
π Indeterminacy degree
η Scalar factor
P Number of experts
O Number of locations for biomass
N Number of criteria
i Index for locations
j Index for criteria
l Index for experts
σ 2 Variance value
Q R q-Rung orthopair fuzzy number
λ l Expert weight
ξ j 1 j 2 Correlation measure between j 1 and j 2
w j Weight of criteria
T 1 Sum operation
T 2 Minimum operation
T 3 Maximum operation
T Net rank value

References

  1. Owen, G. What makes climate change adaptation effective? A systematic review of the literature. Glob. Environ. Chang. 2020, 62, 102071. [Google Scholar] [CrossRef]
  2. Pandve, H. Global initiatives to prevent climate change. Indian J. Occup. Environ. Med. 2008, 12, 96–97. [Google Scholar] [CrossRef] [PubMed]
  3. Poizot, P.; Dolhem, F. Clean energy new deal for a sustainable world: From non-CO2 generating energy sources to greener electrochemical storage devices. Energy Environ. Sci. 2011, 4, 2003–2019. [Google Scholar] [CrossRef]
  4. Behera, B.; Jeetendra, A.; Ali, A. Household collection and use of biomass energy sources in South Asia. Energy 2015, 85, 468–480. [Google Scholar] [CrossRef]
  5. Nansaior, A.; Patanothai, A.; Rambo, A.T.; Simaraks, S. Climbing the energy ladder or diversifying energy sources? The continuing importance of household use of biomass energy in urbanizing communities in Northeast Thailand. Biomass Bioenergy 2011, 35, 4180–4418. [Google Scholar] [CrossRef]
  6. Kim, K.H.; Jahan, S.A.; Kabir, E. A review of diseases associated with household air pollution due to the use of biomass fuels. J. Hazard. Mater. 2011, 192, 425–431. [Google Scholar] [CrossRef]
  7. Jeong, J.S.; Ramírez-Gómez, A. Optimizing the location of a biomass plant with a fuzzy-DEcision-MAking Trial and Evaluation Laboratory (F-DEMATEL) and multi-criteria spatial decision assessment for renewable energy management and long-term sustainability. J. Clean. Prod. 2018, 182, 509–520. [Google Scholar] [CrossRef]
  8. Hamdy, A.; Abd Elhafez, S.; Hamad, H.; Ali, R. The interplay of autoclaving with oxalate as pretreatment technique in the view of bioethanol production based on corn stover. Polymers 2021, 13, 3762. [Google Scholar] [CrossRef] [PubMed]
  9. Morales, J.Y.R.; López, G.L.; Martínez, V.M.A.; Vázquez, F.D.J.S.; Mendoza, J.A.B.; García, M.M. Parametric study and control of a pressure swing adsorption process to separate the water-ethanol mixture under disturbances. Sep. Purif. Technol. 2020, 236, 116214. [Google Scholar] [CrossRef]
  10. Torres Cantero, C.A.; Lopez Lopez, G.; Alvarado, V.M.; Escobar Jimenez, R.F.; Rumbo Morales, J.Y.; Sanchez Coronado, E.M. Control structures evaluation for a salt extractive distillation pilot plant: Application to bio-ethanol dehydration. Energies 2017, 10, 1276. [Google Scholar] [CrossRef] [Green Version]
  11. Rumbo Morales, J.Y.; Perez Vidal, A.F.; Ortiz Torres, G.; Salas Villalobo, A.U.; Sorcia Vázquez, F.D.J.; Brizuela Mendoza, J.A.; Torres, G.O.; Sorcia Vázquez, F.d.J.; Rojas, A.C.; Valdez Martínez, J.S. Adsorption and Separation of the H2O/H2SO4 and H2O/C2H5 OH Mixtures: A Simulated and Experimental Study. Processes 2020, 8, 290. [Google Scholar] [CrossRef]
  12. Bojić, S.; Đatkov, Đ.; Brcanov, D.; Georgijević, M.; Martinov, M. Location allocation of solid biomass power plants: Case study of Vojvodina. Renew. Sustain. Energy Rev. 2013, 26, 769–775. [Google Scholar] [CrossRef]
  13. Zhao, X.; Li, A. A multi-objective sustainable location model for biomass power plants: Case of China. Energy 2016, 112, 1184–1193. [Google Scholar] [CrossRef]
  14. Cebi, S.; Ilbahar, E.; Atasoy, A. A fuzzy information axiom based method to determine the optimal location for a biomass power plant: A case study in Aegean Region of Turkey. Energy 2016, 116, 894–907. [Google Scholar] [CrossRef]
  15. Jayarathna, L.; Kent, G.; O’Hara, I.; Hobson, P. A Geographical Information System based framework to identify optimal location and size of biomass energy plants using single or multiple biomass types. Appl. Energy 2020, 275, 115398. [Google Scholar] [CrossRef]
  16. Guler, D.; Charisoulis, G.; Buttenfield, B.P.; Yomralioglu, T. Suitability modeling and sensitivity analysis for biomass energy facilities in Turkey. Clean Technol. Environ. Policy 2021, 23, 2183–2199. [Google Scholar] [CrossRef]
  17. Middelhoff, E.; Madden, B.; Ximenes, F.; Carney, C.; Florin, N. Assessing electricity generation potential and identifying possible locations for siting hybrid concentrated solar biomass (HCSB) plants in New South Wales (NSW), Australia. Appl. Energy 2022, 305, 117942. [Google Scholar] [CrossRef]
  18. Atici, U.; Gürcan, Ö.F.; Güldeş, M.; Şahin, C. A Fuzzy Multi-Criteria Decision-Making Method for Selection of Biomass Power Plant Location. In Optimization and Decision-Making in the Renewable Energy Industry; IGI Global: Hershey, PA, USA, 2022; pp. 1–30. [Google Scholar] [CrossRef]
  19. Zhao, B.; Wang, H.; Huang, Z.; Sun, Q. Location mapping for constructing biomass power plant using multi-criteria decision-making method. Sustain. Energy Technol. Assess. 2022, 49, 101707. [Google Scholar] [CrossRef]
  20. Gao, J.; Wang, Z.; Wang, Z.; Wang, C.; Zhang, R.; Xu, G.; Wu, X. Macro-site selection and obstacle factor extraction of biomass cogeneration based on comprehensive weight method of Game theory. Energy Rep. 2022, 8, 14416–14427. [Google Scholar] [CrossRef]
  21. Afkhami, P.; Zarrinpoor, N. Location Assessment of Jatropha Cultivation for Biofuel Production in Fars Province, Iran: A Hybrid GIS-Based Fuzzy Multi-criteria Framework. Waste Biomass Valorization 2022, 13, 4511–4532. [Google Scholar] [CrossRef]
  22. Kengpol, A.; Rontlaong, P.; Elfvengren, K. Sustainable Assessment for Biomass Power Plant Location during the COVID-19 Pandemic. Ind. Eng. Manag. Syst. 2022, 21, 20–42. [Google Scholar] [CrossRef]
  23. Da Silva Romero, C.W.; Miyazaki, M.R.; Berni, M.D.; Figueiredo, G.K.D.A.; Lamparelli, R.A.C. A spatial approach for integrating GIS and fuzzy logic in multicriteria problem solving to support the definition of ideal areas for biorefinery deployment. J. Clean. Prod. 2023, 390, 135886. [Google Scholar] [CrossRef]
  24. Atanassov, K.T. Intuitionistic fuzzy sets. Fuzzy Sets Syst. 1986, 20, 87–96. [Google Scholar] [CrossRef]
  25. Yager, R.R. Pythagorean membership grades in multicriteria decision making. IEEE Trans. Fuzzy Syst. 2014, 22, 958–965. [Google Scholar] [CrossRef]
  26. Alipour, M.; Hafezi, R.; Rani, P.; Hafezi, M.; Mardani, A. A new Pythagorean fuzzy-based decision-making method through entropy measure for fuel cell and hydrogen components supplier selection. Energy 2021, 234, 121208. [Google Scholar] [CrossRef]
  27. Yager, R.R. Generalized Orthopair Fuzzy Sets. IEEE Trans. Fuzzy Syst. 2017, 25, 1222–1230. [Google Scholar] [CrossRef]
  28. Garg, H.; Chen, S.-M. Multiattribute group decision making based on neutrality aggregation operators of q-rung orthopair fuzzy sets. Inf. Sci. 2022, 517, 427–447. [Google Scholar] [CrossRef]
  29. Seikh, M.R.; Mandal, U. q-rung orthopair fuzzy Frank aggregation operators and its application in multiple attribute decision-making with unknown attribute weights. Granul. Comput. 2021, 7, 709–730. [Google Scholar] [CrossRef]
  30. Wang, J.; Zhang, R.; Zhu, X.; Zhou, Z.; Shang, X.; Li, W. Some q-rung orthopair fuzzy Muirhead means with their application to multi-attribute group decision making. J. Intell. Fuzzy Syst. 2019, 36, 1599–1614. [Google Scholar] [CrossRef]
  31. Kumar, K.; Chen, S.-M. Group decision making based on q-rung orthopair fuzzy weighted averaging aggregation operator of q-rung orthopair fuzzy numbers. Inf. Sci. 2022, 598, 1–18. [Google Scholar] [CrossRef]
  32. Kakati, P.; Rahman, S. The q-rung orthopair fuzzy hamacher generalized shapley choquet integral operator and its application to multiattribute decision making. EURO J. Decis. Process. 2022, 10, 100012. [Google Scholar] [CrossRef]
  33. Peng, X.; Krishankumar, R.; Ravichandran, K.S. Generalized orthopair fuzzy weighted distance-based approximation (WDBA) algorithm in emergency decision-making. Int. J. Intell. Syst. 2019, 34, 2364–2402. [Google Scholar] [CrossRef]
  34. Yin, S.; Wang, Y.; Shafiee, S. Ranking products through online reviews considering the mass assignment of features based on BERT and q-rung orthopair fuzzy set theory. Expert Syst. Appl. 2023, 213, 119142. [Google Scholar] [CrossRef]
  35. Krishankumar, R.; Gowtham, Y.; Ahmed, I.; Ravichandran, K.S.; Kar, S. Solving green supplier selection problem using q-rung orthopair fuzzy-based decision framework with unknown weight information. Appl. Soft Comput. 2020, 94, 106431. [Google Scholar] [CrossRef]
  36. Mishra, A.R.; Rani, P.; Saha, A.; Pamucar, D.; Hezam, I.M. A q-rung orthopair fuzzy combined compromise solution approach for selecting sustainable third-party reverse logistics provider. Manag. Decis. 2022. ahead-of-print. [Google Scholar] [CrossRef]
  37. Krishankumar, R.; Nimmagadda, S.S.; Rani, P.; Mishra, A.R.; Ravichandran, K.S.; Gandomi, A.H. Solving renewable energy source selection problems using a q-rung orthopair fuzzy-based integrated decision-making approach. J. Clean. Prod. 2021, 279, 123329. [Google Scholar] [CrossRef]
  38. Tang, G.; Yang, Y.; Gu, X.; Chiclana, F.; Liu, P.; Wang, F. A new integrated multi-attribute decision-making approach for mobile medical app evaluation under q-rung orthopair fuzzy environment. Expert Syst. Appl. 2022, 200, 117034. [Google Scholar] [CrossRef]
  39. Yang, Z.; Shang, W.-L.; Zhang, H.; Garg, H.; Han, C. Assessing the green distribution transformer manufacturing process using a cloud-based q-rung orthopair fuzzy multi-criteria framework. Appl. Energy 2022, 311, 118687. [Google Scholar] [CrossRef]
  40. Fetanat, A.; Tayebi, M. Industrial filtration technologies selection for contamination control in natural gas processing plants: A sustainability and maintainability-based decision support system under q-rung orthopair fuzzy set. Process Saf. Environ. Prot. 2023, 170, 310–327. [Google Scholar] [CrossRef]
  41. Mishra, A.R.; Rani, P. A q-rung orthopair fuzzy ARAS method based on entropy and discrimination measures: An application of sustainable recycling partner selection. J. Ambient. Intell. Humaniz. Comput. 2021, 1–22. [Google Scholar] [CrossRef]
  42. Mishra, A.R.; Rani, P.; Pamucar, D.; Hezam, I.M.; Saha, A. Entropy and discrimination measures based q-rung orthopair fuzzy MULTIMOORA framework for selecting solid waste disposal method. Environ. Sci. Pollut. Res. 2022, 30, 12988–13011. [Google Scholar] [CrossRef] [PubMed]
  43. Zolfani, S.H.; Krishankumar, R.; Pamucar, D.; Görçün, Ö.F. The potentials of the Southern & Eastern European countries in the process of the regionalization of the global supply chains using a q-rung orthopair fuzzy-based integrated decision-making approach. Comput. Ind. Eng. 2022, 171, 108405. [Google Scholar]
  44. Deveci, M.; Pamucar, D.; Gokasar, I.; Köppen, M.; Gupta, B.B. Personal mobility in metaverse with autonomous vehicles using Q-rung orthopair fuzzy sets based OPA-RAFSI model. IEEE Trans. Intell. Transp. Syst. 2022, 1–10. [Google Scholar] [CrossRef]
  45. Krishankumar, R.; Mishra, A.R.; Rani, P.; Zavadskas, E.K.; Ravichandran, K.S.; Kar, S. A new decision model with integrated approach for healthcare waste treatment technology selection with generalized orthopair fuzzy information. Inf. Sci. 2022, 610, 1010–1028. [Google Scholar] [CrossRef]
  46. Zhang, C.; Bai, W.; Li, D.; Zhan, J. Multiple attribute group decision making based on multigranulation probabilistic models, MULTIMOORA and TPOP in incomplete q-rung orthopair fuzzy information systems. Int. J. Approx. Reason. 2022, 143, 102–120. [Google Scholar] [CrossRef]
  47. Xin, L.; Lang, S.; Mishra, A.R. Evaluate the challenges of sustainable supply chain 4.0 implementation under the circular economy concept using new decision making approach. Oper. Manag. Res. 2022, 15, 773–792. [Google Scholar] [CrossRef]
  48. Krishankumar, R.; Ecer, F.; Mishra, A.R.; Ravichandran, K.S.; Gandomi, A.H.; Kar, S. A SWOT-based framework for personalized ranking of IoT service providers with generalized fuzzy data for sustainable transport in urban regions. IEEE Trans. Eng. Manag. 2022, 1–14. [Google Scholar] [CrossRef]
  49. Bai, L.; Garcia, F.J.S.; Mishra, A.R. Adoption of the sustainable circular supply chain under disruptions risk in manufacturing industry using an integrated fuzzy decision-making approach. Oper. Manag. Res. 2022, 15, 743–759. [Google Scholar] [CrossRef]
  50. Hu, Y.; Al-Barakati, A.; Rani, P. Investigating the Internet-of-Things (IoT) risks for supply chain management using q-rung orthopair fuzzy-SWARA-ARAS framework. Technol. Econ. Dev. Econ. 2022, 1–26. [Google Scholar] [CrossRef]
  51. Zhang, J.; Zhang, X.; Liu, W.; Ji, M.; Mishra, A.R. Critical success factors of blockchain technology to implement the sustainable supply chain using an extended decision-making approach. Technol. Forecast. Soc. Chang. 2022, 182, 121881. [Google Scholar] [CrossRef]
  52. Zhu, D.; Li, Z.; Mishra, A.R. Evaluation of the critical success factors of dynamic enterprise risk management in manufacturing SMEs using an integrated fuzzy decision-making model. Technol. Forecast. Soc. Chang. 2022, 186, 122137. [Google Scholar] [CrossRef]
  53. Yang, Z.; Ahmad, S.; Bernardi, A.; Shang, W.L.; Xuan, J.; Xu, B. Evaluating alternative low carbon fuel technologies using a stakeholder participation-based q-rung orthopair linguistic multi-criteria framework. Appl. Energy 2023, 332, 120492. [Google Scholar] [CrossRef]
  54. Kausar, R.; Farid, H.M.A.; Riaz, M.; Gonul Bilgin, N. Innovative CODAS Algorithm for q-Rung Orthopair Fuzzy Information and Cancer Risk Assessment. Symmetry 2023, 15, 205. [Google Scholar] [CrossRef]
  55. Krishankumar, R.; Ecer, F. Selection of IoT service provider for sustainable transport using q-rung orthopair fuzzy CRADIS and unknown weights. Appl. Soft Comput. 2023, 132, 109870. [Google Scholar] [CrossRef]
  56. Seker, S.; Bağlan, F.B.; Aydin, N.; Deveci, M.; Ding, W. Risk assessment approach for analyzing risk factors to overcome pandemic using interval-valued q-rung orthopair fuzzy decision making method. Appl. Soft Comput. 2023, 132, 109891. [Google Scholar] [CrossRef]
  57. Qiyas, M.; Abdullah, S.; Khan, N.; Naeem, M.; Khan, F.; Liu, Y. Case study for hospital-based Post-Acute Care-Cerebrovascular Disease using Sine Hyperbolic q-rung orthopair fuzzy Dombi aggregation operators. Expert Syst. Appl. 2023, 215, 119224. [Google Scholar] [CrossRef]
  58. Xu, Y. A two-stage multi-criteria decision-making method with interval-valued q-Rung Orthopair fuzzy technology for selecting bike-sharing recycling supplier. Eng. Appl. Artif. Intell. 2023, 119, 105827. [Google Scholar] [CrossRef]
  59. Kao, C. Weight determination for consistently ranking alternatives in multiple criteria decision analysis. Appl. Math. Model. 2010, 34, 1779–1787. [Google Scholar] [CrossRef]
  60. Koksalmis, E.; Kabak, Ö. Deriving decision makers’ weights in group decision making: An overview of objective methods. Inf. Fusion 2019, 49, 146–160. [Google Scholar] [CrossRef]
  61. Sivagami, R.; Krishankumar, R.; Sangeetha, V.; Ravichandran, K.S.; Kar, S.; Gandomi, A.H. Assessment of cloud vendors using interval-valued probabilistic linguistic information and unknown weights. Int. J. Intell. Syst. 2021, 36, 3813–3851. [Google Scholar] [CrossRef]
  62. Anbuudayasankar, S.P.; Srikanthan, R.; Karthik, M.; Nair, P.R.; Sivakarthik, N.; Indukumar, P. Cloud-based technology for small and medium scale enterprises: A decision-making paradigm using IPA, AHP and fuzzy-AHP techniques. Int. J. Integr. Supply Manag. 2020, 13, 335–352. [Google Scholar] [CrossRef]
  63. Gül, S. Fermatean fuzzy set extensions of SAW, ARAS, and VIKOR with applications in COVID-19 testing laboratory selection problem. Expert Syst. 2021, 38, e12769. [Google Scholar] [CrossRef]
  64. Omar, Y.M.; Plapper, P. A survey of information entropy metrics for complex networks. Entropy 2020, 22, 1417. [Google Scholar] [CrossRef]
  65. Rani, P.; Ali, J.; Krishankumar, R.; Mishra, A.R.; Cavallaro, F.; Ravichandran, K.S. An integrated single-valued neutrosophic combined compromise solution methodology for renewable energy resource selection problem. Energies 2021, 14, 4594. [Google Scholar] [CrossRef]
  66. Yazdani, M.; Zarate, P.; Zavadskas, E.K.; Turskis, Z. A Combined Compromise Solution (CoCoSo) method for multi-criteria decision-making problems. Manag. Decis. 2019, 57, 2501–2519. [Google Scholar] [CrossRef]
  67. Zeleny, M. A concept of compromise solutions and the method of the displaced ideal. Comput. Oper. Res. 1974, 1, 479–496. [Google Scholar] [CrossRef]
  68. Natarajan, K.; Latva-Käyrä, P.; Zyadin, A.; Chauhan, S.; Singh, H.; Pappinen, A.; Pelkonen, P. Biomass resource assessment and existing biomass use in the Madhya Pradesh, Maharashtra, and Tamil Nadu States of India. Challenges 2015, 6, 158–172. [Google Scholar] [CrossRef]
  69. Jayarathna, L.; Kent, G.; O’Hara, I.; Hobson, P. Geographical information system based fuzzy multi criteria analysis for sustainability assessment of biomass energy plant siting: A case study in Queensland, Australia. Land Use Policy 2022, 114, 105986. [Google Scholar] [CrossRef]
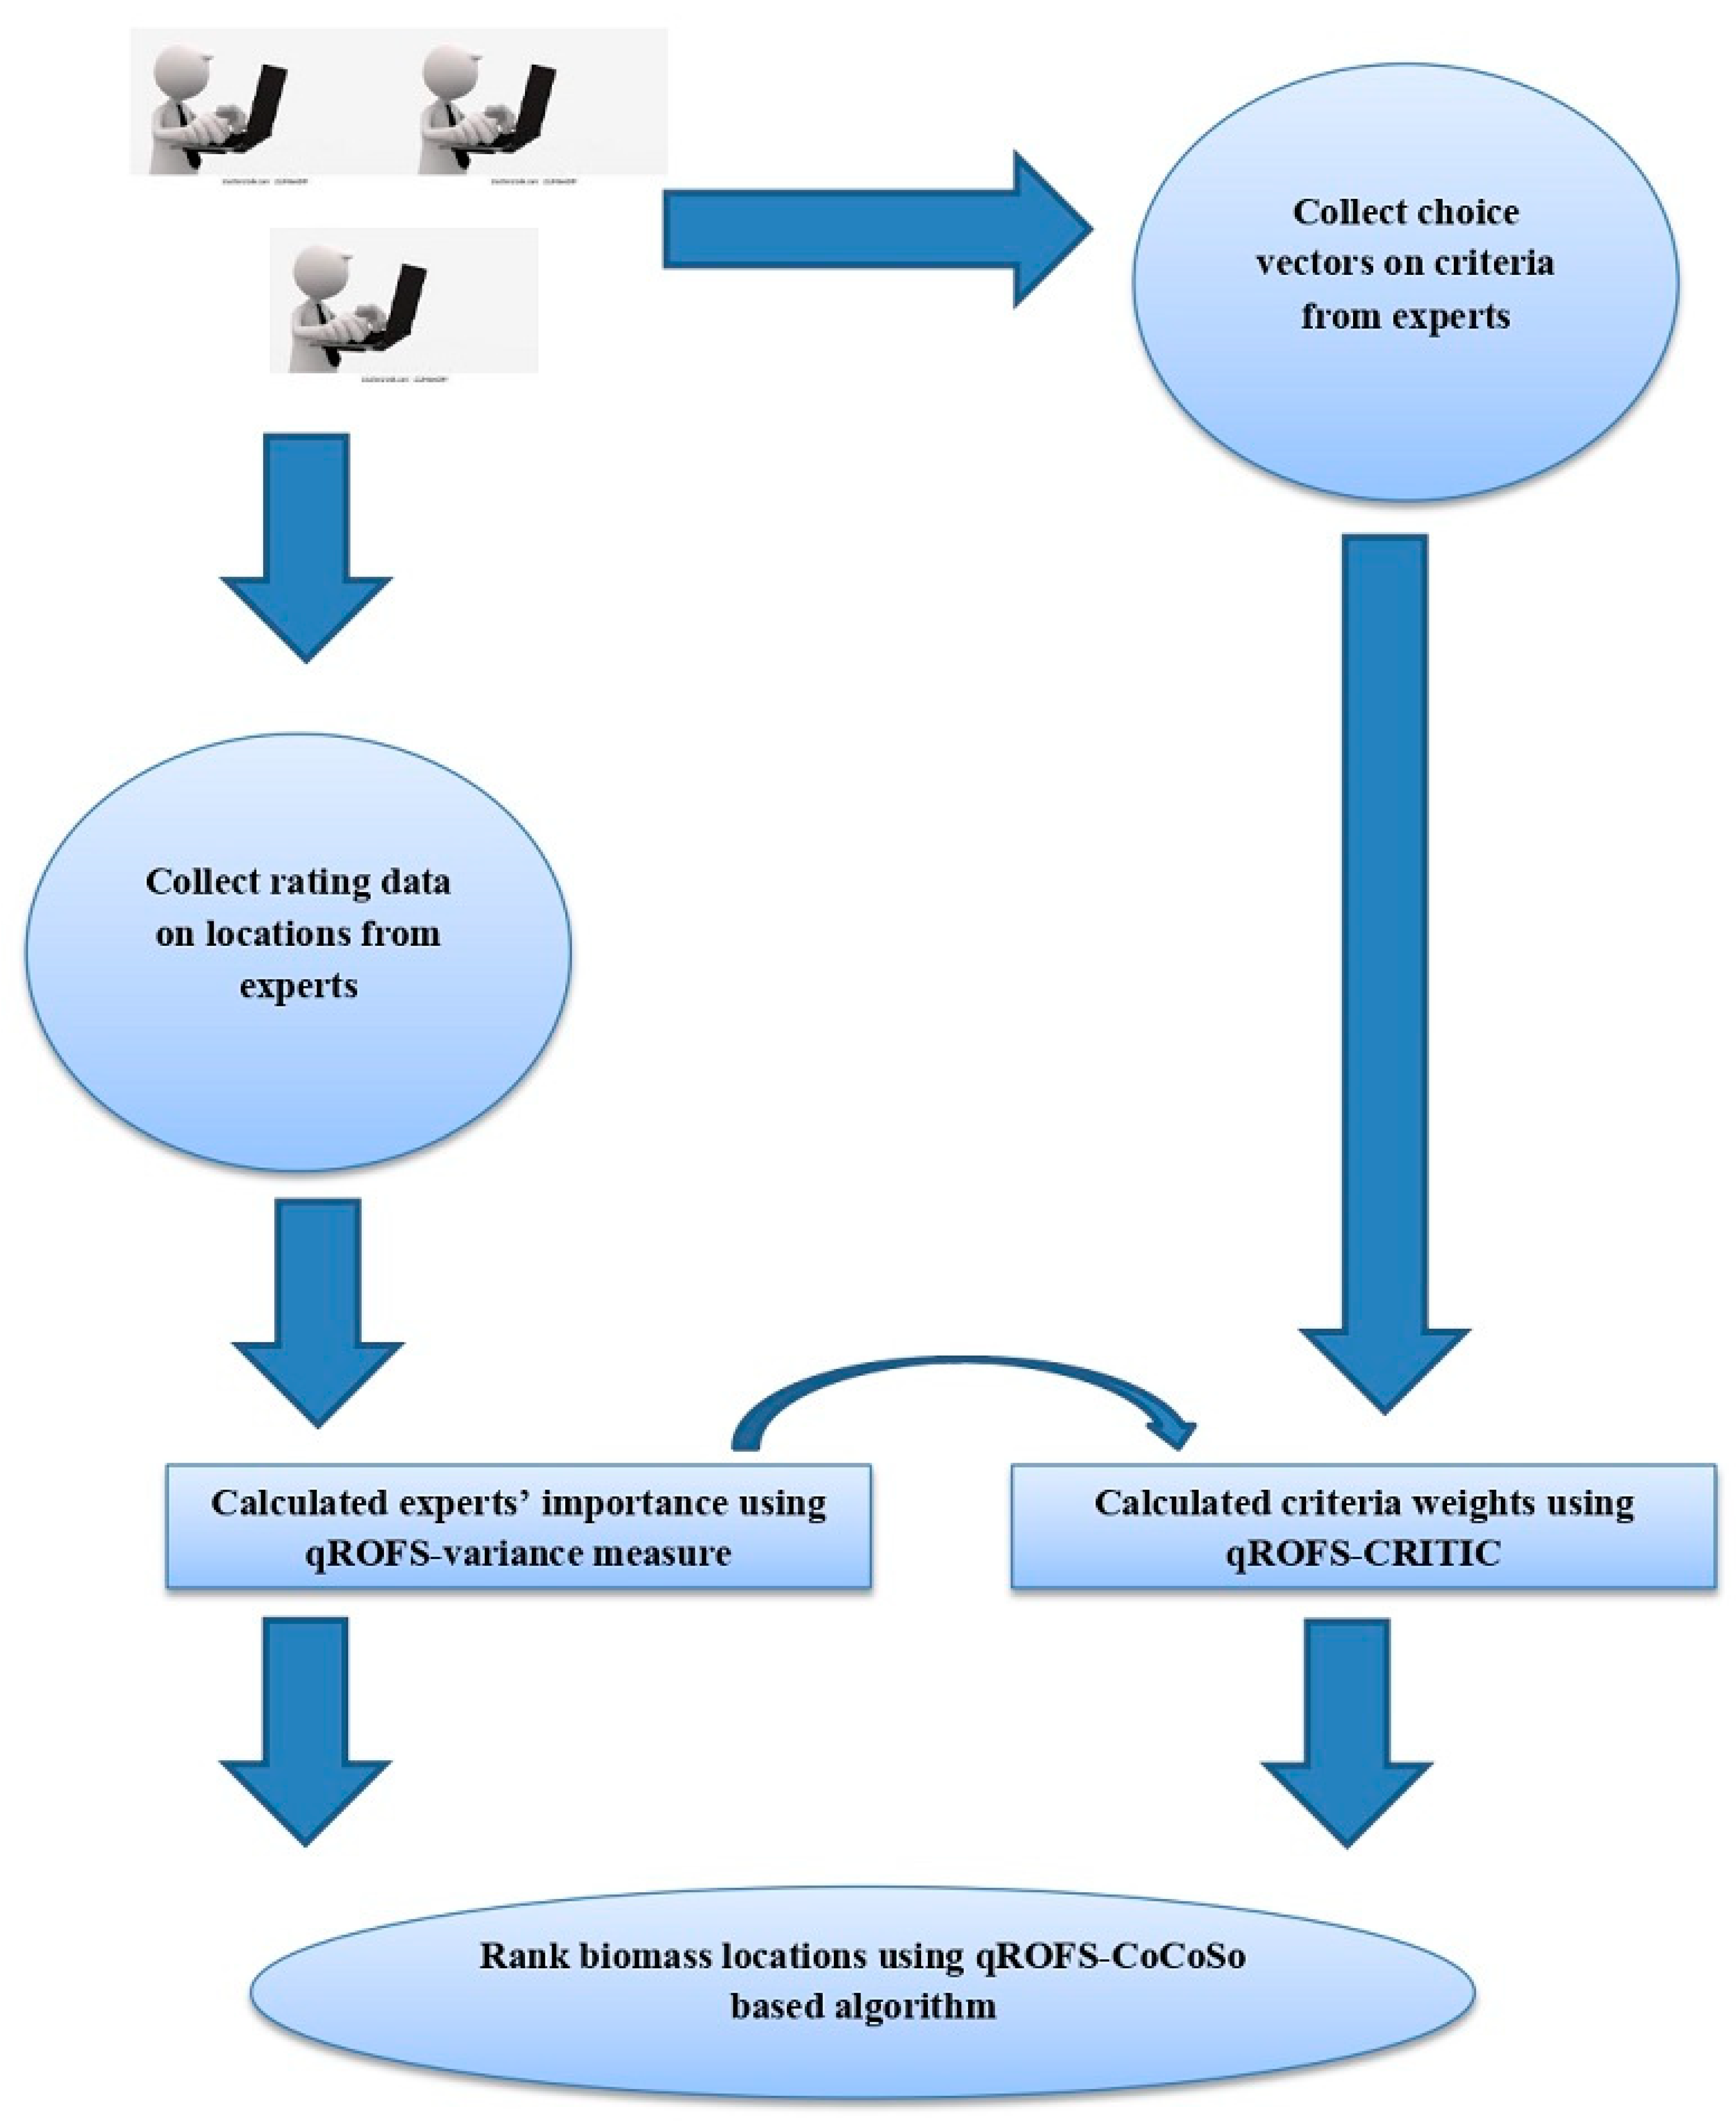
Figure 1. Biomass production location selection framework with q-ROFNs.
Sustainability 15 03377 g001
Figure 2. Accuracy measure of data from experts is (a) P 1 , (b) P 2 , and (c) O 3 .
Sustainability 15 03377 g002
Figure 3. Interaction values among criteria.
Sustainability 15 03377 g003
Figure 4. Sensitivity analysis of criteria weights and strategy values are (a) biased weights and (b) unbiased weights.
Sustainability 15 03377 g004
Figure 5. Spearman correlation for consistency test—proposed vs. others.
Sustainability 15 03377 g005
Table 1. q-ROFN values for corresponding Likert scales [36].
Linguistic Variableq-ROFNLinguistic Variableq-ROFN
Absolutely high (AH)(0.9, 0.65)Absolutely preferred (AP)(0.9, 0.65)
Very high (VH)(0.9, 0.6)Very highly preferred (VMP)(0.9, 0.6)
Moderately high (MH)(0.8, 0.65)Highly preferred (HP)(0.8, 0.6)
High (H)(0.75, 0.6)Moderately preferred (MP)(0.75, 0.6)
Moderate (M)(0.5, 0.5)Neutral (N)(0.5, 0.5)
Low (L)(0.6, 0.7)Moderately less preferred (MLP)(0.6, 0.7)
Moderately low (ML)(0.7, 0.8)Less preferred (LP)(0.7, 0.8)
Very low Very less preferred (VLP)(0.65, 0.9)
Absolutely low (AL)(0.6, 0.9)Extremely less preferred (ELP)(0.6, 0.9)
Table 2. Rating data from experts on biomass location.
O V
N 1 N 2 N 3 N 4 N 5 N 6 N 7 N 8 N 9
P 1
O 1 MLMMHMMHML
O 2 LLMHMHMLMVHMAH
O 3 MHLVLAHHVLHVLH
O 4 LLHMLLMHMHAHVL
O 5 VHHHMMHAHHAHL
P 2
O 1 MAHLVHMHMVHVHL
O 2 MHLMHLLVLMHMM
O 3 AHAHMHVHHHMLHH
O 4 LMMLLMMHMHH
O 5 AHLAHAHHMLLMMH
P 3
O 1 VHVHMLHMHMLM
O 2 MMLMLVLLMLVLML
O 3 VHHLMLLHVHVLM
O 4 MHMLVLMLLMLMML
O 5 LVHMLMLVHMHHLL
Table 3. Opinions from experts on criteria.
P V
N 1 N 2 N 3 N 4 N 5 N 6 N 7 N 8 N 9
P 1 HPMLPNNLPLPNVMPLP
P 2 MPAPMPHPVMPLPMLPNHP
P 3 MLPHPMPLPLPVLPLPMLPMP
Table 4. Values of CoCoSo parameters for ranking locations.
I T i 1 T i 2 T i 3 a t   0.5 T i
I 1 1.80626.0188.34319.375
I 2 1.86227.8398.58920.399
I 3 1.84528.0048.51320.389
I 4 1.63426.9178.57119.381
I 5 18.8147.62815.526
Table 5. Characteristics of developed and extant biomass location selection models.
ContextProposedJayarathna et al. [69]Atici et al. [18]Guler et al. [16]Zhao et al. [19]Jeong and
Rameriz-Gomes [7]
Inputq-ROFNFuzzyFuzzyFuzzyFuzzyFuzzy
Preference flexibilityYesNoNoNoNoNo
Weights of expertsCalculatedNot calculatedNot calculatedNot calculatedNot calculatedNot calculated
Criteria interactionsConsideredNot consideredNot consideredNot consideredNot consideredNot considered
Hesitation of expertsConsideredNot consideredNot consideredNot consideredNot consideredNot considered
Compromised solutionYesNoNoNoNoNo
Consideration of weightsBoth experts and criteriaOnly criteriaOnly criteriaOnly criteriaOnly criteriaOnly criteria
UncertaintyModeled via three degreesModeled via single degreeModeled via single degreeModeled via single degreeModeled via single degreeModeled via single degree
Subjective randomnessMinimized adequatelyModerately minimizedModerately minimizedModerately minimizedModerately minimizedModerately minimized
Disclaimer/Publisher’s Note: The statements, opinions and data contained in all publications are solely those of the individual author(s) and contributor(s) and not of MDPI and/or the editor(s). MDPI and/or the editor(s) disclaim responsibility for any injury to people or property resulting from any ideas, methods, instructions or products referred to in the content.