
Spatio-Temporal Evolution of Agricultural Carbon Emissions in China, 2000–2020


Abstract
:1. Introduction
2. Method and Data
2.1. ACEs Accounting Method
2.2. Carbon Emissions from Rice Cultivation
2.3. Carbon Emissions from Soil
2.4. Carbon Emissions from Agricultural Materials
2.5. Carbon Emissions from Livestock and Poultry
2.6. Data Sources
3. Results
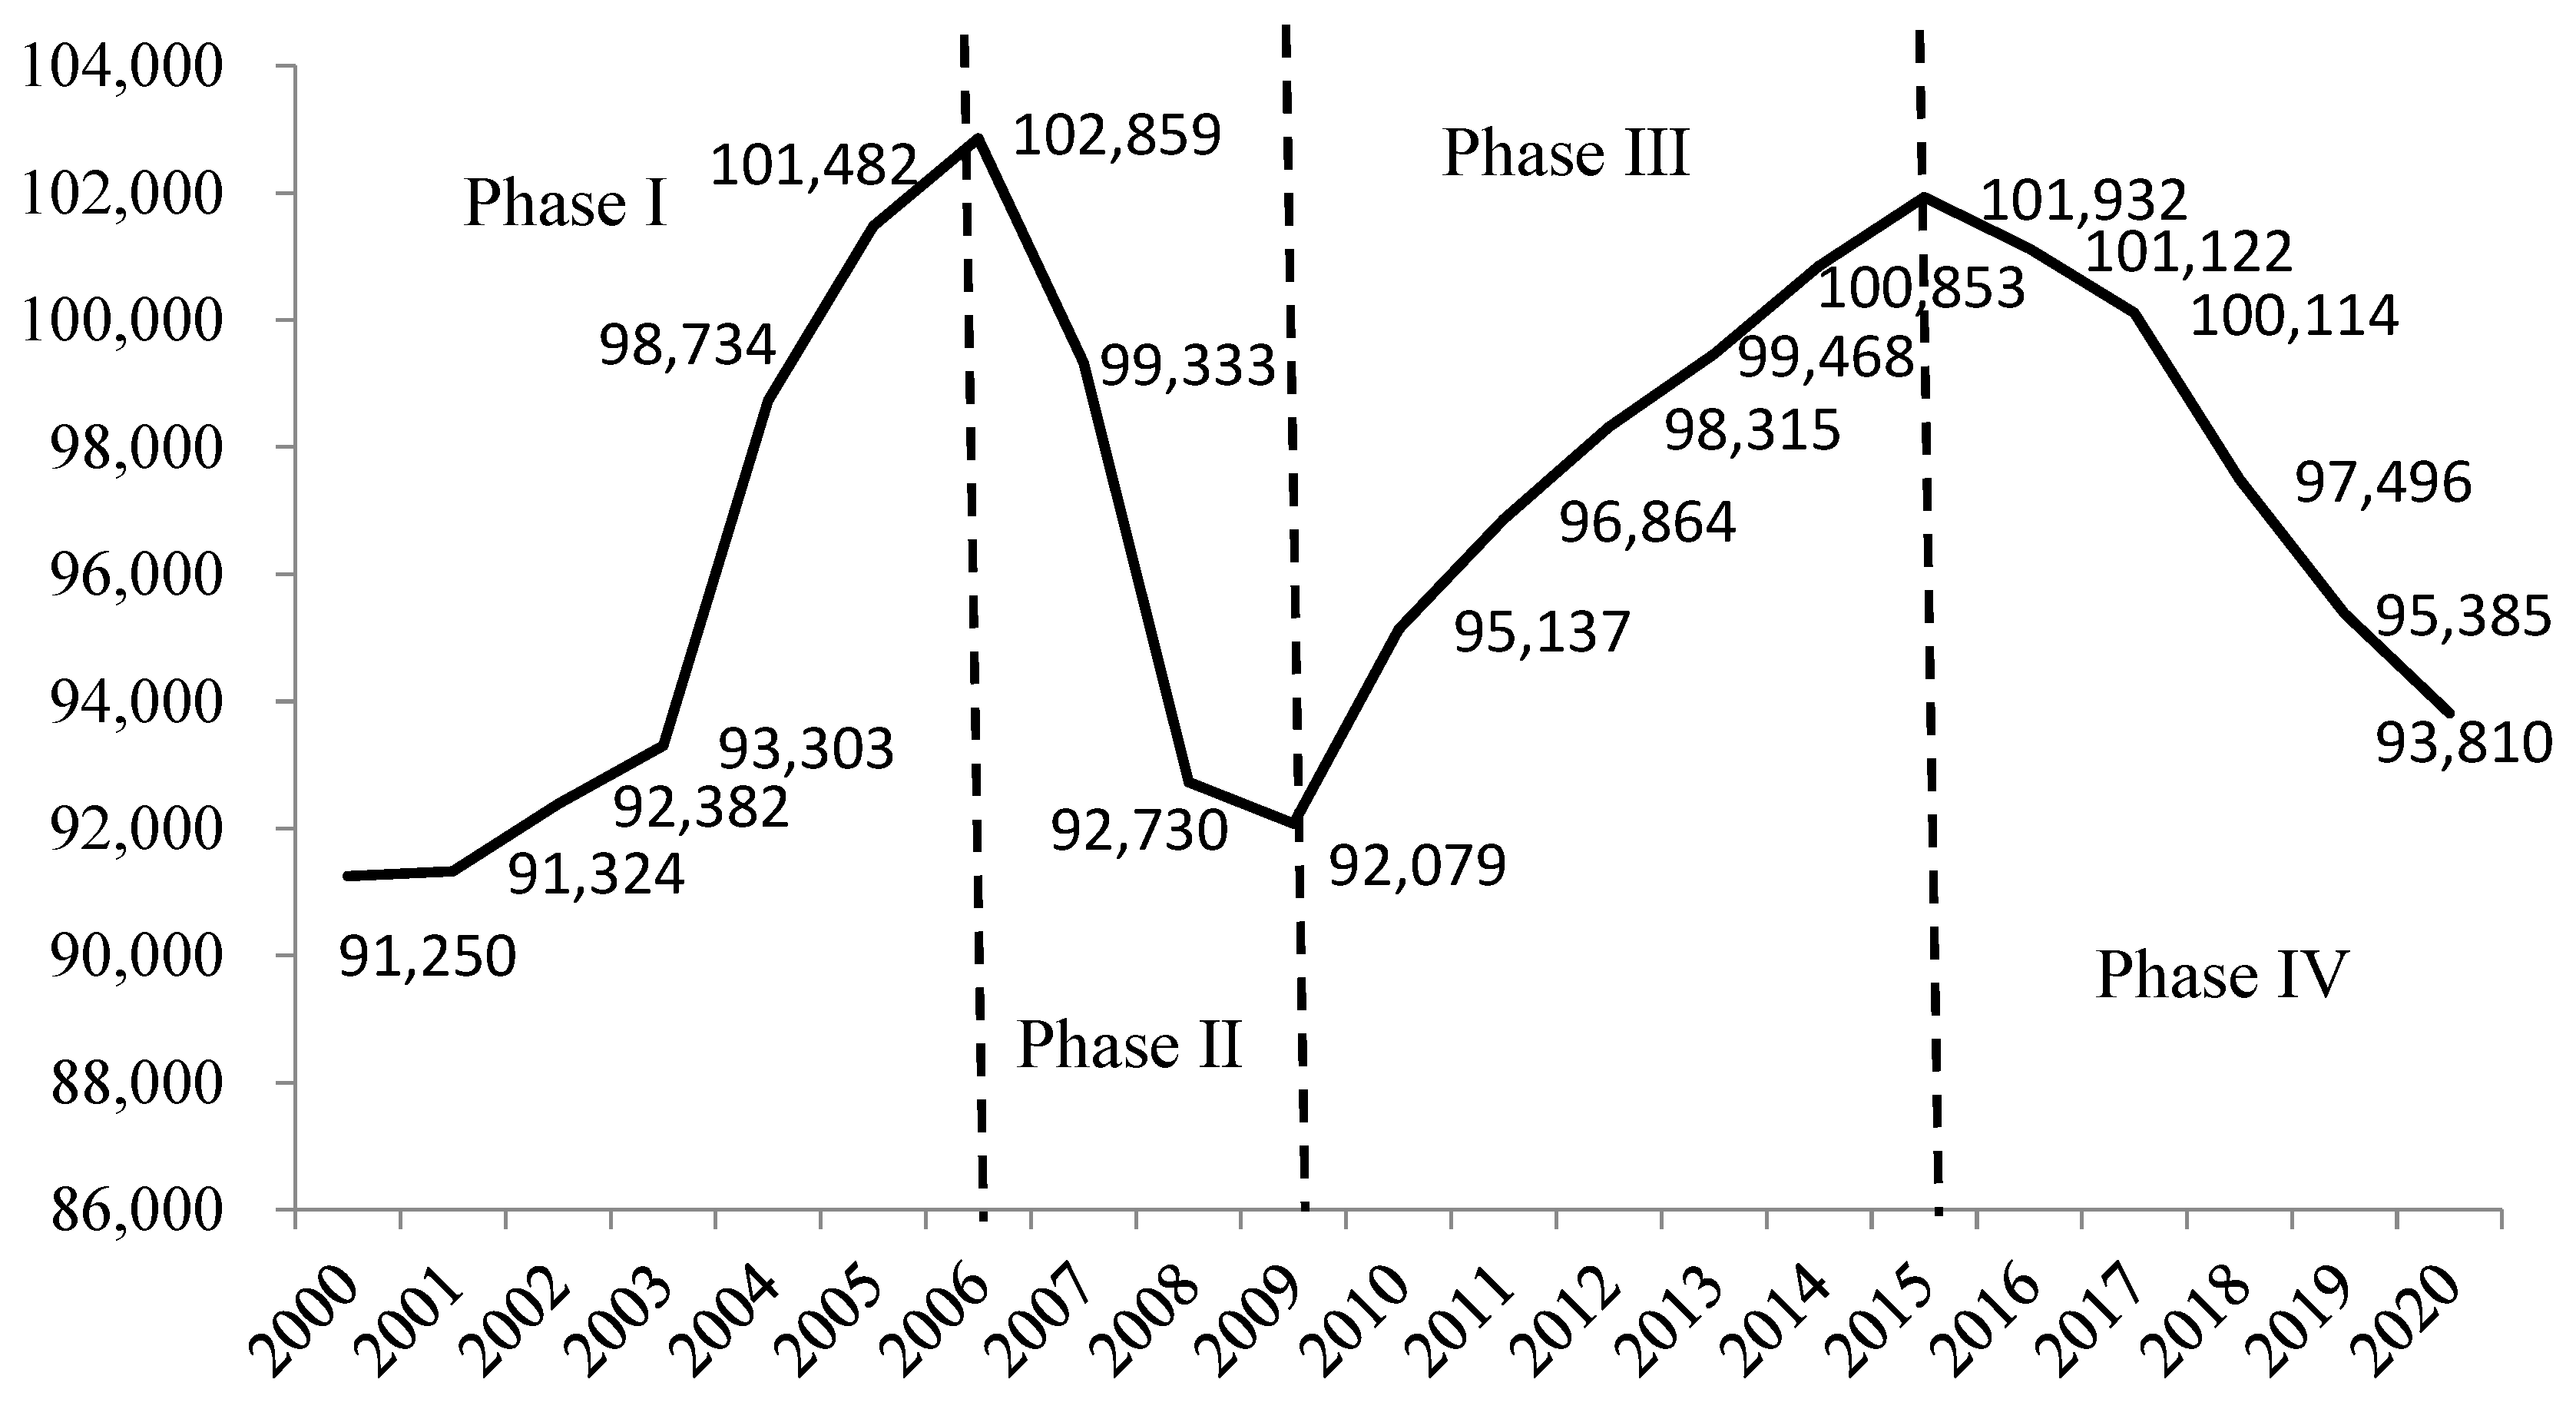
3.1. Analysis of the Spatio-Temporal Characteristics of ACEs
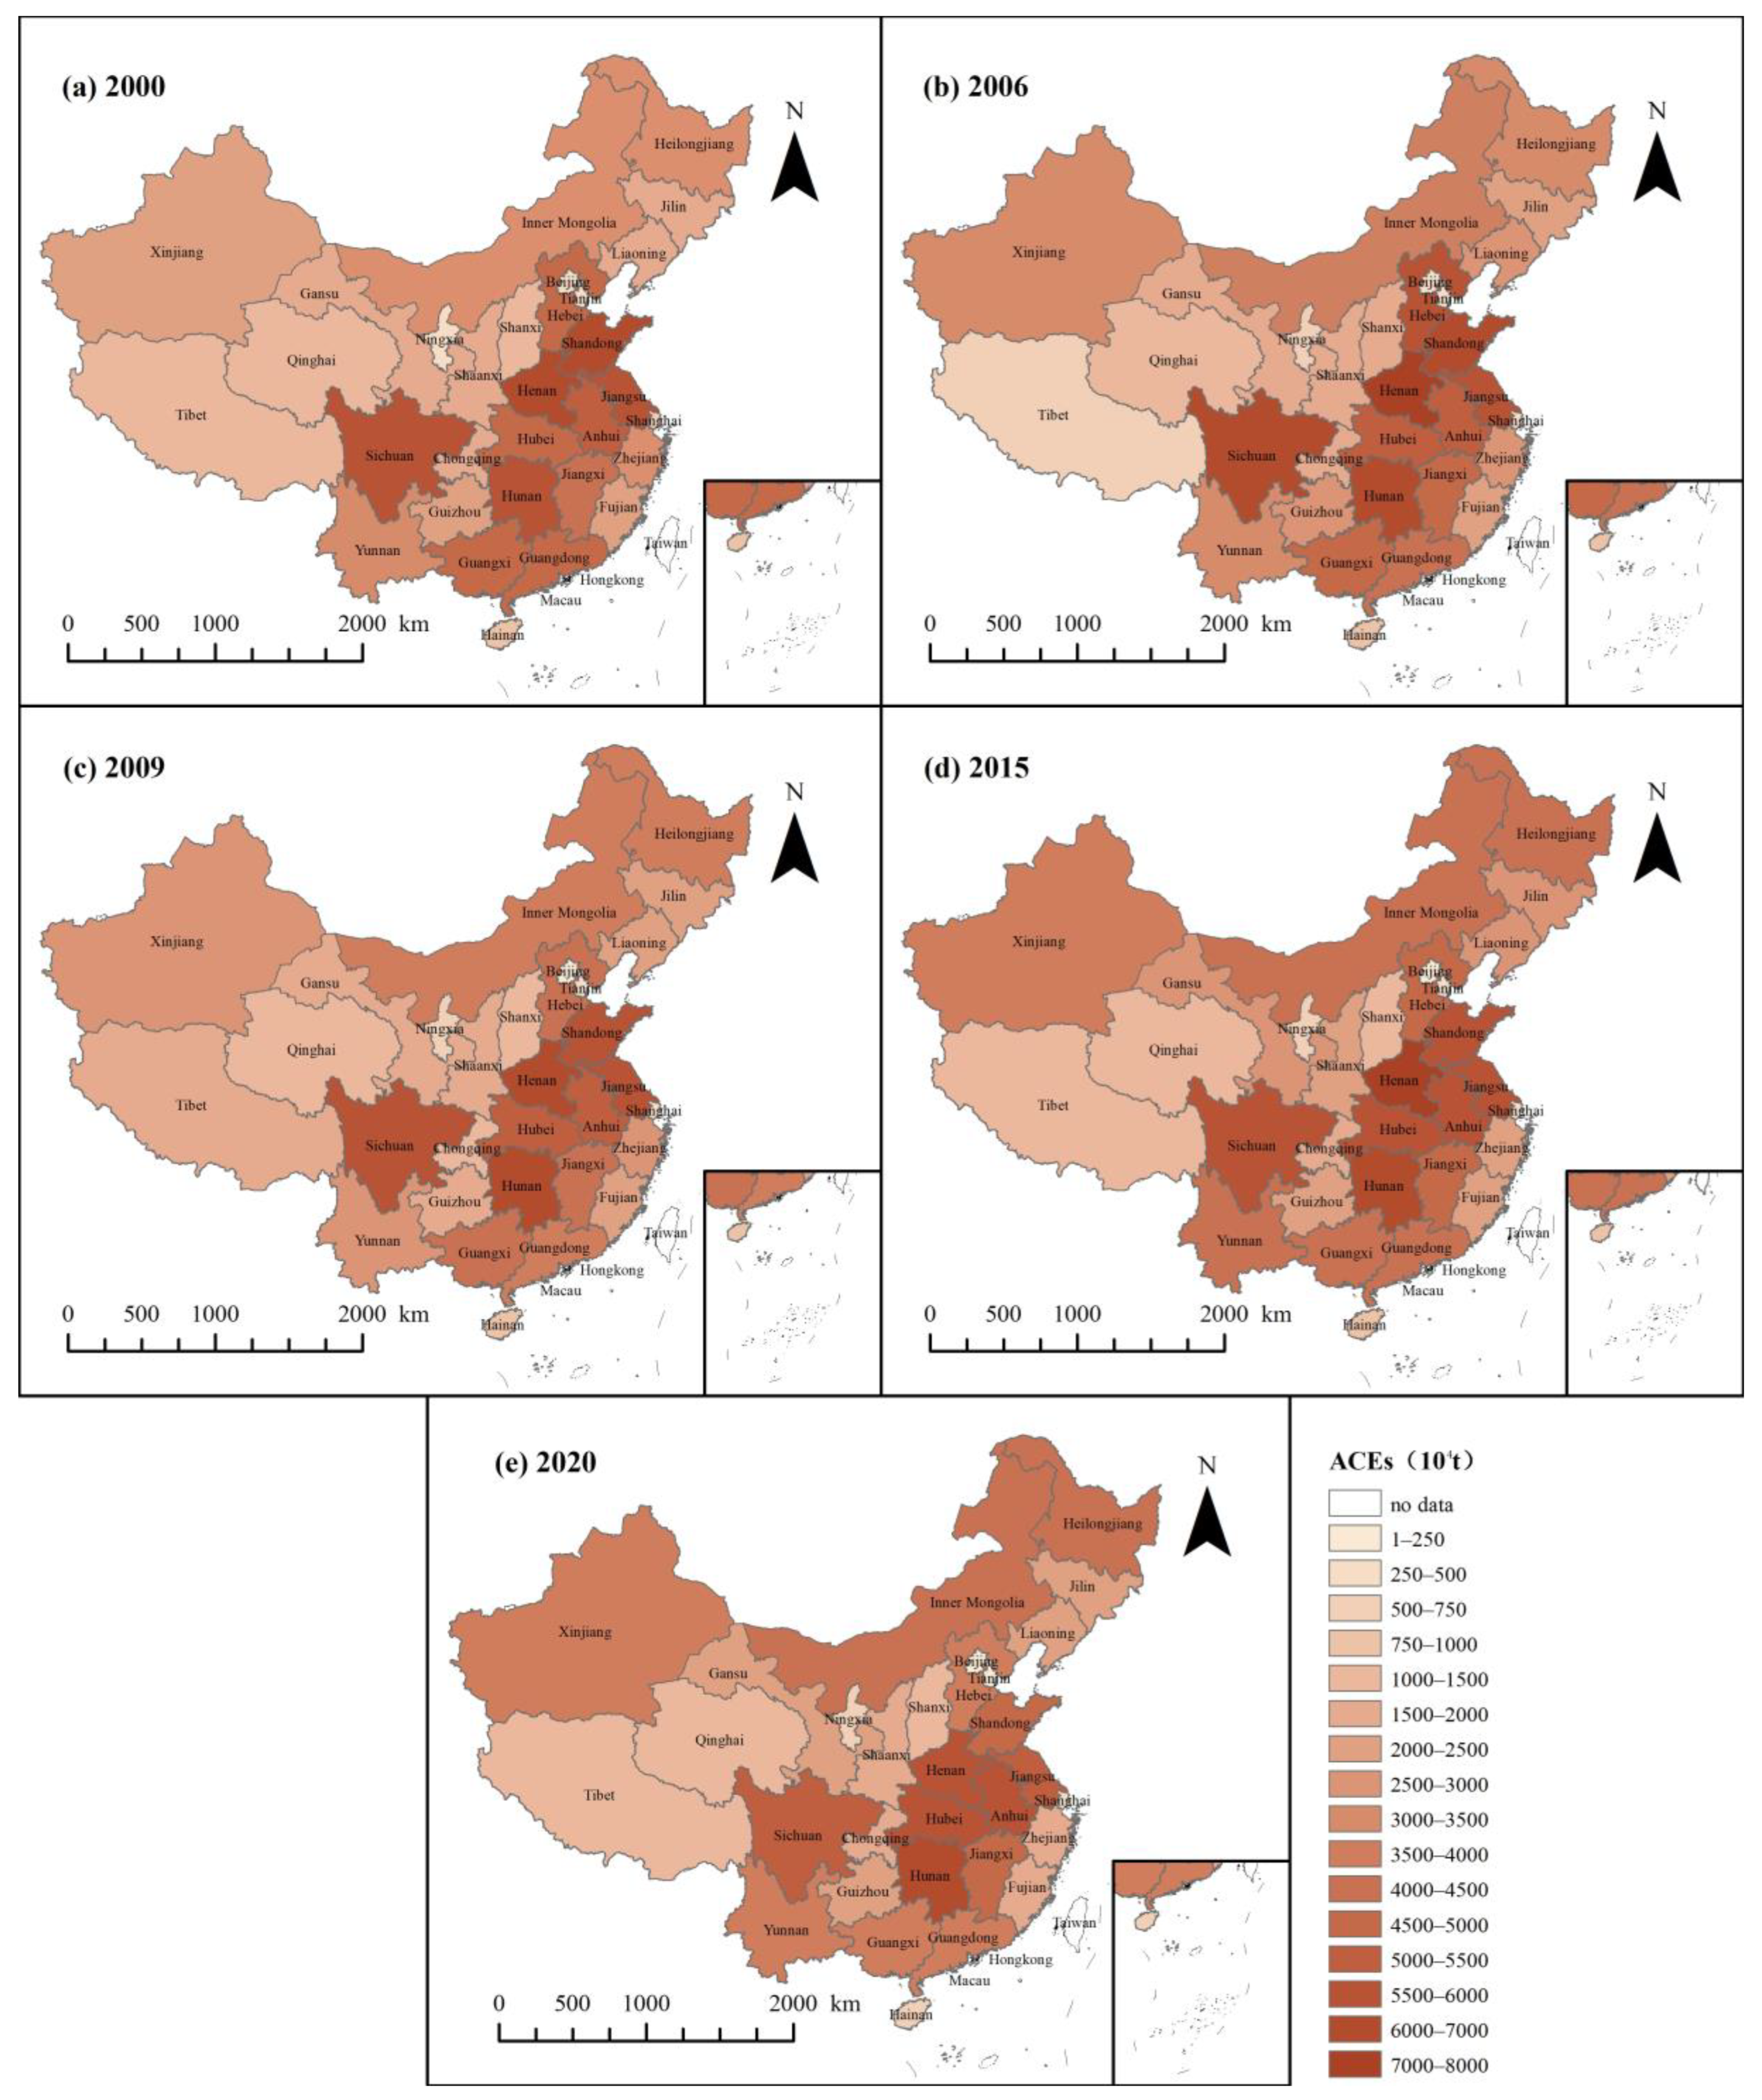
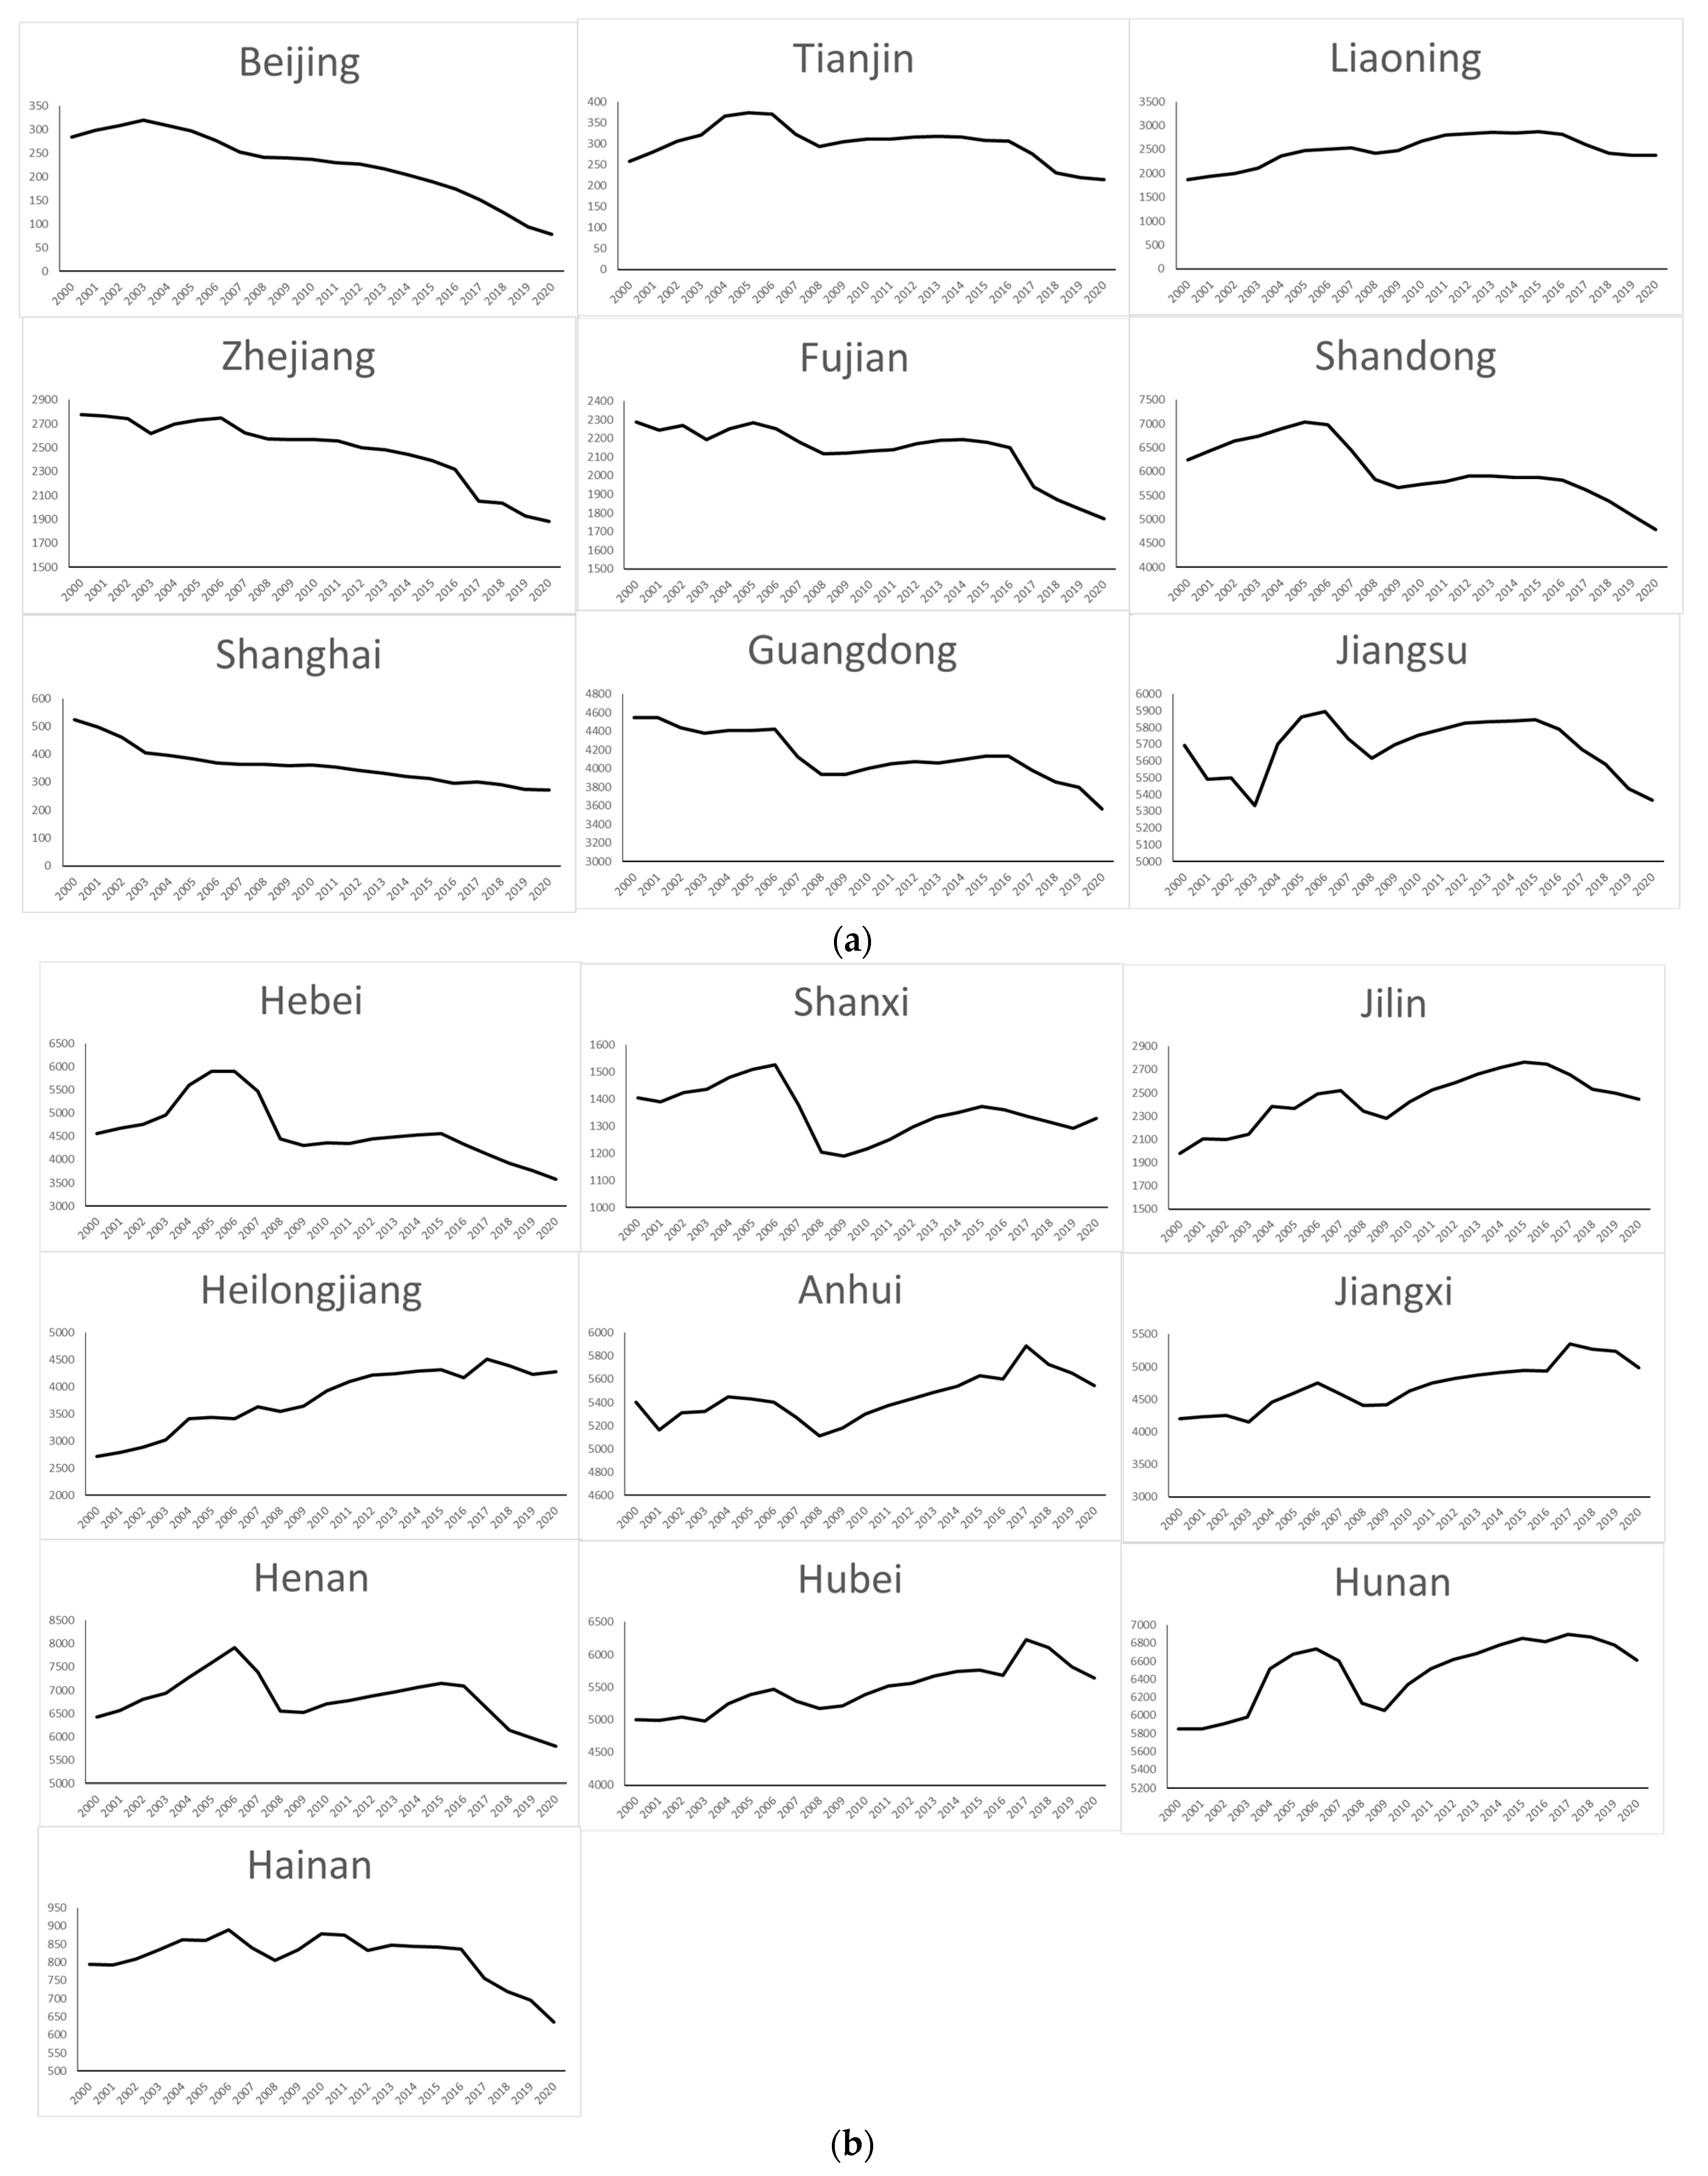
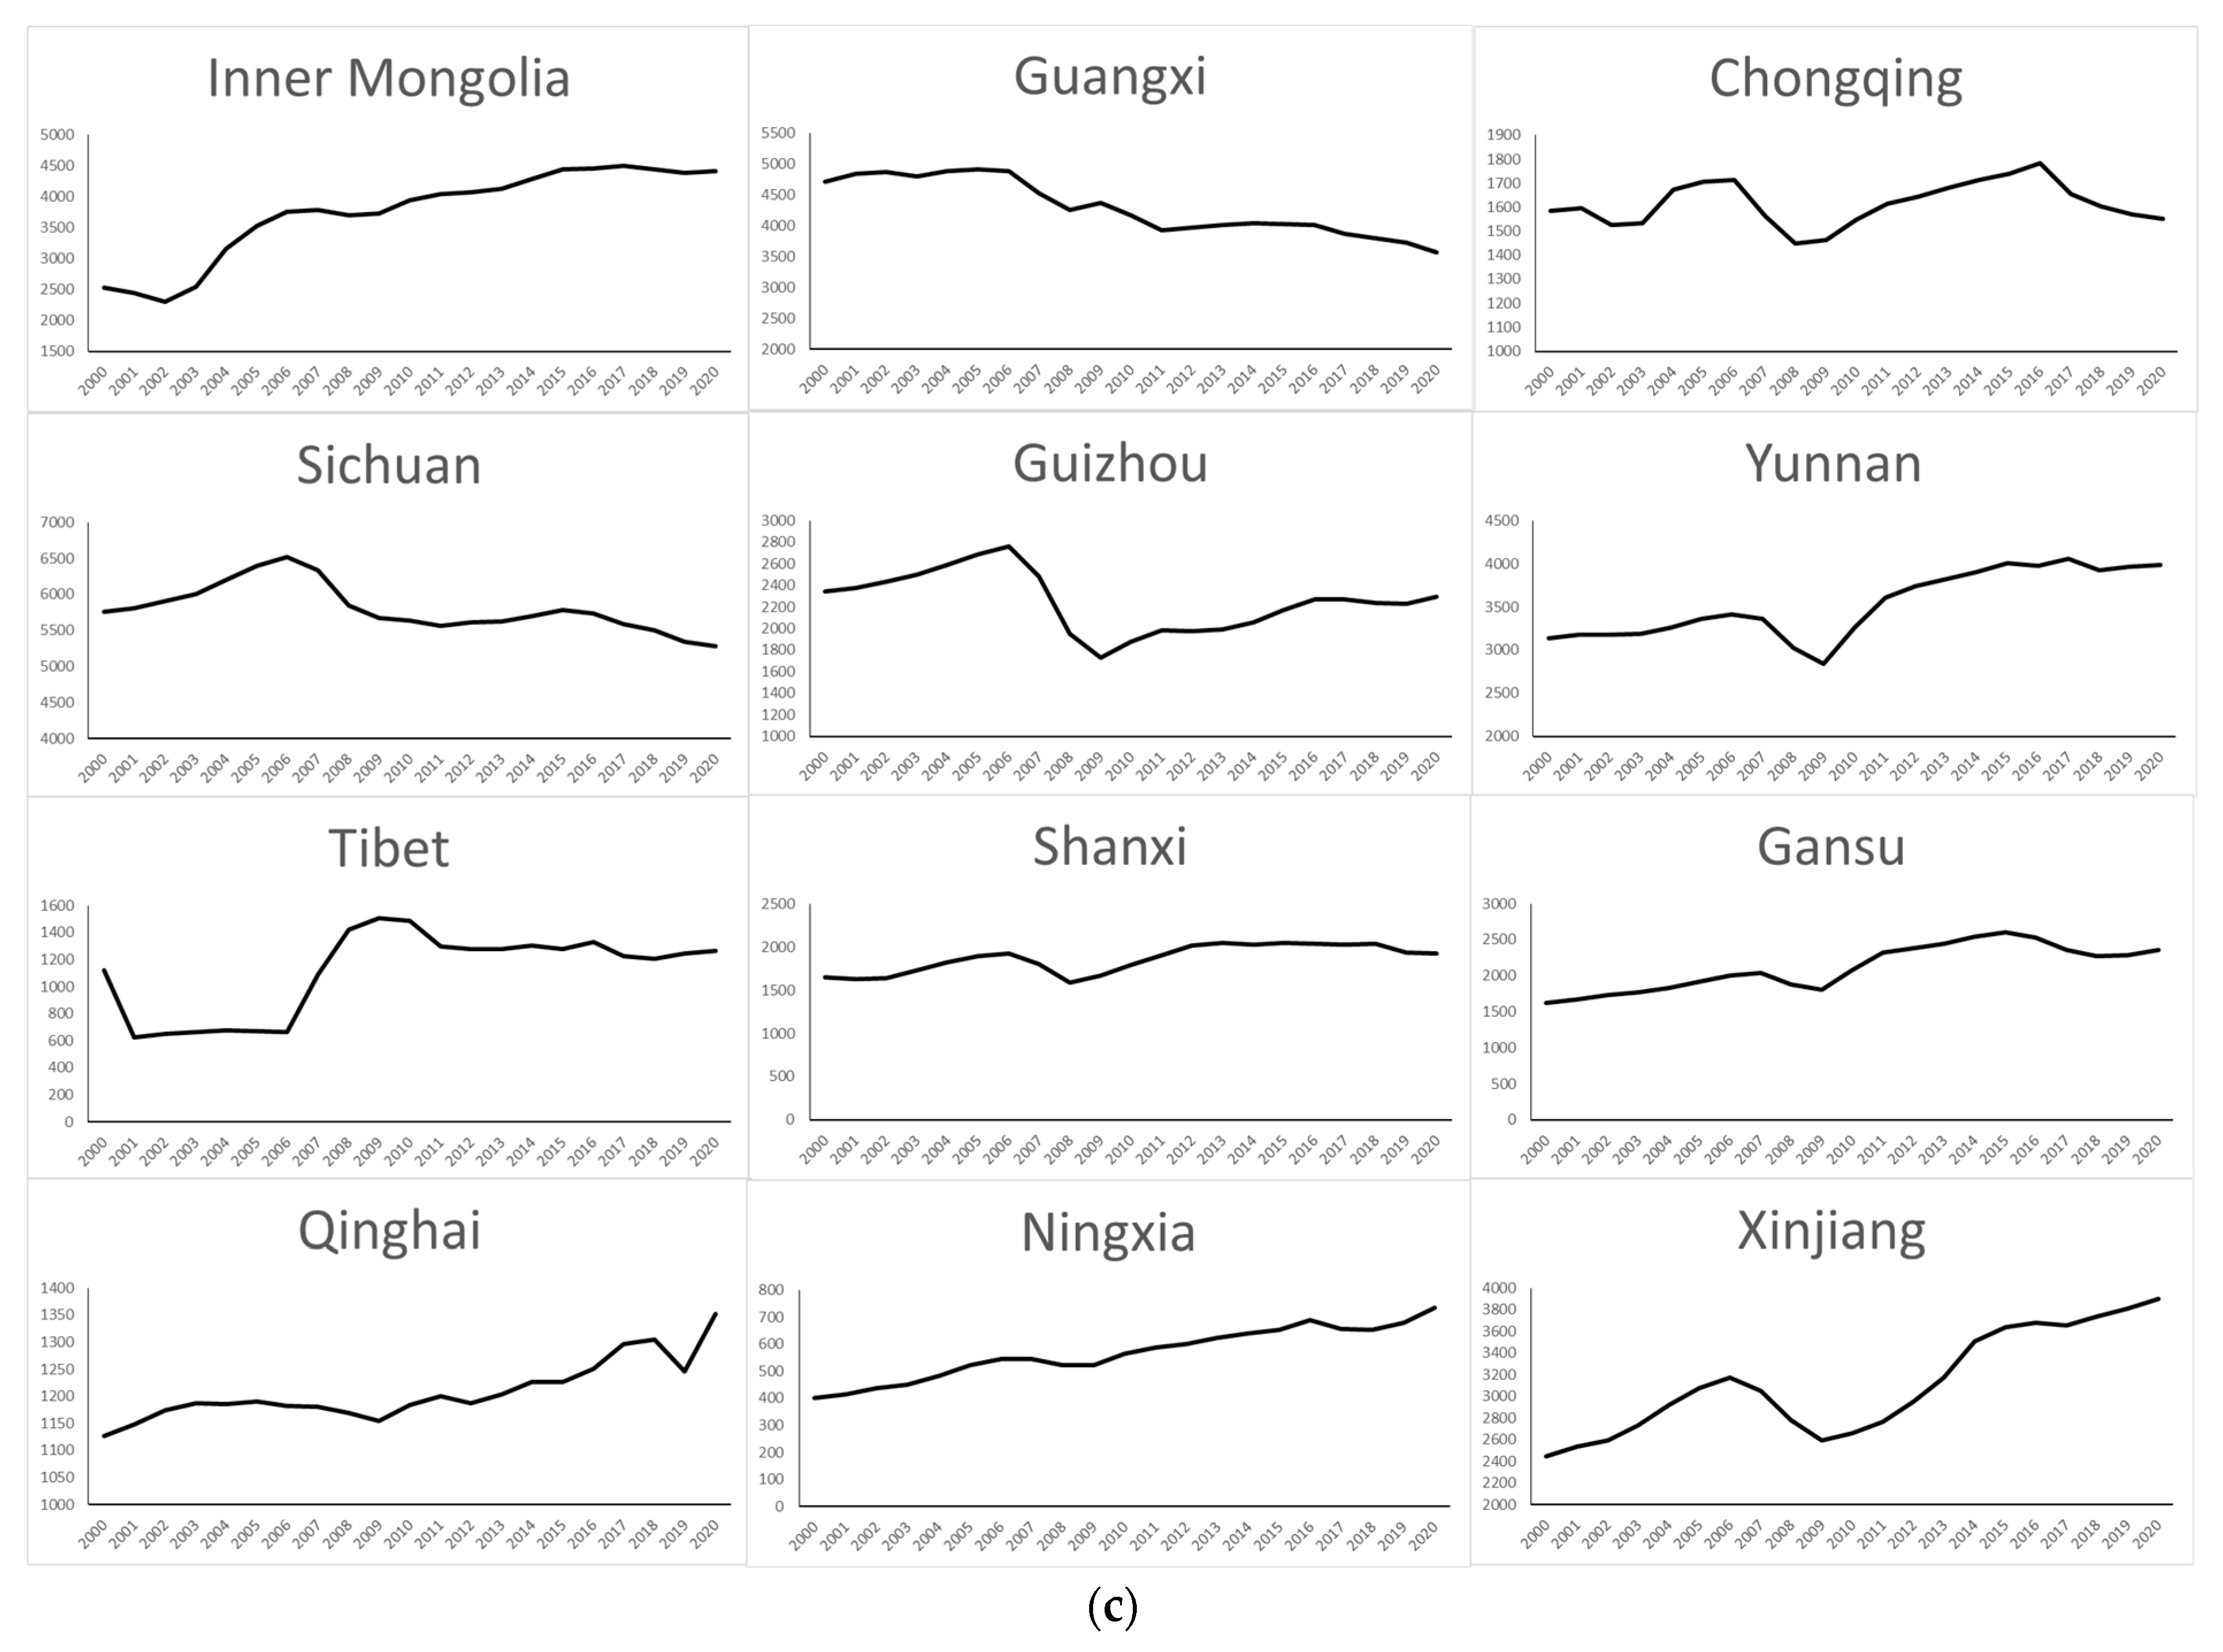
3.2. Analysis of the Spatial Variation Characteristics of ACEs
3.3. Analysis of the Dynamic Evolution Characteristics of ACEs
4. Discussion
5. Conclusions and Policy Implications
5.1. Conclusions
5.2. Policy Implications
Author Contributions
Funding
Institutional Review Board Statement
Informed Consent Statement
Data Availability Statement
Conflicts of Interest
References
- Bai, Y.; Deng, X.; Gibson, J.; Zhao, Z.; Xu, H. How does urbanization affect residential CO2 emissions? An analysis on urban agglomerations of China. J. Clean. Prod. 2019, 209, 876–885. [Google Scholar] [CrossRef]
- Chen, J.; Li, C.; Ristovski, Z.; Milic, A.; Gu, Y.; Islam, M.S.; Wang, S.; Hao, J.; Zhang, H.; He, C. A review of biomass burning: Emissions and impacts on air quality, health and climate in China. Sci. Total Environ. 2016, 579, 1000–1034. [Google Scholar] [CrossRef] [PubMed]
- Elahi, E.; Khalid, Z.; Tauni, M.Z.; Zhang, H.; Xing, L. Extreme weather events risk to crop-production and the adaptation of innovative management strategies to mitigate the risk: A retrospective survey of rural punjab, pakistan. Technovation 2021, 4, 102255. [Google Scholar] [CrossRef]
- Elahi, E.; Khalid, Z. Estimating smart energy inputs packages using hybrid optimization technique to mitigate environmental emissions of commercial fish farms. Appl. Energy 2022, 326, 119602. [Google Scholar] [CrossRef]
- Wu, H.Y.; He, Y.Q.; Chen, R. Assessment of agricultural carbon emission performance and stochastic convergence in China using SBM-Undesirable model and panel unit root test. Chin. J. Eco-Agric. 2017, 25, 1381–1391. [Google Scholar]
- Asadnabizadeh, M. Development of UN framework convention on climate change negotiations under COP25: Article 6 of the Paris Agreement perspective. Open Political Sci. 2019, 2, 113–119. [Google Scholar] [CrossRef]
- Guo, X.; Zhang, L.M.; Hu, R.G.; Song, M.W. Influencing factor decomposition of planting carbon emission in central China. Resour. Environ. Yangtze Basin 2016, 25, 695–701. [Google Scholar]
- Xu, B.; Chen, J.B. How to achieve a low-carbon transition in the heavy industry? A nonlinear perspective. Renew. Sustain. Energy Rev. 2021, 140, 110708. [Google Scholar] [CrossRef]
- Xu, B. How to efficiently reduce the carbon intensity of the heavy industry in China? Using quantile regression approach. Int. J. Environ. Res. Public Health 2022, 19, 12865. [Google Scholar] [CrossRef]
- Laborde, D.; Mamun, A.; Martin, W.; Piñeiro, V.; Vos, R. Agricultural subsidies and global greenhouse gas emissions. Nat. Commun. 2021, 12, 2601. [Google Scholar] [CrossRef]
- Guan, D.; Hubacek, K.; Weber, C.L.; Peters, G.P.; Reiner, D.M. The drivers of Chinese CO2 emissions from 1980 to 2030. Glob. Environ. Chang. 2008, 18, 626–634. [Google Scholar] [CrossRef]
- Guo, L.; Zhao, S.; Song, Y.; Tang, M.; Li, H. Green finance, chemical fertilizer use and carbon emissions from agricultural production. Agriculture 2022, 12, 313. [Google Scholar] [CrossRef]
- Bai, Y.; Deng, X.; Jiang, S.; Zhao, Z.; Miao, Y. Relationship between climate change and low-carbon agricultural production: A case study in Hebei Province. China. Ecol. Indic. 2018, 105, 438–447. [Google Scholar] [CrossRef]
- Veelen, B.V. Cash cows? Assembling low-carbon agriculture through green finance. Geoforum 2021, 118, 130–139. [Google Scholar] [CrossRef]
- Lal, R. Carbon management in agricultural soils. Mitig. Adapt. Strat. Glob. Chang 2006, 12, 303–322. [Google Scholar] [CrossRef]
- Gao, M.; Song, H. Dynamic changes and spatial agglomeration analysis of the Chinese agricultural carbon emissions per-formance. Econ. Geogr. 2015, 35, 142–148. [Google Scholar]
- Liu, J.; Diamond, J. China’s environment in a globalizing world. Nature 2005, 435, 1179–1186. [Google Scholar] [CrossRef]
- Xiong, C.; Chen, S.; Yang, D. Selecting counties to participate in agricultural carbon compensation in China. Pol. J. Environ. Stud. 2019, 28, 1443–1449. [Google Scholar] [CrossRef]
- Nurse, J.; Basher, D.; Bone, A.; Bird, W. An ecological approach to promoting population mental health and well-being—A response to the challenge of climate change. Perspect. Public Health 2010, 130, 27–33. [Google Scholar] [CrossRef]
- Goldstein, B.; Hauschild, M.Z.; Fernandez, J.; Birkved, M. Testing the environmental performance of urban agriculture as a food supply in northern climates. J. Clean. Prod. 2016, 135, 984–994. [Google Scholar] [CrossRef]
- Johnson, M.F.; Franzluebbers, A.J.; Weyers, S.L. Agricultural opportunities to mitigate greenhouse gas emissions. Environ. Pollut. 2007, 150, 107–124. [Google Scholar] [CrossRef]
- Holland, S.P.; Hughes, J.E.; Knittel, C.R.; Parker, N. Unintended consequences of transportation carbon policies: Land-use, emissions, and innovation. Energy J. 2015, 36, 35–74. [Google Scholar]
- Hiraishi, T.; Krug, T.; Tanabe, K.; Srivastava, N.; Baasansuren, J.; Fukuda, M.; Troxler, T.G. 2013 Supplement to the 2006 IPCC Guidelines for National Greenhouse Gas Inventories: Wetlands; IPCC: Georgia Batumi, Switzerland, 2014. [Google Scholar]
- West, T.O.; Marland, G. A synthesis of carbon sequestration, carbon emissions, and net carbon flux in agriculture: Comparing tillage practices in the United States. Agric. Ecosyst. Environ. 2002, 91, 217–232. [Google Scholar]
- Stocker, B.D.; Yu, Z.; Massa, C.; Joos, F. Holocene peatland and ice-core data constraints on the timing and magnitude of CO2 emissions from past land use. Proc. Natl. Acad. Sci. USA 2017, 114, 1492–1497. [Google Scholar] [PubMed]
- Venterea, R.T.; Halvorson, A.D.; Kitchen, N.; Liebig, M.; Cavigelli, M.A.; Del Grosso, S.J.; Motavalli, P.P.; Nelson, K.A.; Spokas, K.A.; Singh, B.; et al. Challenges and opportunities for mitigating nitrous oxide emissions from fertilized cropping systems. Front. Ecol. Environ. 2012, 10, 562–570. [Google Scholar] [CrossRef]
- Li, B.; Zhang, J.; Li, H. Research on spatial-temporal characteristics and affecting factors decomposition of agricultural carbon emission in China. China Popul. Resour. Environ. 2011, 21, 80–86. [Google Scholar]
- You, H.; Wu, C. Analysis of carbon emission efficiency and optimization of low carbon for agricultural land intensive use. Trans. Chin. Soc. Agric. Eng. 2014, 30, 224–234. [Google Scholar]
- Li, J. Research on Characteristics and Driving Factors of Agricultural Land Carbon Emission in Provinces of Minorities in China. China Popul. Resour. Environ. 2012, 22, 42–47. [Google Scholar]
- Yang, T.; Li, F.; Du, M.; Wang, Y.; Sun, Z. Measuring pollutant emissions of cattle breeding and its spatial-temporal variation in China. J. Environ. Manag. 2021, 299, 113615. [Google Scholar] [CrossRef]
- Wei, S.; Bai, Z.; Chadwick, D.; Hou, Y.; Qin, W.; Zhao, Z.; Jiang, R.; Ma, L. Greenhouse gas and ammonia emissions and mitigation options from livestock production in peri-urban agriculture: Beijing–A case study. J. Clean. Prod. 2018, 178, 515–525. [Google Scholar] [CrossRef]
- Liu, Y.; Liu, J.; Wu, W. Spatiotemporal dynamics of greenhouse gases emissions from livestock and poultry in Beijing area during 1978–2009. Chin. J. Eco-Agric. 2013, 21, 891–897. [Google Scholar] [CrossRef]
- Chen, X.; Di, Q.; Hou, Z.; Yu, Z. Measurement of carbon emissions from marine fisheries and system dynamics simulation analysis: China’s northern marine economic zone case. Mar. Policy 2022, 145, 105279. [Google Scholar] [CrossRef]
- Liu, G.; Xu, Y.; Ge, W.; Yang, X.; Su, X.; Shen, B.; Ran, Q. How can marine fishery enable low carbon development in China? Based on system dynamics simulation analysis. Ocean Coast. Manag. 2021, 231, 106382. [Google Scholar] [CrossRef]
- Shao, G.; Kong, H.; Yu, J.; Li, C. Decomposition of driving factors of carbon emissions from China’s marine fisheries based on LMDI method. J. Agrotech. Econ. 2015, 6, 119–128. [Google Scholar]
- Min, J.; Hu, H. Calculation of greenhouse gases emission from agricultural production in China. China Popul. Resour. Environ. 2012, 22, 21–27. [Google Scholar]
- Tian, Y.; Wu, H. Research on Fairness of Agricultural Carbon Emissions in China’s Major Grain Producing Areas from the Perspective of Industrial Structure. J. Agric. Econ. 2020, 1, 45–55. [Google Scholar]
- Pang, J.; Li, H.; Lu, C.; Lu, C.; Chen, X. Regional differences and dynamic evolution of carbon emission intensity of agriculture production in China. Int. J. Environ. Res. Public Health 2020, 17, 7541. [Google Scholar] [CrossRef]
- Liu, M.; Yang, L. Spatial pattern of China’s agricultural carbon emission performance. Ecol. Indic. 2021, 133, 108345. [Google Scholar] [CrossRef]
- Zang, D.; Hu, Z.; Yang, Y.; He, S. Research on the relationship between agricultural carbon emission intensity, agricultural economic development and agricultural trade in China. Sustainability 2022, 14, 11694. [Google Scholar] [CrossRef]
- Zhu, Y.; Huo, C. The impact of agricultural production efficiency on agricultural carbon emissions in China. Energies 2022, 15, 4464. [Google Scholar] [CrossRef]
- Han, H.; Zhong, Z.; Guo, Y.; Xi, F.; Liu, S. Coupling and decoupling effects of agricultural carbon emissions in China and their driving factors. Environ. Sci. Pollut. Res. 2018, 25, 25280–25293. [Google Scholar] [CrossRef]
- Huang, X.; Xu, X.; Wang, Q.; Zhang, L.; Gao, X.; Chen, L. Assessment of agricultural carbon emissions and their spatiotemporal changes in China, 1997–2016. Int. J. Environ. Res. Public Health 2019, 16, 3105. [Google Scholar] [CrossRef]
- Wen, S.; Hu, Y.; Liu, H. Measurement and Spatial–Temporal Characteristics of Agricultural Carbon Emission in China: An Internal Structural Perspective. Agriculture 2022, 12, 1749. [Google Scholar] [CrossRef]
- Wang, G.; Liao, M.; Jiang, J. Research on Agricultural Carbon Emissions and Regional Carbon Emissions Reduction Strategies in China. Sustainability 2022, 12, 2627. [Google Scholar] [CrossRef]
- Yang, S.; Li, Y.; Yan, S. An empirical analysis of the decoupling relationship between agricultural carbon emission and economic growth in Jilin province. IOP Conf. Ser. Mater. Sci. Eng. 2018, 392, 062101. [Google Scholar]
- Sun, Q. Ecological agriculture development and spatial and temporal characteristics of carbon emissions of land use. Appl. Ecol. Environ. Res. 2019, 17, 11045–11053. [Google Scholar] [CrossRef]
- Liu, X.; Yu, Y.; Luan, S. Empirical study on the decomposition of carbon emission factors in agricultural energy consumption. IOP Conf. Ser. Earth Environ. Sci. 2019, 252, 042045. [Google Scholar] [CrossRef]
- Chen, Y.; Li, M.; Su, K.; Li, X. Spatial-temporal characteristics of the driving factors of agricultural carbon emissions: Empirical evidence from Fujian, China. Energies 2019, 12, 3102. [Google Scholar] [CrossRef]
- Zhang, L.; Pang, J.; Chen, X.; Lu, Z. Carbon emissions, energy consumption and economic growth: Evidence from the ag-ricultural sector of China’s main grain-producing areas. Sci. Total Environ. 2019, 665, 1017–1025. [Google Scholar] [CrossRef]
- Chen, X.; Shuai, C.; Wu, Y.; Zhang, Y. Analysis on the carbon emission peaks of China’s industrial, building, transport, and agricultural sectors. Sci. Total Environ. 2020, 709, 135768. [Google Scholar] [CrossRef]
- Akiyama, H.; Yan, X.; Yagi, K. Evaluation of effectiveness of enhanced-efficiency fertilizers as mitigation options for N2O and NO emissions from agricultural soils: Meta-analysis. Glob. Chang. Biol. 2010, 16, 1837–1846. [Google Scholar] [CrossRef]
- Balsalobre-Lorente, D.; Driha, O.M.; Bekun, F.V.; Osundina, O. Do agricultural activities induce carbon emissions? The BRICS experience. Environ. Sci. Pollut. Res. 2019, 26, 25218–25234. [Google Scholar] [CrossRef]
- Intergovernmental Panel on Climate Change. Special Report on Climate Change and Land. In Proceedings of the Intergovernmental Panel on Climate Change (IPCC), Geneva, Switzerland, 2–6 August 2019; IPCC: Georgia Batumi, Switzerland, 2019. [Google Scholar]
- Frank, S.; Havlik, P.; Stehfest, E.; Van Meijl, H.; Witzke, P.; Pérez-Domínguez, I.; Van Dijk, M.; Doelman, J.C.; Fellmann, T.; Koopman, J.F.L.; et al. Agricultural non-CO2 emission reduction potential in the context of the 1.5 °C target. Nat. Clim. Chang. 2018, 9, 66–72. [Google Scholar] [CrossRef]
- Wang, J.; Rothausen, S.G.S.A.; Conway, D.; Zhang, L.; Xiong, W.; Holman, I.P.; Li, Y. China’s water-energy nexus: Green-house-gas emissions from groundwater use for agriculture. Environ. Res. Lett. 2012, 7, 014035. [Google Scholar] [CrossRef]
- Dumortier, J.; Hayes, D.J.; Carriquiry, M.; Dong, F.; Du, X.; Elobeid, A.; Tokgoz, S.; Fabiosa, J.F. Sensitivity of carbon emission estimates from indirect land-use change. Appl. Econ. Perspect. Policy 2011, 33, 428–448. [Google Scholar] [CrossRef]
- De Souza, J.P.; Bortolon, E.S.O.; Bortolon, L.; De Camargo, F.P.; Conceição, W.S.S.; Lima, A.D.O.; Vezzani, F.M. Carbon dioxide emissions in agricultural systems in the Brazilian Savanna. J. Agric. Sci. 2019, 11, 242. [Google Scholar] [CrossRef]
- Zhou, J.; Jiang, M.; Chen, G. Estimation of methane and nitrous oxide emission from livestock and poultry in China during 1949–2003. Energy Policy 2007, 35, 3759–3767. [Google Scholar] [CrossRef]
- Khalil, M.; Shearer, M.; Rasmussen, R. Methane sources in China: Historical and current emissions. Chemosphere 1993, 26, 127–142. [Google Scholar] [CrossRef]
- Yamaji, K.; Ohara, T.; Akimoto, H. A country-specific, high-resolution emission inventory for methane from livestock in Asia in 2000. Atmos. Environ. 2003, 37, 4393–4406. [Google Scholar] [CrossRef]
- Qiao, H.; Zheng, F.; Jiang, H.; Dong, K. The greenhouse effect of the agriculture economic growth-renewable energy nexus: Evidence from G20 countries. Sci. Total Environ. 2019, 671, 722–731. [Google Scholar] [CrossRef]
- Wang, Z.P. Estimation of nitrous oxide emission of farmland in China. Rural Eco-Environ. 1997, 13, 51–55. [Google Scholar]
- Tian, Y.; Yin, M. Re-evaluation of China’s agricultural carbon emissions: Basic status, dynamic evolution and spatial spillover effects. Chin. Rural. Econ. 2022, 3, 104–127. [Google Scholar]
- Yang, H.; Wang, X.; Bin, P. Agriculture carbon-emission reduction and changing factors behind agricultural eco-efficiency growth in China. J. Clean. Prod. 2022, 334, 130193. [Google Scholar] [CrossRef]
- Liao, Y.; Wei, Y. Rural social justice construction since the 18th National Congress of the Communist Party of China. J. Agro-For. Econ. Manag. 2019, 18, 702–708. [Google Scholar]
- Xu, H.; Huang, X.; Zhong, T.; Chen, Z.; Yu, J. Chinese land policies and farmers’ adoption of organic fertilizer for saline soils. Land Use Policy 2014, 38, 541–549. [Google Scholar] [CrossRef]
- Xu, J.; Huang, D.; He, Z.; Zhu, Y. Research on the structural features and influential factors of the spatial network of China’s regional ecological efficiency spillover. Sustainability 2020, 12, 3137. [Google Scholar] [CrossRef]
- Shen, J.; Zhu, Q.; Jiao, X.; Ying, H.; Wang, H.; Wen, X.; Xu, W.; Li, T.; Cong, W.; Liu, X.; et al. Agriculture green development: A model for China and the World. Front. Agric. Sci. Eng. 2020, 7, 5–13. [Google Scholar] [CrossRef]
- Zheng, D.; Hao, S.; Sun, C.; Lyu, L. Spatial correlation and convergence analysis of eco-efficiency in China. Sustainability 2019, 11, 2490. [Google Scholar] [CrossRef]
- Guan, X.; Zhang, J.; Wu, X.; Cheng, L. The shadow prices of carbon emissions in China’s planting industry. Sustainability 2018, 10, 753. [Google Scholar] [CrossRef]
- Li, Z.; Li, J. The influence mechanism and spatial effect of carbon emission intensity in the agricultural sustainable supply: Evidence from China’s grain production. Environ. Sci. Pollut. Res. 2022, 29, 44442–44460. [Google Scholar] [CrossRef]
- Wang, G.; Liu, P.; Hu, J.; Zhang, F. Spatiotemporal Patterns and influencing factors of agriculture methane emissions in China. Agriculture 2022, 12, 1573. [Google Scholar] [CrossRef]
- Guo, H.; Fan, B.; Pan, C. Study on mechanisms underlying changes in agricultural carbon emissions: Acase in Jilin Province, China, 1998–2018. Int. J. Environ. Res. Public Health 2021, 18, 919. [Google Scholar] [CrossRef]
- Huang, H.; Zhu, N. Rural financial efficiency, agricultural technological progress and agricultural carbon emissions: Evidence from China. Nat. Environ. Poll. Technol. 2022, 21, 61–69. [Google Scholar] [CrossRef]


| Region | Early Rice | Late Rice | Semilate Rice | Region | Early Rice | Late Rice | Semilate Rice |
|---|---|---|---|---|---|---|---|
| Beijing | 0 | 0 | 13.23 | Hubei | 17.51 | 39 | 58.17 |
| Tianjin | 0 | 0 | 11.34 | Hunan | 14.71 | 34.1 | 56.28 |
| Hebei | 0 | 0 | 15.33 | Guangdong | 15.05 | 51.6 | 57.02 |
| Shanxi | 0 | 0 | 6.62 | Guangxi | 12.41 | 49.1 | 47.78 |
| Inner Mongolia | 0 | 0 | 8.93 | Hainan | 13.43 | 49.4 | 52.29 |
| Liaoning | 0 | 0 | 9.24 | Chongqing | 6.55 | 18.5 | 25.73 |
| Jilin | 0 | 0 | 5.57 | Sichuan | 6.55 | 18.5 | 25.73 |
| Heilongjiang | 0 | 0 | 8.31 | Guizhou | 5.1 | 21 | 22.05 |
| Shanghai | 12.41 | 27.5 | 53.87 | Yunnan | 2.38 | 7.6 | 7.25 |
| Jiangsu | 16.07 | 27.6 | 53.55 | Tibet | 0 | 0 | 6.83 |
| Zhejiang | 14.37 | 34.5 | 57.96 | Shanxi | 0 | 0 | 12.51 |
| Anhui | 16.75 | 27.6 | 51.24 | Gansu | 0 | 0 | 6.83 |
| Fujian | 7.74 | 52.6 | 43.47 | Qinghai | 0 | 0 | 0 |
| Jiangxi | 15.47 | 45.8 | 65.42 | Ningxia | 0 | 0 | 7.35 |
| Shandong | 0 | 0 | 21 | Xinjiang | 0 | 0 | 10.5 |
| Henan | 0 | 0 | 17.85 |
| Rice | Spring Wheat | Winter Wheat | Soybean | Corn | Vegetables | Other Dryland Crops | |
|---|---|---|---|---|---|---|---|
| Coefficient | 0.24 | 0.4 | 1.75 | 2.29 | 2.53 | 4.94 | 0.95 |
| Coefficient | Coefficient | ||
|---|---|---|---|
| Fertilizer | 0.8956 kg C/kg | Diesel Fuel | 0.5927 kg C/kg |
| Pesticides | 4.9341 kg C/kg | Plowing | 312.6 kg C/km2 |
| Agricultural Plastic Films | 5.18 kg C/kg | Irrigation | 266.48 kg C/km2 |
| Coefficient of CH4 | Coefficient of N2O | Coefficient of CH4 | Coefficient of N2O | ||||
|---|---|---|---|---|---|---|---|
| Intestinal Fermentation | Fecal Discharge | Fecal Discharge | Intestinal Fermentation | Fecal Discharge | Fecal Discharge | ||
| Cows | 68 | 16 | 1 | Horses | 18 | 1.64 | 1.39 |
| Buffaloes | 55 | 2 | 1.34 | Pigs | 1 | 3.5 | 0.53 |
| Cattle | 47.8 | 1 | 1.39 | Sheep | 5 | 0.16 | 0.33 |
| Mules | 10 | 0.9 | 1.39 | Rabbits | 0.254 | 0.08 | 0.02 |
| Camels | 46 | 1.92 | 1.39 | Poultry | - | 0.02 | 0.02 |
| Donkeys | 10 | 0.9 | 1.39 | ||||
| Rice Cultivation | Soil | Agricultural Materials | Livestock and Poultry Breeding | Rice Cultivation | Soil | Agricultural Materials | Livestock and Poultry Breeding | ||
|---|---|---|---|---|---|---|---|---|---|
| 2000 | 23,449 | 7648 | 21,757 | 38,396 | 2011 | 23,569 | 8884 | 31,044 | 33,367 |
| 2001 | 22,620 | 7807 | 22,491 | 38,407 | 2012 | 23,501 | 9259 | 31,801 | 33,754 |
| 2002 | 22,486 | 7913 | 23,040 | 38,943 | 2013 | 23,534 | 9245 | 32,346 | 34,343 |
| 2003 | 21,404 | 7907 | 23,561 | 40,431 | 2014 | 23,553 | 9402 | 32,847 | 35,051 |
| 2004 | 22,909 | 7923 | 25,111 | 42,790 | 2015 | 23,622 | 9555 | 32,982 | 35,773 |
| 2005 | 23,307 | 8102 | 26,010 | 44,063 | 2016 | 23,610 | 9315 | 32,605 | 35,592 |
| 2006 | 23,466 | 8178 | 26,884 | 44,331 | 2017 | 24,708 | 9533 | 31,851 | 34,023 |
| 2007 | 23,082 | 8115 | 28,014 | 40,121 | 2018 | 24,624 | 9602 | 30,580 | 32,689 |
| 2008 | 23,290 | 8296 | 28,384 | 32,759 | 2019 | 24,419 | 9730 | 29,299 | 31,938 |
| 2009 | 23,465 | 8554 | 29,292 | 30,768 | 2020 | 23,660 | 9909 | 28,436 | 31,806 |
| 2010 | 23,522 | 8721 | 30,215 | 32,679 |
| 2000 | 2006 | 2009 | 2015 | 2020 | 2000 | 2006 | 2009 | 2015 | 2020 | ||
|---|---|---|---|---|---|---|---|---|---|---|---|
| Beijing | 0.31 | 0.27 | 0.26 | 0.19 | 0.08 | Hubei | 5.47 | 5.32 | 5.66 | 5.65 | 6.01 |
| Tianjin | 0.28 | 0.36 | 0.33 | 0.30 | 0.23 | Hunan | 6.41 | 6.55 | 6.58 | 6.72 | 7.04 |
| Hebei | 4.99 | 5.73 | 4.68 | 4.48 | 3.81 | Guangdong | 4.98 | 4.30 | 4.27 | 4.05 | 3.80 |
| Shanxi | 1.54 | 1.49 | 1.29 | 1.35 | 1.42 | Guangxi | 5.16 | 4.75 | 4.74 | 3.96 | 3.81 |
| Inner Mongolia | 2.77 | 3.66 | 4.06 | 4.37 | 4.70 | Hainan | 0.87 | 0.86 | 0.91 | 0.83 | 0.68 |
| Liaoning | 2.04 | 2.44 | 2.69 | 2.81 | 2.54 | Chongqing | 1.74 | 1.67 | 1.59 | 1.70 | 1.65 |
| Jilin | 2.17 | 2.42 | 2.48 | 2.71 | 2.61 | Sichuan | 6.32 | 6.34 | 6.17 | 5.67 | 5.63 |
| Heilongjiang | 2.97 | 3.32 | 3.97 | 4.23 | 4.57 | Guizhou | 2.57 | 2.68 | 1.88 | 2.13 | 2.45 |
| Shanghai | 0.58 | 0.36 | 0.39 | 0.31 | 0.29 | Yunnan | 3.44 | 3.31 | 3.09 | 3.93 | 4.25 |
| Jiangsu | 6.24 | 5.73 | 6.19 | 5.73 | 5.72 | Tibet | 1.23 | 0.64 | 1.64 | 1.25 | 1.35 |
| Zhejiang | 3.04 | 2.67 | 2.79 | 2.35 | 2.01 | Shanxi | 1.81 | 1.87 | 1.81 | 2.01 | 2.05 |
| Anhui | 5.92 | 5.25 | 5.63 | 5.52 | 5.91 | Gansu | 1.78 | 1.94 | 1.96 | 2.55 | 2.51 |
| Fujian | 2.51 | 2.19 | 2.31 | 2.14 | 1.89 | Qinghai | 1.24 | 1.15 | 1.25 | 1.20 | 1.44 |
| Jiangxi | 4.61 | 4.62 | 4.80 | 4.85 | 5.31 | Ningxia | 0.44 | 0.53 | 0.57 | 0.64 | 0.78 |
| Shandong | 6.84 | 6.79 | 6.15 | 5.77 | 5.11 | Xinjiang | 2.68 | 3.09 | 2.81 | 3.57 | 4.16 |
| Henan | 7.05 | 7.70 | 7.08 | 7.02 | 6.18 |
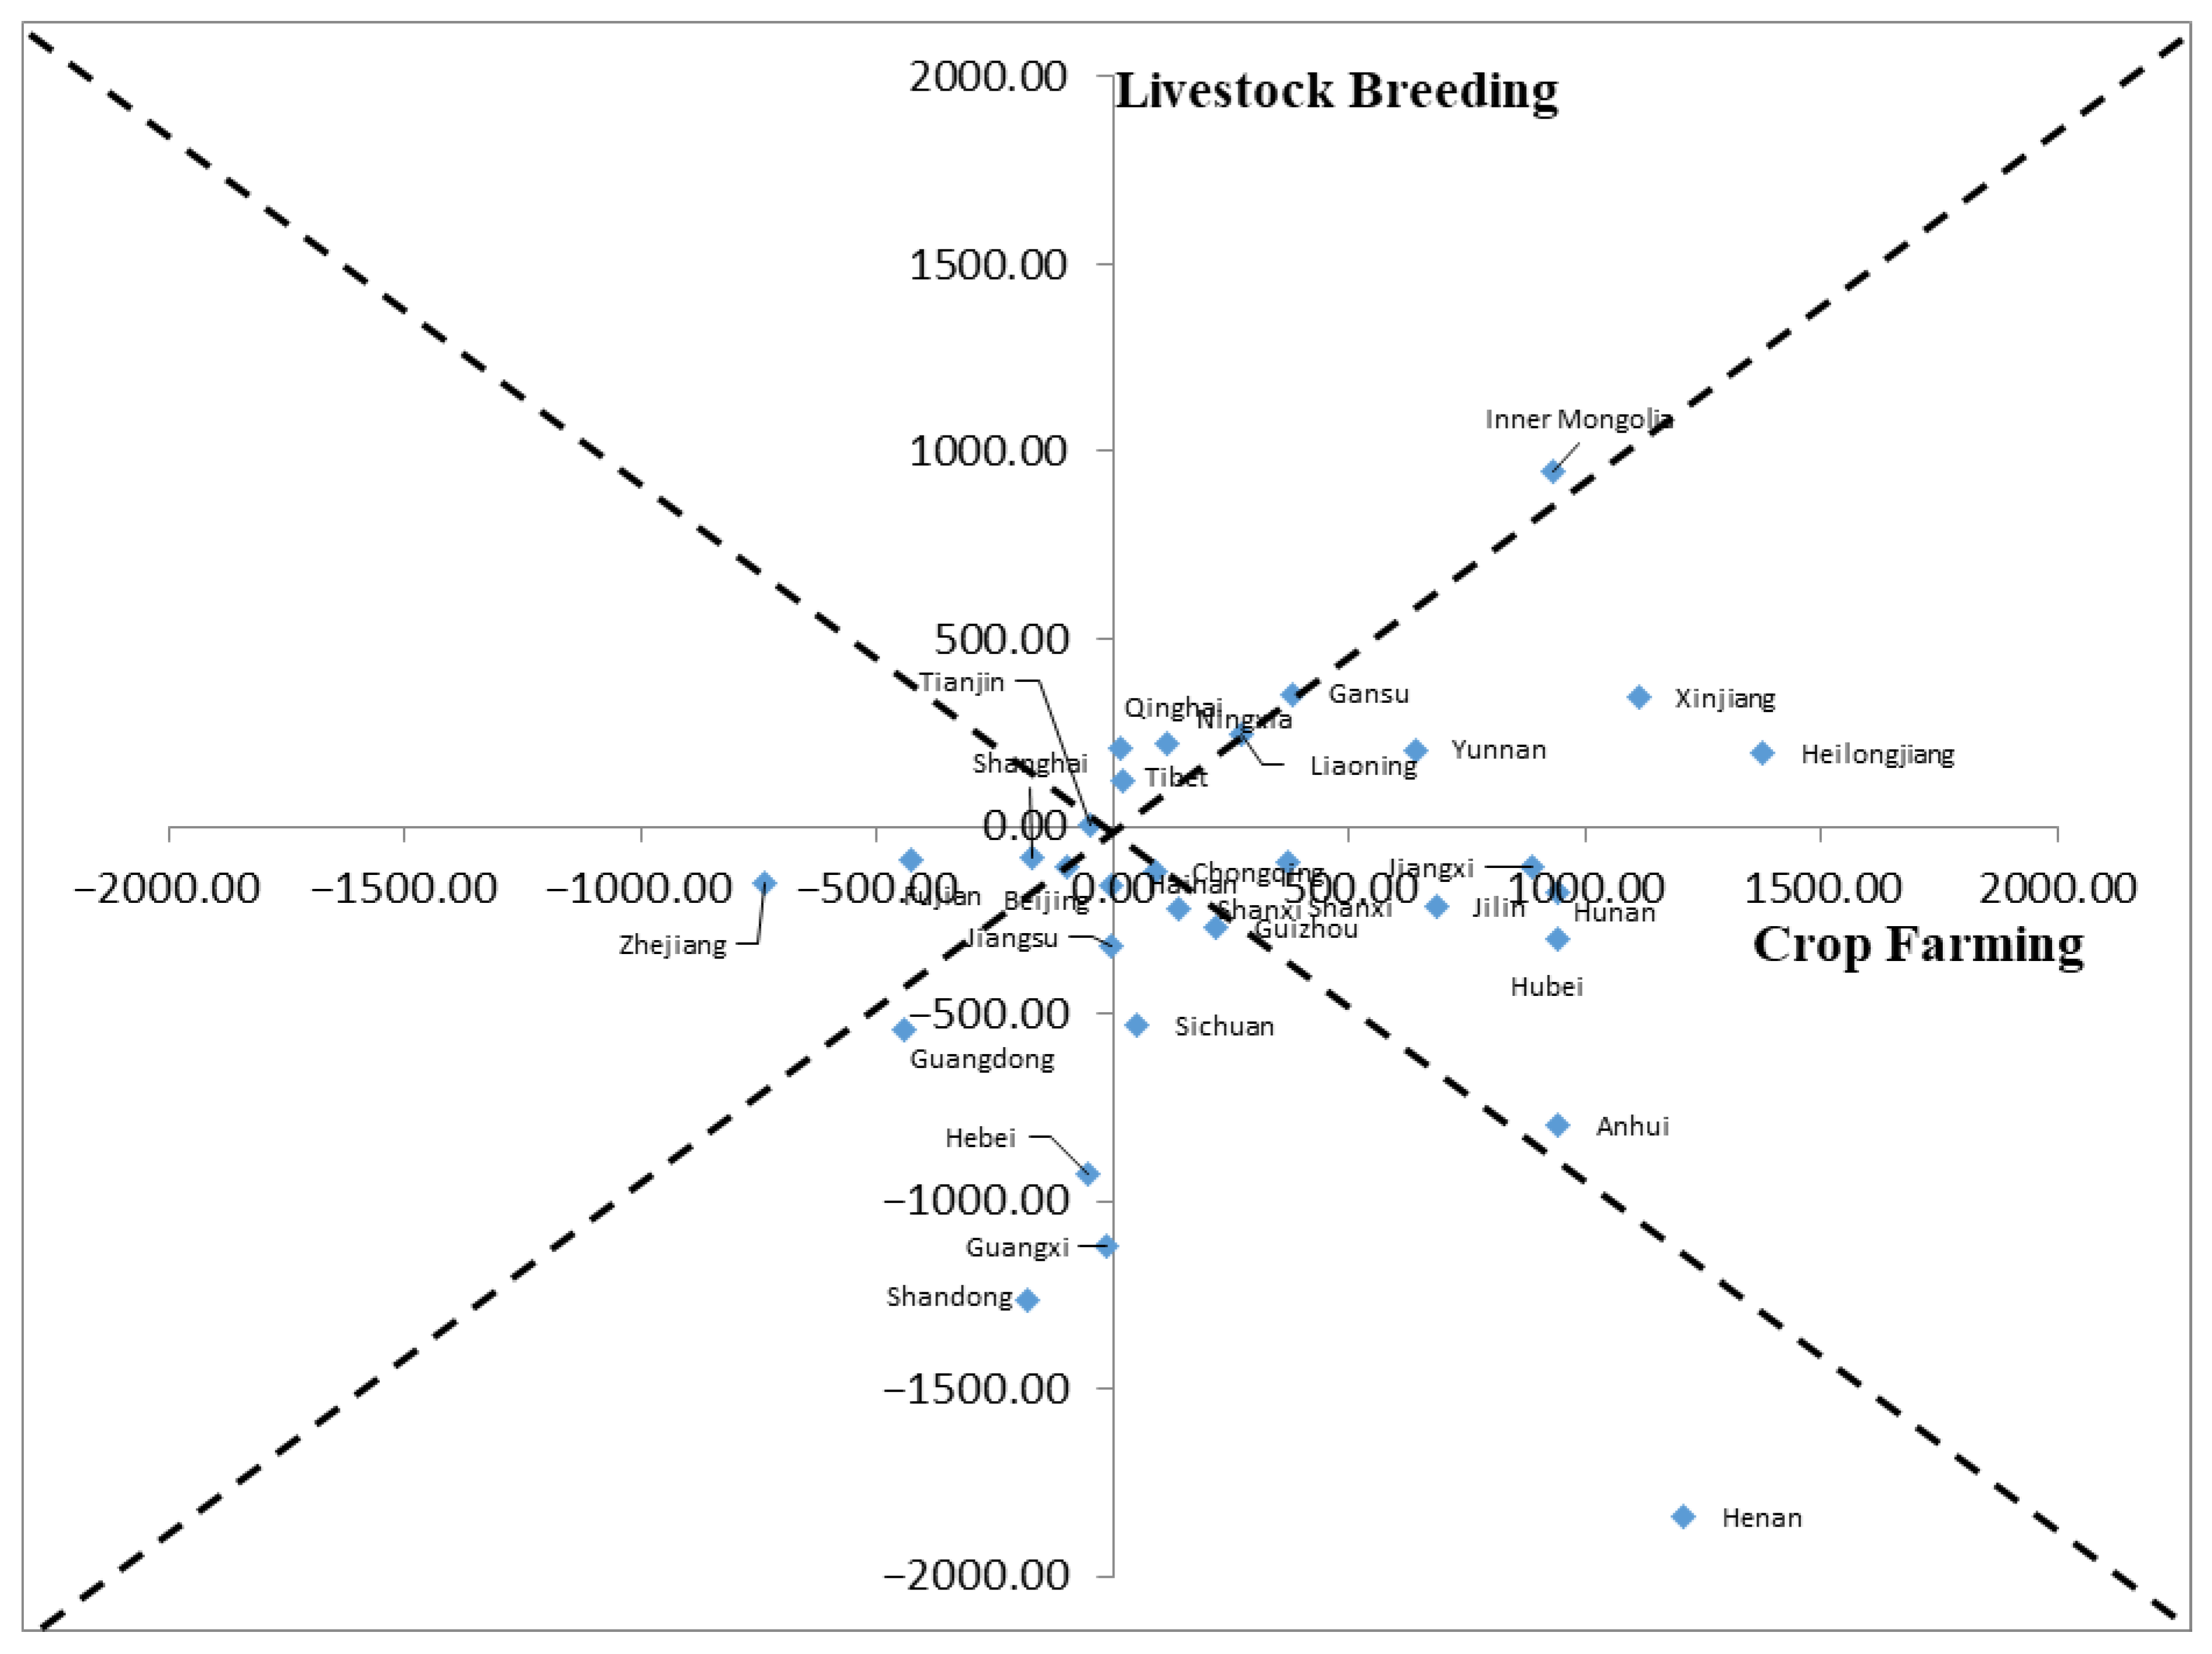
| Livestock Breeding | Crop Farming | ||||
|---|---|---|---|---|---|
| Total | Rice Cultivation | Soil | Agricultural Materials | ||
| Beijing | −110.13 | −95.5 | −4.6 | −27.8 | −63.11 |
| Tianjin | 4.6 | −48.28 | 5.1 | −12.01 | −41.37 |
| Hebei | −925.16 | −52.89 | −24.99 | −24.65 | −3.25 |
| Shanxi | −217.65 | 139.72 | −0.35 | 12.9 | 127.17 |
| Inner Mongolia | 948.43 | 930.91 | 9.49 | 234.38 | 687.04 |
| Liaoning | 247.9 | 272.09 | 7.09 | 61.85 | 203.14 |
| Jilin | −216.13 | 683.06 | 35.14 | 114.04 | 533.88 |
| Heilongjiang | 196.66 | 1374.52 | 470.83 | 338.87 | 564.82 |
| Shanghai | −80.88 | −172.67 | −89.2 | −14.79 | −68.68 |
| Jiangsu | −320.46 | −4.99 | 5.81 | 56.12 | −66.92 |
| Zhejiang | −154.09 | −739.73 | −761.4 | 4.19 | 17.48 |
| Anhui | −799.85 | 941.14 | 570.81 | 75.89 | 294.44 |
| Fujian | −91.15 | −429.11 | −446.02 | −16.78 | 33.69 |
| Jiangxi | −107.51 | 887.67 | 807.67 | 15.8 | 64.2 |
| Shandong | −1264.95 | −179.83 | −33.76 | 29.44 | −175.5 |
| Henan | −1838.09 | 1208.96 | 70.29 | 220.96 | 917.71 |
| Hubei | −299.5 | 942.1 | 774.03 | 83.45 | 84.61 |
| Hunan | −179.64 | 939.6 | 535.61 | 107.68 | 296.31 |
| Guangdong | −540.2 | −441.85 | −684.14 | 29.26 | 213.03 |
| Guangxi | −1121.39 | −15.07 | −537.06 | 97.68 | 424.31 |
| Hainan | −155.33 | −3.12 | −144.8 | 10.31 | 131.37 |
| Chongqing | −123.56 | 88.73 | −75.72 | 45.73 | 118.72 |
| Sichuan | −530 | 52.1 | −162.7 | 127.75 | 87.05 |
| Guizhou | −267.7 | 218.86 | −46.81 | 175.48 | 90.19 |
| Yunnan | 204.91 | 639.05 | −45.73 | 263.32 | 421.46 |
| Tibet | 121.16 | 20.14 | −0.02 | 3.6 | 16.56 |
| Shanxi | −95.54 | 370.8 | −12.42 | 29.97 | 353.25 |
| Gansu | 353.94 | 380.6 | −0.65 | 63.09 | 318.16 |
| Qinghai | 207.84 | 16.82 | 0 | 9.48 | 7.34 |
| Ningxia | 218.46 | 115.06 | −2.92 | 25.42 | 92.57 |
| Xinjiang | 345.44 | 1111.48 | −8.01 | 119.77 | 999.72 |
| Livestock and Poultry Industry Dominates | Crop Farming Dominates | ||
|---|---|---|---|
| Agricultural Inputs Dominate | Rice Cultivation Dominates | ||
| Scale-up type | Qinghai, Tibet, Ningxia, Inner Mongolia | Heilongjiang, Xinjiang, Yunnan, Liaoning, Gansu | |
| Scale-up for livestock and poultry breeding—scale-down for crop farming | Tianjin | ||
| Scale-down type | Beijing, Hebei, Jiangsu, Shandong, Guangxi, Hainan | Shanghai, Zhejiang, Fujian, Guangdong | |
| Scale-up for crop farming–scale-down for livestock and poultry breeding | Shanxi, Henan, Chongqing, Sichuan, Guizhou | Jilin, Shanxi | Jiangxi, Hubei, Anhui, Hunan |
Disclaimer/Publisher’s Note: The statements, opinions and data contained in all publications are solely those of the individual author(s) and contributor(s) and not of MDPI and/or the editor(s). MDPI and/or the editor(s) disclaim responsibility for any injury to people or property resulting from any ideas, methods, instructions or products referred to in the content. |
© 2023 by the authors. Licensee MDPI, Basel, Switzerland. This article is an open access article distributed under the terms and conditions of the Creative Commons Attribution (CC BY) license (https://creativecommons.org/licenses/by/4.0/).
Share and Cite
Zhang, X.; Zhang, J.; Yang, C. Spatio-Temporal Evolution of Agricultural Carbon Emissions in China, 2000–2020. Sustainability 2023, 15, 3347. https://doi.org/10.3390/su15043347
Zhang X, Zhang J, Yang C. Spatio-Temporal Evolution of Agricultural Carbon Emissions in China, 2000–2020. Sustainability. 2023; 15(4):3347. https://doi.org/10.3390/su15043347
Chicago/Turabian StyleZhang, Xidong, Juan Zhang, and Chengbo Yang. 2023. "Spatio-Temporal Evolution of Agricultural Carbon Emissions in China, 2000–2020" Sustainability 15, no. 4: 3347. https://doi.org/10.3390/su15043347
APA StyleZhang, X., Zhang, J., & Yang, C. (2023). Spatio-Temporal Evolution of Agricultural Carbon Emissions in China, 2000–2020. Sustainability, 15(4), 3347. https://doi.org/10.3390/su15043347