Article

Effect of Mica Content on Mechanical Properties of Yili River Valley Loess under the Impact of Freezing and Thawing

1
School of Geological and Mining Engineering, Xinjiang University, Urumqi 830017, China
2
State Key Laboratory for Geomechanics and Deep Underground Engineering, Xinjiang University, Urumqi 830017, China
3
Yili Prefecture Geological Environment Monitoring Station, Urumqi 830011, China
*
Author to whom correspondence should be addressed.
Sustainability 2023, 15(4), 3329; https://doi.org/10.3390/su15043329
Submission received: 2 January 2023 / Revised: 30 January 2023 / Accepted: 9 February 2023 / Published: 11 February 2023

Abstract

:
Natural disasters, including collapse, landslides, and debris flows, commonly occur in the Yili River Valley as a result of its distinctive terrain and climate. A large proportion of these are loess landslides. Hence, studying the mechanism of their occurrence is crucial. The loess in the Yili River Valley has a high mica content. By using freeze-thaw (FT) cycling tests, unconsolidated and undrained triaxial shear tests, and FT cycling experiments, the study clarifies the impact of mica content on the mechanical properties of the loess in the Yili River Valley under FT cycling conditions. The findings demonstrated that the loess’s shear strength was negatively impacted by both the mica content and freeze-thaw cycles (FTCs). Under the same FT cycle conditions, the shear strength of the Yili Valley loess decreased with an increase in the mica content, particularly during the first ten cycles. Cohesion represented the impact of the mica content on the shear strength parameters. The cohesion decreases as the mica content increases. After ten cycles, the values of the cohesion tended to become stable, while the internal friction angle showed the opposite trend. For the same mica content, the shear strength of the Yili valley loess decreased with the increase in the number of FTCs, while the cohesion decreased, and the internal friction angle first increased and then decreased. The study’s findings might offer a theoretical foundation for preventing and reducing loess landslides in the Yili River Valley caused by FTCs and high mica content.

1. Introduction

Loess is a quaternary deposit that is commonly present in northwest China’s dry regions [1]. Xinjiang loess is distributed in the Yili River Valley, Bole, the Tacheng Basin, the north slope of the Tianshan Mountain from the south of Jinghe River to the west of Mulei, and the north slope of the Kunlun Mountain from the south of Yecheng to the west of the Andir River in Minfeng [2]. The climatic conditions of the Yili River Valley are affected by variations in the North Atlantic Ocean. Large quantities of eolian loess is distributed on both banks of the Yili River in this area [3]. In recent decades, with increasing global warming, geological disasters, such as collapses and landslides, have occurred frequently in regions of permafrost and seasonal permafrost. The loess landslides that occur in the Yili River Valley are typical to Xinjiang, owing to the special landforms, formation lithology, rock and soil structure, and contact characteristics with the underlying bedrock, and are affected by the special physical geography, climate conditions, and engineering activity. The distribution law and genetic mechanism are unique [4]. The instability mechanism of the freeze-thaw landslide has been at the forefront of research of late [5]. Ye studied the mineral composition of Yili loess and found that the lamellar mineral content represented by biotite fluctuated both on the loess plateau and in the Yili region. In general, the biotite content in Yili loess was stabler and more abundant than that in the loess plateau [6]. It is crucial to comprehend how the presence of mica affects Yili loess’s mechanical characteristics when subjected to FTCs.
At present, research in the field is confined to the determination of the soil properties. Studies on the mechanical strength and engineering behavior under the action of FTCs are few. Some scholars have studied the changes in the mechanical properties of coarse-grained soil, loess, saline soil, and soda saline alkali soil caused by FT, and they have concluded that freezing and thawing are factors that damage the mechanical strength of the soil [7,8,9,10,11,12]. The impact of the water content, temperature, and other variables on the mechanical strength of frozen soil was further investigated using the mechanical characteristics of several types of soil [13,14,15]. The microstructure of the soil mass and the micro-structural change in the loess due to FTCs had a significant effect on the structural strength of the loess [16,17,18,19]. Different scholars had different opinions on the alteration in the mechanical strength of the soil mass under FTCs. According to Li et al., an increase in FTCs resulted in a decrease in the unconfined compressive strength, elastic modulus, and cohesiveness of loess. [20,21]. Liu et al. showed that the FTCs had a limited impact on the change in the soil stress-strain curve, but they significantly attenuated the peak deviation stress [22]. Li et al. studied the changes in the stress and strain before and after freezing and thawing and believed that the interior strength of the soil structures was significantly affected by the FT impacts [23]. According to some researchers, the loess’ cohesiveness initially declined, and then tended to stabilize, as the number of FTCs rose. However, it had little impact on the internal friction angle [24,25]. Some scholars believed that when the number of FTCs increased, the cohesion and internal friction angle decreased initially and then tended to be stable [26]. Based on the current research, when the number of FTCs increased slightly, the shear strength became stable. According to Yang et al., the initial FTC had the biggest effect, and after six FTCs, the static strength and cohesion tended to stabilize [26]. Kong et al. showed that continuous FTCs reduced s the oil erosion resistance until it stabilized after approximately ten cycles [27]. Liu et al. concluded that the cohesion deteriorated during the initial FTCs but stabilized after 9–12 cycles. The internal friction angle reduced initially, then increased, and reached the minimum value in seven cycles [28].
There have been few relevant studies of the Yili loess under the impact of freezing and thawing. The impact of freezing and thawing on the properties of the Yili loess focused on its physical, mechanical, and hydraulic properties. Hao et al. studied the micro process corresponding to the macro change in the Yili loess shear strength under the dry-wet cycle process [29]. Lv et al. investigated how FTCs affected the permeability of Yili loess and conducted a quantitative study of its microstructure [30]. There has been little research on the deterioration of loess strength due to the mica content under the impact of FTCs. This study examined the mechanical characteristics of Yili loess with various mica contents while accounting for the effects of FTCs. This study aims to reveal the mechanism of a landslide disaster in Yili River Valley during the FT period and to provide a theoretical basis for the prevention and treatment of geological disasters in this area.

2. Materials and Methods
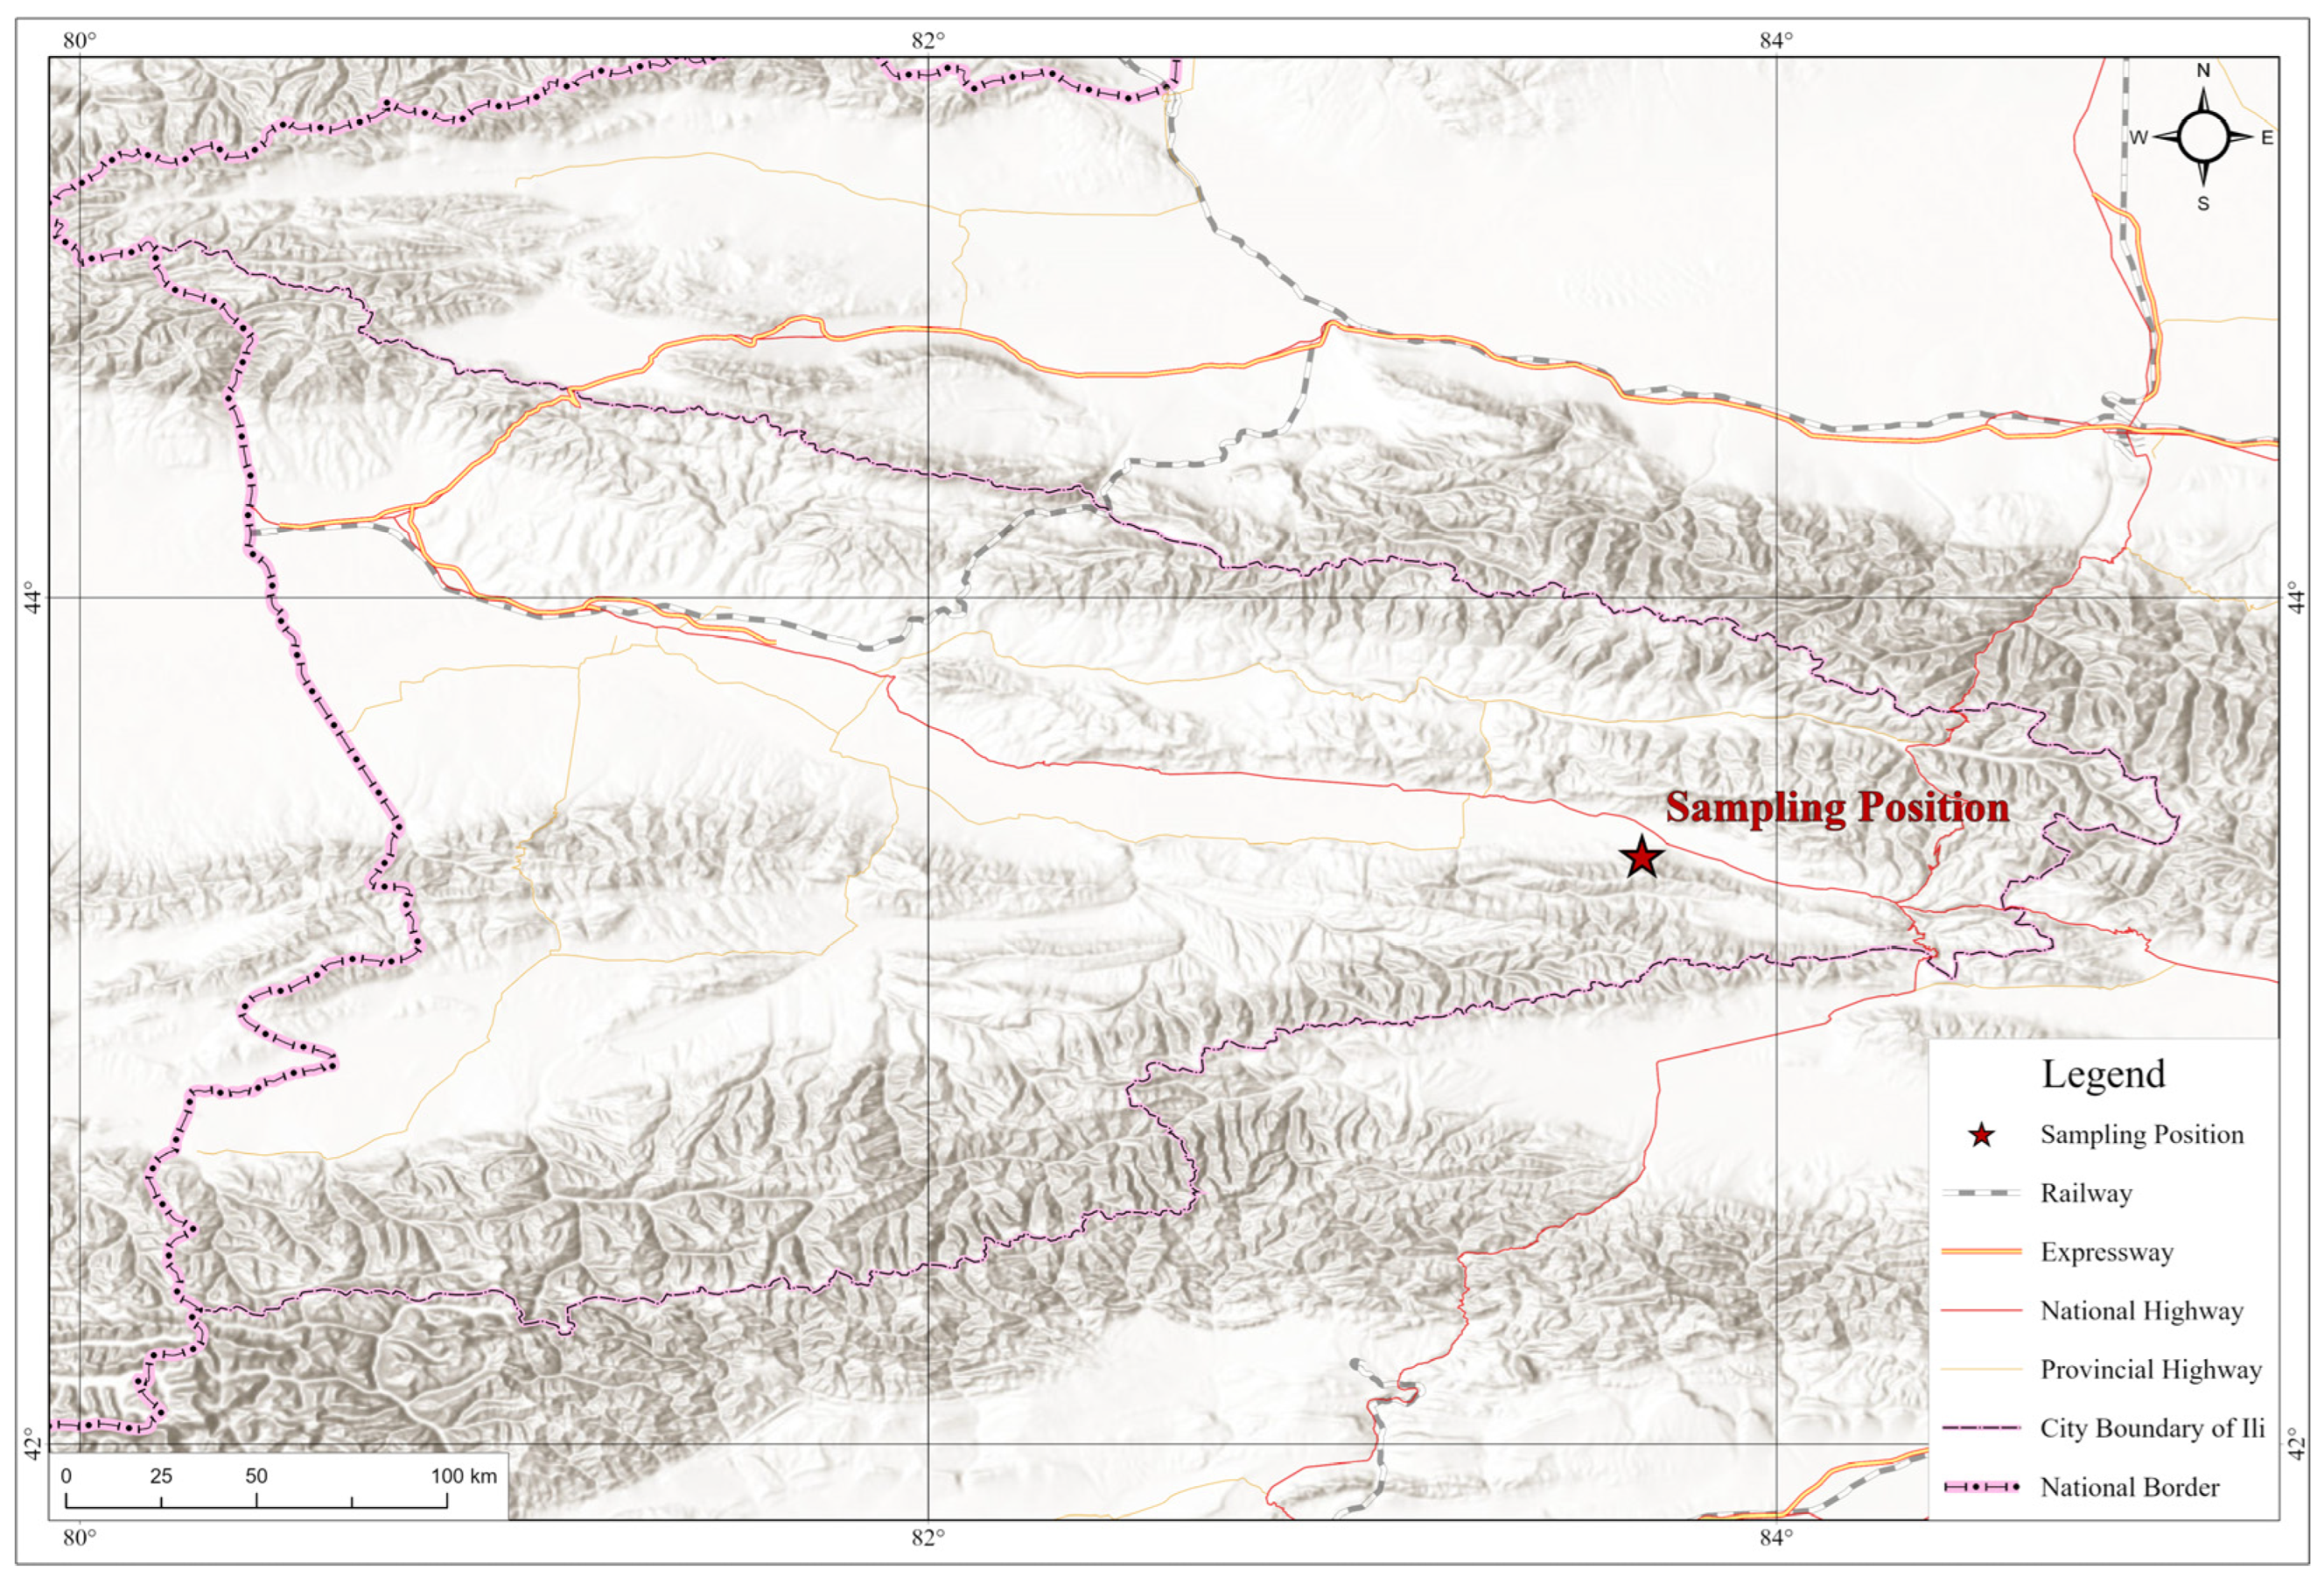
2.1. Materials

The sampling point was located within the landslide on the west side of the Khain Desayi Valley near Almal Town, Xinyuan County, Yili River Valley (Figure 1). The sampling points were located at the foot, middle, and top of the slope. The sampling depth was 1.0–2.0 m, and it was located in the silt. According to the X-ray diffraction results, the mica contents at the different sampling locations were significantly different. The mica contents of the loess samples at the foot, middle, and top of the slope were approximately 1.8%, 7.7%, and 15.2%, respectively. The mineral composition analysis results are shown in Table 1. The middle of the slope was used to collect soil samples for this study. Four groups with different mica contents, of 7.7%, 10.2%, 12.7%, and 15.2%, are designated.
The Standard for Soil Test Methods was followed when collecting, transporting, and preparing the unaltered and remolded samples. Figure 2 depicts the particle size distribution. The research area’s soil is classified as silty clay. The undisturbed sample is used to measure the basic physical indicators, such as the natural water content and the natural density, and the results are shown in Table 2. After being crushed, the remolded soil sample was dried and put through a 2 mm screen. The maximum dry density and optimum water content measured during the compaction test were used for sample preparation.

2.2. Sample Preparation

The air-dried loess was crushed and put through a 2 mm screen, in accordance with the Standard for Geotechnical Testing Method, in order to make the soil particles more homogeneous. Subsequently, it was mixed evenly with mica to prepare loess with different mica contents. For the purpose of creating triaxial samples, the compaction test was used to estimate the maximum dry density and optimal moisture content of the loess with various mica contents. Compaction was used to create the triaxial sample, which had the chosen size of 39.1 mm by 80.0 mm. The loess samples were created using water and left to stand with varying mica contents. The total soil mass required was calculated according to the volume of the sample. The soil samples were compacted in three layers by the compactor. The plastic sheet was used to wrap the prepared soil samples, which were then left in a wetting dish for more than 24 h. They were then placed in a room with a fixed temperature and humidity level to undergo testing involving FTCs. The triaxial shear test was performed following a predetermined number of FTCs.

2.3. Methods

2.3.1. Compaction Test
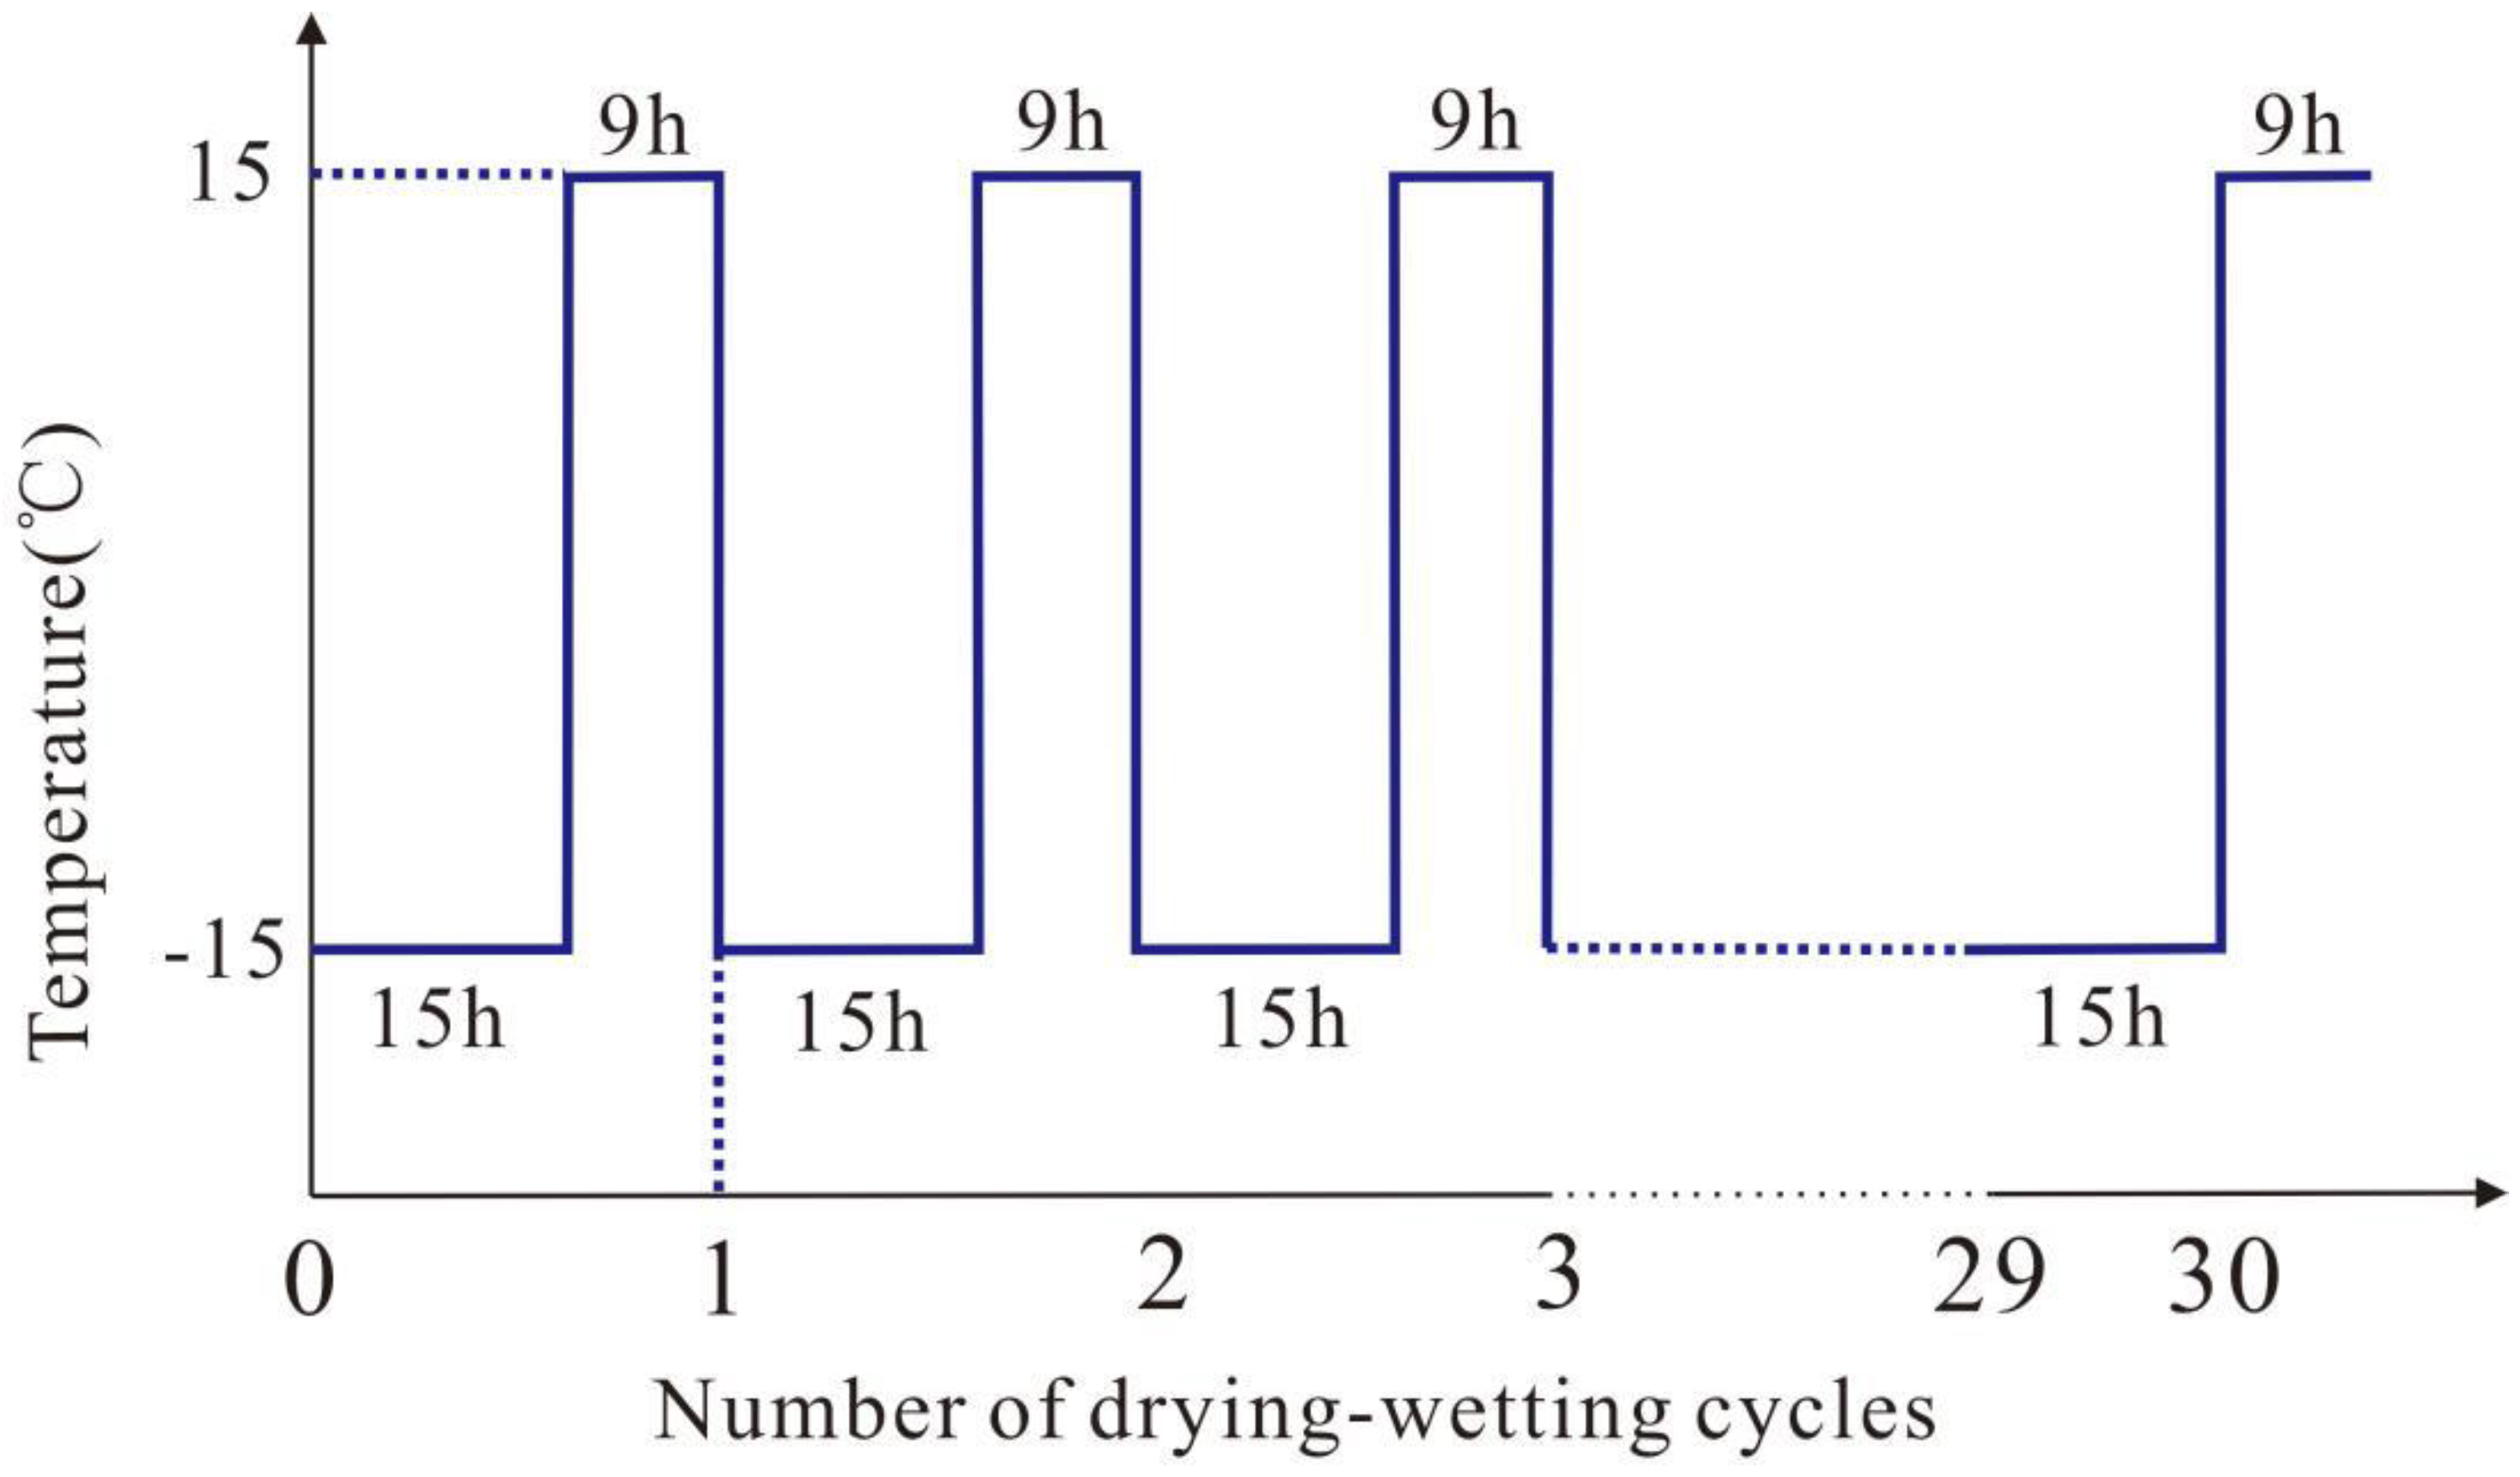
In the study location, the soil samples’ initial dry density was 1.34 g/cm3. Following drying, crushing, and sieving through a 2 mm screen, soil samples with 7.7%, 10.2%, 12.7%, and 15.2% mica content, respectively, were prepared. To prepare five soil samples with varying water contents, distilled water was added. After being sealed and kept aside for 24 h, the samples were tested using the light compaction test.

2.3.2. FTC Test

A constant temperature and humidity test chamber belonging to the JW-2000 series was used for the FTC test with the triaxial samples, whose accuracy could be controlled at 0.1 ℃. The average temperature of the local FT period during the past 10 years was determined based on the climate features of the study area, and the FT temperatures were set at −15 °C and 15 °C, respectively. To ensure the complete freezing and thawing of the sample and to refer to the previous research results, each freeze-thaw cycle was comprised of 15 h of freezing and 9 h of thawing [30]. According to the earlier research, stability was maintained until 30 FTCs. Hence, the number of FTCs was set to 0, 1, 3, 5, 10, 20, and 30 in this test [30]. Figure 3 depicts the temperature progression during the cycle of freezing and thawing.

2.3.3. Triaxial Shear Test

The changing rule for the mechanical characteristics of loess with various mica contents under FTCs is covered in this work. Considering the instantaneous destruction of loess, the quick shear test was more appropriate. However, considering the damage caused by the influence of consolidation on the FTCs, it was also difficult to drain the water from the low permeability loess. In this study, the unconsolidated-undrained triaxial shear test (UU test) was conducted for the FT triaxial sample. The test confining pressures were established at 100, 200, and 300 kPa, respectively, in accordance with the Standard for Soil Test Methods (GB/T 50123-2019), and the shear rate was 0.6 mm/min. When the axial strain of the soil mass reached 15%, the shear was stopped. The ambient temperature was set to 20 ℃.

3. Results

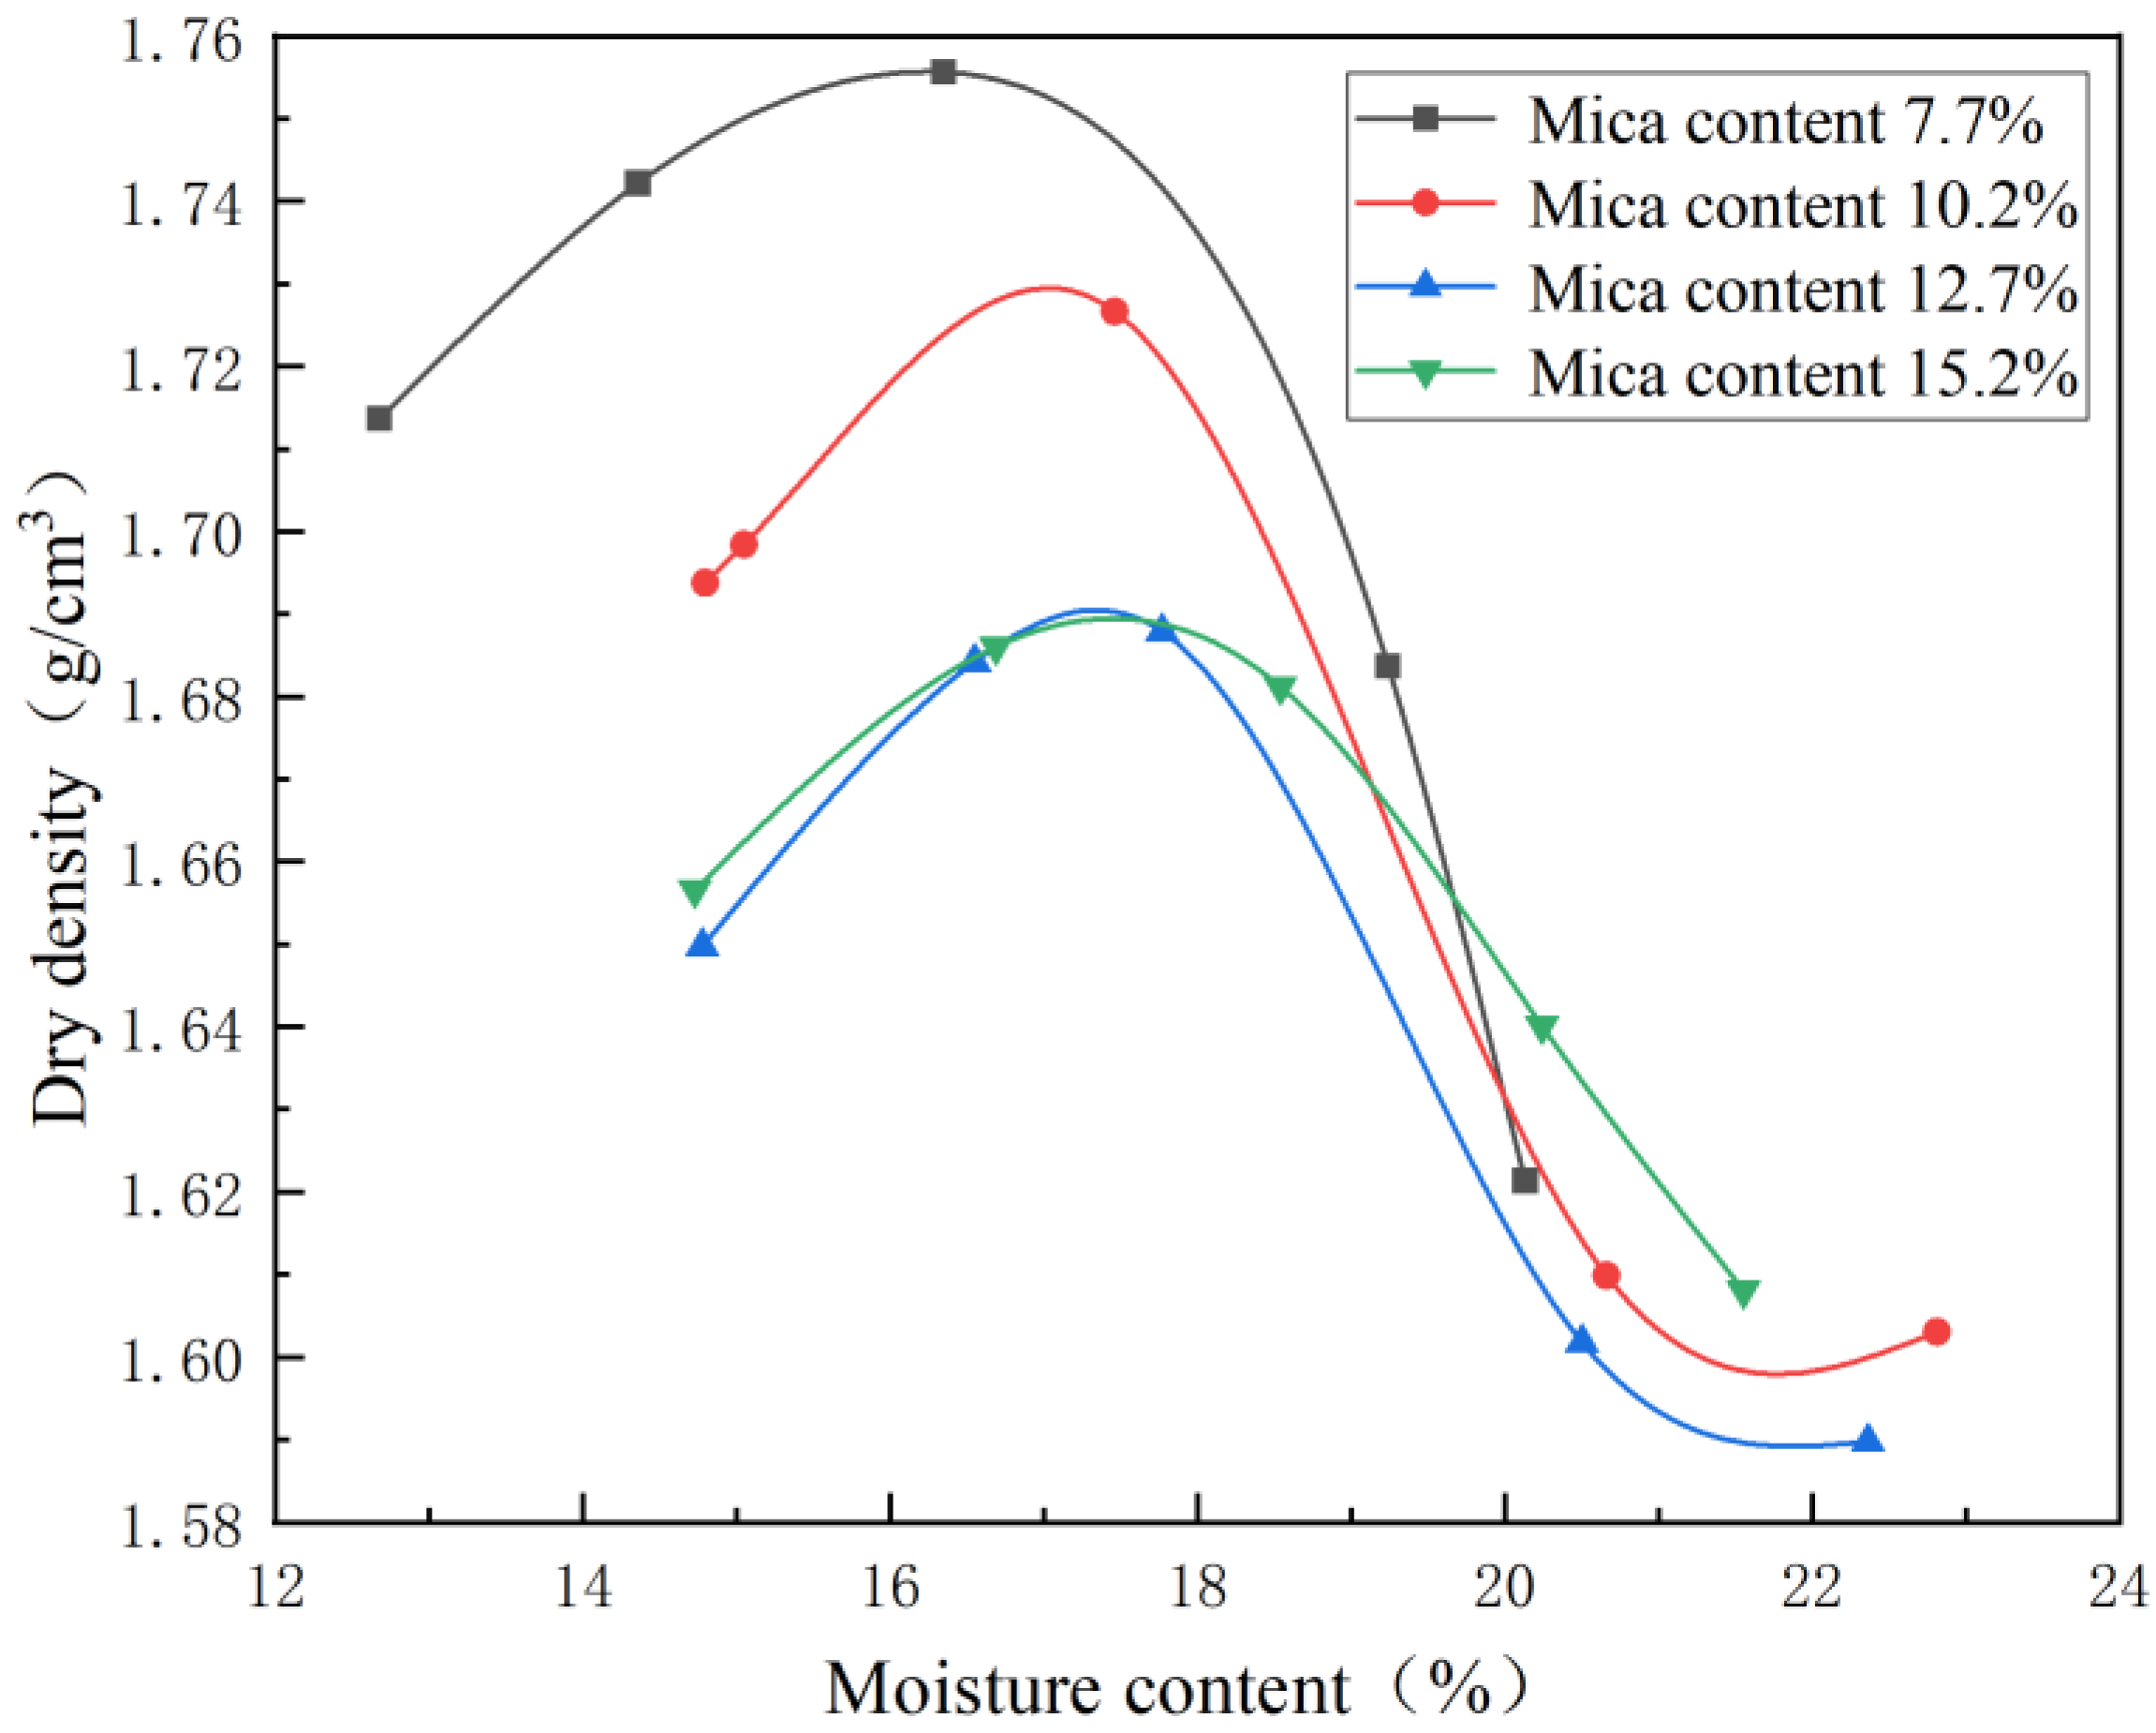
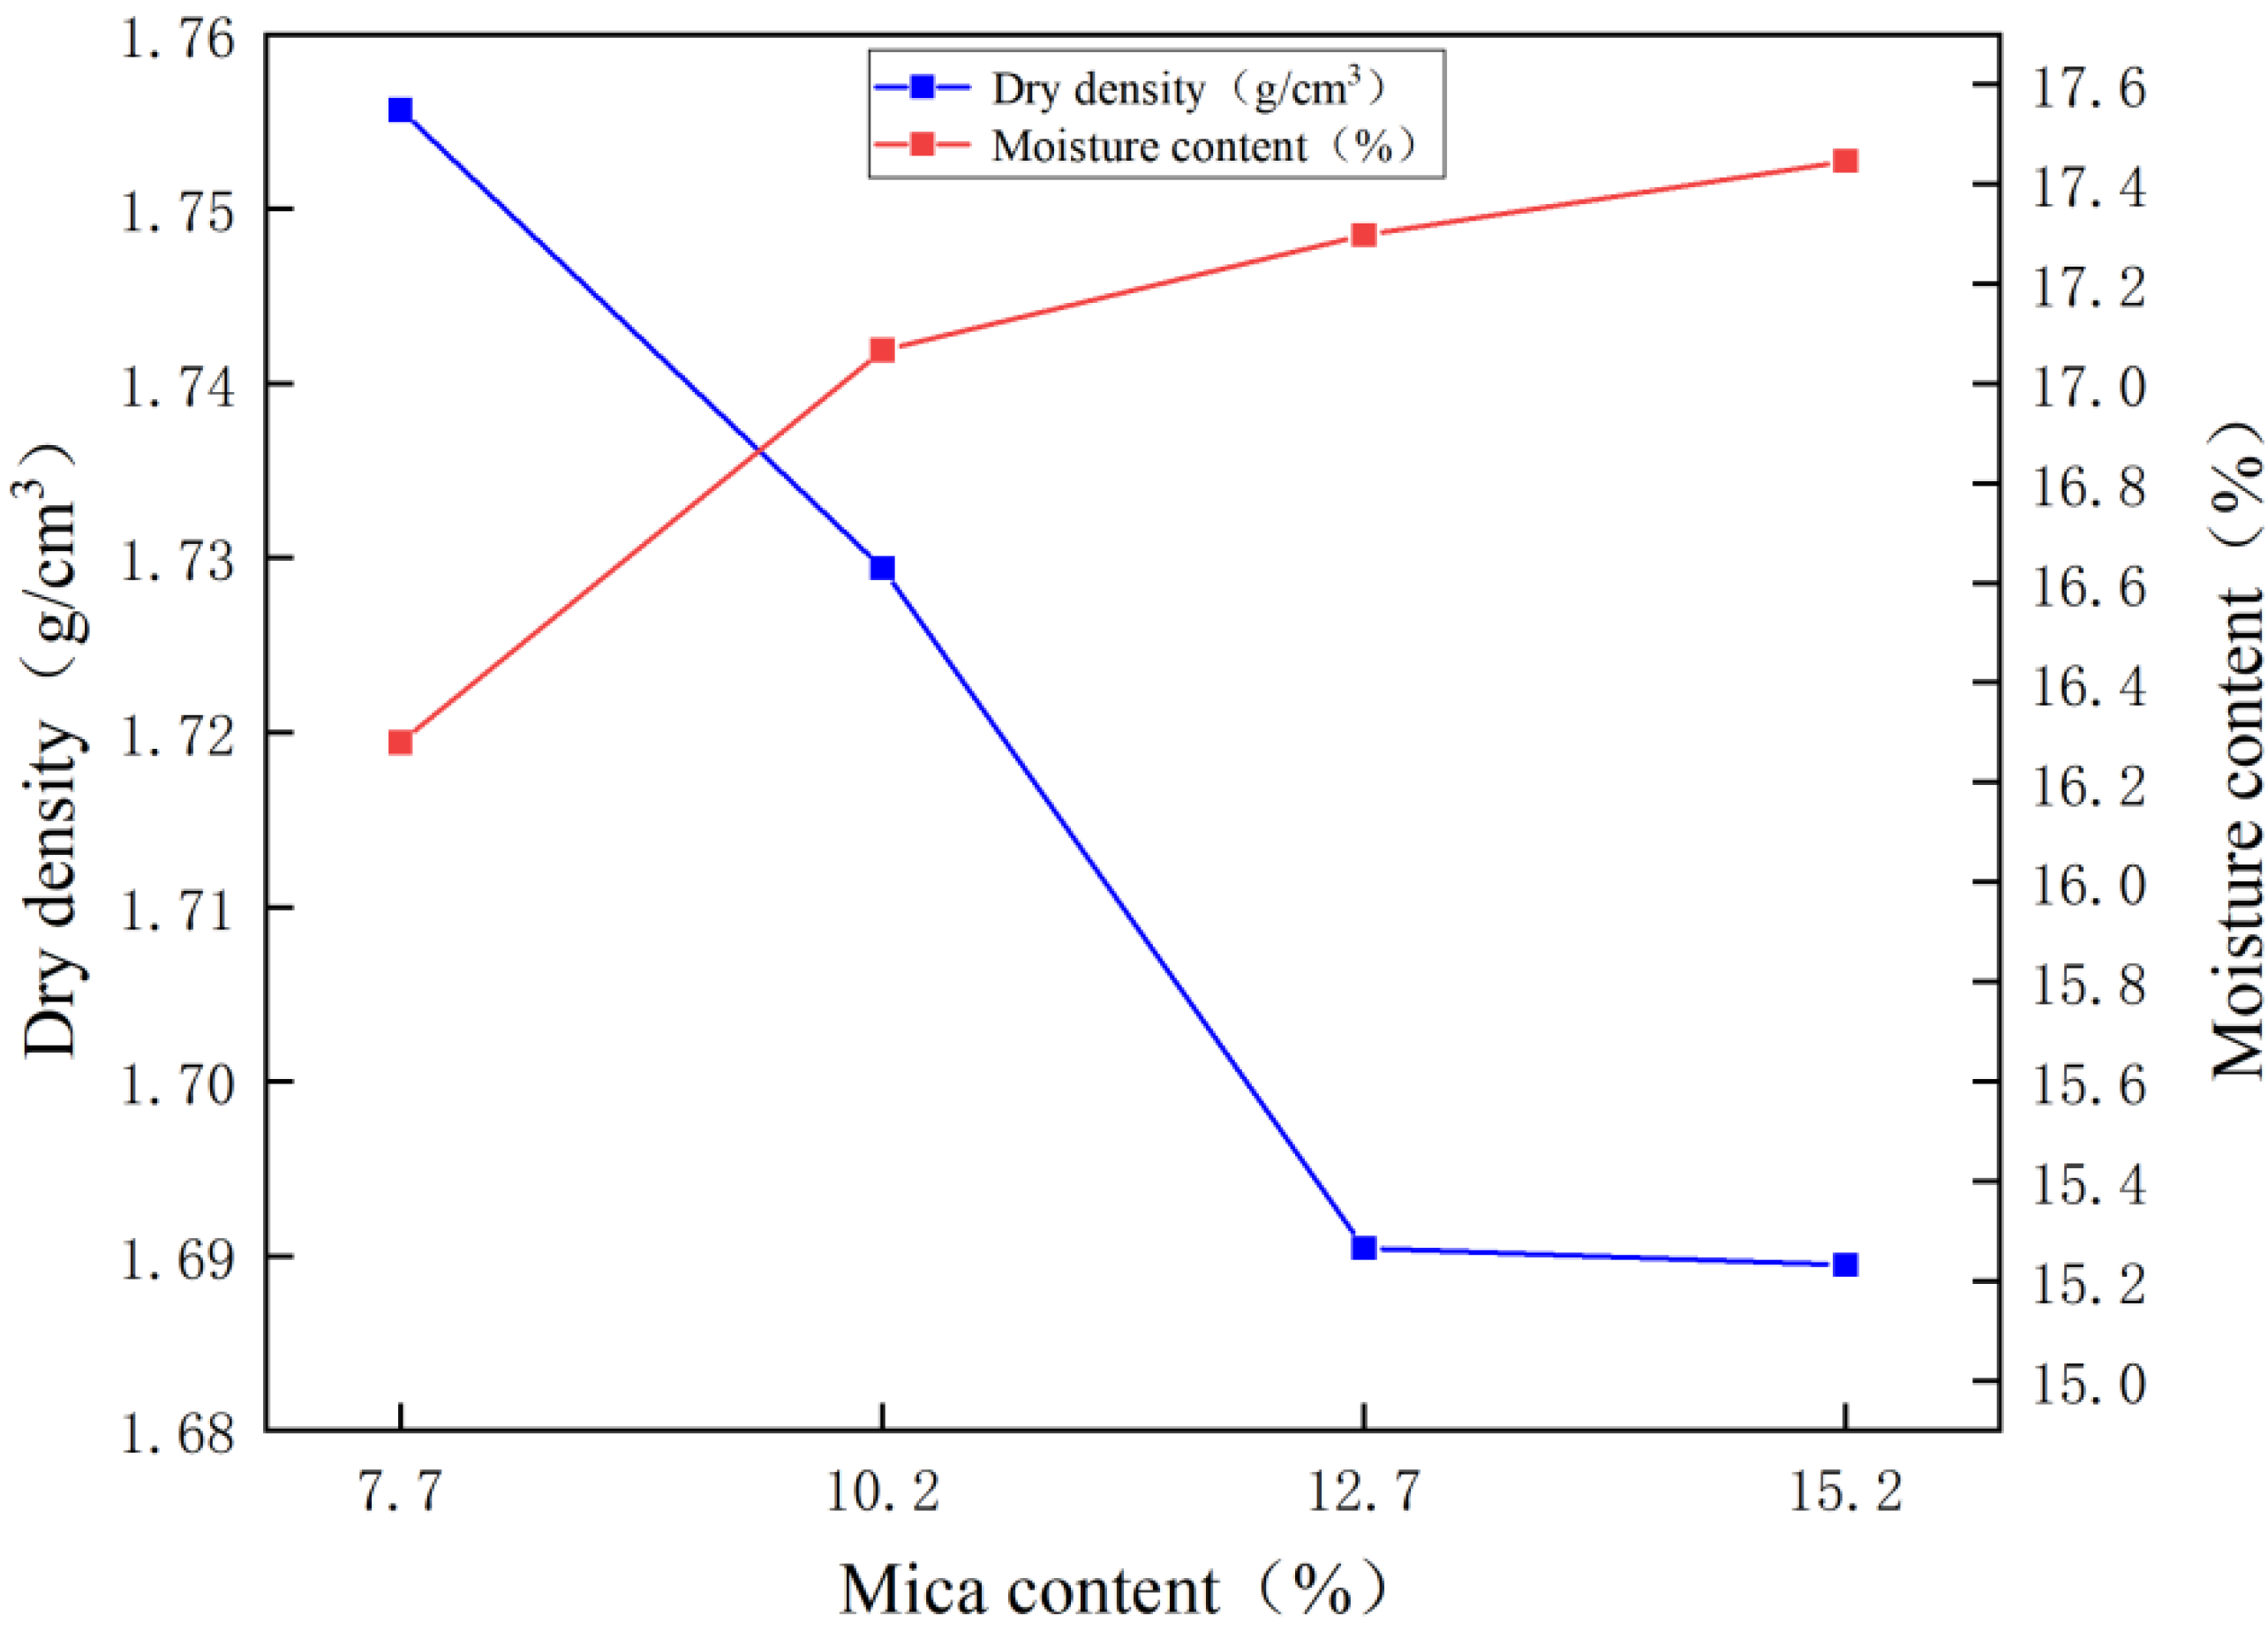
3.1. Compaction Characteristic Analysis

The compaction curves of the loess with various mica contents are depicted in Figure 4, based on the results of the compaction tests performed on the loess. The abscissa corresponding to the peak point of each compaction curve was taken to indicate the optimal moisture content, and the corresponding ordinate was used to indicate the maximum dry density. Figure 5 illustrates the loess dry density and moisture content curves with various mica contents. With the increase in the mica content, the maximum dry density of the loess with various mica content decreased gradually, while the optimal moisture content showed an upward trend. The density of the mica was lower than that of the loess. Hence, as the mica content increased, the maximum dry density of the loess with various mica content decreased gradually. From the change trend of the four groups of the compaction curves, the water content had a relatively low impact on the dry density of the loess with different mica contents before reaching the maximum dry density. However, after reaching the maximum dry density of the soil, the water content had a higher effect on the dry density.

3.2. Triaxial Shear Test Results

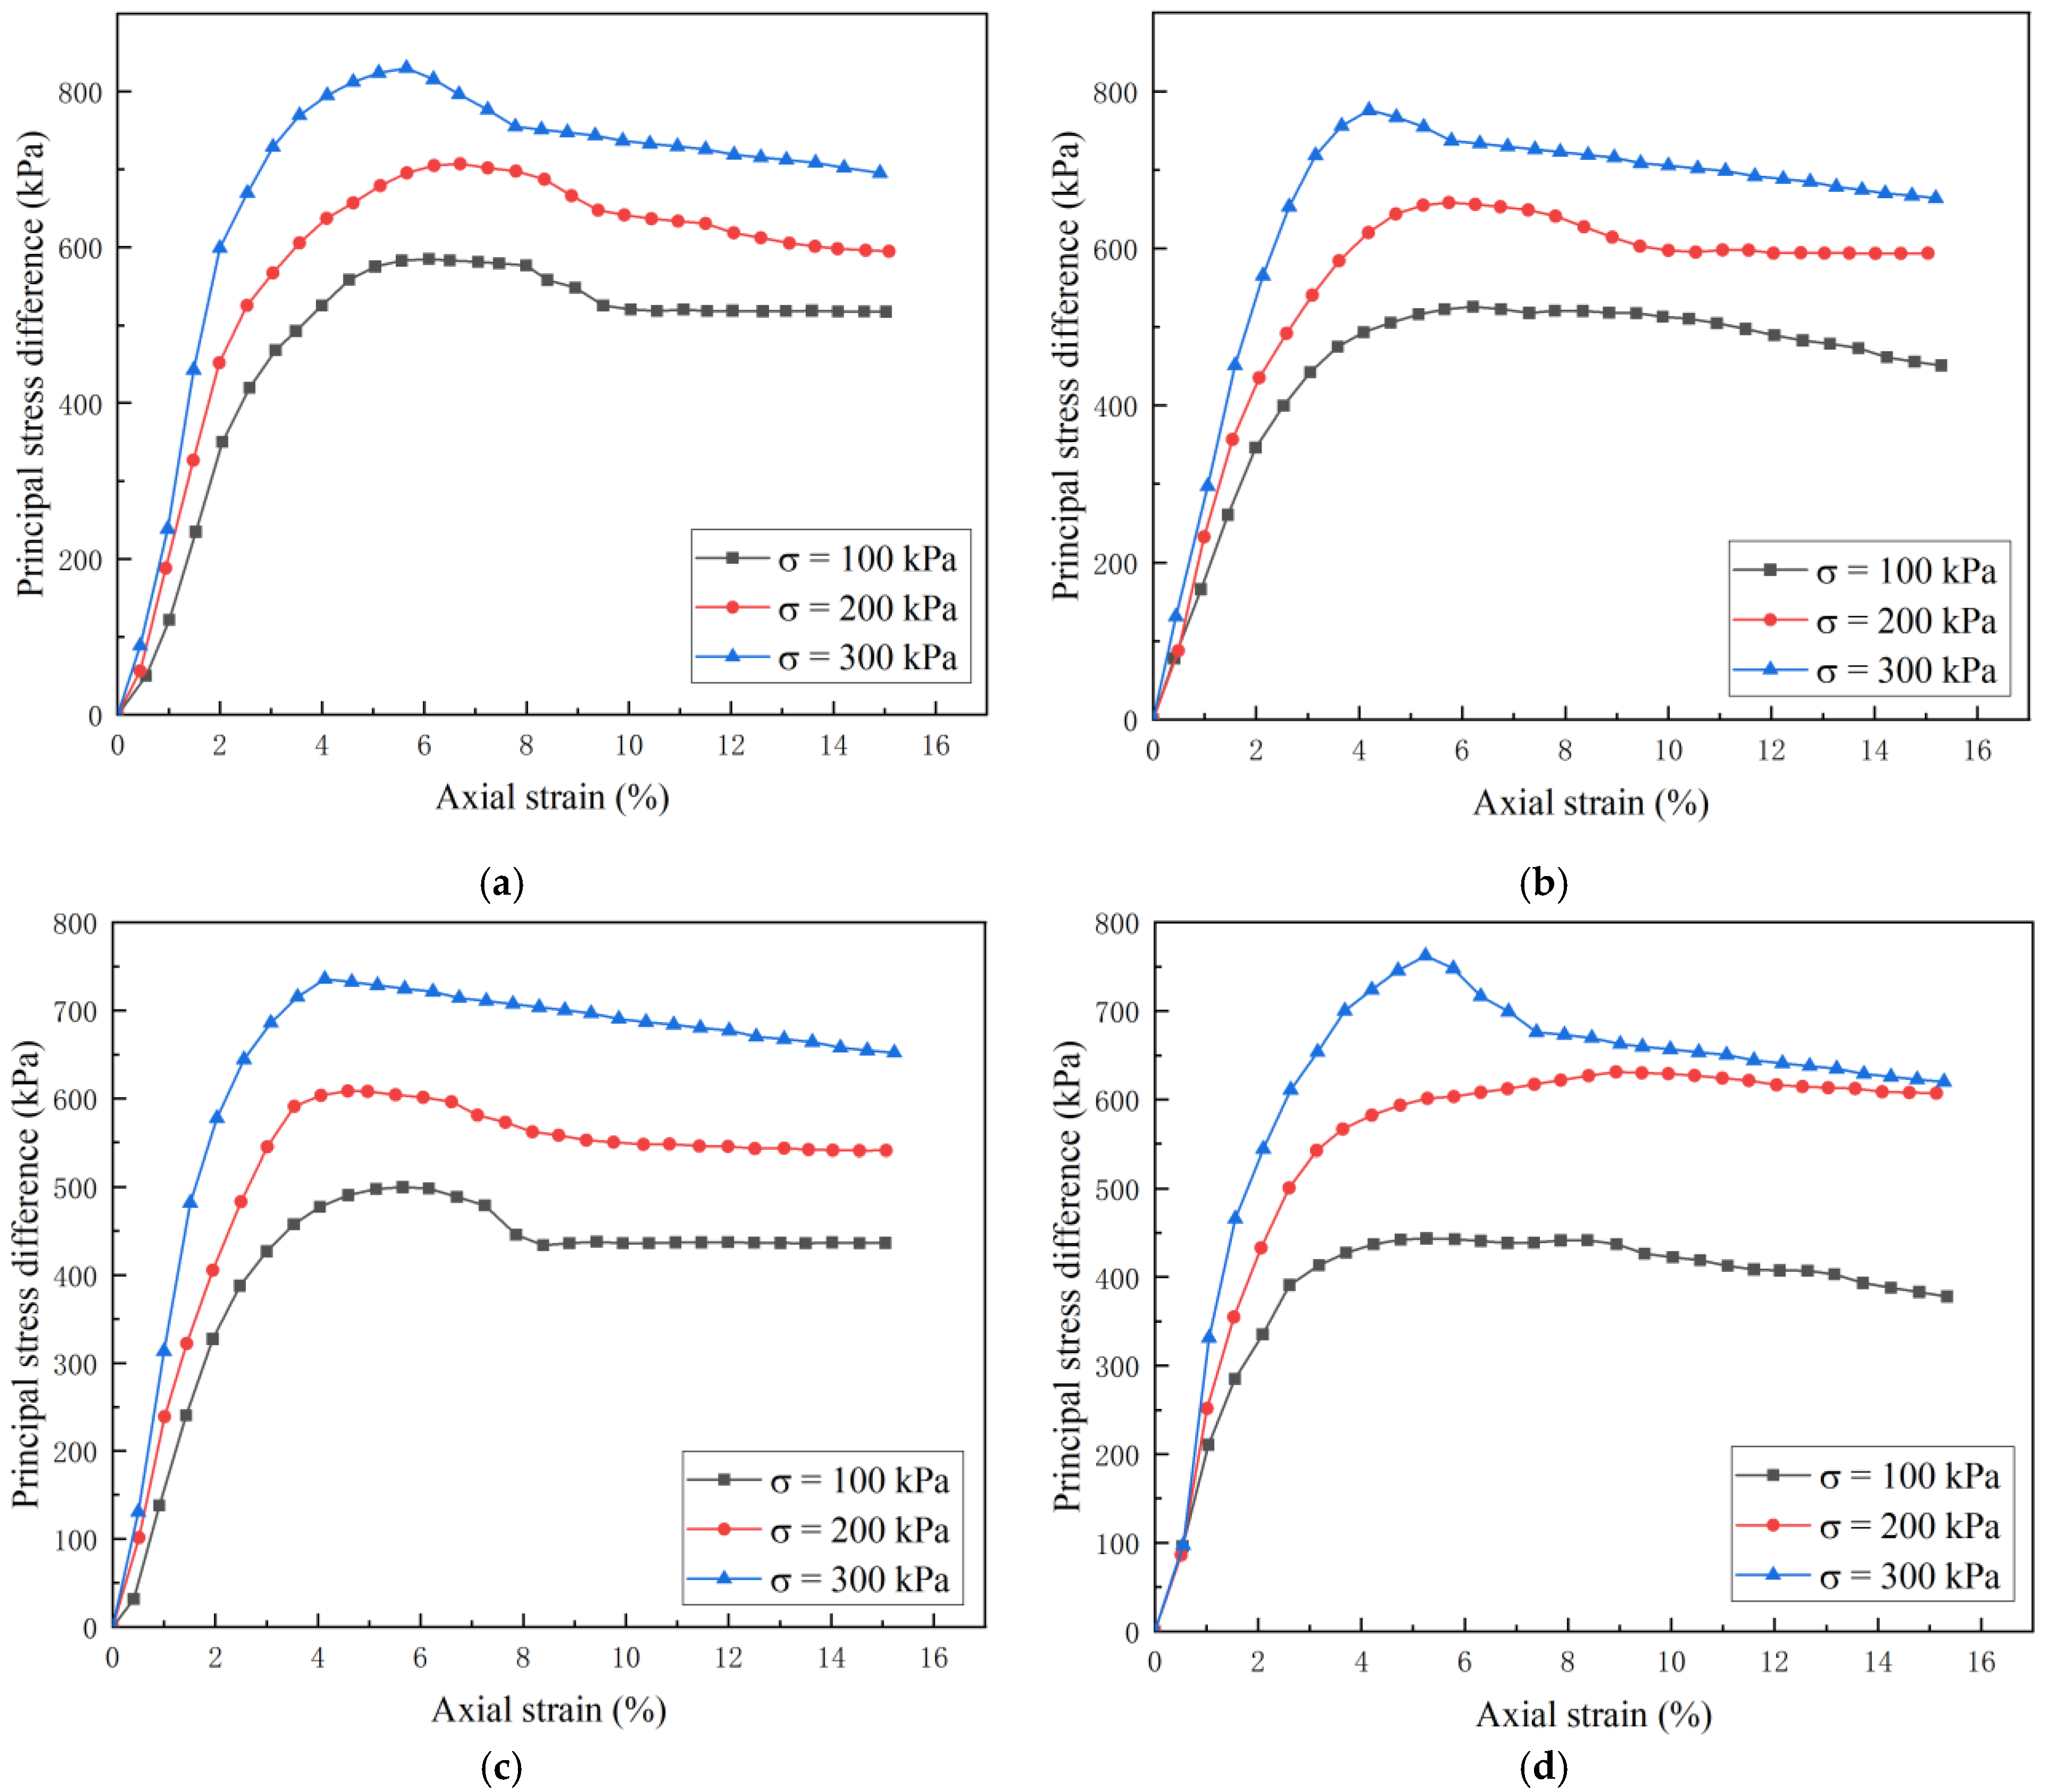
3.2.1. Stress Strain Relationship

Through the triaxial shear test and under different FTCs and mica content, the data from the remolded Yili loess samples with confining pressures of 100 kPa, 200 kPa and 300 kPa were processed. Under various circumstances, the 28 axial strain and primary stress difference curves were obtained, and they partially mirrored the shear deformation properties. The stress-strain curves were classified using the triaxial shear test in the laboratory, and the results showed that most of them indicated shear softening, while a few indicated shear hardening. For the soil samples that showed strain hardening behavior, the principal stress difference increased with the increase in the axial strain, while for the soils that showed strain softening behavior, the principal stress difference increased initially, reached the peak value, and then decreased. During the shearing process of the samples under different confining pressures, the principal stress difference had a peak value. Compared to cases without the FTCs, the principal stress difference of the samples that undergo the FTCs decreased to some extent, indicating the soil mass deterioration due to FTCs and the decrease in the soil mass strength.
Figure 6 displayed the stress-strain curve for one FTC for samples with various mica contents. Although the stress-strain curves fluctuated, the overall effect was that with the increase in mica content, the maximum principal stress decreased. With a rise in confining pressure, the primary stress differential grew, and the first stage of the curve altered slowly. As a result of the increased friction and bite forces between the particles, caused by an increase in the initial confining pressure, the stable sample structure was indirectly destroyed. Thus, the amount of mica had a big impact on how strong the soil was.
The peak stress on the stress-strain curve was designated as the failure stress in accordance with the specification to investigate the effects of FTCs and mica content on the soil’s failure stress peak. The selection principle was that when the peak value occurred within 15% of the strain range, the peak stress was selected as the failure point. If the curve always showed an upward trend, the failure stress was chosen to be the deviatoric stress equivalent to an axial strain of 15%.
According to the test data and the obtained stress-strain curve, the relationship curve between the peak principal stress difference and the number of FTCs was drawn in the shearing process of four groups of loess with different mica contents, and is shown in Figure 7. The figure demonstrates that when the mica content remained constant, although the peak principal stress difference fluctuated with the change in the number of FTCs, it generally showed a downward trend. The decline was particularly obvious after 30 FTCs, indicating that different types of loess with varying amounts of mica have less shear failure resistance capabilities and are more likely to reach the peak condition under light strain, causing the soil to fail under shear. The peak primary stress differential of the loess with varying mica content gradually decreased under the same number of FTCs and confining pressures as it increased in mica content. It showed that the increase in the mica content would aggravate soil damage and make the soil more vulnerable in shear. When the confining pressure was increased while maintaining the same mica content and FTCs, the peak principal stress differential rose, showing that the confining pressure had some bearing on the soil’s susceptibility to shear failure.
Thus, the soil can be weakened and made vulnerable to shear damage either by subjecting it to FTCs or by increasing the content of mica.

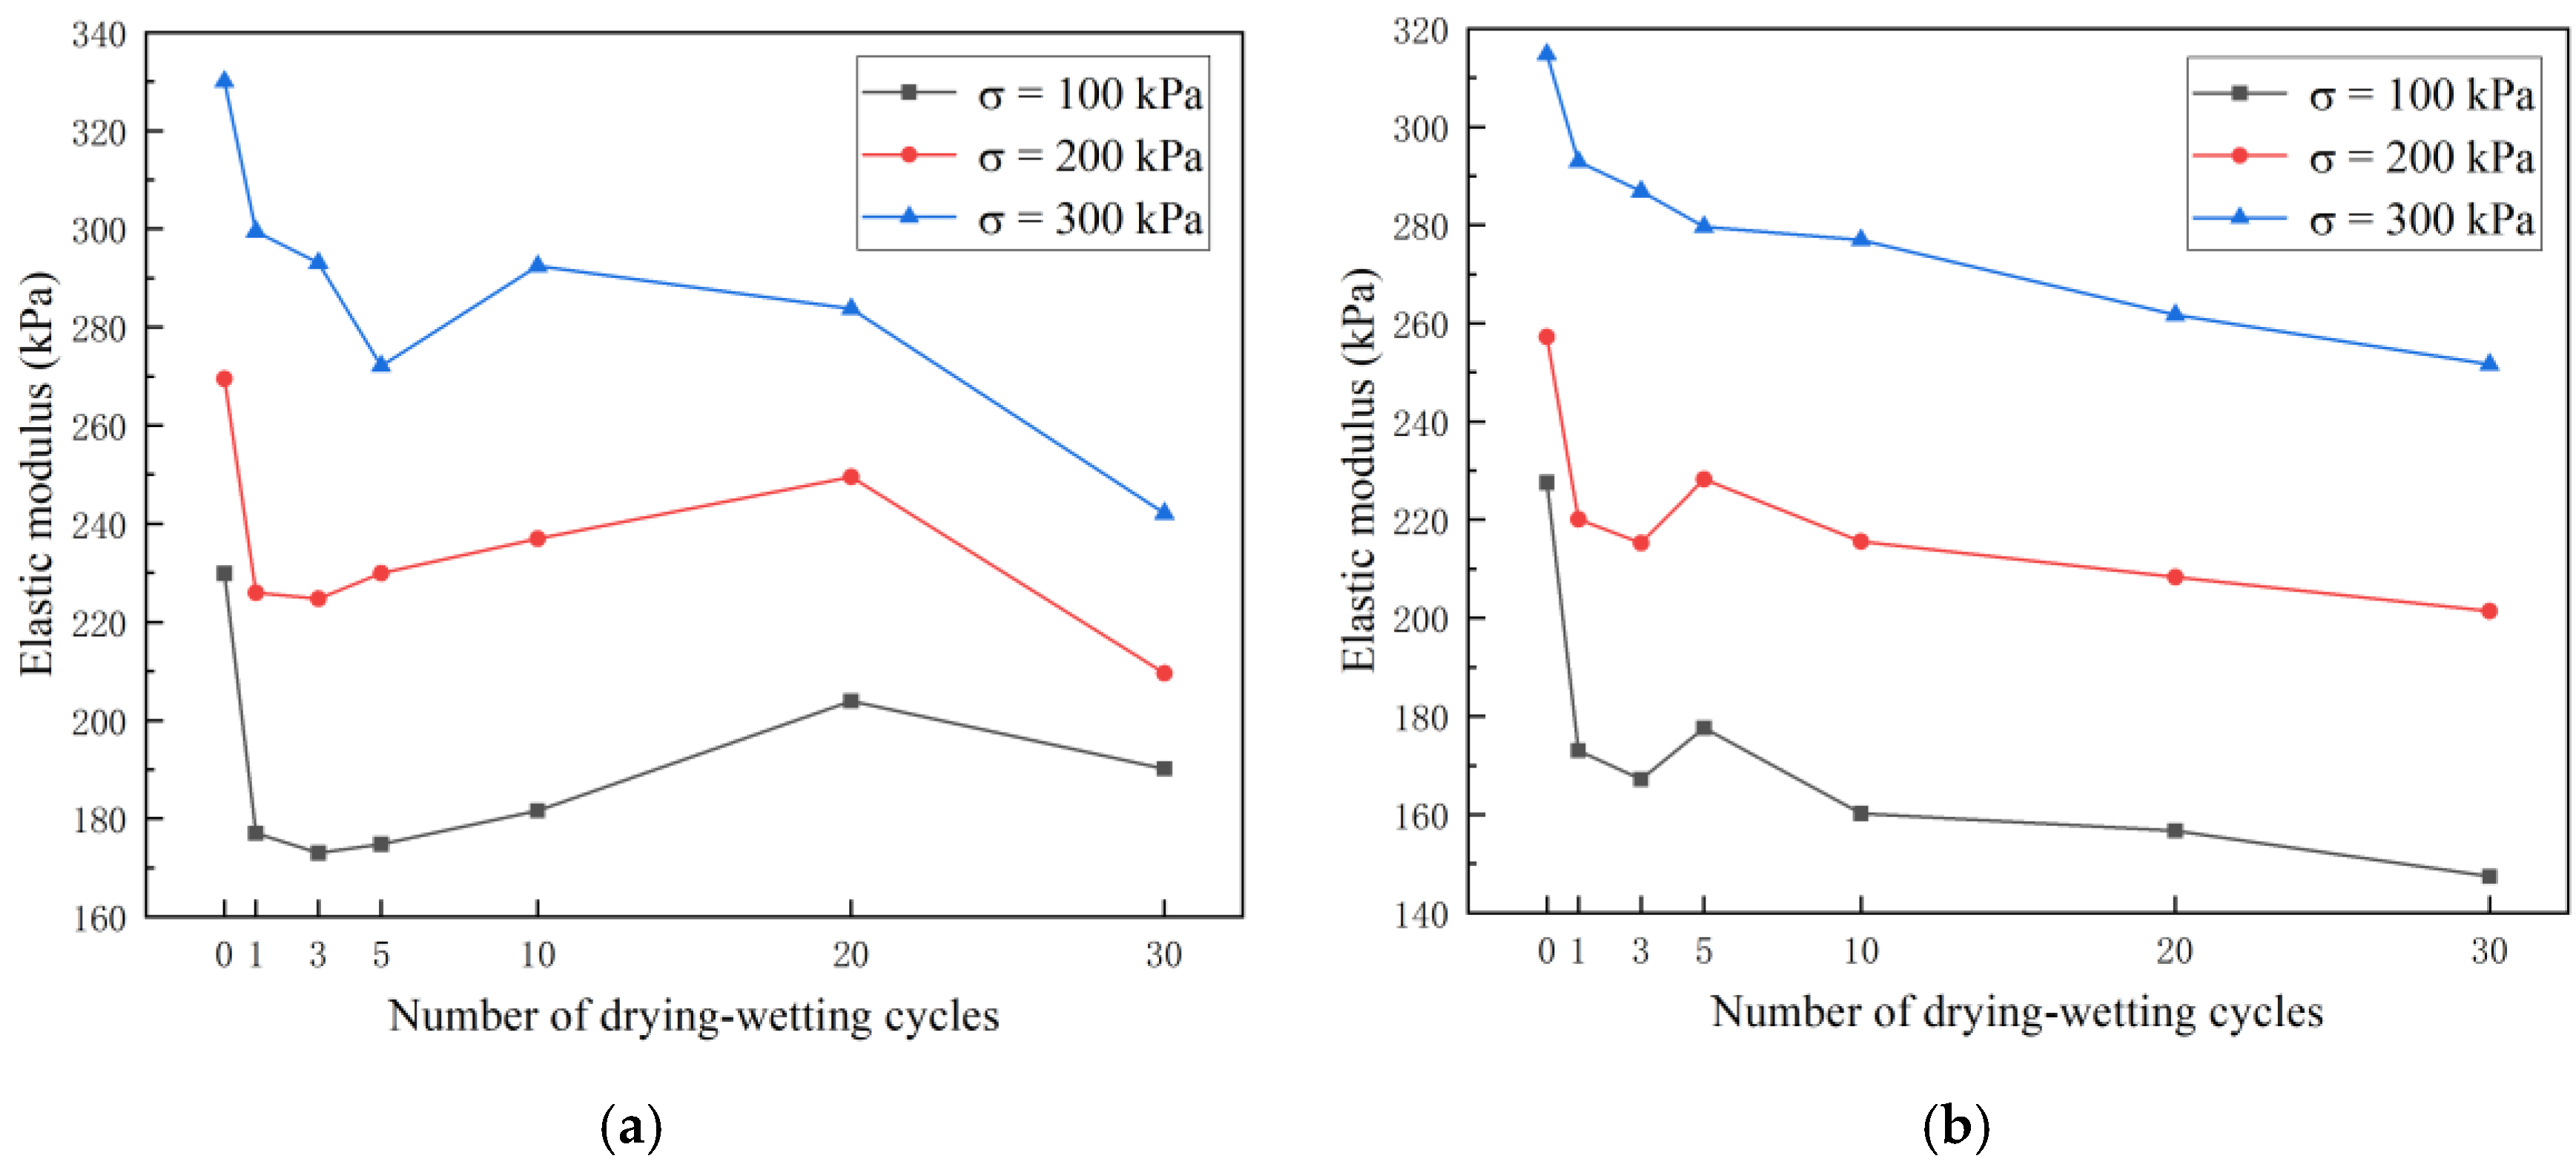
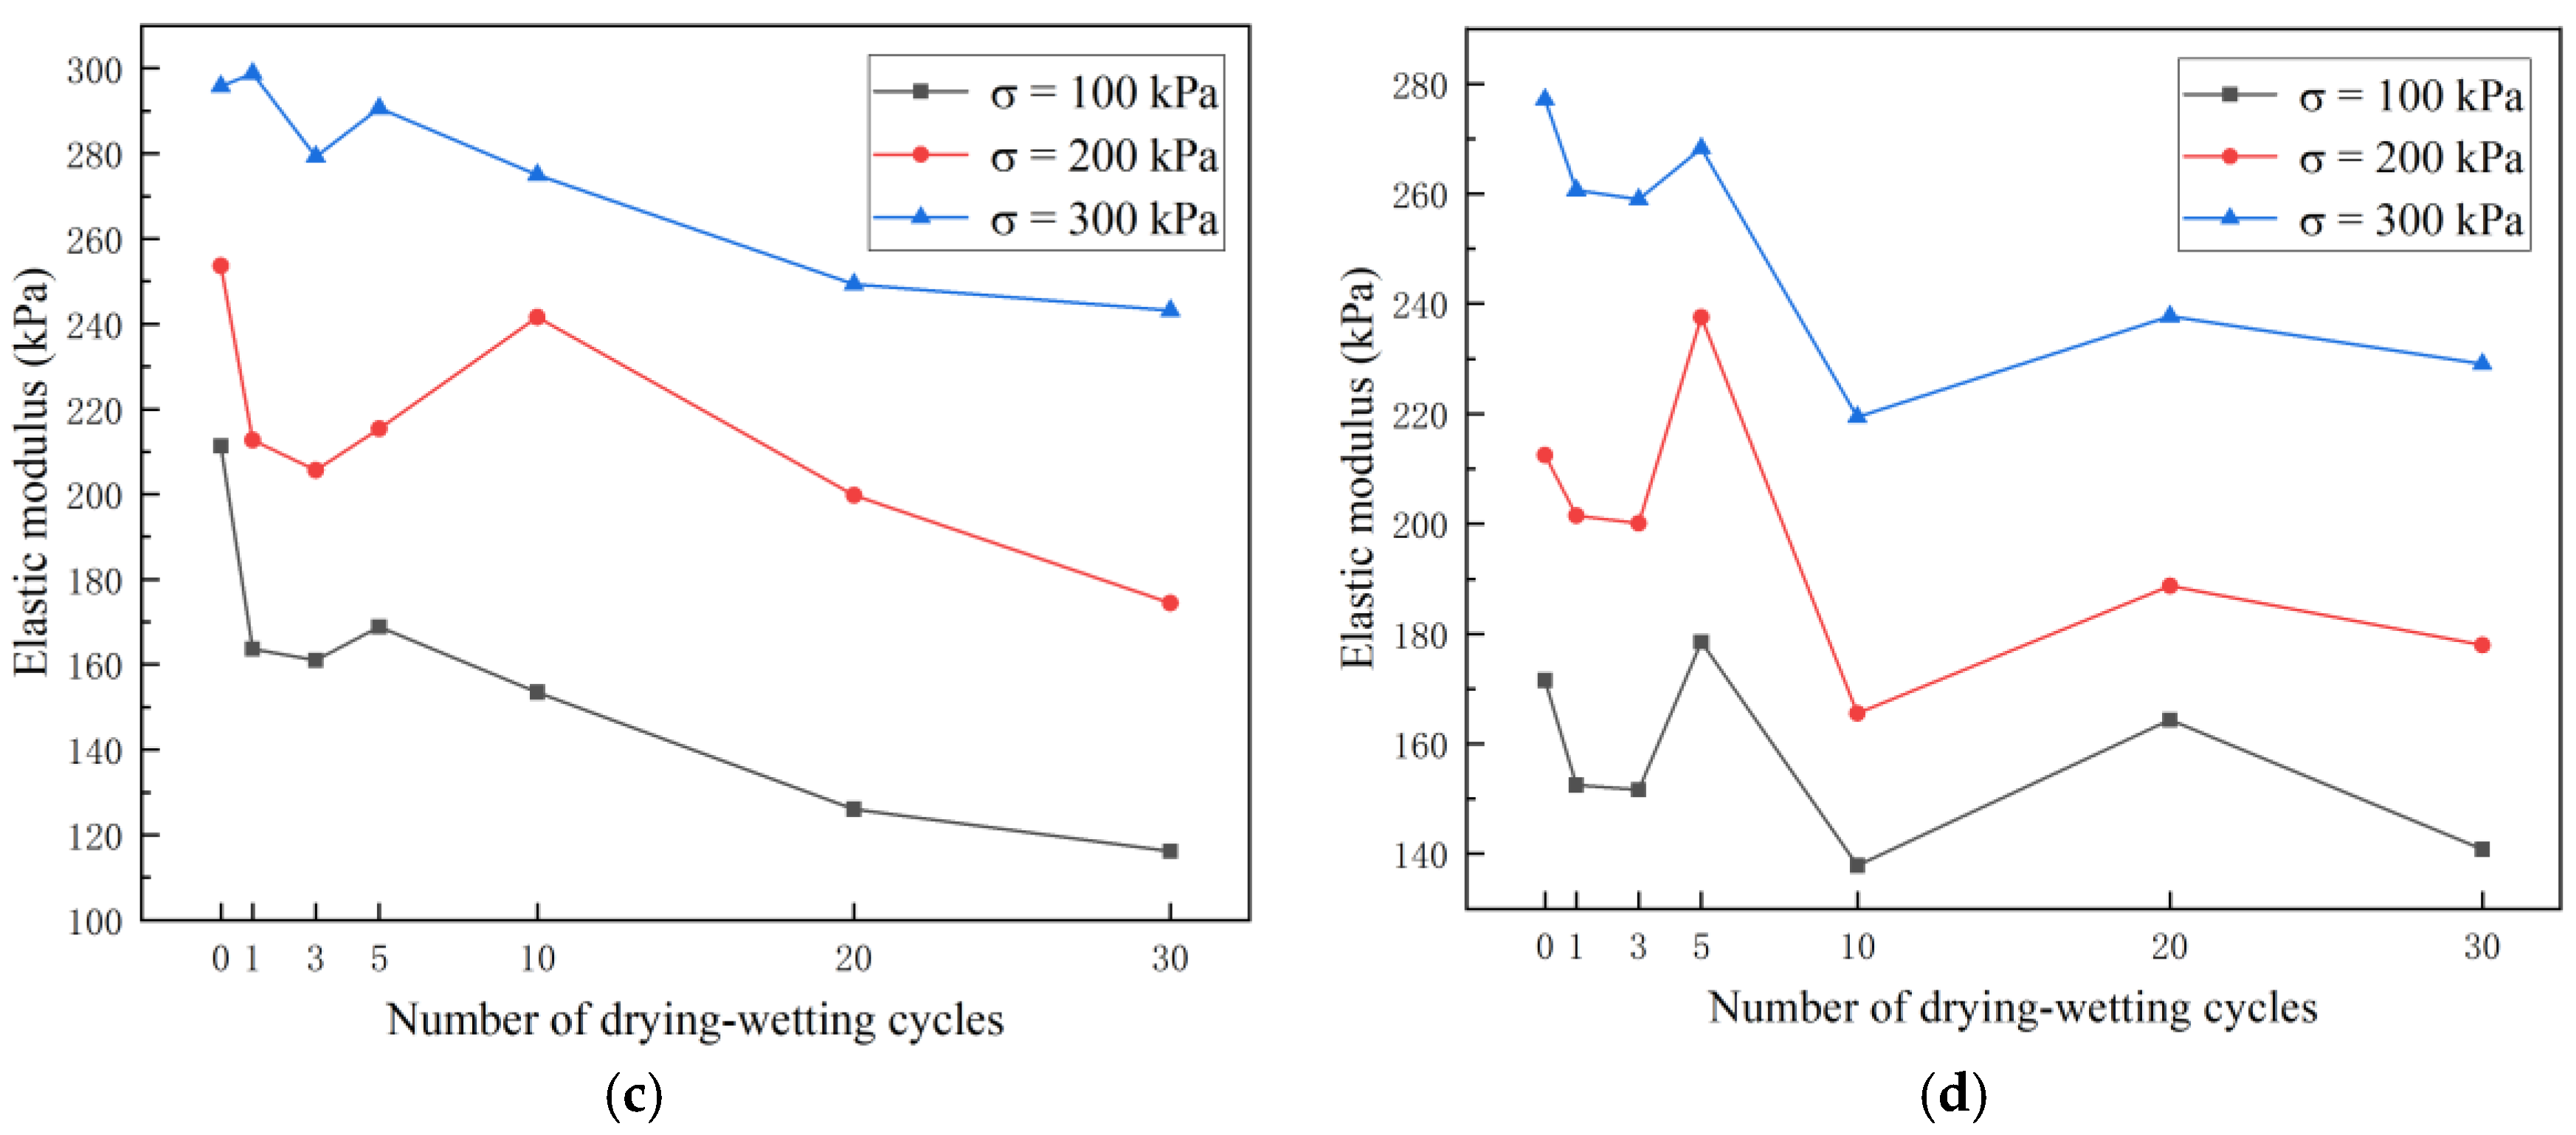
3.2.2. Analysis of the Change in Elastic Modulus

The elastic modulus is a measure of soil resistance to elastic deformation and is a parameter that reflects the soil stiffness and deformation characteristics. The major stress difference is defined by the triaxial test findings as the difference between the principal stress corresponding to 2.0% and 0% of the axial strain of the stress-strain curve. The elastic modulus is the proportion of the above principal stress difference and the equivalent increment in axial strain and can be calculated as:
E = Δ σ Δ ε = σ 2.0 % σ 0 % ε 2.0 % ε 0 %
where E is the elastic modulus; Δσ is the stress increment; Δε is the strain increment; σ2.0% and σ0% are the principal stress differences corresponding to 2.0% and 0%, respectively; ε2.0% and ε0% is the axial strain corresponding to 2.0% and 0%, respectively. Formula (1) is used to calculate the change in the elastic modulus by various causes.
The curve of the change in the elastic modulus with the number of FTCs was drawn and shown in Figure 8. From the figure, the elastic modulus of the loess with different mica contents decreased in varying degrees with the increase in the number of FTCs. With the increase in the mica content, the elastic modulus of the loess with different mica contents decreased. This is because the soil pores were not compacted, and the usual tension was low during the early load step. With the increase in the mica content, relative displacement occurred between the soil particles. With an increase in the confining pressure, the elastic modulus of the loess with various mica contents rose. This is due to the fact that when the confining pressure grew, the sample’s interior pores condensed and closed, increasing its stiffness. Thus, the samples’ elastic modulus rose.

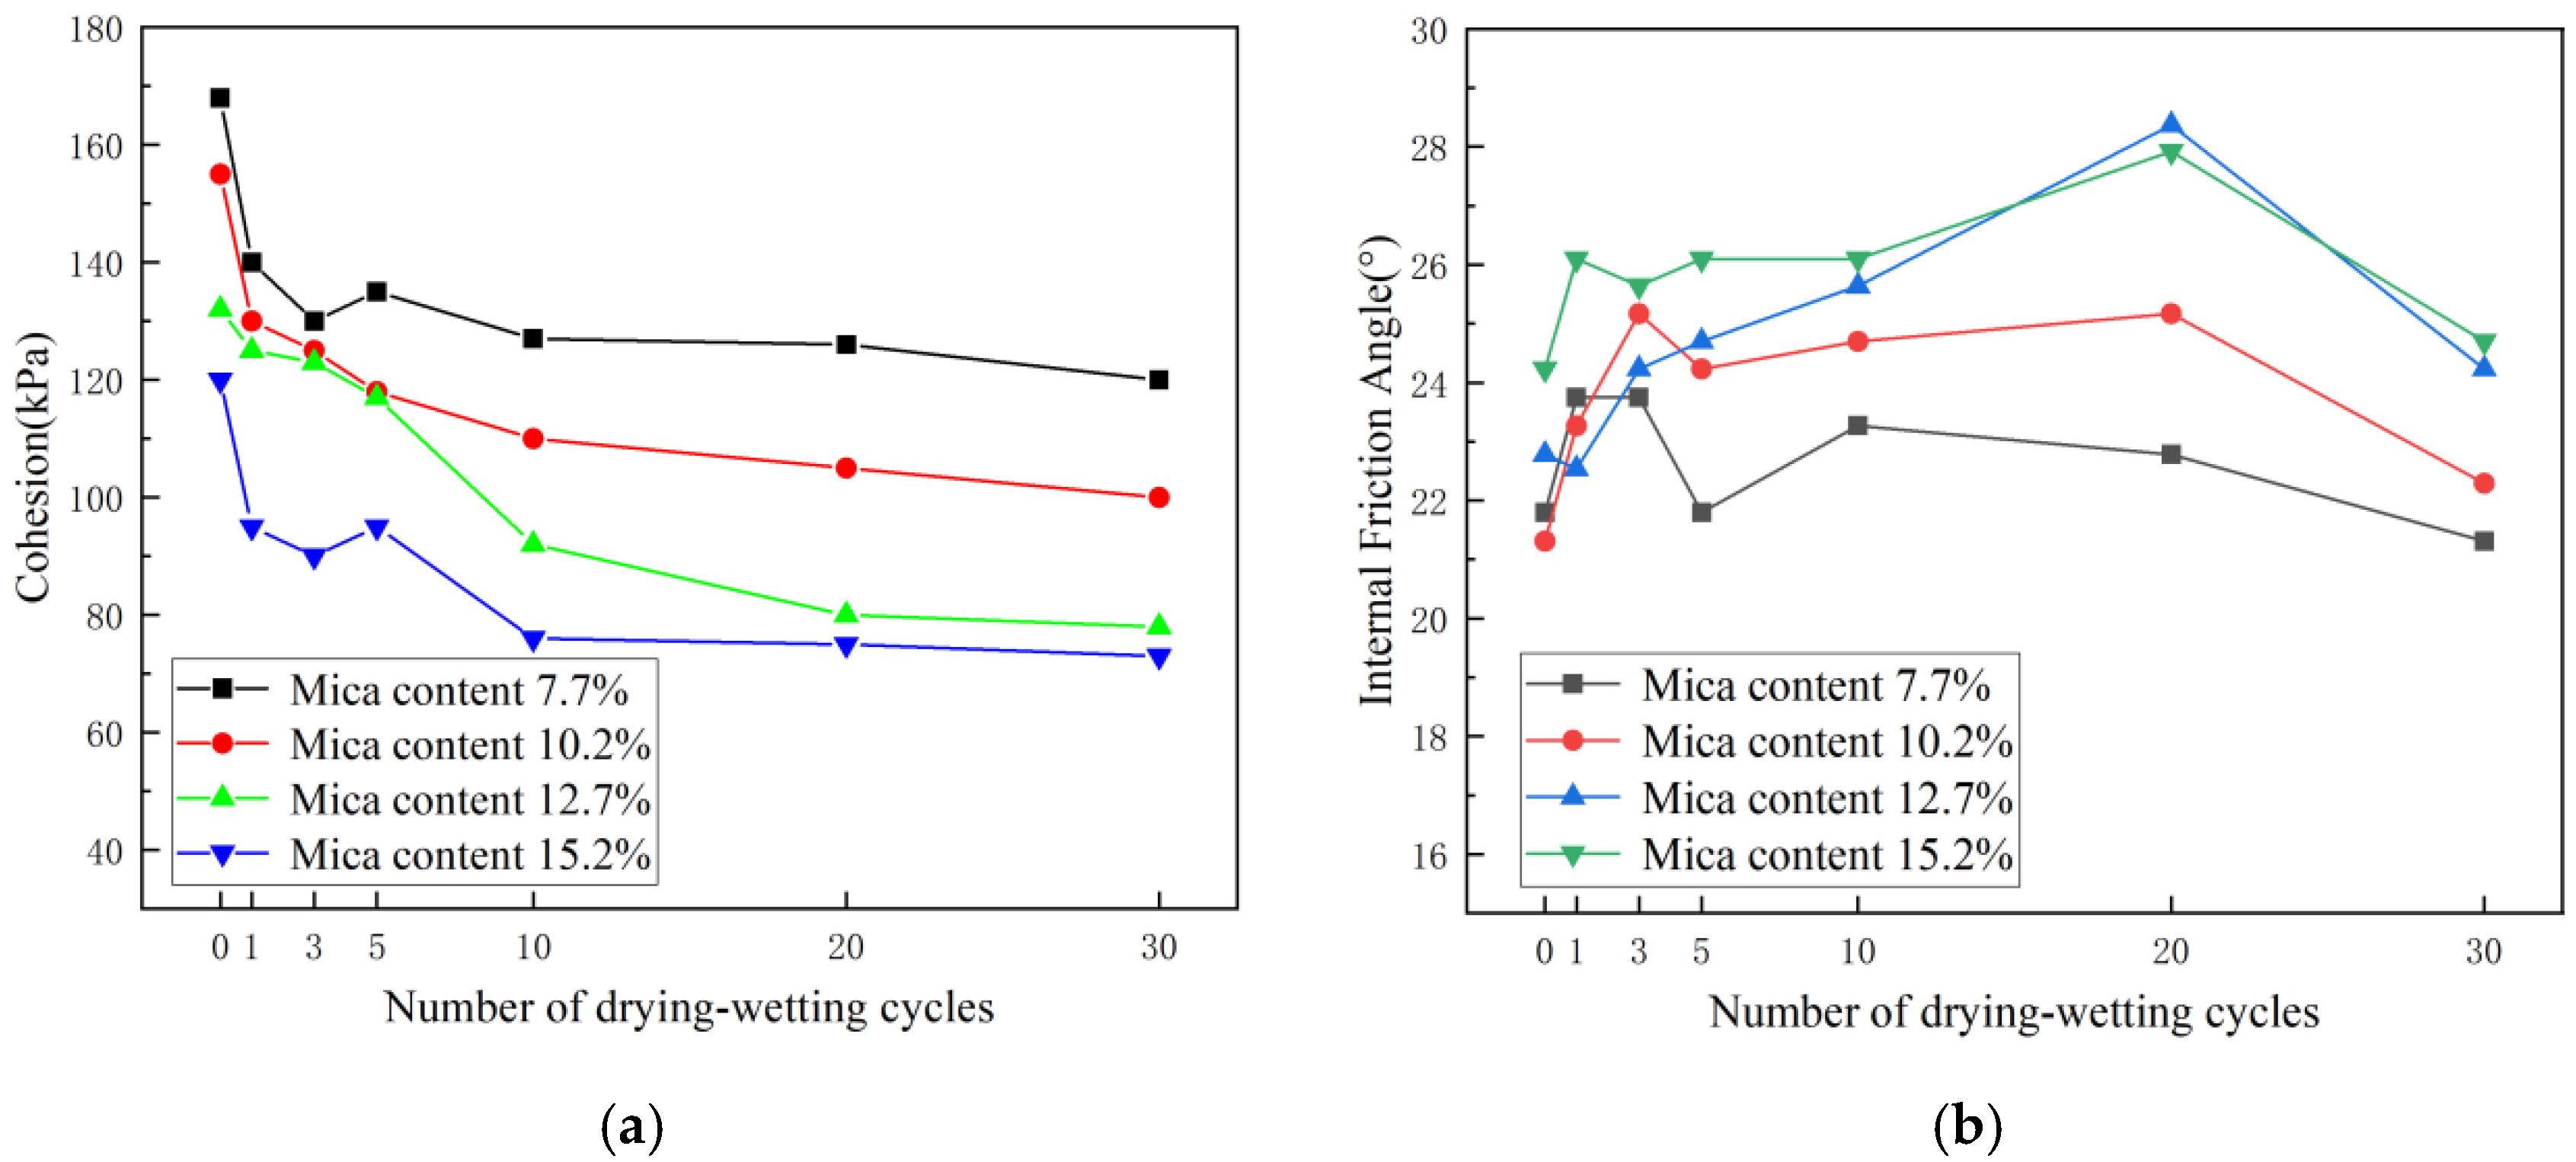
3.2.3. Analysis of Shear Strength Parameters

The cohesion and friction angle of the soil samples may be calculated using the Mohr-Coulomb method. The Coulomb formula is τf = C+ σtanφ. By using the test data to map the Mohr circle, it was possible to determine the soil’s strength envelope. The soil sample’s friction angle was represented by the strength envelope’s dig angle, and the cohesiveness was symbolized by the intercept on the longitudinal axis. Figure 9 showed the Mohr circle and the strength envelope of the loess samples with varying mica contents for one freezing and thawing cycle.
From Figure 10, it can be seen that with a rise in the mica content, the cohesiveness of the soil mass dramatically dropped for a set number of FTCs, with a similar decreasing amplitude and an average decrease of 16 kPa. However, the internal friction angle of the soil showed a fluctuating and increasing trend with insignificant changes. The amplitude increase was somewhat larger when the mica percentage rose from 7.7% to 12.7%. The internal friction angle grew less when the mica content rose from 12.7% to 15.2%, indicating that the cohesion and the mica content had an inverse relationship. The cohesion decreases as the mica content increases. However, the internal friction angle presented an opposite trend, and the range of variation was smaller than that of the cohesion. This was because the mica, which is a layered silicate mineral with a smooth surface, could be staggered along the joint surface and, thus, often had a sheet shape. Due to mica’s substantial specific surface area in sheet form, it can easily adsorb bound water to form a thick bound water film, which reduced the contact area between particles and thus weakened the inter particle bonding force, as well as the cohesion of the soil particles.
From Figure 11, it can be seen that with the varying mica contents, the soil mass’s cohesion gradually diminished as the number of FTCs increased, particularly in the first ten cycles. After ten cycles, the cohesion decreased gradually and approached a constant value. However, when the number of FTCs rose, the internal friction angle first increased before decreasing. In the first cycle, the increase in the amplitude was significant. This happened as a result of the FTCs destroying the naturally occurring strong cementation between the loess particles. Due to freezing and migration, the water in the soil mass produced a frost heaving force and migration force, which constantly weakened the cohesive force between the soil particles and reduced the cohesive force. The number of contact points between the soil particles grew during the soil particle rearrangement process, increasing the internal friction angle. In general, the impact on the soil was greater during the early FTCs than later. After the FTCs, the soil’s internal friction angle fluctuated, initially rising, and then falling. This indicated that the FTCs affected the internal friction angle of the soil slightly, and the change in the soil strength was caused by the reduction in the cohesion.

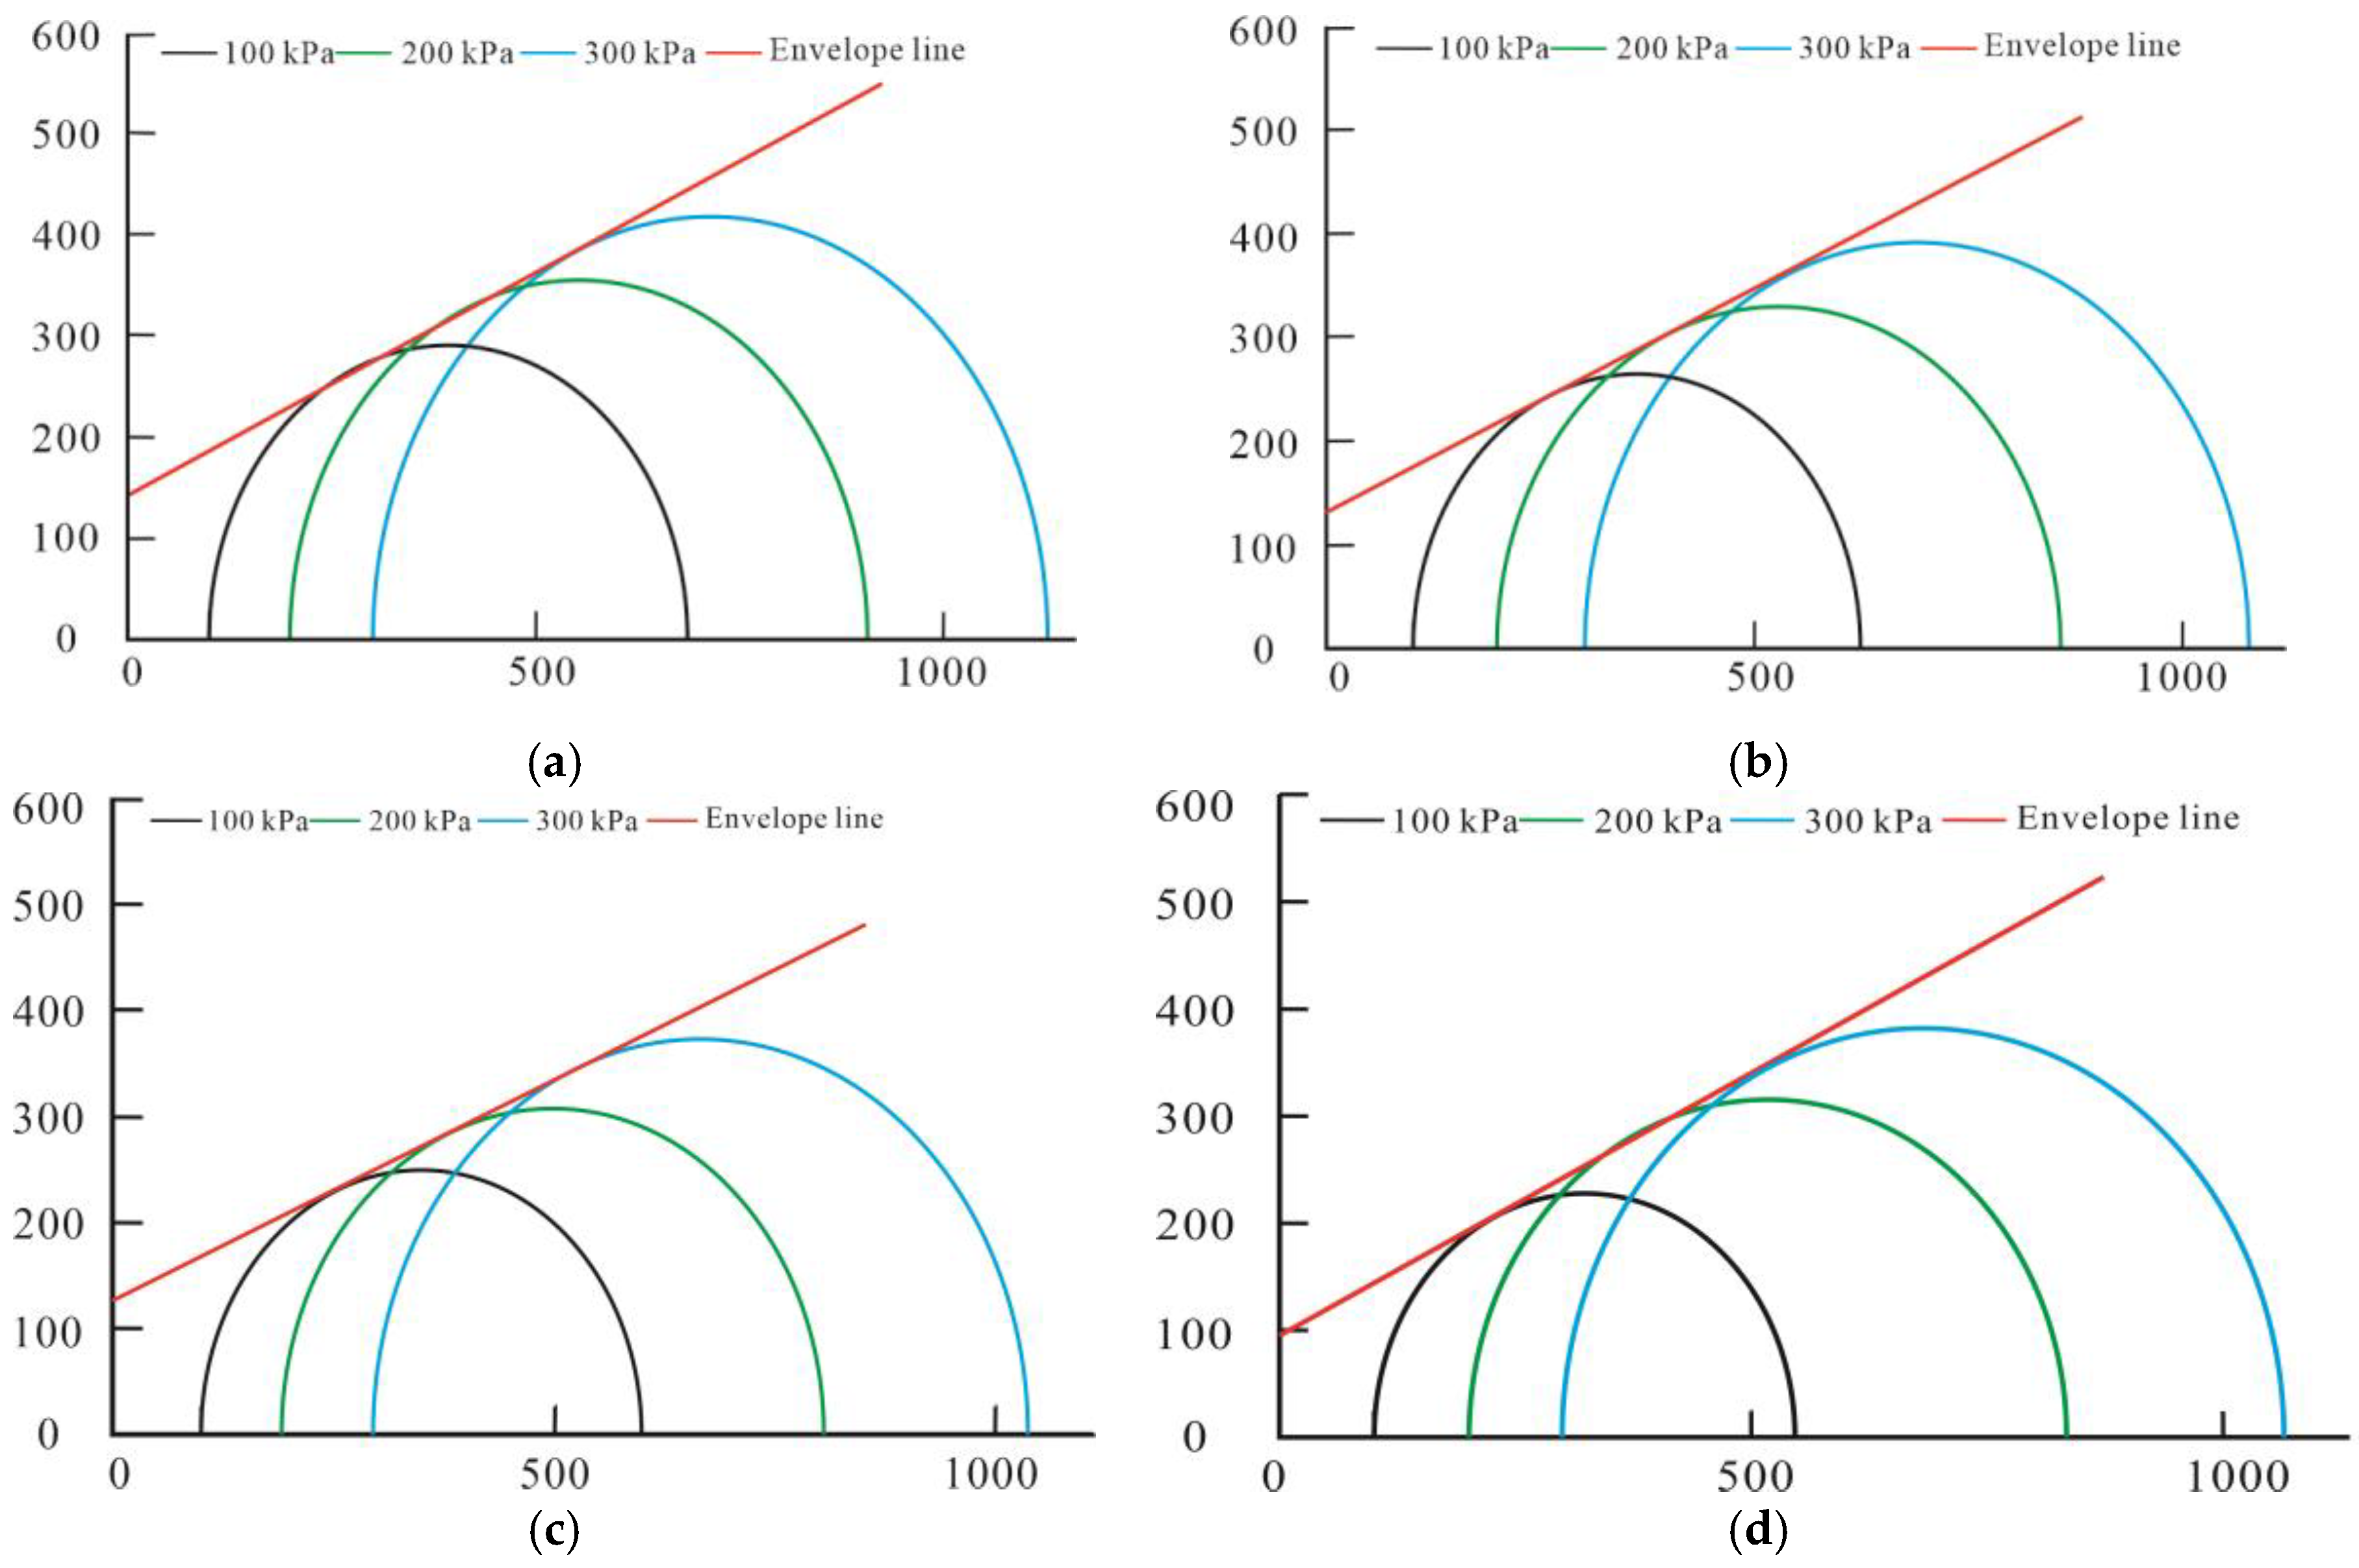
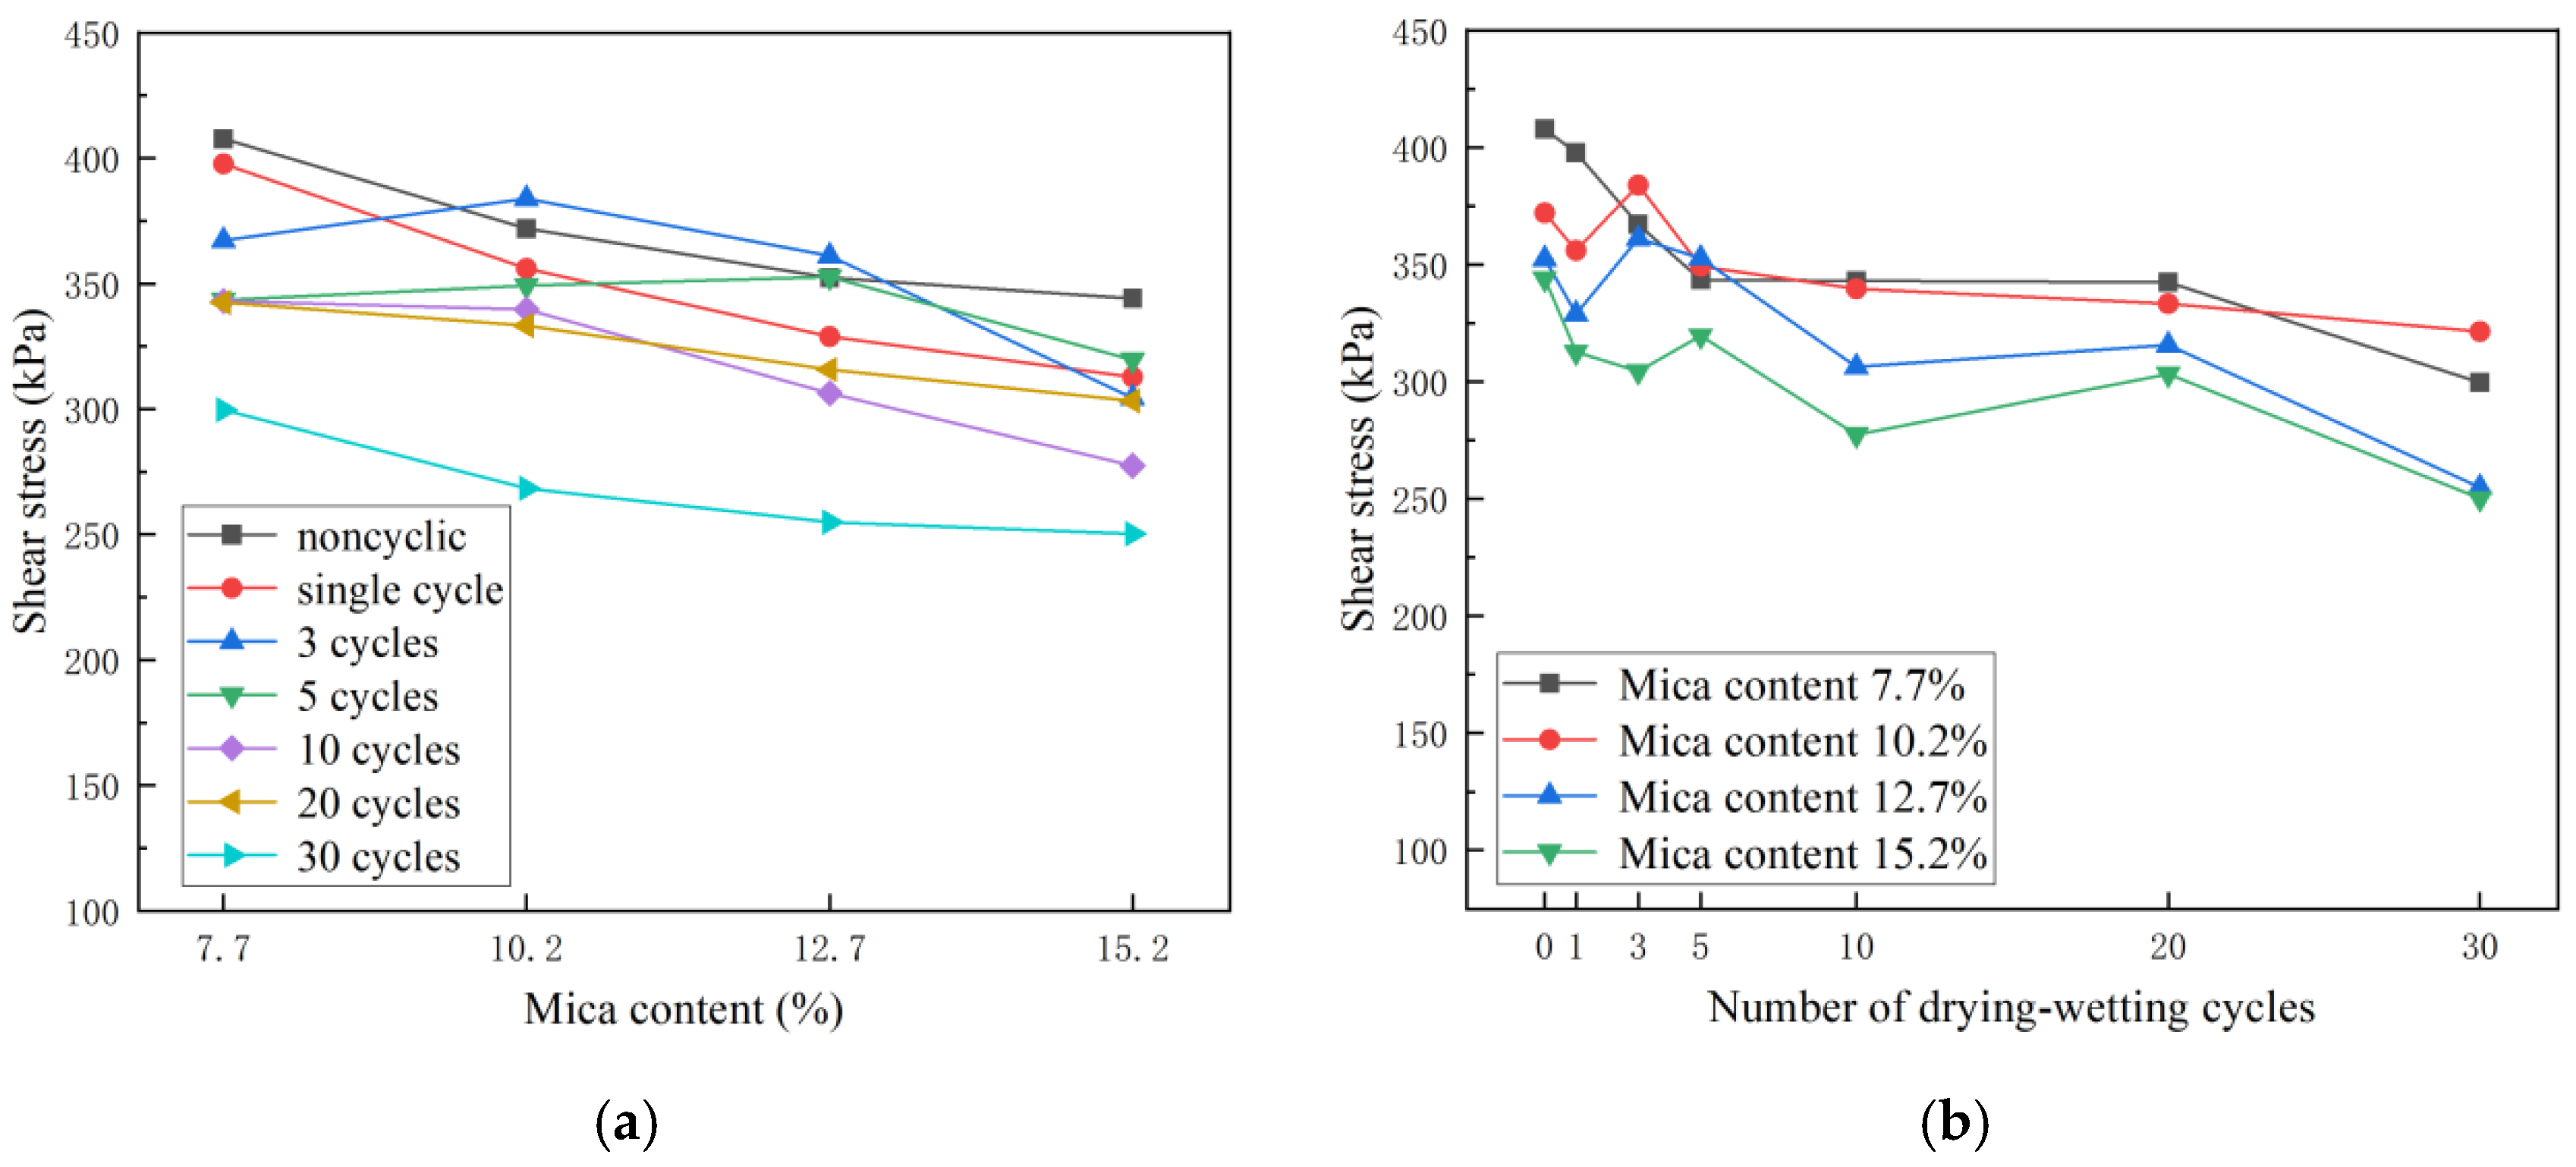
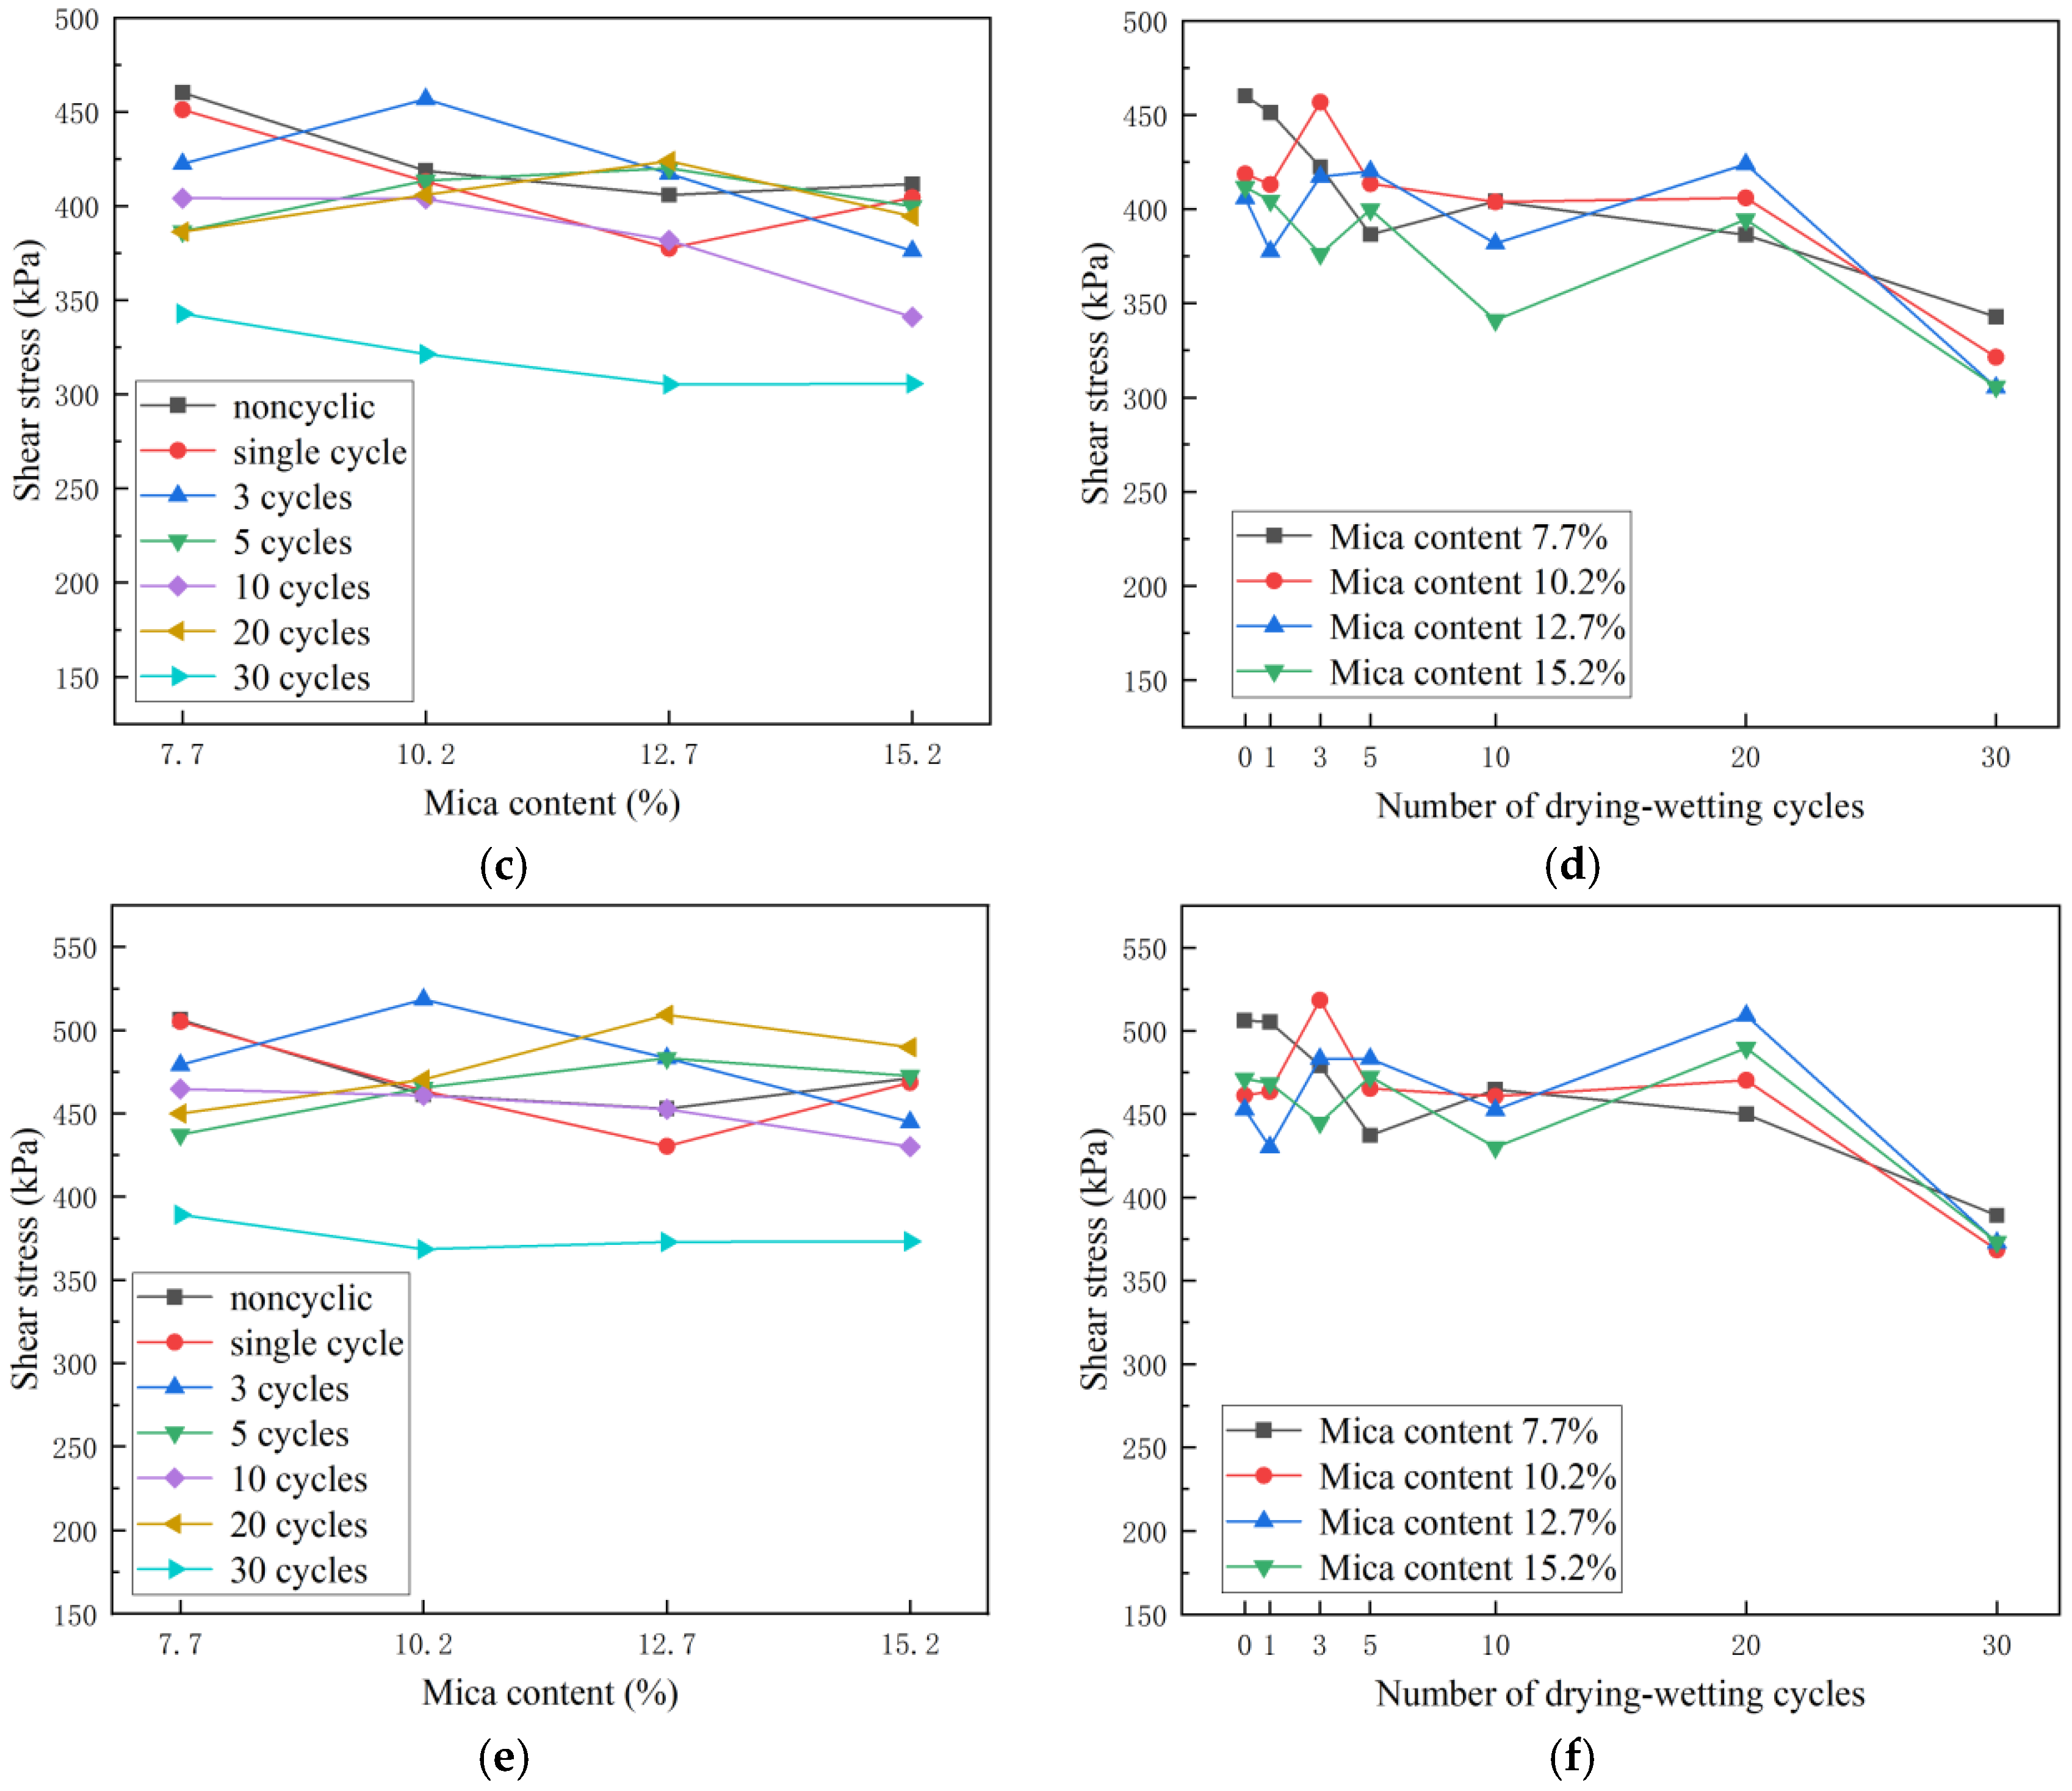
3.2.4. Analysis of Shear Strength Characteristics

According to the calculated shear strength index (c, φ), the Mohr-Coulomb law is used to determine the soil mass’s shear strength, as illustrated in Formula (2).
τ = c + σ tan φ
Figure 12 depicts the curve of the shear strength change with the mica content and the number of FTCs at various confining pressures. It could be seen that under the same number of FTCs and confining pressure conditions, the shear strength decreased with the increase in the mica content. The sample with the highest shear strength had a 7.7% mica content, whereas the sample with the lowest shear strength had a 15.2% mica content. The maximum dry density and shear strength of the loess with various mica contents decreased with an increase in the mica content. The shear strength showed a decreased trend, while fluctuating with the number of FTCs under the same mica content and confining pressure. For the same mica content and FTCs, the greater the confining pressure, the greater the shear strength.
The findings of the triaxial shear tests revealed that the quantity of FTCs and the amount of mica had a negative impact on the loess’s shear strength. The degree of deterioration was employed for the appropriate quantitative analysis to further examine the soil shear strength deterioration trend. The degree of deterioration of the shear strength was used to define the decline in the shear strength. When the shear strength increased, the degree of deterioration was considered to be 0 and was calculated by Formula (3).
T τ i = τ i 1 τ i τ i 1 × 100 %
where Tτi was the degree of deterioration of the shear strength after freezing and thawing cycles of group i (%); τi was the shear strength after the FTCs of group i (kPa).
Figure 13 shows the changing curve of the cumulative value of the shear strength degree of deterioration with the number of FTCs under different mica contents. According to the graph, the soil shear strength gradually deteriorated under the same number of FTCs and confining pressure circumstances as the amount that the mica content rose. When the mica content was 7.7%, the deterioration effect of FTCs was most significant. When the mica contents were 7.7% and 10.2%, respectively, the degree of deterioration of the first five FTCs changed significantly, and then tended to be stable. When the mica contents were 12.7% and 15.2%, respectively, the degree of deterioration of the first 10 FTCs changed significantly, and then tended to be stable. With an increase in the confining pressure and the same number of FTCs and mica content, the shear strength’s degree of degradation reduced. The degree of the shear strength degradation increased with the number of FTCs under the same mica content and confining pressure, demonstrating that the effect of the FTCs on the degradation of the shear strength was a cumulative process.

4. Discussion

Yili River Valley is in the western part of the Tianshan Mountains in China. Under the unique terrain and climate conditions, a significant amount of eolian loess has been formed in the area, which typically has frozen soil. The seasonal process of freezing and thawing has a significant effect on the slope stability. The mica content in the Yili valley loess is high. The instability mechanism of loess landslides has been previously studied under the action of FTCs. Additionally, studies have looked at how loess’s physical and mechanical characteristics are affected by water content and salt erosion. However, the impact of the material composition of loess on the slope stability, particularly the impact of mica on the physical and mechanical qualities of loess, has seldom been studied. Shi et al. investigated the effect of mica contents on Yili loess’s shear strength under a dry wet cycle [31]. The impacts of FTCs and mica content on the structural and mechanical characteristics of Yili River Valley loess were further investigated in this paper. The instability mechanism of the Yili loess landslide was revealed. The FTC test and the unconsolidated-undrained triaxial shear test were used to examine the shear strength of Yili loess. The findings revealed that when exposed to FTCs and an increase in mica content, Yili loess’ shear strength decreased. The cohesion of Yili loess considerably diminished with the addition of more FTCs and mica, and the shear strength showed a decreasing trend.
The shear strength of loess with various FTCs and mica content was studied in this research using the unconsolidated-undrained triaxial shear test, which corresponded to a certain limitation due to the difference from the natural state. Moreover, this paper only studied the macro aspect and ignored the micro-level changes in the loess. In future research, micro analysis should be combined with the appropriate level of detail.

5. Conclusions

Triaxial shear tests were carried out with remolded samples that had been subjected to FTCs in order to examine the effect of mica content on the mechanical strength of Yili valley loess under FTCs:
(1)
The density of the mica was lower than that of the loess. With the increase in the mica content, the maximum dry density of the loess with different mica contents decreased gradually, while the optimal water content showed an upward trend. After the maximum dry density was reached, the water content had a greater impact on the dry density.
(2)
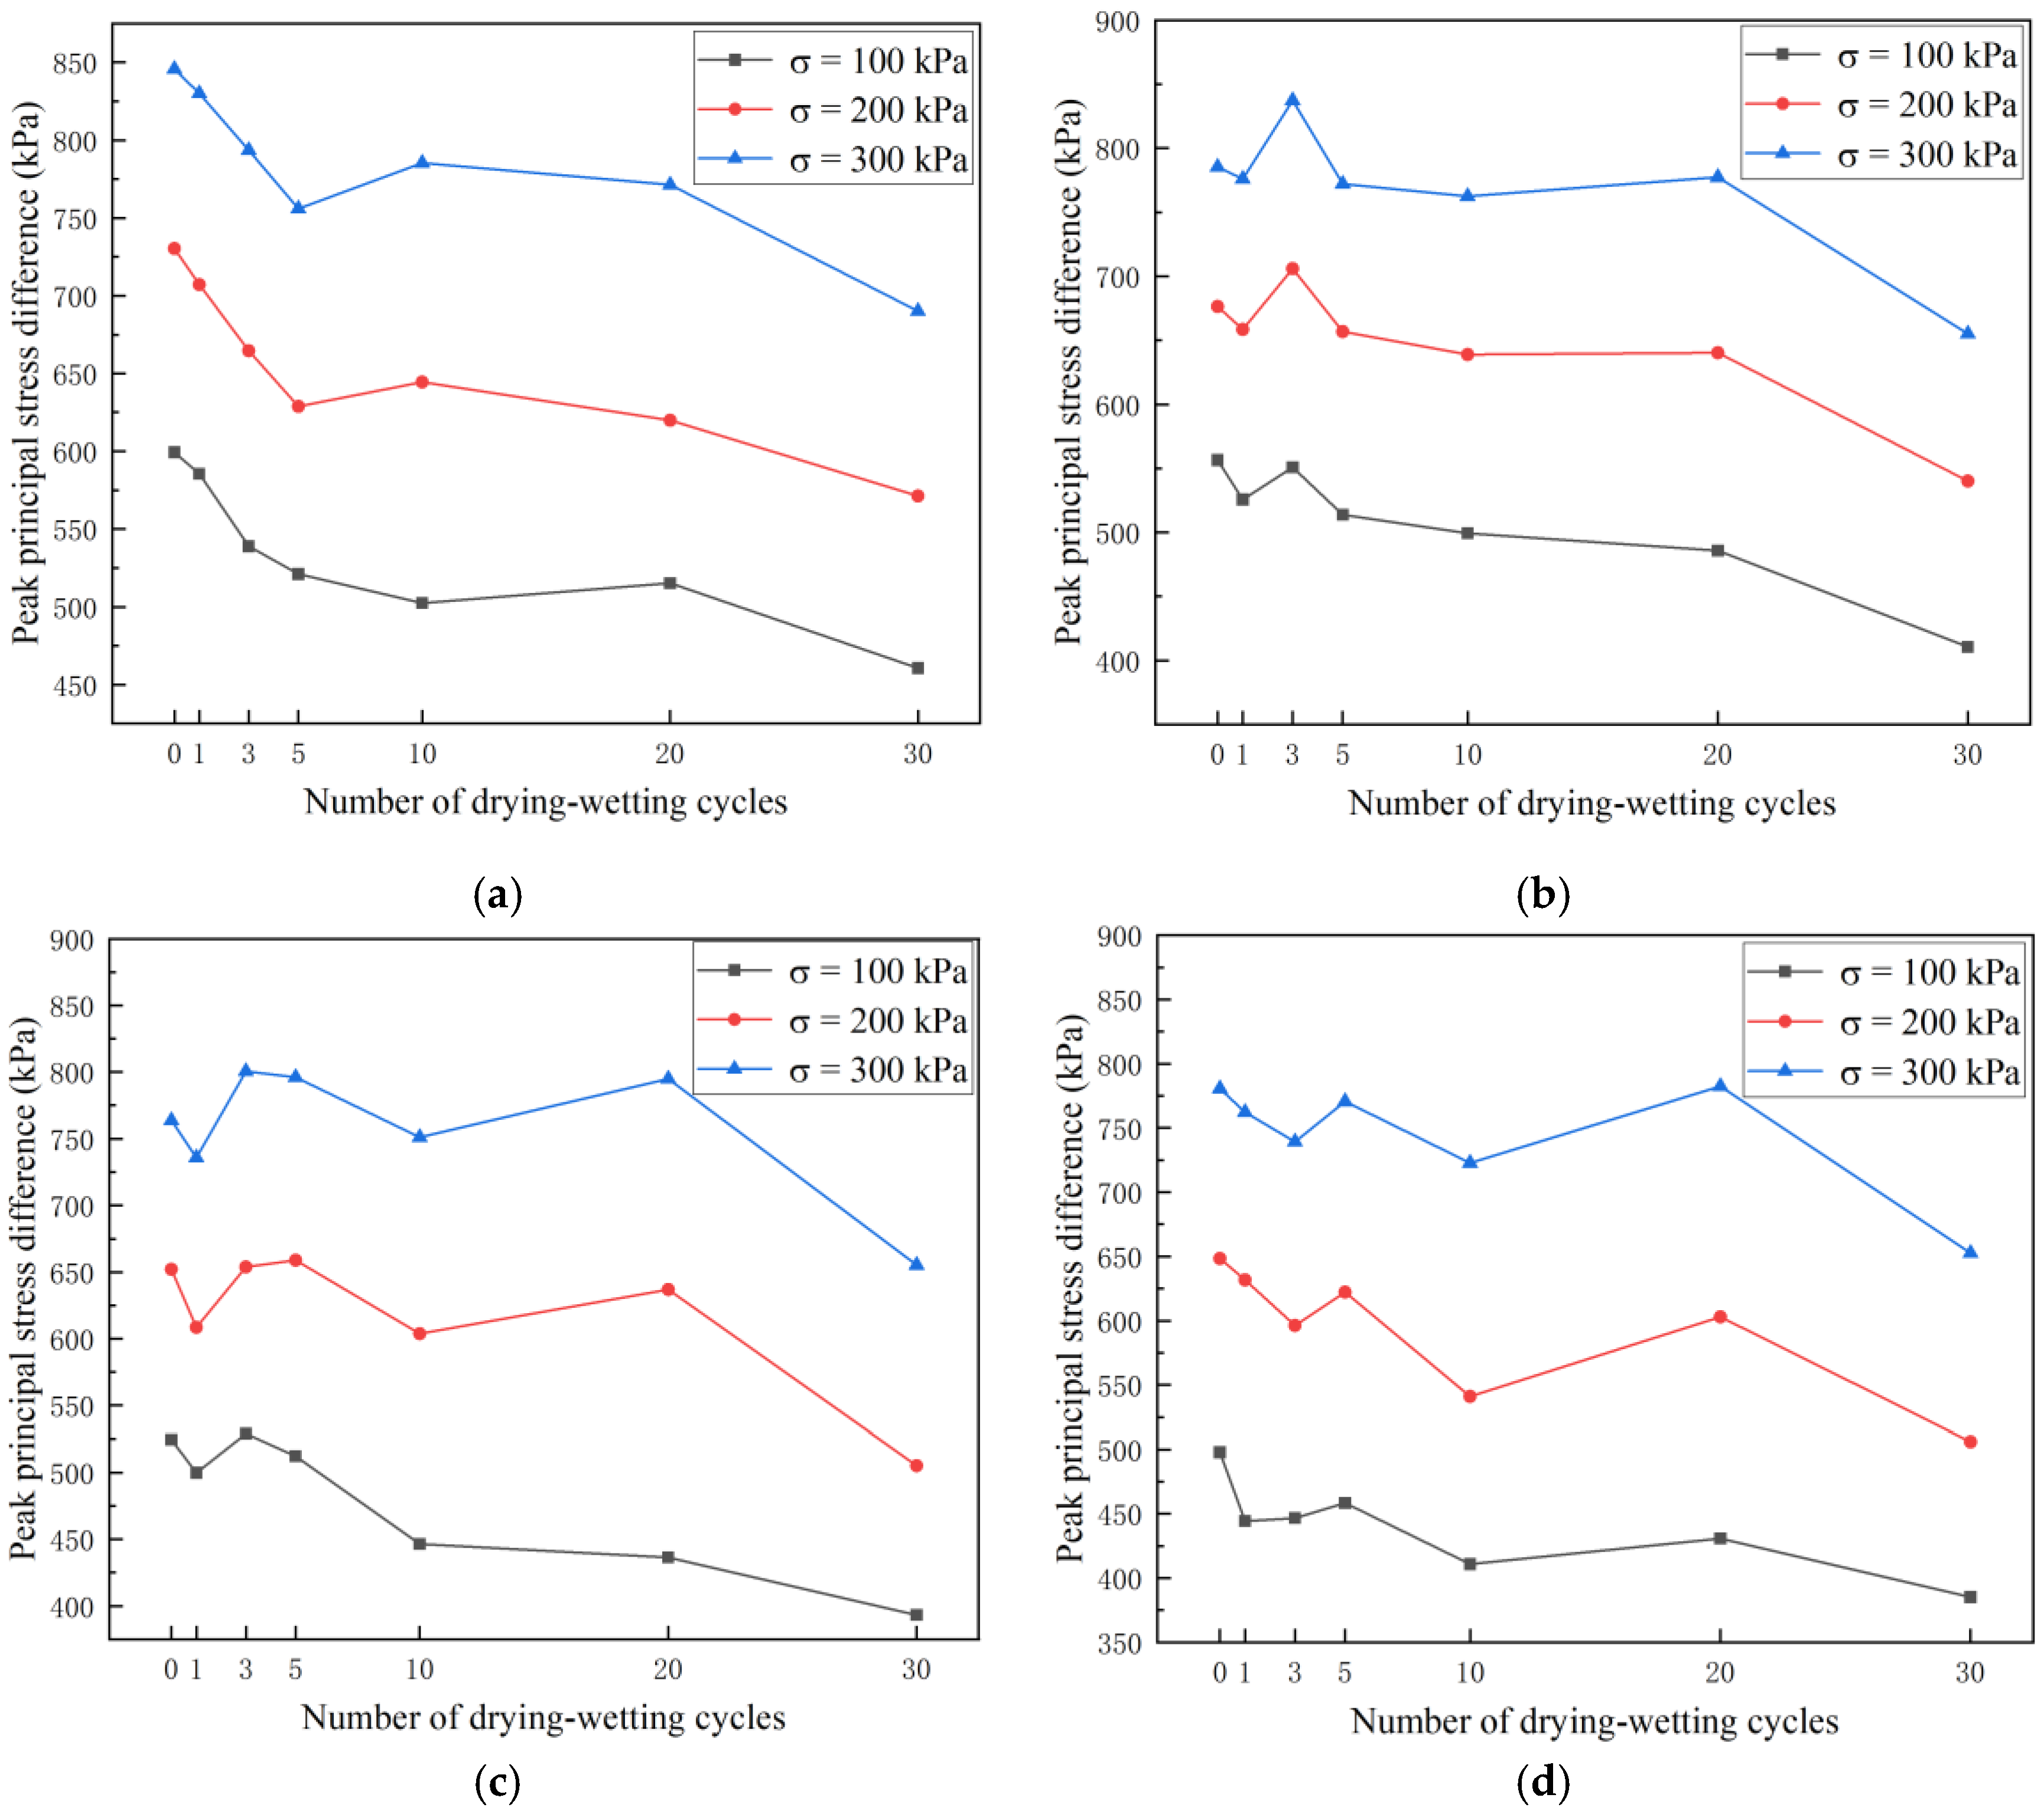
As the amount of mica in the mixture increased, the maximum primary stress decreased. The principal stress difference increased with the increase in the confining pressure. Although the peak principal stress difference fluctuated with the change in FTCs for a constant mica content, the trend was generally downward. Under the same FTCs and confining pressure, the peak principal stress difference decreased gradually when the mica content increased. The peak primary stress difference rose with an increase in the confining pressure under the same mica content and FTCs.
(3)
With an increase in FTCs, the elastic modulus of the loess with various mica contents dropped to diverse degrees. With the increase in the mica content, the elastic modulus of the loess with different mica contents decreased. With an increase in the confining pressure, the elastic modulus of the loess with various mica contents rose.
(4)
When the amount of mica in the soil increased, the cohesiveness of the soil dramatically decreased; however, the internal friction angle changed with an increasing trend under the same FTCs conditions. The internal friction angle increased initially, under varying mica contents, before decreasing, and the soil cohesiveness reduced as the number of FTCs grew.
(5)
Under the same FTCs and confining pressure, the shear strength decreased and the degree of the deterioration of the soil strength increased with the increase in the mica content. Under the same mica content and confining pressure, although the shear strength fluctuated, it showed an overall downward trend. The shear strength increased with the confining pressure.

Author Contributions

Conceptualization, Y.M. and Z.Z.; data curation, Y.M.; formal analysis, Y.M.; investigation, Y.M.; methodology, Y.M., T.Z. and Z.G.; project administration, Z.Z.; resources, Z.Z.; software, Z.G.; supervision, Z.Z.; validation, T.Z.; writing—original draft, Y.M. All authors have read and agreed to the published version of the manuscript.

Funding

This research was funded by the Xinjiang Uygur Autonomous Region Special Program for Key R&D Tasks (2021B03004) and the National Natural Science Foundation of China for Instability mechanism of losses landslides in Yili Valley under multiple FTCs (41967036).

Institutional Review Board Statement

Not applicable.

Informed Consent Statement

Not applicable.

Data Availability Statement

The manuscript contains the information used to support the study’s conclusions.

Conflicts of Interest

There are no conflicts of interest, according to the authors.

References

  1. Yin, G.; Wang, L.; Yuan, Z.; Li, Z.; Liu, H.; Wang, P.; Wu, G. Physical index dynamic property and landslide of IIi loess. J. Arid Lang Geography. 2019, 32, 899–905. [Google Scholar] [CrossRef]
  2. Wang, X.; Mai, Z. Sliding mechanism and deformation characteristics of typical large loess landslides in Yili Xinjiang. J. Water Resour. Archit. Eng. 2016, 14, 195–200. [Google Scholar]
  3. Niu, L.; Ren, W.; Zhang, A.; Wang, Y.; Liang, Z.; Han, J. Experimental study on the influence of soluble salt content on unsaturated mechanical characteristics of undisturbed Ili loess. Bulletin of Engineering Geology and the Environment. Bull. Eng. Geol. Environ. 2021, 80, 6689–6704. [Google Scholar] [CrossRef]
  4. Xiaohong, C.; He, M.; Yanjun, S.; Junmin, Z.; Maimaiti, A.; Juan, X. The development and distribution of loess landslides in Yili Valley and its causes. J. Xinjiang Geol. 2020, 38, 405–411. [Google Scholar]
  5. Zhu, S.; Yin, Y.; Wang, W.; Wei, Y.; Shao, H.; Huang, Z.; Zhuang, M.; Shi, A. Mechanism of Freeze–thaw Loess Landslide in Yili River Valley, Xinjiang. Acta Geosci. Sin. 2019, 40, 339–349. [Google Scholar]
  6. Wei, Y. The mineral characteristics of loess and depositing environment in Yili area, Xinjiang. J. Aird Zone Res. 2000, 17, 1–10. [Google Scholar] [CrossRef]
  7. Xu, J.; Ren, J.; Wang, Z.; Wang, S.; Yuan, J. Strength behaviors and meso-structural characters of loess after freeze-thaw. J. Cold Reg. Sci. Technol. 2018, 148, 104–120. [Google Scholar] [CrossRef]
  8. Xu, J.; Li, Y.; Lan, W.; Wang, S. Shear strength and damage mechanism of saline intact loess after freeze-thaw cycling. J. Cold Reg. Sci. Technol. 2019, 164, 102779.1–102779.13. [Google Scholar] [CrossRef]
  9. Qu, Y.L.; Ni, W.K.; Niu, F.J.; Mu, Y.H.; Chen, G.L.; Luo, J. Mechanical and electrical properties of coarse-grained soil affected by cyclic freeze-thaw in high cold regions. J. Cent. South Univ. 2020, 27, 853–866. [Google Scholar] [CrossRef]
  10. Zhou, Z.; Ma, W.; Zhang, S.; Mu, Y.; Li, G. Effect of freeze-thaw cycles in mechanical behaviors of frozen loess. Cold Reg. Sci. Technol. 2018, 146, 9–18. [Google Scholar] [CrossRef]
  11. Han, Y.; Wang, Q.; Wang, N.; Wang, J.; Zhang, X.; Cheng, S. Effect of freeze-thaw cycles on shear strength of saline soil. J. Cold Reg. Sci. Technol. 2018, 154, 42–53. [Google Scholar] [CrossRef]
  12. Liu, Y.; Wang, Q.; Liu, S.; ShangGuan, Y.; Fu, H.; Ma, B.; Chen, H.; Yuan, X. Experimental investigation of the geotechnical properties and microstructure of lime-stabilized saline soils under freeze-thaw cycling. J. Cold Reg. Sci. Technol. 2019, 161, 32–42. [Google Scholar] [CrossRef]
  13. Lu, J.; Wang, T.H.; Cheng, W.C.; Yang, T. Permeability anisotropy of loess under Influence of dry density and freeze-thaw cycles. J. Int. J. Geomech. 2019, 19, 04019103. [Google Scholar] [CrossRef]
  14. Qian, Z.; Lijun, S.; Hua, L.; Jinxi, Y. Investigation on the influence of freezing-thawing cycle on the permeability coefficient anisotropy of loess. J. Glaciol. Geocryol. 2020, 42, 843–853. [Google Scholar] [CrossRef]
  15. Li, S.; Li, Y.; Gao, X.; Shi, D. Effect of freezing and thawing on shear strength of intact loess. J. Civ. Environ. Eng. 2020, 42, 48–55. [Google Scholar] [CrossRef]
  16. Fu, X.; Zhang, Z.; Yang, C.; Yung, Q.; Ming, J. Study on geometric type changes of Fuping loess microstructure under freeze-thaw cycles. J. Glaciol. Geocryol. 2021, 43, 484–496. [Google Scholar] [CrossRef]
  17. Liu, Q.; Zhao, K.; Zhao, L.; Wang, L. Methods and exploration for mechanical testing and microscopic testing of loess under freeze-thaw cycles. Environ. MATEC Web Conf. 2022, 358, 01030. [Google Scholar] [CrossRef]
  18. Luqing, Z.H.A.O.; Gengshe, Y.A.N.G.; Di, W.U. Micro Structure and fractal characteristics loess under Freeze-thaw Cycles. Chin. J. Undergr. Space Eng. 2019, 15, 1680–1690. [Google Scholar]
  19. She, H.; Hu, Z.; Qu, Z.; Li, H.; Guo, H.; Ma, X. Structural Strength Deterioration Characteristics and a Model of Undisturbed Loess under the Action of Wetting and Freeze-Thaw Cycles. Math. Probl. Eng. 2019, 2019, 4790250. [Google Scholar] [CrossRef]
  20. Li, G.; Wang, F.; Ma, W.; Fortier, R.; Mu, Y.; Mao, Y.; Hou, X. Variations in strength and deformation of compacted loess exposed to wetting-drying and freeze-thaw cycles. Cold Reg. Sci. Technol. 2018, 151, 159–167. [Google Scholar] [CrossRef]
  21. Yan, C.; Zhang, Z.; Jing, Y. Characteristics of strength and pore distribution of lime-flyash loess under freeze-thaw cycles and dry-wet cycles. Arab. J. Geosci. 2017, 10, 544. [Google Scholar] [CrossRef]
  22. Liu, K.; Ye, W.; Jing, H. Shear Strength and Microstructure of Intact Loess Subjected to Freeze-Thaw Cycling. Adv. Mater. Sci. Eng. 2021, 2021, 1173603. [Google Scholar] [CrossRef]
  23. Li, S.; Li, Y.; Gao, X.; Shi, D. Experimental study on the triaxial stress-strain curve of undisturbed Loess in Xining by Freeze-thaw Cycles. OP Conf. Ser. Earth Environ. Sci. 2019, 304, 052065. [Google Scholar] [CrossRef]
  24. Lingling, Z.; Jianhui, L.; Xianli, X.; Xiaojuan, G. Study on the properties of malan loess in lyuliang area under ureeze-thaw cycles. J. Taiyuan Univ. Technol. 2021, 52, 563–577. [Google Scholar]
  25. Zheng, F.; Shao, S.; Wang, S. Effect of freeze-thaw cycles on the strength behaviour of recompacted loess in true triaxial tests. J. Cold Reg. Sci. Technol. 2021, 181, 103172. [Google Scholar] [CrossRef]
  26. Yang, M. Study on Mechanical Properties of Sand Loess Modified by Cement under Freeze-Thaw Condition. Master’s Thesis, Lanzhou Jiaotong University, Lanzhou, China, 2020. [Google Scholar] [CrossRef]
  27. Kong, F.; Nie, L.; Xu, Y.; Rui, X.; He, Y.; Zhang, T.; Wang, Y.; Du, C.; Bao, C. Effects of freeze-thaw cycles on the erodibility and microstructure of soda-saline loessal soil in Northeastern China. Catena 2022, 209, 105812. [Google Scholar] [CrossRef]
  28. Liu, J.; Chang, D.; Yu, Q. Influence of freeze-thaw cycles on mechanical properties of a silty sand. Eng. Geol. 2016, 210, 23–32. [Google Scholar] [CrossRef]
  29. Hao, R.; Zhang, Z.; Guo, Z.; Huang, X.; Lv, Q.; Wang, J.; Liu, T. Investigation of changes to triaxial shear strength parameters and microstructure of Yili loess with drying-wetting cycles. Materials 2022, 15, 255. [Google Scholar] [CrossRef]
  30. Lv, Q.; Zhang, Z.; Zhang, T.; Hao, R.; Guo, Z.; Huang, X.; Zhu, J.; Liu, T. The trend of permeability of loess in Yili, China, under freeze-thaw cycles and its microscopic mechanism. Water 2021, 13, 3257. [Google Scholar] [CrossRef]
  31. Shi, G.; Li, X.; Guo, Z.; Zhang, Z.; Zhang, Y. Effect of Mica Content on Shear Strength of the Yili Loess under the Dry-Wet Cycling Condition. Sustainability 2022, 14, 9569. [Google Scholar] [CrossRef]
Figure 1. Satellite image of sampling position.
Sustainability 15 03329 g001
Figure 2. Particle size distribution.
Sustainability 15 03329 g002
Figure 3. Freezing and thawing cycle temperature path.
Sustainability 15 03329 g003
Figure 4. Compaction curve of loess with different mica contents.
Sustainability 15 03329 g004
Figure 5. Maximum dry density and Optimum moisture content of loess with different mica contents.
Sustainability 15 03329 g005
Figure 6. Stress-strain relationship curve of the samples after one FTC (a) mica content of 7.7%; (b) mica content of 10.2%; (c) mica content of 12.7%; (d) mica content of 15.2%.
Sustainability 15 03329 g006
Figure 7. Relationship curve between the peak principal stress difference and FTCs for a mica content of (a) 7.7%; (b) 10.2%; (c) 12.7%; (d) 15.2%.
Sustainability 15 03329 g007
Figure 8. Variation of elastic modulus with the number of FTCs having a mica content of (a) 7.7%; (b) 10.2%; (c) 12.7%; (d) 15.2%.
Sustainability 15 03329 g008aSustainability 15 03329 g008b
Figure 9. Mohr circle and strength envelope after one freeze-thaw cycle a mica content of (a) 7.7%; (b) 10.2%; (c) 12.7%; (d) 15.2%.
Sustainability 15 03329 g009
Figure 10. Relationship between mica content and cohesion (a) and internal friction angle (b).
Sustainability 15 03329 g010
Figure 11. The relationship between the number of FTCs and the cohesion (a) and internal friction angle (b).
Sustainability 15 03329 g011
Figure 12. Shear strength change curve (a) variation of shear strength with mica contents under the confining pressure of 100; (b) the changing of the shear strength changes with the number of FTCs under the confining pressure of 100; (c) the changing of shear strength with mica contents under the confining pressure of 200; (d) the changing of the shear strength with the number of FTCs under the confining pressure of 200; (e) the changing of the shear strength with mica contents under the confining pressure of 300; (f) the changing of the shear strength with the number of the FTCs under the confining pressure of 300.
Sustainability 15 03329 g012aSustainability 15 03329 g012b
Figure 13. Shear strength decline curve for mica contents of (a) 7.7%; (b) 10.2%; (c) 12.7%; (d) 15.2%.
Sustainability 15 03329 g013
Table 1. Mineral composition analysis table for each sampling position (%).
Sampling PositionSample
Numbers
QuartzCalciteDolomiteFeldsparMicaOther
Minerals
foot of slopeX-144.2 16.4 2.8 17.82.0 16.8
X-242.3 17.1 1.9 15.41.6 21.7
X-333.7 11.9 2.2 31.9 1.8 18.5
middle of slopeY-135.923.44.718.96.910.2
Y-236.320.92.622.57.510.2
Y-331.717.51.926.28.614.1
top of slopeZ-127.721.94.019.415.311.7
Z-228.121.13.219.515.013.1
Table 2. Basic physical indicators.
Natural
Moisture
Content (%)
Natural
Density
(g/cm3)
Natural Dry
Density (g/cm3)
Plastic Limit (%)Liquid Limit (%)Maximum
Dry Density (g/cm3)
Optimum
Moisture
Content (%)
21.041.621.3416.1527.051.7616.28
Disclaimer/Publisher’s Note: The statements, opinions and data contained in all publications are solely those of the individual author(s) and contributor(s) and not of MDPI and/or the editor(s). MDPI and/or the editor(s) disclaim responsibility for any injury to people or property resulting from any ideas, methods, instructions or products referred to in the content.

