Article

Combined Impacts of Climate Change and Water Withdrawals on the Water Balance at the Watershed Scale—The Case of the Allier Alluvial Hydrosystem (France)

1
Université de Franche-Comté, CNRS, UMR 6249 Chrono-Environnement, F25030 Besançon, France
2
Université Clermont Auvergne, CNRS, UMR 6296 Institut de Chimie de Clermont-Ferrand, F63178 Aubière, France
3
Université Clermont Auvergne, CNRS, UMR 6254 Laboratoire Magmas et Volcans, F63178 Aubière, France
*
Author to whom correspondence should be addressed.
Sustainability 2023, 15(4), 3275; https://doi.org/10.3390/su15043275
Submission received: 23 November 2022 / Revised: 27 January 2023 / Accepted: 3 February 2023 / Published: 10 February 2023

Abstract

:
The Allier River and its alluvial aquifer constitute a shallow but highly productive water resource due to their hydrodynamic properties. This hydrosystem provides almost all of the water requirements for domestic supply and irrigation. Recent dry summers (such as those in 2015, 2019, and 2022) and the lack of winter recharge have led managers to question the sustainability of this resource. We proposed the use of hydrological modelling with Gardenia with which the water balance can be determined at the watershed scale (7020 km2) and with which forecasting simulations can be performed for 2030–2070. Thus, this work was divided into (1) model calibration (2000–2020), (2) the determination of the main drivers of the water balance (2000–2020), (3) and river flow and groundwater level simulation (2030–2070). For the latter, Gardenia was used considering a “better case”, using the RCM Aladin63 in RCP2.6, and considering a “worst case”, using the RCM RegCM4-6 in RCP8.5. The calibration for 2000–2014 showed good reproducibility of river flows (NSE = 0.91) and groundwater levels (NSE = 0.85). The model showed that the major drivers in 2000–2020 were actual evapotranspiration and effective precipitation, which, respectively, represented 68% and 32% of mean annual precipitation. Water withdrawals did not significantly contribute to the water balance with the exception of those in very dry summers, such as those in 2003, 2005, 2015, and 2019. Climate appeared, therefore, as a prevalent factor of the Allier hydrosystem functioning compared to global withdrawals except for that during these dry years. Prospective simulations showed a decline in annual river flows and groundwater levels by a maximum of −15% and −0.08 m asl (“worst case”), respectively. These simulations showed that the Allier hydrosystem will be able to meet the water needs for various uses until 2070. In detail, it is likely that summer shortages will no longer be compensated by the Naussac Dam if the hydrosystem faces more than two years of drought. In this case, water-saving solutions will have to be found. This study is, thus, a good example of the application of hydrological modelling to address management issues in such a hydrosystem.

1. Introduction

Quantifying the spatial and temporal variations of a water budget is essential for improving our understanding of the availability of water resources, the risk of hydrologic extremes such as floods and droughts, and the implications of climate change [1]. The water budget, or balance, is the inflow of water from precipitation and the outflow of water through evapotranspiration according to Thornthwaite and Mather (1957) [2]. The local annual water balance is controlled by the distribution over time of water supplies (e.g., precipitation) and demands (e.g., potential evapotranspiration) balanced by the storage of water in the root zone of the soil [3]. Although, there are different formulations, it mostly depends on the scale of investigation, and, thus, the parameters to be considered can differ. At the watershed scale, it could be expressed as P = ETa + R ± ΔW ± ΔS, which is readapted from Hasenmueller and Criss (2013) [4], where precipitation (P) is distributed between actual evapotranspiration (ETa), runoff (R), and withdraws (ΔW) and is modulated by the changes in groundwater/soil water storage (ΔS). Precipitation constitutes, in general, the largest component in a water balance equation [5]. It can generate outflow through ETa or induce the direct recharge of groundwater through direct vertical percolation in the vadose zone [6]. Groundwater recharge is a strategic hydrologic variable that needs to be estimated for sustainable groundwater management, especially within the global warming context [7]. Anthropogenic water withdrawals are, most of the time, not considered in water balance assessments. They might be difficult to estimate at a large spatial scale. However, groundwater occupies a predominant role in sustaining human activities by being the world’s largest distributed freshwater reservoir [8]. The UNESCO report [9] indicated that 69% of groundwater withdrawals are for the agricultural sector, 22% are for domestic uses, and 9% are for industrial purposes.
Many types of aquifers can be used around the continents [10]. Among them, alluvial formations are distinguished by their minor role in regional groundwater flow and by their large to very large groundwater storage capacity. Unconsolidated sand and gravel formations constitute the world’s most easily accessible and most widely tapped aquifers. In France, alluvial aquifers also play a major role as they provide about 45% of France’s groundwater use [11]. Among the socioeconomic activities requiring water, irrigation is a contributing factor in alluvial system vulnerability and groundwater level decreases [12,13,14,15,16,17]. Climate change is likely to amplify the water resource demands [18] and, thus, enhances the current alluvial groundwater depletion.
Worldwide, it has been reported in other studies that the piezometric level of alluvial aquifers is decreasing within various proportions: −5.6 × 10⁻³ to −1.49 m/y in India [19] from 1996 to 2016, −0.2 m/y in Australia [20] from 1971 to 2021, and −1 m/y in China [21] from 1996 to 2022. Godwin et al. (2022) even reported drops in the piezometric level ranging from −5 m to −30 m in 2015 in Arkansas (US) [22]. Such as with groundwater, streamflow regimes have also been altered [23,24,25,26,27,28]. The impact of human activities on water resource decreases is, therefore, unequivocal. Thus, it is necessary to implement adapted methodologies to better understand the impact of natural and anthropogenic pressures on water resources, such as climate change and withdrawals, respectively. Conceptual or analytical approaches can be used [29], but hydrological modelling and rainfall-runoff models are still the most widely used methods [30,31,32]. The selection of an appropriate type of model is an important issue which depends on the availability, length, and quality of the hydrometeorological and geomorphological data at spatial scales of regular intervals [29]. The choice of an adequate model is complex, as there are different categories and subcategories. According to Lee et al. (2005) [33], there is no evidence of a relationship between catchment type and a preferred model structure. Khakbaz et al. (2012) [34] used different calibration strategies and concluded that lumped calibration performed better than distributed calibration. Thus, the choice of a perfect model does not exist, and one must adapt to the available dataset and the objectives of the study that is being carried out.
On the one hand, there are physically based models whose structures depend on the spatial distribution and variation of physical parameters, such as the MIKE SHE [35,36], the HydroGeoSphere [37,38], and the SWAT [39,40] models. The latter requires spatially distributed data, such as the digital elevation model (DEM), the land cover and uses, soil properties, and climate data (precipitation, air temperature, solar radiation, and others). On the other hand, there are indeed conceptual and lumped models designed to approximate within their structures the general physical mechanisms which govern the hydrological cycle [41]. In the present category, the TOPMODEL [42,43], the HBV [44,45], and the GR4J [46,47] models can be mentioned. Based on reservoir modelling, they are less demanding in data input and are mostly based on averaged precipitation and air temperature to determine potential evapotranspiration. This very brief review of the main models is not exhaustive but shows that the range of possibilities is large. The final choice is then mainly ruled by the available amount and the variety of data. In this study, the conceptual model Gardenia [48,49] was chosen. Indeed, it allows one to model the river flows at the watershed’s outlet and groundwater levels based only on the precipitation and potential evapotranspiration data. It has the advantages of considering the water cycle as a whole (from precipitation, groundwater recharge, runoff, and withdrawals to the river outflow) and being calibrated based on a reasonable number of parameters (8 to 10). However, Gardenia only requires one record for each hydrological parameter, which led us to use methods to average them at the scale of the study area.
Such a model can be easily applied to any alluvial watershed, and it allowed us to determine the main factors driving the water balance and the projected evolution of water availability in a climate change context. In this framework, the present study focused on the Allier hydrosystem (i.e., the Allier River and its alluvial aquifer), which constitutes a major regional water resource supplying different uses (domestic water and irrigation mostly) and which faces an increasing water demand and a regular decrease in recharge.

2. Materials and Methods

2.1. Description of the Study Area

The whole Allier River Watershed covers a surface of 14,310 km2 in Central France [50]. The Allier River’s source is to the south of the catchment at 1473 m asl, and it flows towards the Loire River. The present study focused on the southern part of this watershed, which covers an area of 7020 km2 (Figure 1a) from the river source to Limons (270 m asl), which is considered to be the outflow point (Figure 1b). It is characterized by a contrasted distribution of elevation levels varying between 1700 and 270 m asl, thus generating heterogeneous precipitations fields.
The south of the catchment and all the reliefs surrounding the Limagne rift receive higher quantities of precipitation, from 800 to 1600 mm/y, sometimes exceeding 2000 mm/y. On the contrary, the Limagne plain is known to be deficient, with mean precipitation limited to 500–600 mm/y [51]. In addition, this parameter changes with time. For example, at the station of Clermont–Ferrand, the yearly precipitation sum is 570 ± 90 mm/y (averaged over 2000–2020), with an observed minimum of 380 mm in 2015 and a maximum of 735 mm in 2008. Annual mean air temperatures also vary depending on the elevation: 12.1 ± 0.7 °C in Clermont–Ferrand versus 8.3 ± 0.8 °C in St-Etienne-de-Ludgares (averaged over 2000–2020).
The hydrological regime of the Allier River is, thus, subject to both intense floods and severe droughts in summer. At Limons, the daily mean river discharge is 70 m3/s (1974–2020), which ranges between a minimum of 2.8 m3/s observed on 08/06/1975 and a maximum of 1120.0 m3/s observed on 12/04/2003. In 1983, the Naussac Dam, located near the Allier River source (Figure 1b), was built to ensure a minimum discharge into the Allier River. One of its purposes is to ensure a minimum discharge into the Allier River so that the nuclear power plants, located downstream of the Loire River, have enough water to cool their reactors. This dam consists of a reservoir lake of 190 × 106 m3 at the maximum of its capacity that must guarantee a minimum flow of 6 m3/s. It takes approximatively two years of precipitation to fully recharge this dam.
Regarding its global geology, the upstream part of the study area (Figure 1b) is made of crystalline rocks presenting with very low permeability. It is drained by the Allier River and its main tributary, the Alagnon River. The downstream part is dominated by the Limagne rift, an elongated tectonic depression within the Hercynian crystalline massif [52]. This Oligocene graben favored the setting of the Allier alluvial aquifer [53], which consists of an unconfined alluvium layer with a 10–15 m depth and a 0.1 m to 3–4 km width.
The land use is mainly occupied by grasslands and forests in the upstream part, while, within the Limagne rift, flatter elevation levels have favored an important urban and agricultural development that benefits from the presence of fertile lands and the availability of superficial and groundwater resources. Indeed, the Allier River supplies water for almost all agricultural needs (92%), and its alluvial aquifer supplies water for 60% of domestic water uses.
Hence, there are noticeable contrasts (in topography, climatology, geology, and land uses) between the upstream and downstream part of the study area (Figure 1b). Thus, we aimed to analyze the hydrological and anthropogenic parameters (from 2000 to 2020) of these two areas, separately. Hydrological modelling with Gardenia was carried out on the downstream part, where the Allier hydrosystem is located.

2.2. Available Data on the Study Area

Several climatic and hydrological data collected in the study area have been used, such as precipitation, air temperature, river flows, groundwater levels, and water withdrawals for the different uses (domestic, irrigation).
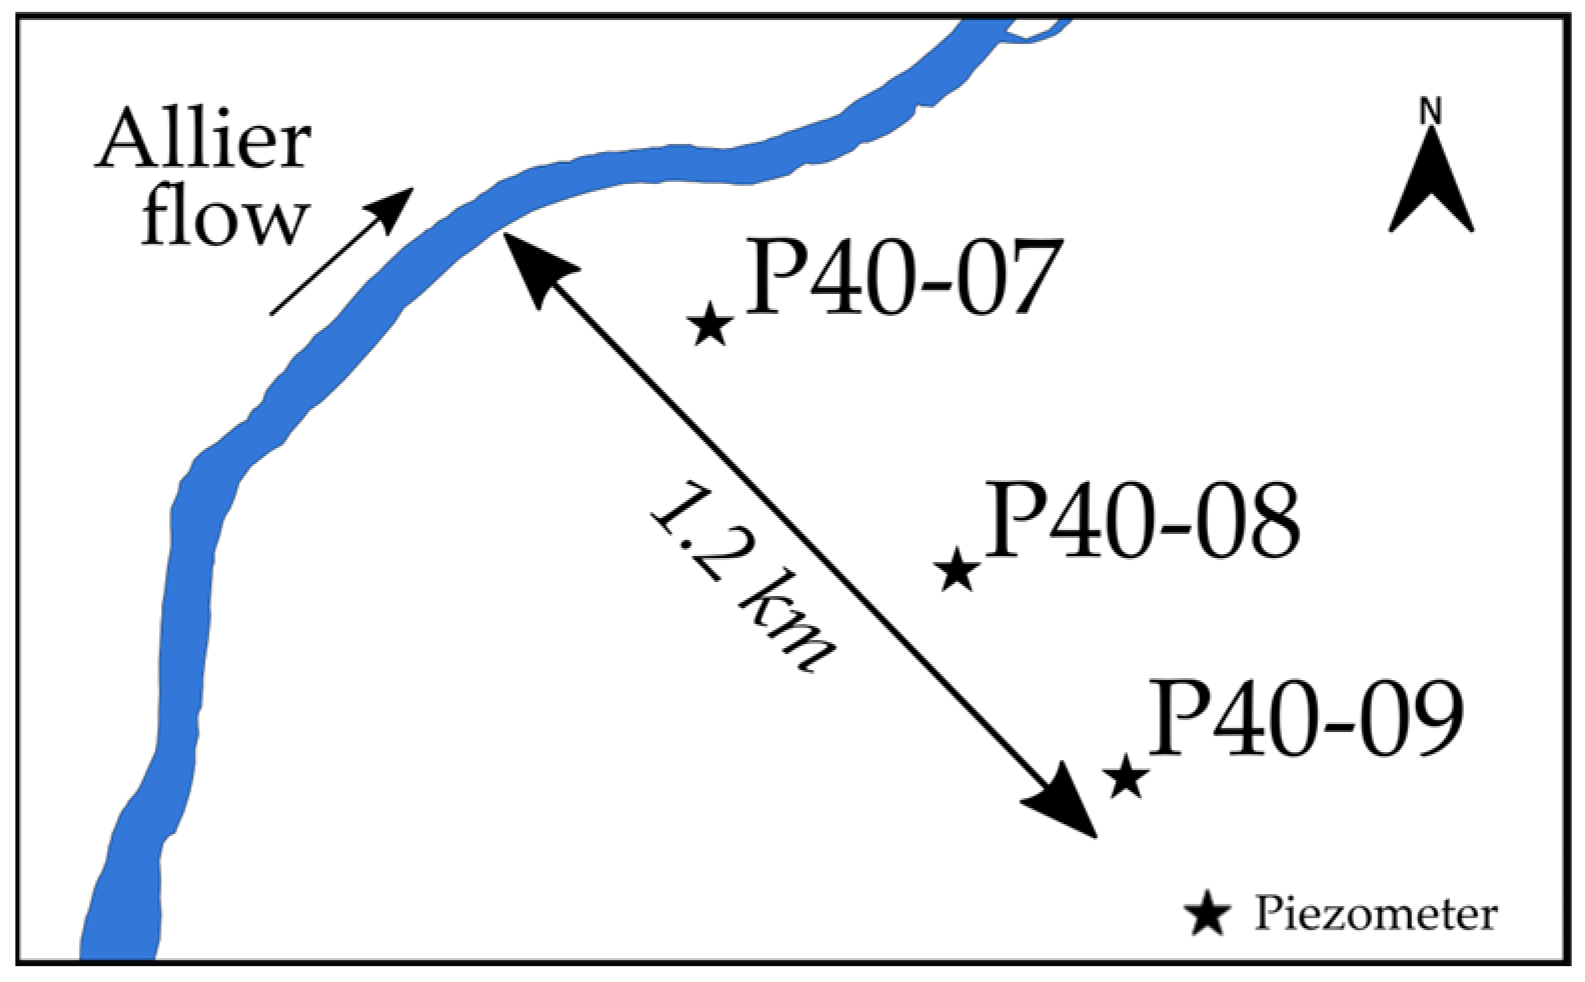
The longest precipitation and air temperature datasets were recorded from 1974 to 2020 in Clermont–Ferrand (x = 3.15, y = 45.79, and z = 331 m asl) for temperature and in St-Etienne-de-Ludgarès (x = 3.95, y = 44.65, z = 1022 m asl) for precipitation. For the gauging stations of the Allier River, it is also possible to go back to 1974 in Vieille-Brioude and Limons. The more recent period of 2000–2020 is better documented, and the following data were collected (Table 1): (1) daily precipitation and air temperature from 23 weather stations distributed along the entire watershed, (2) daily river flows from three gauging stations installed on the Allier River watercourse in Vieille-Brioude and in Limons (QVB and QLIMONS) and on the Alagnon River (QALGN), (3) daily discharges of the Naussac Dam (QNAUSS), (4) water withdrawals for domestic and irrigation uses, and (5) groundwater levels at four locations between 2007 and 2020 (Figure 1b). We focused on data from three available piezometers located close to Culhat and at different distances from the Allier River (see P40-07, P40-08, and P40-09 in Figure A1).
Water withdrawal data included domestic and irrigation supplies expressed as volume per year. Domestic supply was assumed to be constant throughout the year; we then divided the annual volume by 365 and reported an equal volume of withdrawal each day. Irrigation occurred from April to September in the following proportions: 2% in April, 2% in May, 12% in June, 51% in July, 32% in August, and 1% in September. The annual volume was, thus, distributed daily over these six months and was reported each day according to the previous percentages.
The Naussac Dam’s water releases were naturally included in the incoming Allier River discharge in Vieille-Brioude (Figure 1b). They were, thus, considered in the model and in the forecast section of this work. As mentioned before, a purpose of the Naussac Dam is to ensure a minimum river flow at several control points, such as in Vieille-Brioude, where the dam must guarantee a flow of 6 m3/s at least. This was also considered in the forecast section. In the model, we assume that the dam would be able to provide a flow of 6 m3/s in Vieille-Brioude during the considered period (2030–2070).
A list of the main used abbreviations is provided in Table A1.

2.3. Description of the Hydrological Model Gardenia

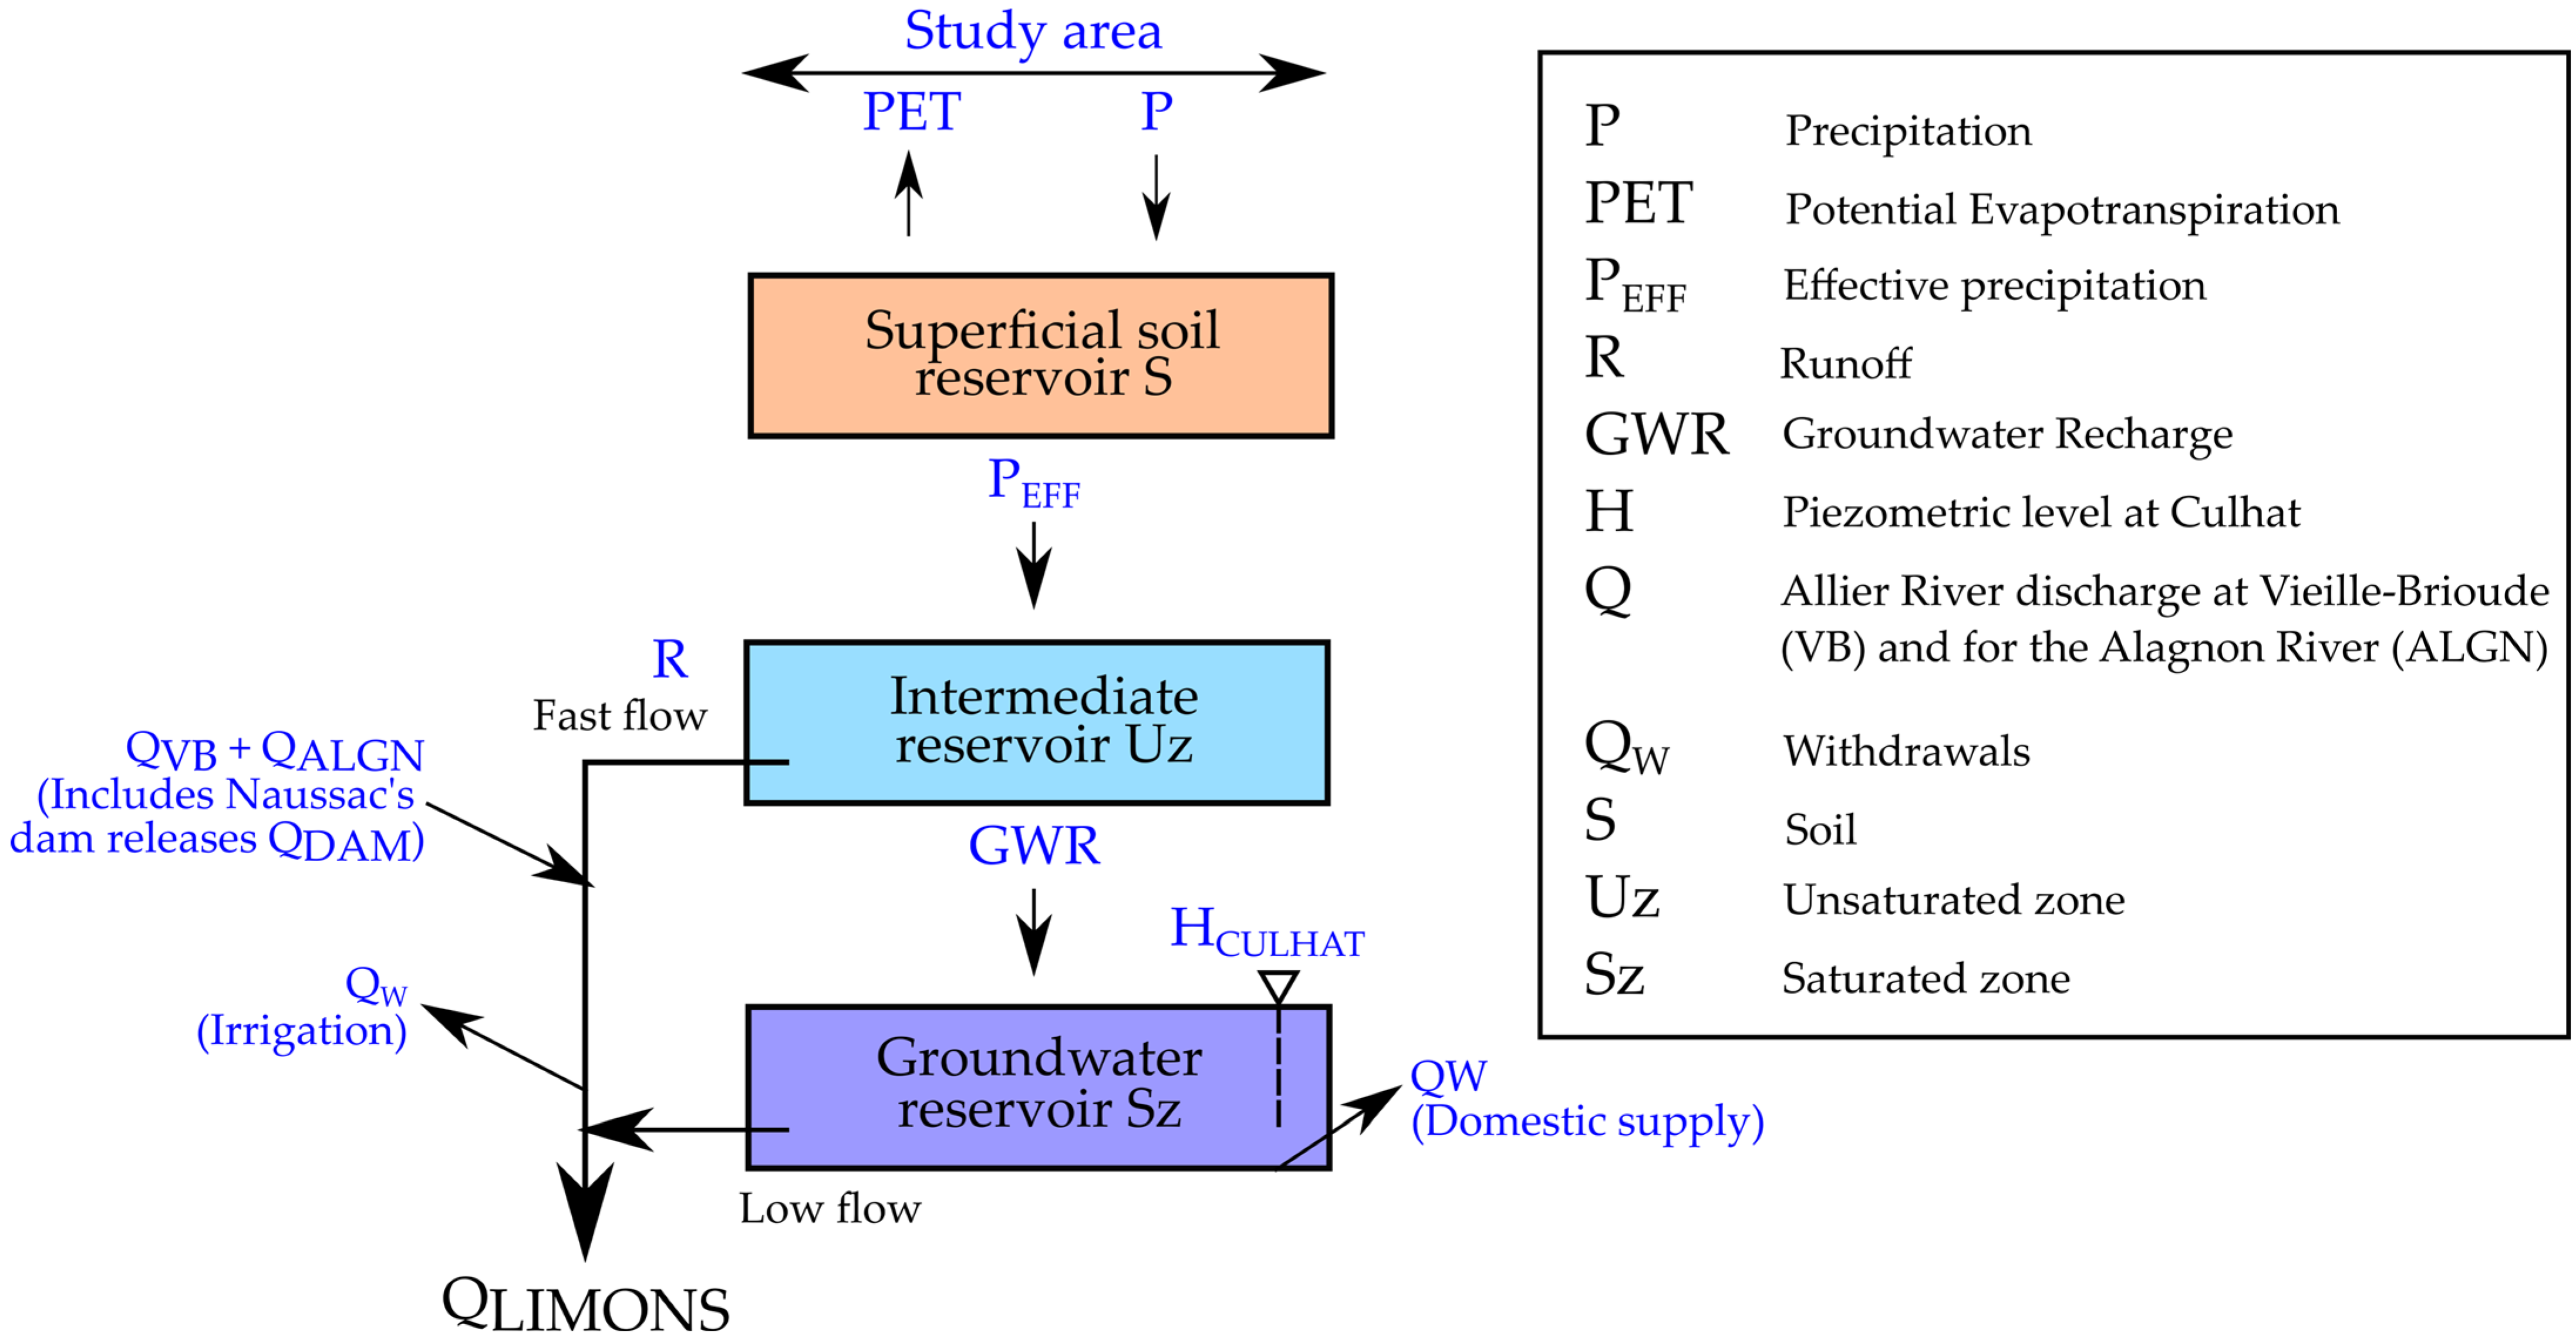
Gardenia is a conceptual model that has already demonstrated its effectiveness in simulating and forecasting river flows and groundwater levels for watersheds of different sizes over varying periods of time [54,55,56,57]. It simulates the main mechanisms of the water cycle, precipitation (P), actual evapotranspiration (ETa), runoff (R), and groundwater recharge (GWR), using simplified physical laws which are translated into flows through a succession of reservoirs (Figure 2, [49]). The reservoir (S) represents the first 10 cm of the soil affected by evapotranspiration processes. Effective precipitation (PEFF) depends on the capacity of reservoir (S) according to quadratic laws (1) and (2):
If P > PET, then PEFF = (P − PET) × Satur2
If P < PET, then ETa = (PET − P) × Satur × (2 − Satur)
where Satur is the reservoir (S) saturation level. Then, PEFF supplies the unsaturated zone reservoir (Uz). PEFF is distributed into R and GWR depending on the distribution height of the runoff–infiltration parameter (HR-I, Table 2). R supplies the superficial flow, and GWR supplies the groundwater reservoir (Sz) (for saturated zone). Finally, the simulated parameters are the groundwater level H of Sz and the total river discharge Q at the outlet of the watershed. HCULHAT and QLIMONS are indicated in Figure 2, QLIMONS being the addition of the R component and the drainage of Sz.
The parameterization of the model requires the daily average of precipitation over 2000–2020, which is representative of the watershed. The latter can be obtained with geostatistical (such as kriging) or deterministic methods. The most frequently used deterministic methods are the Thiessen polygon and inverse distance weighting (IDW) [58]. As Gardenia requires a single record for each input parameter (Table 1), precipitation was averaged using the Thiessen polygon method for the twelve stations located on the upstream part and for the eleven stations on the downstream part (Figure 1b). Although kriging method usually leads to increased accuracy, it has the disadvantage of mainly relying on the assumption of stationarity in the means [59]. Moreover, Ruelland et al. (2008) [60] compared different interpolation methods for precipitation in a lumped model; all approaches (Thiessen polygon, IDW, spline and kriging) led to a similar fitting between observed and simulated values of the river flow. Hence, the straightforward method of Thiessen polygon to average precipitation over 2000–2020 was chosen.
The daily mean air temperature was calculated by averaging data from the twelve weather stations on the upstream part and the eleven on the downstream part. Potential evapotranspiration was calculated from this averaged value using the Oudin method [61].
Calibration is a semiautomatic process. The user gives for each optimized parameter (Table 2) (1) an initial value for the first run and (2) a range with a lower and an upper limit. In order to test and validate the model, the river flow in Limons was calibrated using 2000–2014 data and was validated using 2015–2020 data. Similarly, the groundwater levels in Culhat were calibrated using 2010–2016 data and were validated using 2017–2020 data.
The first simulated timesteps strongly depend on the previous ones. The period of 1998–1999 was, thus, used as a “warm-up” period for the river flow simulation, and 2007–2009 was used for the groundwater level simulation. To assess the ability of the model to reproduce measurements, the Nash–Sutcliffe efficiency criterium (NSE) (3) [62] was used:
NSE = 1     t = 0 T ( Q t   q t ) 2 t = 0 T ( Q t   Q ¯ ) 2
where Q t and q t   are, respectively, the observed and modeled flow at time t and where Q ¯ is the mean of the observed flows. It ranges between −∞ to 1, 1 being a perfect fit. During the calibration process, a weighting was applied to the square root of the flows. Biases on river flows (Qbias) and groundwater levels (Hbias) was determined using (4):
Bias (m3/s or m asl) = Sim_Avg − Obs_Avg
where Sim_Avg and Obs_Avg are, respectively, the simulated and observed averages for the full simulation period.

2.4. Regional Climate Model (RCM) and Representative Concentration Pathway (RCP) Scenarios for Forecasting the River Discharge and Groundwater Levels

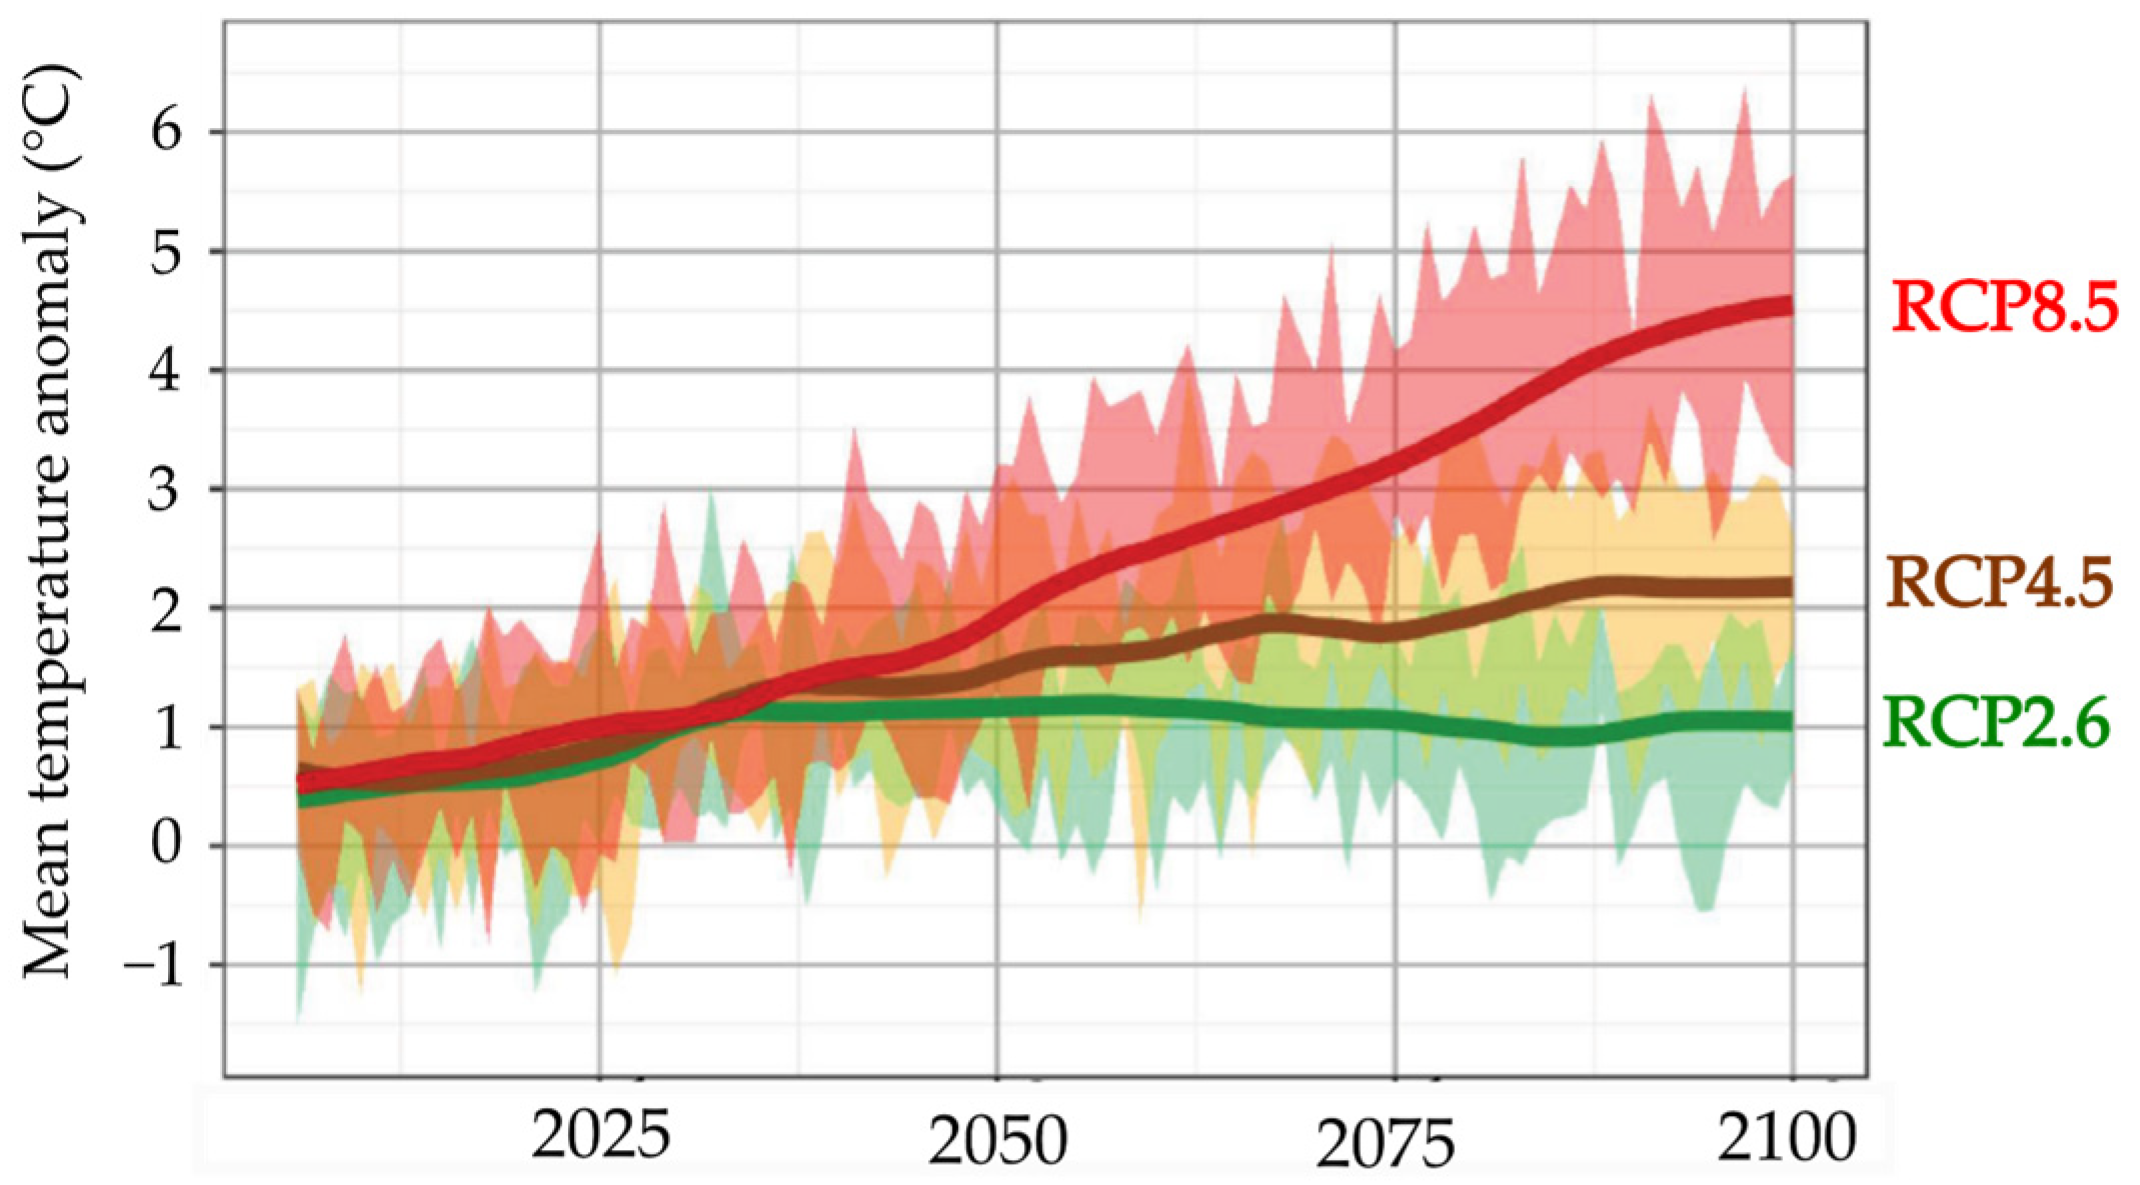
A common purpose of every groundwater or hydrological model in general is to forecast the effect of some future action (evolution of water withdrawals for instance) or hydrologic condition (such as climate change) [63]. To achieve this goal, the calibrated model is forced using climatic data that were part of the new set of regionalized climate projections, DRIAS-2020, from the Euro-Cordex project [64]. Air temperature (°C) and precipitation (mm/d) for 2030–2070 were extracted for the downstream part of the study area (Figure 1b) considering “best case” and “worst case” scenarios. The former implied the RCM Aladin63_CNRM-CM5, which was associated with the emission scenario RCP2.6. The latter implied the RCM RegCM4-6_HadGEM2, which was associated with RCP8.5. Indeed, in comparison to the yearly mean air temperature reference “Ref” of 11.5° C (Table 3), the RCM Aldadin63 in RCP2.6 was moderate in terms of climate change with a very similar yearly mean air temperature of 11.3 °C. On the contrary, the RCM RegCM4-6 in RCP8.5 involved an increase of 1.05 °C over 2030–2070 [65]. Furthermore, RCP2.6 was the most optimistic emission scenario, and it resulted in a stabilization of air temperature anomalies around year 2100 in France. In the case of the RCP8.5 scenario, the absence of regulation of man-made greenhouse gases leads to a gradual increase in temperature anomalies until year 2100 (Figure 3).
The use of two couples of contrasted RCM-RCPs allowed us to give a range of potential evolution of the Allier River outlet discharge (Limons) and of the groundwater levels (Culhat). The analysis of the forecasted QLIMONS and HCULHAT for 2030–2070 was compared to the reference (2000–2020 for QLIMONS and 2007–2020 for HCULHAT).
The work presented in this article was, thus, divided in four steps: (1) a preanalysis of the data to characterize the evolution trends of hydrometeorological parameters and water withdrawals, (2) the calibration of the hydrological model Gardenia based on the collected data (Table 1) and the optimized parameters (Table 2), (3) the quantification of the water balance components for 2000–2020 resulting from the data preanalysis and from the model, and (4) the forecast of QLIMONS and HCULHAT for 2030–2070.

3. Results and Discussion

3.1. Identification of the Driving Factors using the Observation Data

3.1.1. Trends in 1974–2020

To compare this study with a more global trend, we investigated the evolution of the climatic (precipitation and air temperature) and hydrologic (river flows, withdrawals, and dam releases) data from the long-term records of 1974–2020. The interannual mean air temperature (1974–2020) in Clermont–Ferrand was 11.5 ± 0.9 °C, while the values after the 2000s were more often above that mean (Figure 4a). The temperature has gradually increased by +0.05 °C/y since 1974, which corresponded to an increase of 2.3 °C over 46 years. The interannual precipitation mean (1974–2020) was 580 ± 110 mm/y in Clermont–Ferrand and was 1450 ± 340 mm/y in St-Etienne-de-Ludgarès (SEDL, Figure 4b). The standard deviations showed that the interannual variability was greater in SEDL than in Clermont–Ferrand. These records both showed a slight decrease of −1.8 mm/y in Clermont–Ferrand and of −0.9 mm/y in SEDL; that is to say there was a decrease of 83 mm and of 41 mm over 46 years, respectively.
Figure 4c shows the total annual river discharge (Mm3/y) flowing through Limons and Vieille-Brioude. In accordance with its downstream position in the watershed, higher discharges were monitored in Limons, with an interannual mean of 2210 ± 720 Mm3/y versus that of 860 ± 280 Mm3/y in Vieille-Brioude. A decreasing trend could also be seen: −28.4 Mm3/y in Limons and −9.9 Mm3/y in Vieille-Brioude. This means that the Allier River discharge decreased by approximatively 30% between 1974 and 2020.

3.1.2. Observed Trends during the Modelling Period: 2000–2020

In this subsection, the observations made for the upstream and downstream parts of the study area (Figure 1b) are distinguished. The upstream and downstream parts presented, respectively, a mean annual air temperature of 10.5 ± 0.7 °C and 8.5 ± 0.7 °C and a mean annual precipitation sum of 770 ± 130 mm/y and 860 ± 120 mm/y. If air temperatures increased similarly in both locations, with a gradient of +0.05 °C/y and +0.06 °C/y, respectively (Figure 5a,b), the evolution of the other studied parameters would be more moderate for the upstream part compared to the downstream part.
Indeed, precipitation presented a decreasing gradient of −11.8 mm/y for the downstream part versus −1.6 mm/y for the upstream part (Figure 5b,c). The potential evapotranspiration increased by +2.5 mm/y and by +1.8 mm/y for the downstream and upstream parts, respectively. According to Brulebois et al. (2015) [66], an increase in air temperature results in an increase in actual evapotranspiration and, consequently, in a decrease in runoff. This seemed to be the case for the downstream part of the study area (Figure 5b,d,f) but not for the upstream basin, which exhibited a greater stability of these parameters (Figure 5a,c,e).
QVB was quite constant (Figure 5e) just like the groundwater level HCOHADE close to it (Figure 5g). A decrease in the QLIMONS could be observed (−20.7 Mm3/y, Figure 5f). Similarly, the alluvial water table HCULHAT had a downward trend of −0.04 m asl/y from 2007 to 2020 (Figure 5h), corresponding to a decrease of −0.52 m over 13 years. Hence, there were spatial heterogeneities in the observed trends along the alluvial aquifer. Indeed, at the scale of the study area, it seemed that the largest hydrological parameter decreases were recorded in Limons.
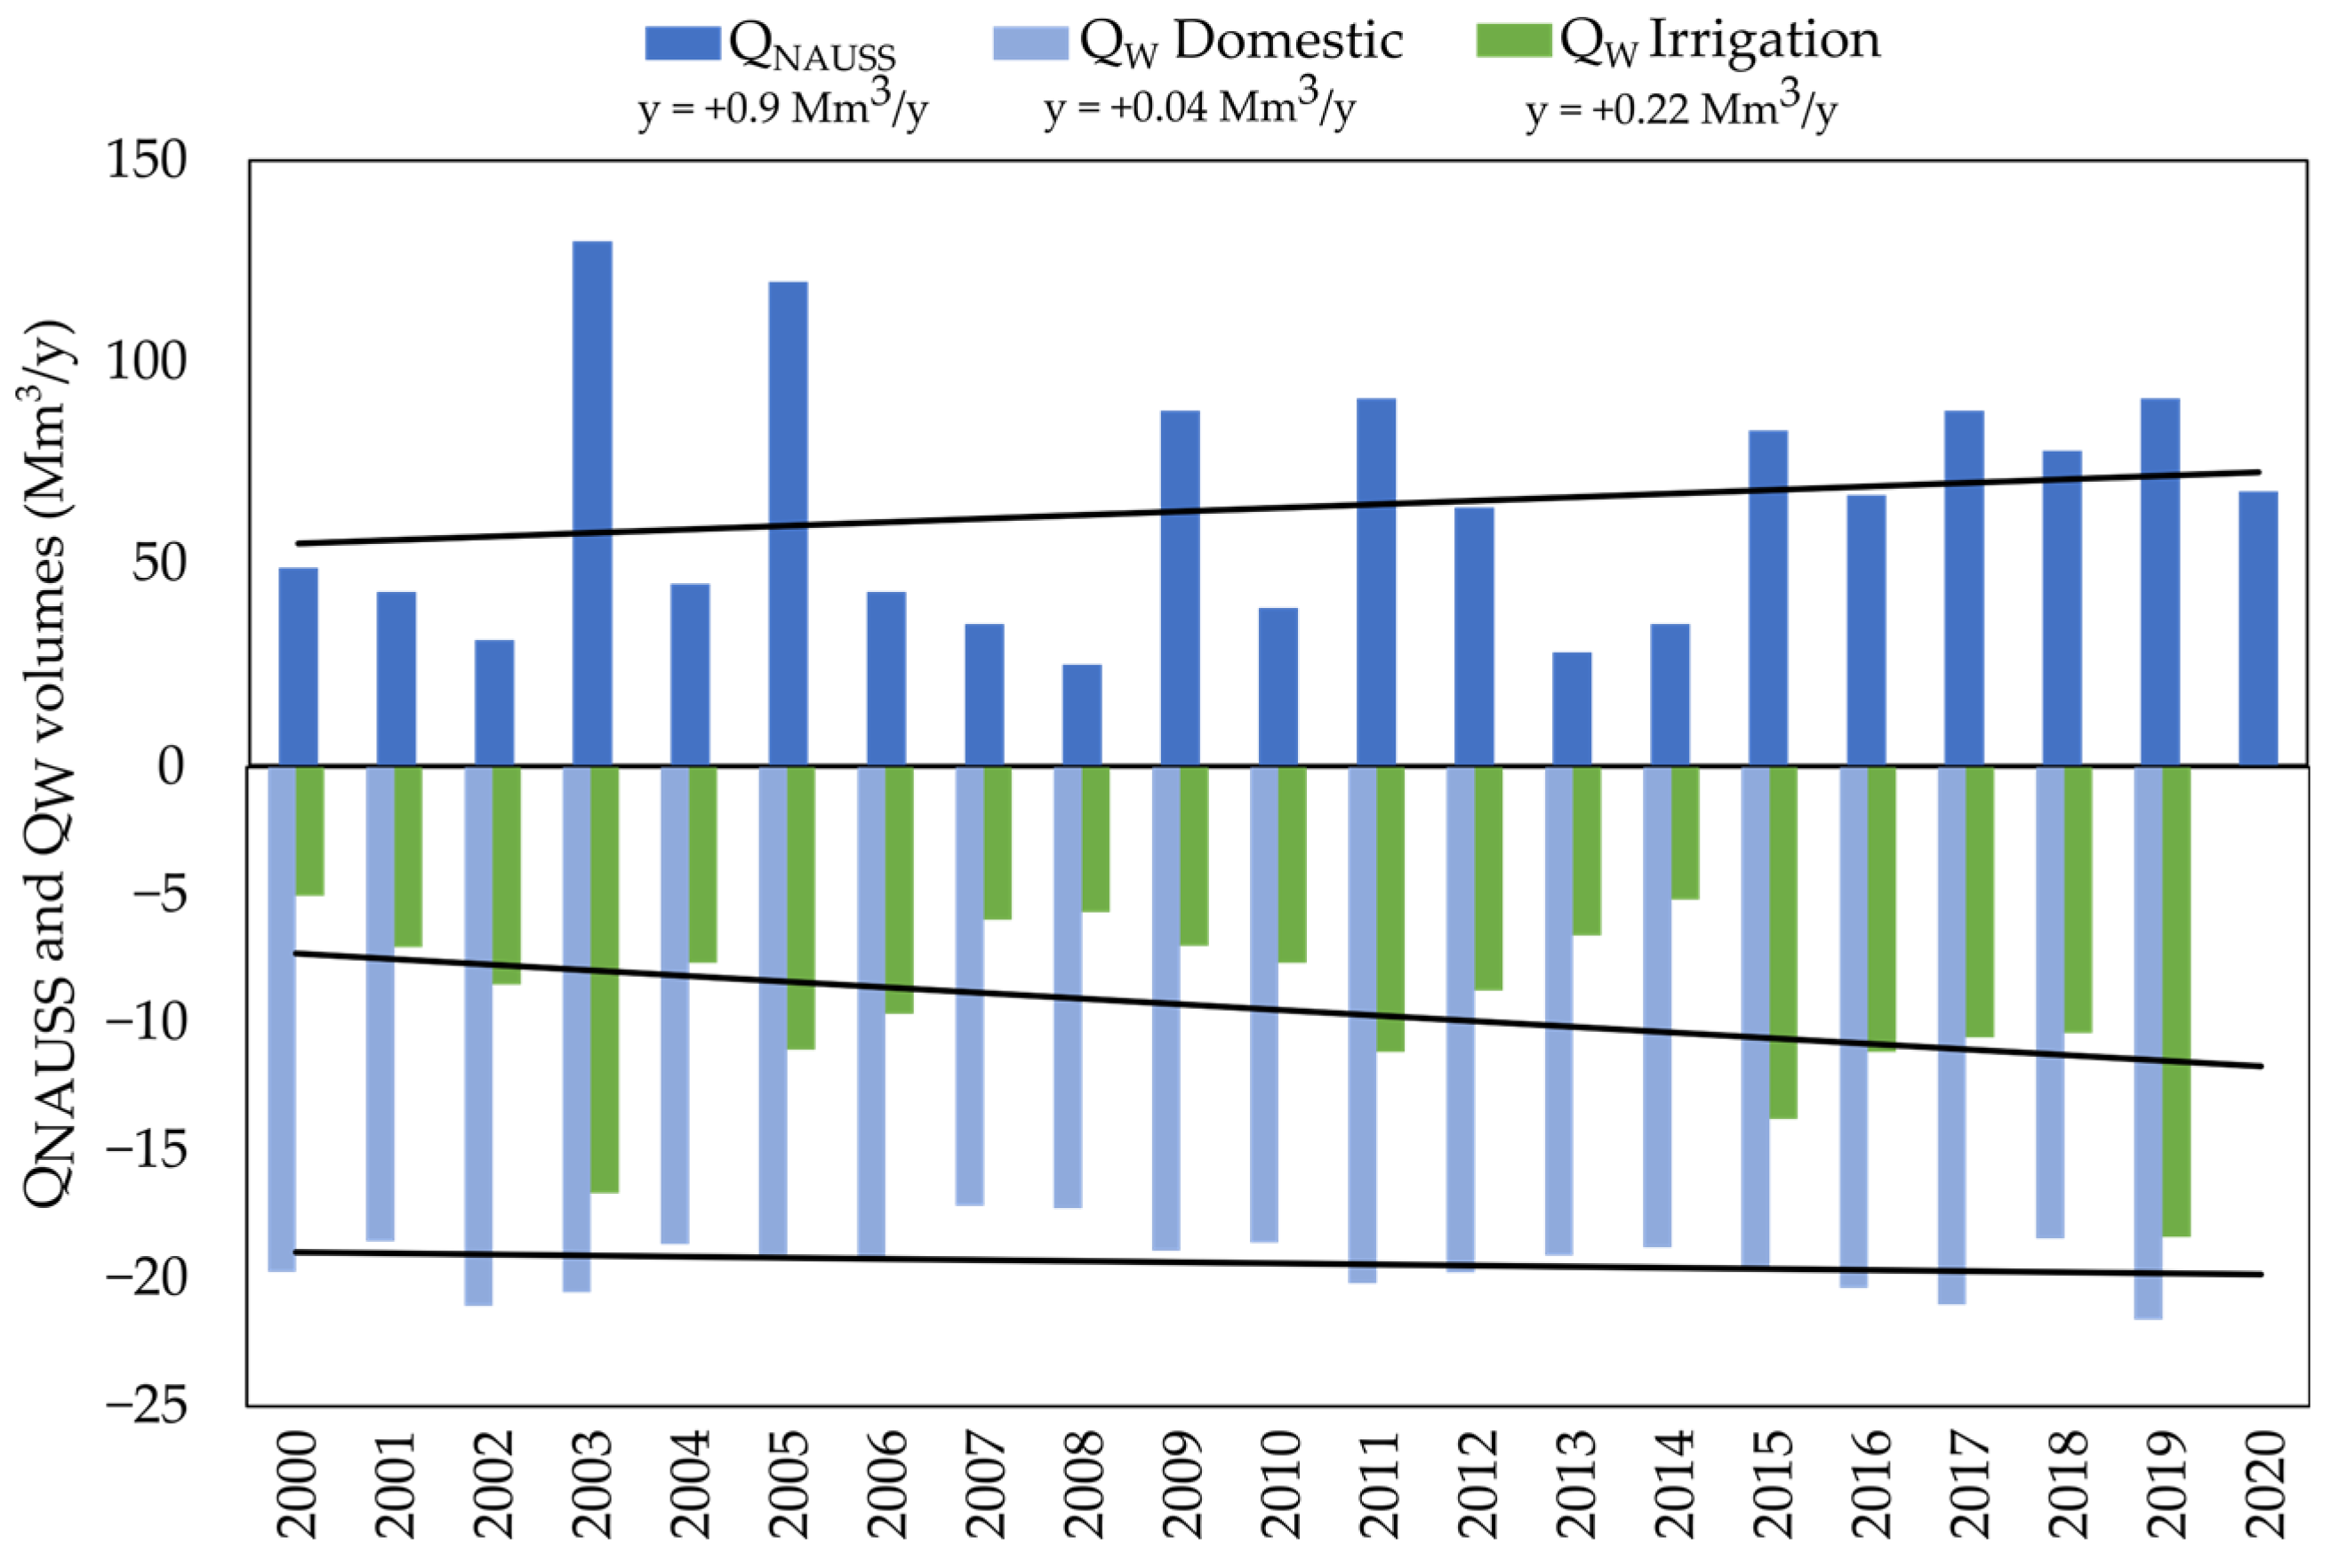
Figure 6 illustrates the evolution of the annual discharge of the Naussac Dam (QNAUSS) into the Allier River (injections were positive values) and the annual volumes withdrawn for domestic and irrigation supplies (QW, negative values). Water withdrawals for domestic supplies were quite constant with a mean of 19.4 ± 1.2 Mm3/y between 2000 and 2020. They were characterized by a slight increase of +0.04 Mm3/y. Withdrawals for irrigation were more variable from one year to another but also tended to increase by +0.22 Mm3/y.
Moreover, we observed a recurrence of years with more intense summer droughts; that was the case for the years 2003, 2005, 2011, 2015, and 2019. These droughts were mainly characterized by an increased volume of withdrawals for irrigation and dam releases (Figure 6) and by a decrease in precipitation. However, for the latter, some discrepancies were noted between the upstream and downstream parts of the study area. The drought of 2003 for instance, was characterized by a drop in precipitation in the downstream part (Figure 5d) but not in the upstream part (Figure 5c). On the contrary, during the 2015 drought, a decline in precipitation was clearly observed in both parts of the watershed. The effect of this lack of precipitation did not always result in a decrease in the mean annual river flow in Limons (as in 2003) because this intense low-flow period was followed by a major flood (observed peak flow of 1120 m3/s). Therefore, the contribution of the upstream and downstream parts to the observed river flow at the outlet in Limons could considerably vary in time, and the origin of the droughts could be multifactorial (on the interannual scale).
QNAUSS also tended to increase in 2000–2020. To cite an extreme case, in 2003, 130 Mm3 were released by the dam. This means that almost 70% of the dam reservoir lake was emptied to support the streamflow versus the drought.

3.1.3. Subannual Variations

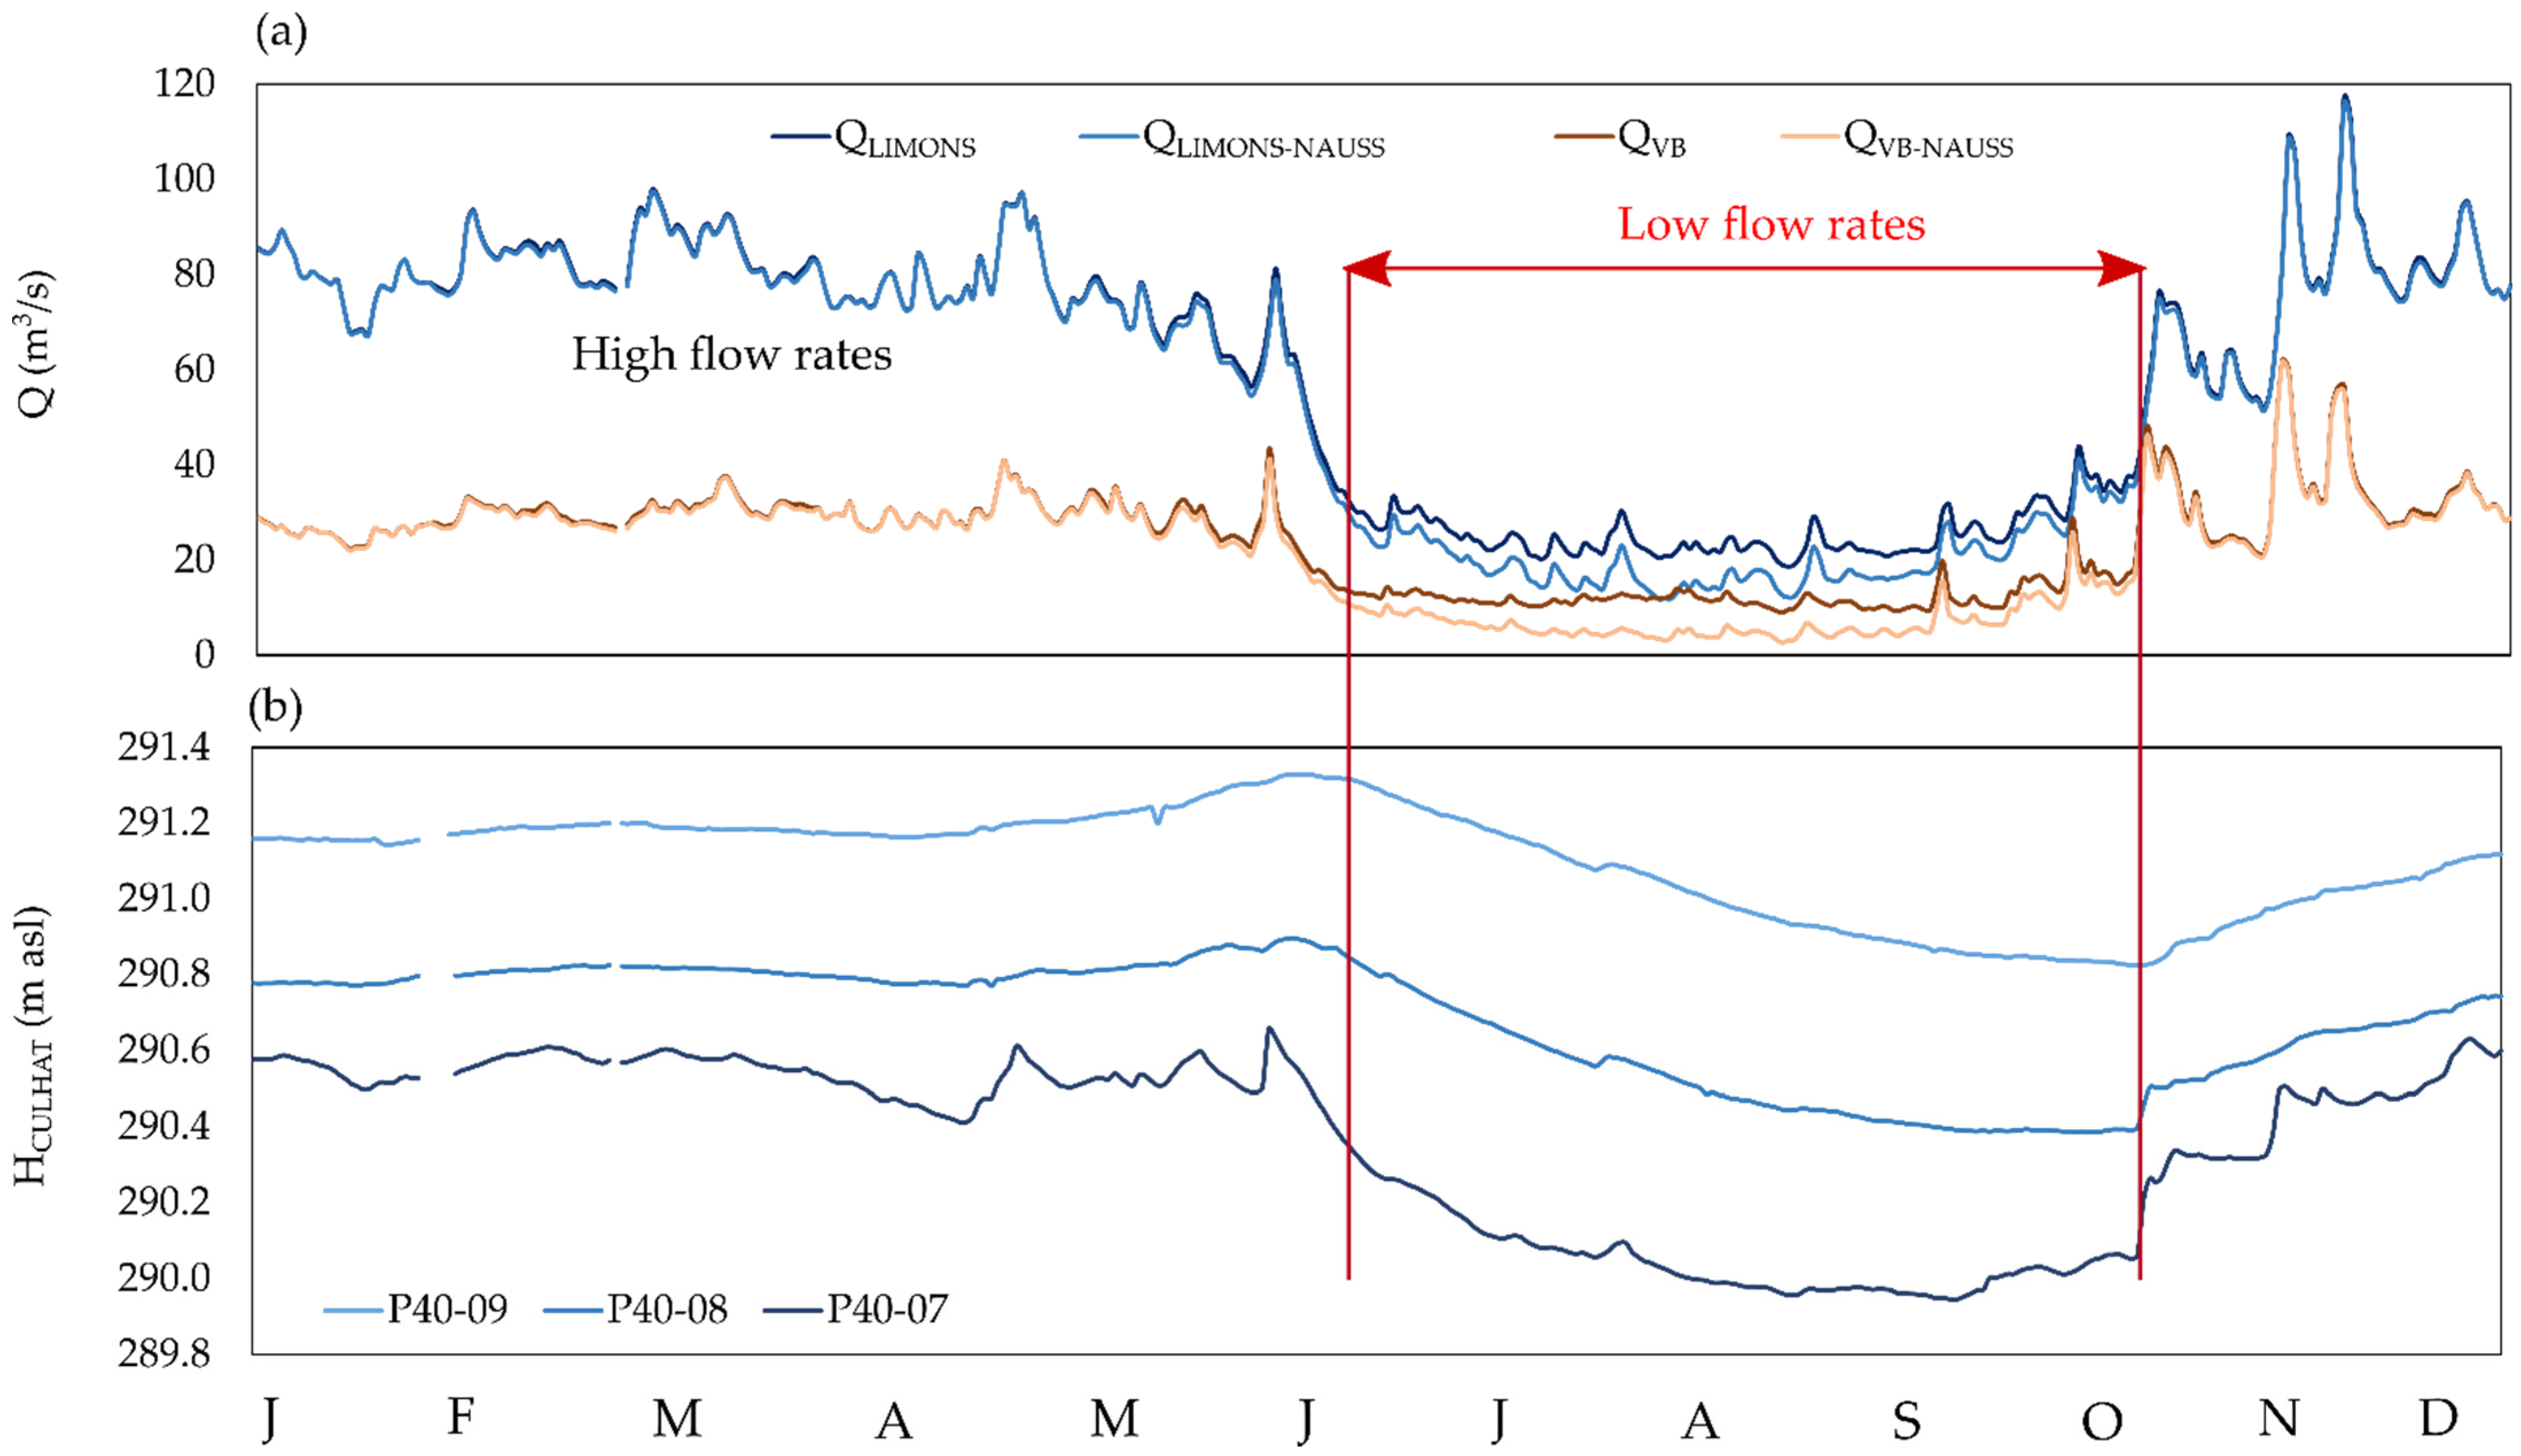
Figure 7 reports the subannual values of QLIMONS, QVB (Figure 7a), and HCULHAT (Figure 7b) for three piezometers (P40-09, 08, and 07) whose locations are represented in Figure A1. This figure represents the mean distribution of the daily river flows in Limons, Vieille-Brioude, and the groundwater levels in Culhat over a year (averaged for 2000–2020 for the flows and for 2007–2020 for the levels).
The distribution of QLIMONS showed an important difference between the high (73 m3/s) and low flows (31 m3/s) in Figure 7a. During the summer, the reduced difference between QVB and QLIMONS indicated that the Allier River flow mainly originated from the upstream part of the study area. During the winter, it was the opposite, with a higher contribution of the downstream part to QLIMONS.
Thus, looking at the subannual scale, the hydrology of the Allier Watershed was characterized through a nivo–pluvial regime, with high flows in the autumn and spring due to abundant rainfall which were accentuated in the spring by the snowmelt [67,68]. To emphasize the importance of QNAUSS during low waters, the river flow in Limons and Vieille-Brioude was subtracted by QNAUSS (QLIMONS-NAUSS/QVB-NAUSS). In the summer, QVB was almost exclusively supplied by QNAUSS, while QNAUSS contributed to around 50% of the observed QLIMONS. This highlighted that during the average summer, the observed river flow at the outlet was more dam-dominated than natural.
The strong seasonality of the Allier River flow was also noticeable in groundwater levels such as HCULHAT (Figure 7b). Furthermore, we observed a decreasing level of HCULHAT towards the Allier River (Figure A1), indicating that the alluvial aquifer supplies the Allier River. P40-07 was the piezometer where contrasts between high and low flows were more pronounced, which was similar to the river flow pattern reflecting the equilibrium between the river and the aquifer.
The analysis of the hydrometeorological data of the last 20 years allowed us to identify the forces that the Allier hydrosystem was facing, particularly on its downstream part (Figure 5b,d,f,h): (1) air temperatures increasing by 0.06 °C/y and, thus, potential evapotranspiration increasing by 2.5 mm/y; (2) withdrawals for irrigation increasing by 0.22 Mm3/y; (3) river flows at the watershed outlet in Limons decreasing by −20.8 Mm3/y along with groundwater levels at specific locations, such as Culhat (Figure 5h); and (4) a crucial contribution of the Naussac Dam during the summers (Figure 7a). In the following section, the hydrological model Gardenia was used to discriminate the factors controlling the Allier hydrosystem water balance and to simulate their evolution according to global changes.

3.2. Quantification of the Driving Factors of the Water Balance from 2000 to 2020

3.2.1. Calibrated Model and Parameters

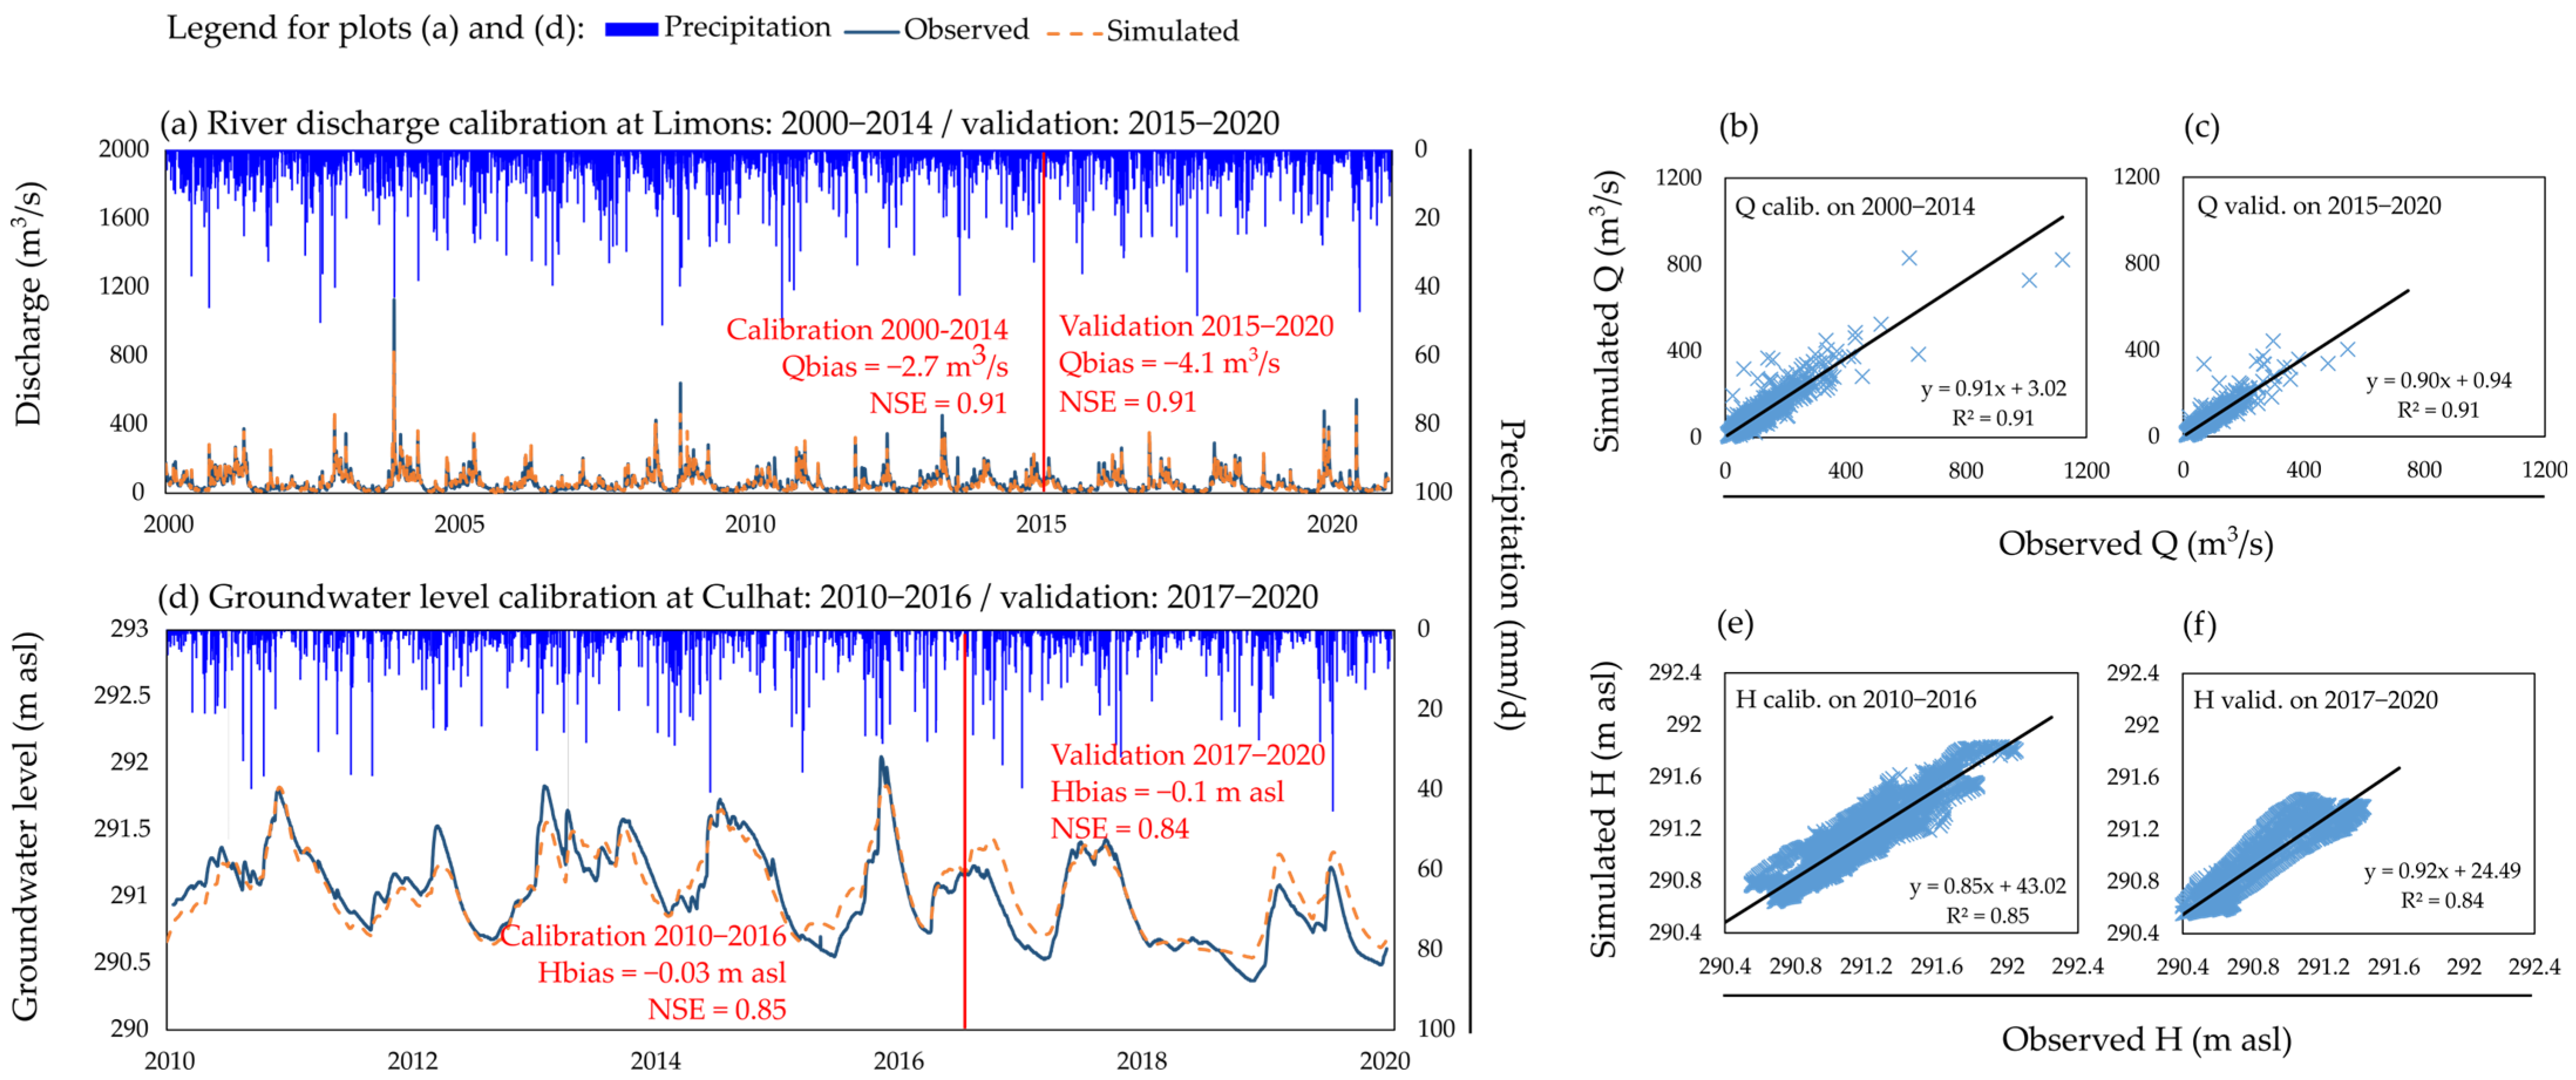
The calibration of the model was performed on a daily timestep for QLIMONS from 2000 to 2014 (Figure 8a) and for HCULHAT from 2010 to 2016 (Figure 8b). Gardenia was effective in reproducing the Q and H patterns of the river and the alluvial aquifer, with a NSE of 0.91 and 0.85, respectively. The calculated biases on the calibration period were small: −2.7 m3/s for QLIMONS and −0.03 m asl for HCULHAT. Figure 8b,e illustrate the good correlation between the observed and simulated values, with an R2 of 0.91 for QLIMONS and 0.85 for HCULHAT over the calibration period. The river flow simulation over the validation period of 2000–2014 (Figure 8a,c) for QLIMONS had an unchanged NSE of 0.91 and a Qbias of −4.1 m3/s. Then, the validation period of 2017–2020 for HCULHAT had an NSE of 0.84 and an Hbias with a value of −0.1 m asl (Figure 8d,f). Hence, the model was more efficient in simulating the river flows than the groundwater levels. Several reasons could be given, such as the duration of the calibration period was smaller for the groundwater levels than for the flows, because of data availability. Moreover, there were more calibration parameters dedicated to optimizing the river flow than the groundwater levels (Table 2). Those elements might lead to a better fit in the river flow simulation than the groundwater levels.
Furthermore, some misfits were noticed, especially for the flood periods of QLIMONS. This could be due to the applied weighting that was aimed at minimizing the deviations in the square root of the flows, which favored low waters. The set of parameters that allowed us to obtain this calibration is shown in Table 4.
Different ranges of variations were tested for each optimization parameter. The parameters presented in Table 4 allowed the best river flow and level fit (Figure 8). The soil capacity (SRES) and the distribution height of the runoff–infiltration parameter (HR-I) were particularly important, as they controlled the production of effective precipitation. Regarding the simulated HCULHAT, the optimized storage coefficient of 2% was coherent with an unconfined aquifer type, which was the case for the Allier’s alluvial aquifer.
Figure 8a,d also illustrate the precipitation records used as input data in the Gardenia model. Some floods observed in Limons resulted from important precipitation events occurring in the upstream part of the study area and caused an increase in inflow in Vieille-Brioude, which was, thus, reflected in Limons. Indeed, there were often precipitation events that did not necessarily lead to river floods or groundwater level increases in the downstream part. Moreover, some precipitation events occurred in the summer, and they may not have been effective precipitation events due to higher evapotranspiration rates.

3.2.2. Water Balance in the Downstream Part from 2000 to 2020

The observed precipitation values QVB and QLIMONS were derived from the preanalysis in Section 3.1. The model calibration allowed us to specify the actual evapotranspiration and effective precipitation rates. The latter was divided into runoff and groundwater recharge. In the Gardenia model scheme, the water fluxes that were not distributed between ETa or GWR supplied the R component (Figure 2).
The water budget represents the resource stability and availability at the watershed scale. Considering the downstream part of the study area, the following formula could be written (5):
QIN + PEFF = QOUT ± ΔS
Thus: ΔS = Inflows (QIN + PEFF) − Ouflows QOUT
with QIN being the sum of QVB and QALGN and with QOUT being the sum of QLIMONS and the water withdrawals QW (domestic supply + irrigation). The difference between the rates of water flowing in and out of an accounting unit was balanced by the change in the water storage ΔS (6) [69]. Figure 9 thus illustrates the total inflows, outflows, and ΔS at the downstream basin scale. Inflows decreased at a rate of −45 Mm3/y in the modelling period of 2000–2020.
ETa (570 ± 50 mm/y) and PEFF (250 ± 100 mm/y) were realistic compared to the previous results obtained in the study area. Indeed, according to [70,71], ETa represented, on average, 60% of total terrestrial precipitation events, which was coherent with the modelled value of ETa that corresponds to 68% of precipitation events. PEFF was equivalent to 32% of total precipitation events, which agreed with the study realized by [50] who also worked on the Allier basin. The French geological survey, BRGM [72], indicated that weather stations with the lowest mean annual PEFF were located in continental lowlands, such as Clermont–Ferrand. ETa and PEFF decreased at a rate of −2.8 mm/y and −10 mm/y (−200 mm over 20 years), respectively.
The ΔS fluctuations were strongly linked to the interannual variations of PEFF (R2 = 0.75). During the period of 2011–2015, ΔS was negative, meaning that the available water storage was more stressed than recharged. This was consistent with a significantly lower PEFF amount of 130 mm/y between the years 2011 and 2015. Cases of negative ΔS values in water budget calculations were already reported in other studies [73,74]. In our case, if outflows were higher than inflows, it meant that there was a greater solicitation of the alluvial aquifer that supported the river. In the present case, water withdrawals (QW) poorly influenced the water balance, except during the summers when irrigation occurred. At the annual scale, QW represented 0.8% to 2.5% of the output fluxes (Figure 9), and it did not significantly improve the model calibration when inputted into Gardenia. Nonetheless, at the subannual scale, irrigation could represent up to 30% of the river flow monitored in Limons, such as that in July 2019 during an important drought. Then, the groundwater recharge was determined throughout the model, and it accounted for 130 ± 48 mm/y between the years 2000 and 2020, making up 15% of overall precipitation events. This was very low compared to the recharge values observed in similar alluvial aquifers, which ranged from 10% to 34% [75,76,77,78].
Inflows in Figure 9 included QNAUSS (the part of the inflows monitored in Vieille-Brioude). Watersheds regulated by dams are numerous around the world [79,80,81], and their water releases can induce changes in river flow frequencies or in the interception of high flood peaks [82]. The year 2022 is an interesting example of the limitations of dam regulations: the Naussac Dam reservoir lake was indeed only 70% full, and the low-flow period started earlier, in May instead of June. This was due to the combined effects of insufficient winter precipitation events in the upstream part of the study area and the severe 2022 summer drought. If the dam is not sufficiently refilled in the winter of 2023, a period of crisis is expected for the following summer. The misfunctioning of the Naussac Dam would have important consequences on the summer QVB, on QLIMONS, and on groundwater levels such as HCULHAT [82].
Hence, warming summers and the temporal unevenness of precipitation events have given rise to supplemental irrigation requirements at different places [83]. Achugbu et al. (2022) [84] stated that evapotranspiration is a major factor with respect to changes in streamflows due to the land use changes in their study area. Climate in the Allier River Watershed stood out as a major driver of the water balance, actual evapotranspiration, and effective precipitation, which were prevalent factors given the model outputs. The main challenge is being able to discriminate between climatic and anthropogenic influences. Climate would explain many of the observed trends in Northwest Europe, while, for Southwest Europe, human disturbances better explain both the temporal and spatial trends [85]. Effective future water resource management is threatened by the uncertainties related to the changing climate processes and anthropogenic impacts that are occurring on an increasing basis, as Lorenzo-Lacruz et al. (2022) [86] concluded in their study.
Different solutions have been proposed to mitigate the impacts of this so-called “global change”. For instance, Mas-Pla et al. (2013) [87] proposed the alternative of using basement groundwater as a potential water supply to ease the pressure on overexploited stream-connected alluvial aquifers. This could be a solution, but only sporadically.
Gupta et al. (1985) [88] suggested using canals for irrigation, which could also allow the additional recharge of groundwater through canal seepage. The groundwater decline could also be reversed through an artificial groundwater recharge by using vertical shafts (with sand–gravel filters) [89] or infiltration galleries to move surface water into the aquifer [22] and to collect precipitation and ditch flow during the nonproduction season for later irrigation use. Reba et al. (2017) [90] investigated the use of on-farm reservoirs and managed an aquifer recharge (artificial recharge over nonconfined geological units). In Mississippi, a large number of reservoirs collecting winter precipitation were built to replace the use of alluvial aquifers, which suffer from a decline of more than 30 m in some places. Thus, the use of artificial reservoirs is a solution adopted in many watersheds, but it may not be the “best” solution in our case as there is already one (i.e., the Naussac Dam). As previously explained, it recently showed its limitations within the summer of 2022.
Possible solutions could be found in land use/cover management as well. For instance, Tribouillois et al. (2022) [91] studied the advantages of cover crops. They showed that using long-duration crops and diversifying rotations help in improving quantitative water management. The replacement of maize with crops requiring less water was also mentioned. Similar perspectives were explored by Martin et al. (2016) [92]: a full crop rotation would lead to a 10.5% reduction of irrigation withdrawals. In the case of our study, it would reduce human pressures when the Allier River is at its lowest rates. There are, therefore, interesting perspectives that have recently been proposed to achieve better water management through improved land handling.

3.2.3. River Flow and Groundwater Level Variations from 2030 to 2070

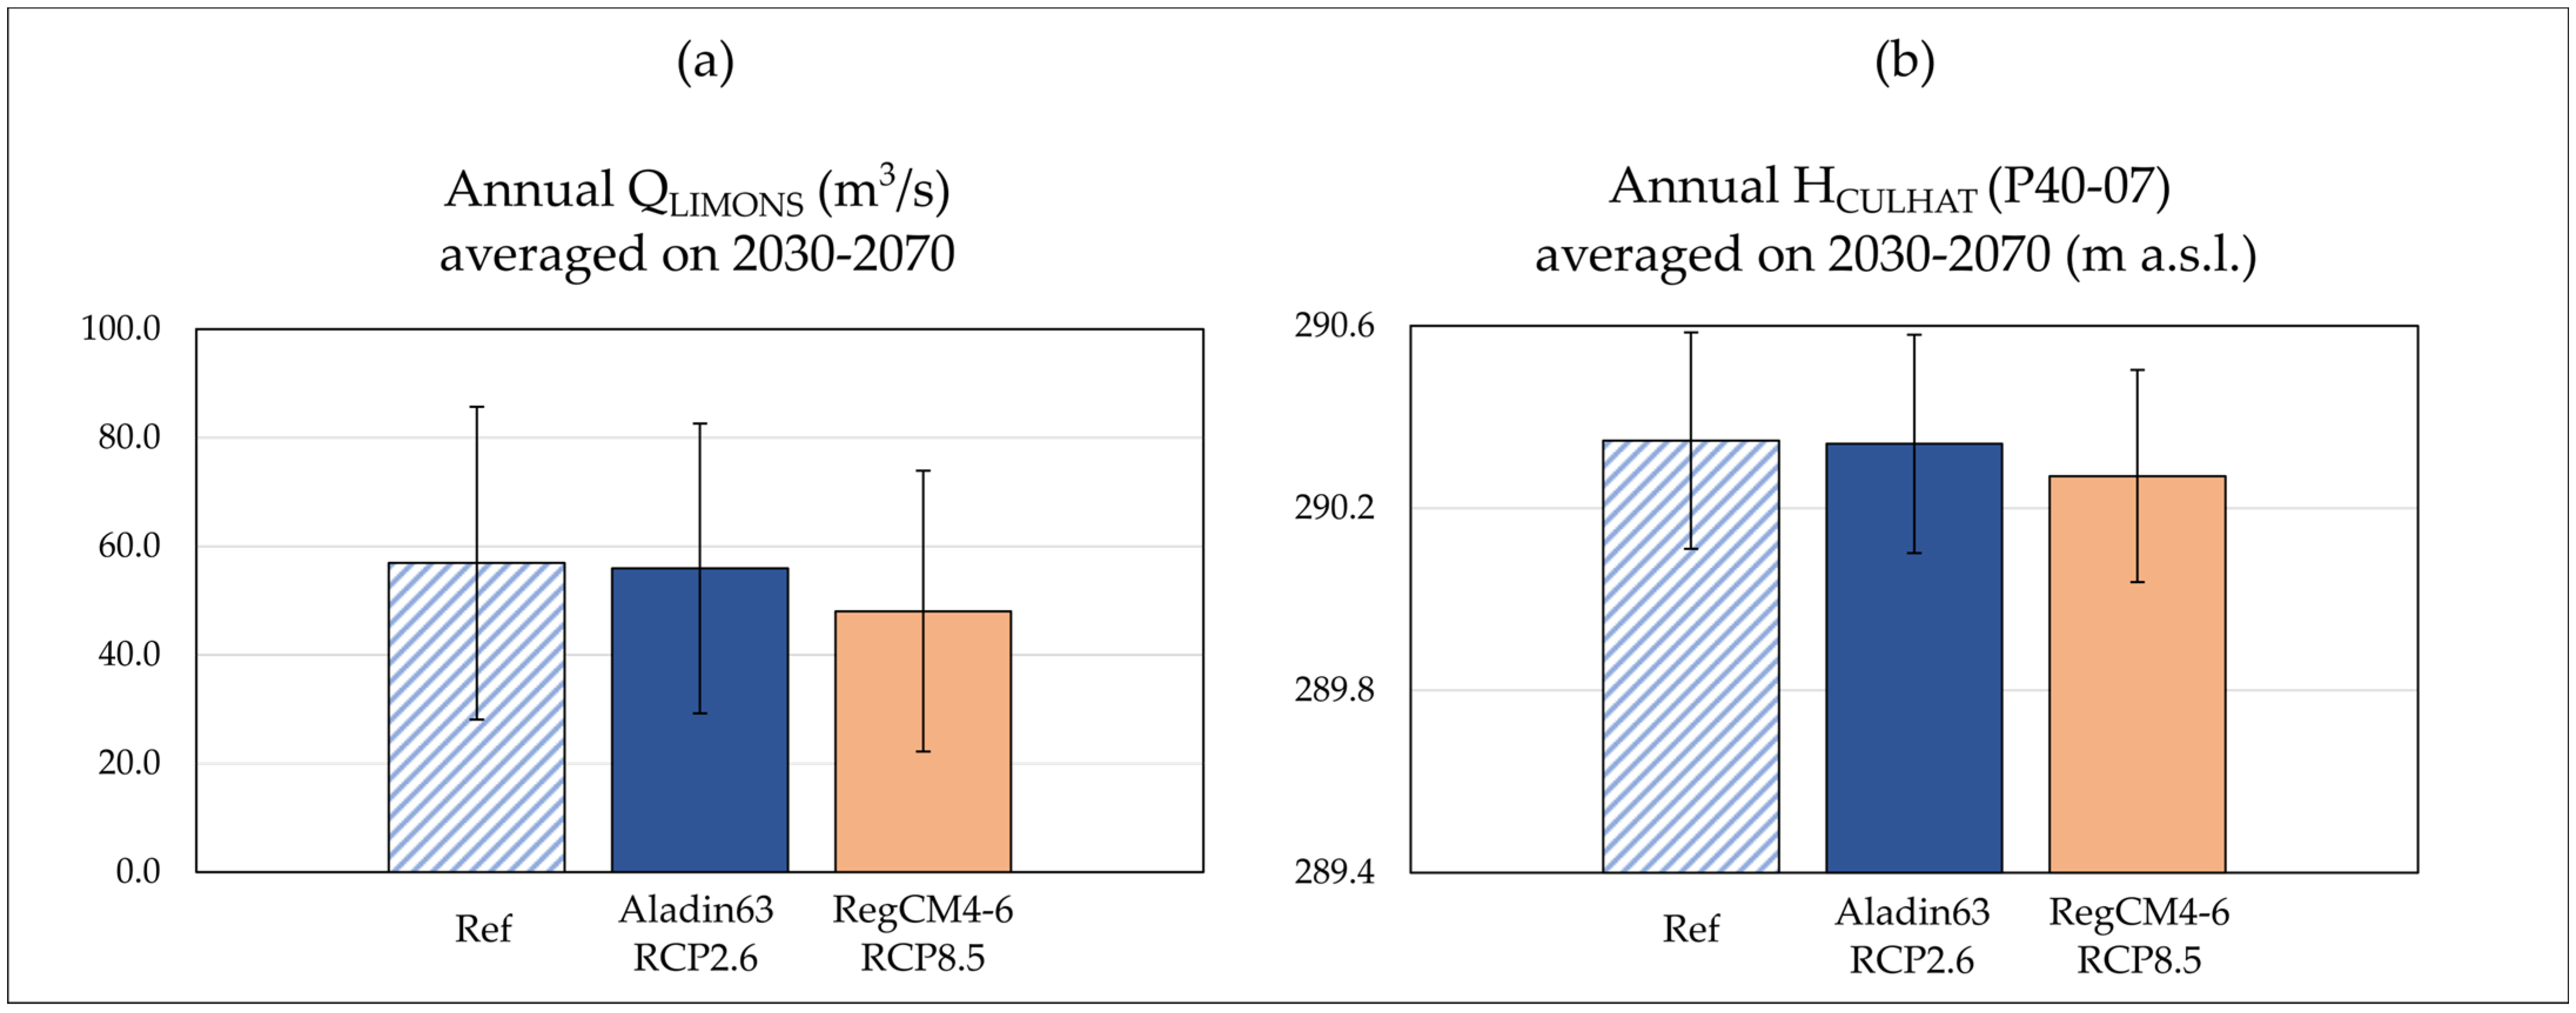
Figure 10 presents the reference (2000–2020) and the forecasted (2030–2070) QLIMONS and groundwater levels in Culhat-P40-07 (HCULHAT) according to the defined case scenarios in Section 2.4. The forecasted flows all decreased compared to the reference, up to 48.05 ± 25.90 m3/s in RegCM4-6/RCP8.5 (Figure 10a). The reference of HCULHAT was 290.35 ± 0.24 m asl; the forecasted levels all decreased down to 290.27 ± 0.23 m asl (in RegCM4-6/RCP8.5) compared to that reference (Figure 10b). QLIMONS was 56.90 ± 28.81 m3/s over 2000–2020. Although, all the trends were downward, the differences between the scenarios were minimal at the interannual scale (Figure 10) as the standard deviations overlapped.
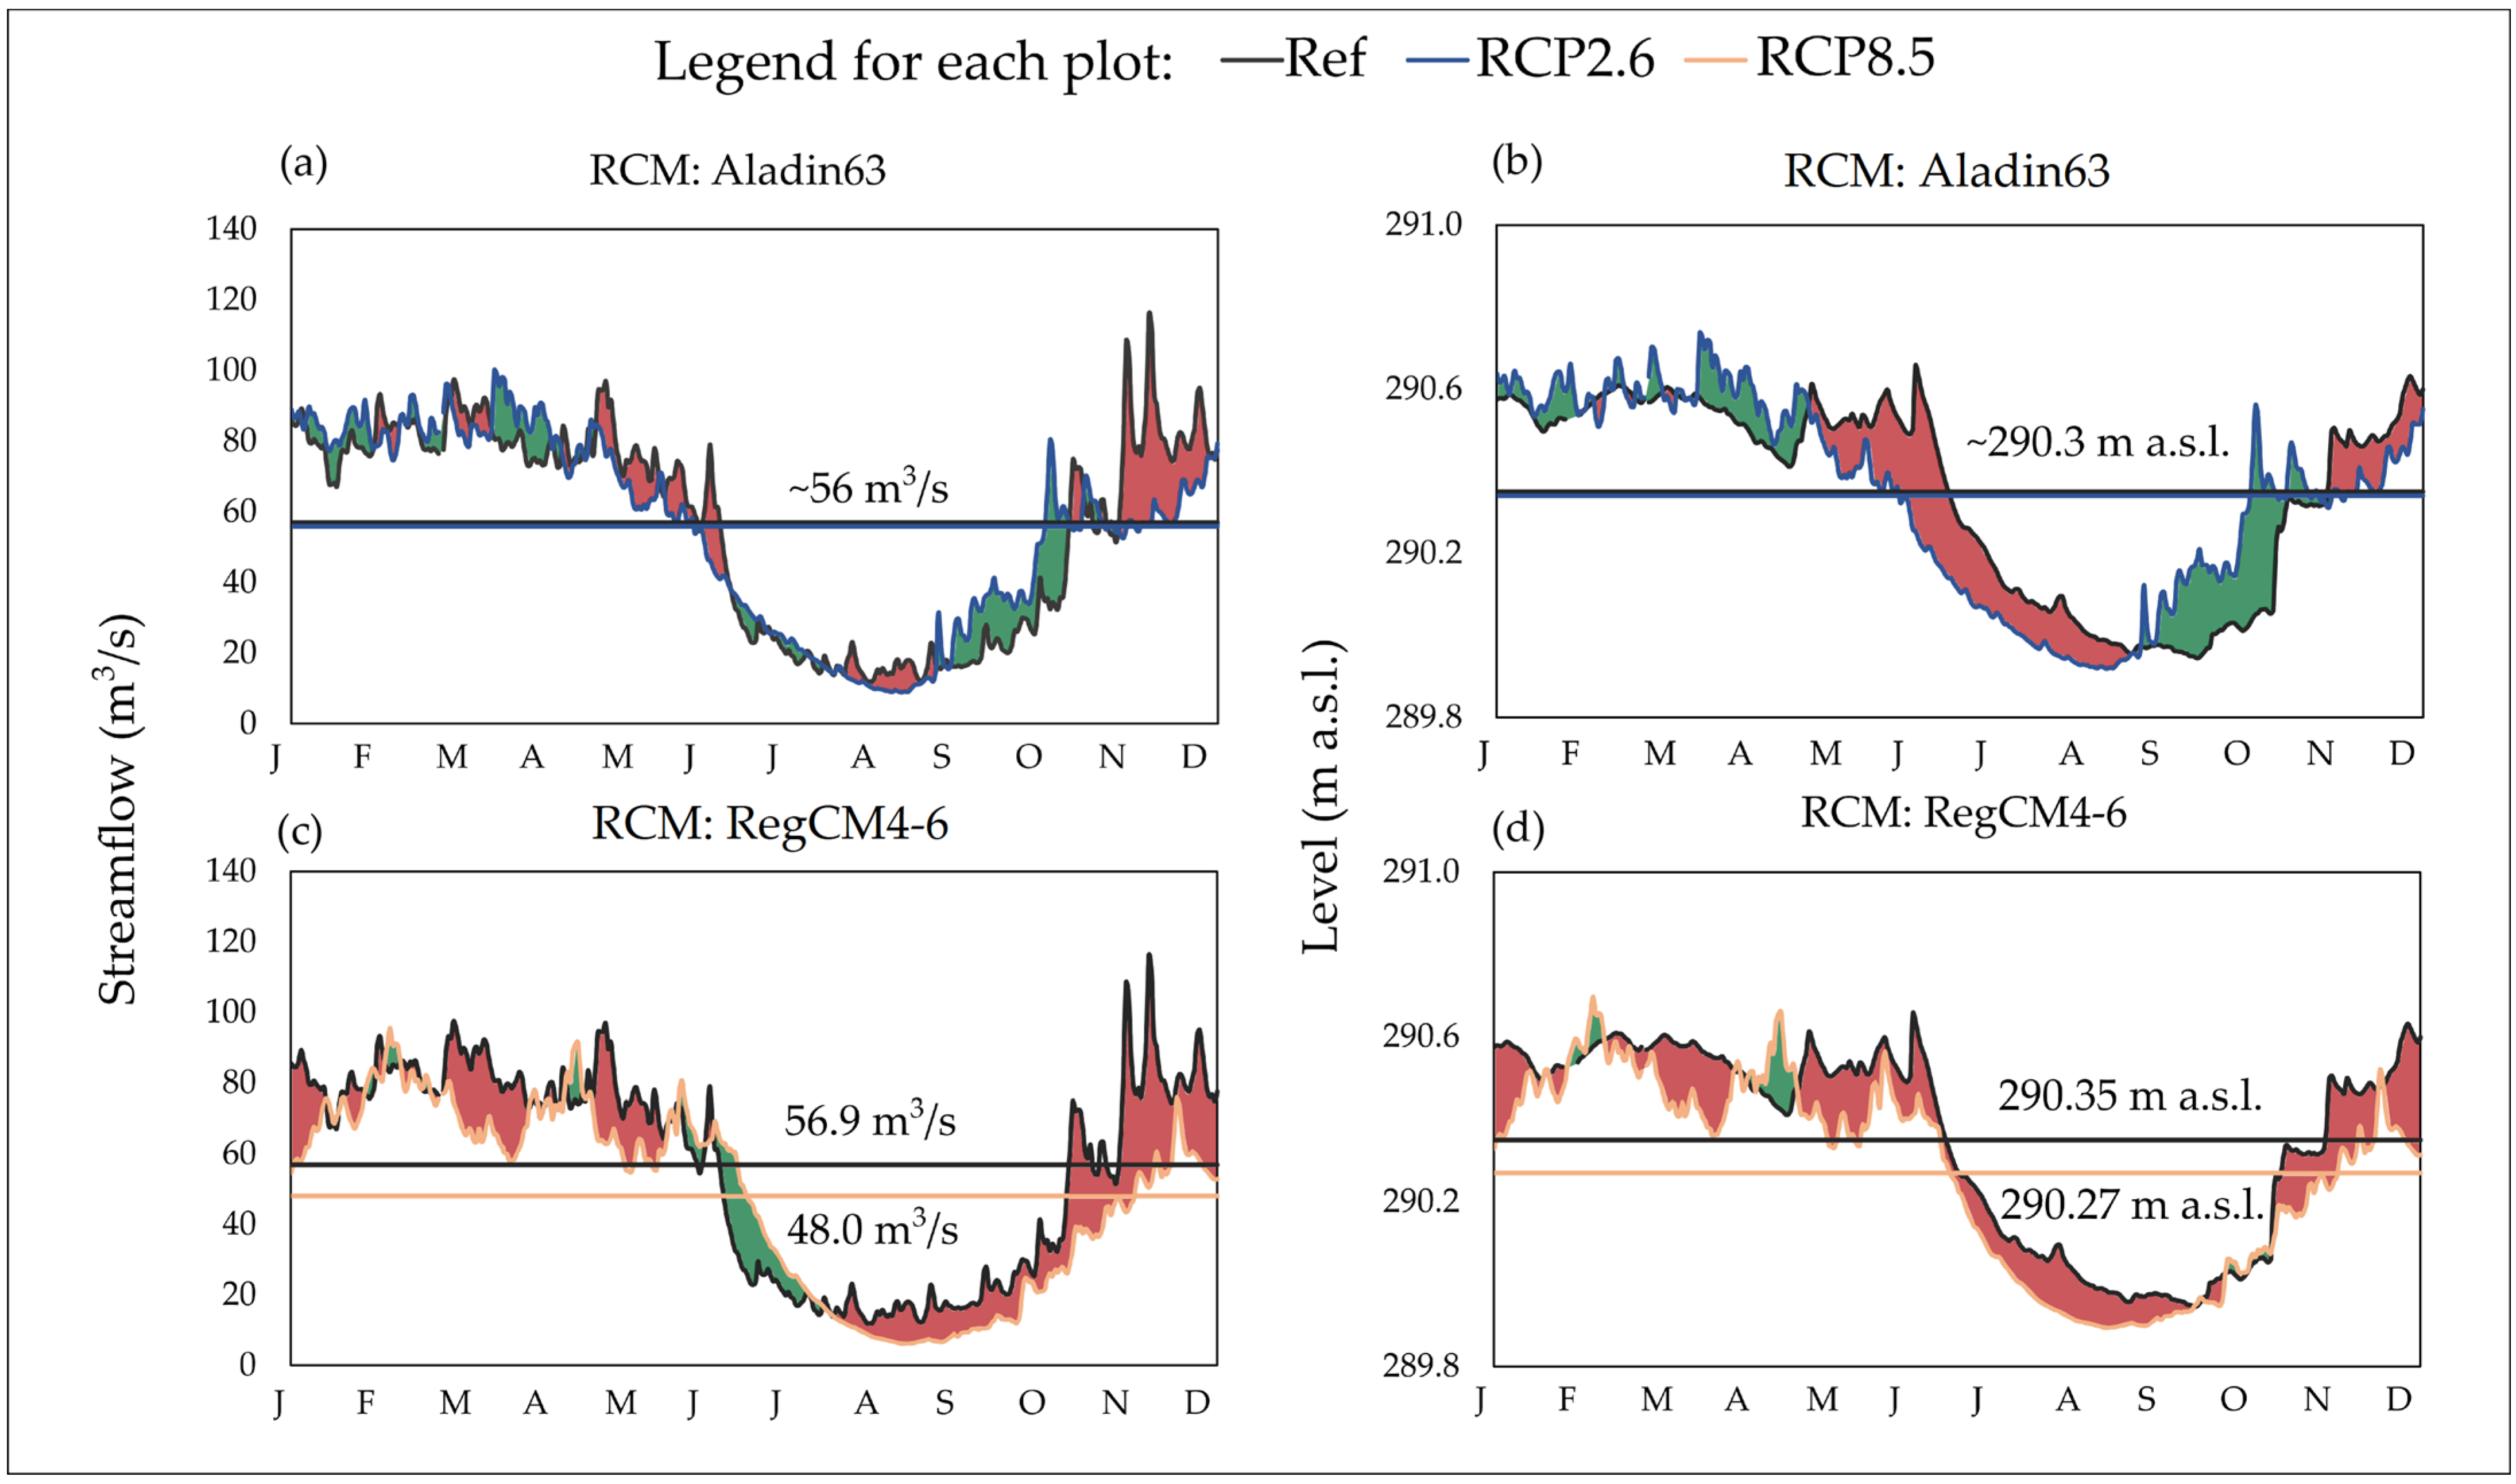
At the subannual scale, there were noticeable variations as well (Figure 11). The mean annual distribution of QLIMONS and HCULHAT for the 2030–2070 period were computed according to different scenarios: the RCM Aladin63/RCP2.6 (Figure 11a,b) and the RegCM4-6/RCP8.5 (Figure 11c,d) scenarios. Each curve was compared to the reference determined with the 2000–2020 QLIMONS and the 2007–2020 HCULHAT.
The ref QLIMONS and QLIMONS forecasts obtained through the Aladin63/RCP2.6 simulations (Figure 11a) presented a similar evolution except for a better distribution of the autumn flows that begin in early September and a flood control of the high flows occurring from October to December. RegCM4-6 in RCP8.5 (Figure 11c) showed a global decrease in the Allier flow rate with a flood control affecting the spring, autumn, and winter. The low-flow period was reduced compared to the reference and extended from late July to October. The flow rates were dramatically affected, reaching values lower than 10 m3/s. This was due to a decrease in precipitation and runoff and an increase in irrigation activities. The simulated decrease corresponded to −15.7% of the total streamflows.
The forecasted HCULHAT for 2030–2070 with Aladin63/RCP2.6 (Figure 11b) showed a shift in the low-water period that began in May and ended in September, whereas, with RegCM4-6 RCP8.5, a global decrease in HCULHAT was observed (Figure 11d). The maximum annual decrease in the groundwater level was 0.08 m (worst case scenario). The Naussac Dam was included in the forecasts by setting 6 m3/s in Vieille-Brioude (see Section 2.2 for more details). It did not cause a difference in the river flows in the considered scenarios; it was indeed compensated by water withdrawals, especially irrigation.
Other studies have examined the impact of climate change on the hydrology of French rivers and aquifers, at basin scales, using similar hydrological models. Habets et al. (2013) [56] agreed with a global decrease in streamflows and groundwater levels in the Seine and the Somme River basins. The results were more contrasted for Thirel et al. (2019) [93] who forecasted a slight increase in the annual discharges of the Rhine River, which was even more important in RCP8.5, and a decrease in low flows by 2050. A more global study carried out at the French territory scale (Explore 2070 project, [94]) reported, in accordance with our results, a general decrease in river streamflows from 10% to 40%, with a stronger decrease in summer low flows. Moreover, the Explore 2070 specific groundwater report [95] mentioned a decrease in the groundwater recharge with climate change. The most pessimistic models indicated a very limited decrease in groundwater levels in the alluvial plains, which was consistent with the −0.08 m asl forecasted in the current study. Even though most hydrologic indicators point to an overall decrease in water resources, the consequences of climate change are quite heterogeneous in France and worldwide. Within several studies, the impact was mostly an acceleration of the existing seasonality with an increase in high flows during the wet seasons and a decrease in low flows during the dry seasons [96,97].

4. Conclusions

This study presented a general assessment of the impacts of hydrometeorological (precipitation, air temperature, and river flow) and anthropogenic parameters (withdrawals and dam releases) on the Allier River and its alluvial aquifer over a recent period, from 2000 to 2020. The recurrence of intense droughts, the continuous exploitation of this hydrosystem, and the uncertain effect of climate change have all given rise to many concerns among local water managers and among the scientific community. In this framework, we proposed using hydrological modelling with Gardenia to determine the driving factors of the water balance at the Allier River Watershed scale. The model calibration carried out between 2000 and 2014 included hydrometeorological and water withdrawal data.
It appears that the Allier hydrosystem is not spared from climatic and anthropogenic influences and their classical evolution, showing a decrease in effective precipitation and groundwater recharge and an increase in anthropogenic pressures. At the subannual scale, the impact of the Naussac Dam was highlighted because its releases covered almost 100% of the river flow in Vieille-Brioude (the outflow of the upstream basin) and 50% of QLIMONS (the outlet of the whole study area) during summer droughts. Gardenia showed the participation of each component in the water budget. Actual evapotranspiration, effective precipitation, and groundwater recharge accounted, respectively, for 68%, 32%, and 15% of the total precipitation in the downstream part of the study area. The change in water storage ΔS was tightly linked to the interannual variations of effective precipitation and was strongly affected by periods of drought (especially in 2011–2015, where ΔS was negative).
In order to quantitatively forecast the evolution of both the surface and groundwater, two sets of climate projections from the DRIAS-2020 database (Aladin63/RCP2.6 and RegCM4-6/RCP8.5) were used. They, respectively, corresponded to the best and the worst scenarios of evolution considered in our study, Aladin63/RCP2.6 being the best and RegCM4-6/RCP8.5 being the worst. Whatever the scenario, the river flow at the outlet in Limons and the groundwater levels in Culhat decreased compared to the reference value determined in 2000–2020, with a more or less elevated amplitude depending on the scenario. Aladin63 /RCP2.6 led to a small decrease on an annual basis but also to a change in the distribution of high and low flows within the year. RegCM4-6 /RCP8.5 generated more important modifications with a large decrease in both river flows and groundwater levels.
The critical point of such a study is to distinguish the different drivers that affect water resource availability. Climate change and water withdrawals are the two major drivers that alter hydrological processes, but they are intimately related, as climate change generates droughts that have higher water withdrawals for irrigation as a consequence. Irrigation indeed creates a real challenge: having to withdraw water from the streamflow when the river is the least able to supply it. That is why the Naussac Dam was built: to ensure a minimum flow in the Allier River. However, given the recent intense and longer-lasting summer droughts, managers are concerned about the difficulties of refilling the dam in the winter. Some alternatives were reviewed, and the use of artificial water reservoirs seems to be largely adopted. Nevertheless, considering the important uncertainties surrounding the Naussac Dam, a solution involving a reduction in withdrawals associated with improved agricultural land use management has to be favored.
Using hydrological modelling, this study showed that climate variability (in time and space) can be a major factor driving the alluvial hydrosystem water balance over anthropogenic pressures such as water withdrawals. The method presented in this paper could be applied to any watershed.

Author Contributions

Conceptualization, investigation, methodology, and writing—original draft preparation, J.L.; funding acquisition, methodology, supervision, writing—review and editing, and project administration, H.C.; writing—review and editing, J.-L.D.; investigation and writing—review and editing, J.A.; funding acquisition, supervision, writing—review and editing, and project administration, G.M. All authors have read and agreed to the published version of the manuscript.

Funding

This research was funded by I-SITE CAP20-25, Clermont Auvergne Metropole, L’Agence de l’Eau Loire-Bretagne, L’Observatoire de Physique du Globe de Clermont-Ferrand (OPGC) and by the Service National d’Observation H+.

Institutional Review Board Statement

Not applicable.

Informed Consent Statement

Not applicable.

Data Availability Statement

The data used in this article do not belong to us, most of the data are available on public websites and were downloaded on 1 November 2022. The river flow data are available at https://www.hydro.eaufrance.fr, the piezometric levels are available at https://ades.eaufrance.fr, the water abstraction volumes are available at https://bnpe.eaufrance.fr and at www.eau-loire-bretagne.fr, the meteorological data were issued from Météo-France (https://publitheque.meteo.fr) but require a license, and the Naussac Dam release data are property of Etablissement Public Loire (EPL) and are not publicly available. Regional climate projections were downloaded from the DRIAS platform at http://www.drias-climat.fr/. The hydrological model used in this article, Gardenia, can be openly accessed at https://www.brgm.fr/fr/logiciel/gardenia-logiciel-modelisation-hydrologique-globale-bassin-versant.

Acknowledgments

The authors gratefully acknowledge the support for this research that was funded by I-SITE CAP20-25, Clermont Auvergne Metropole and by L’Agence de l’Eau Loire-Bretagne, OPGC, SNO H+ and we would like to express our sincere acknowledgment to Dominique Thiéry for his technical support with Gardenia.

Conflicts of Interest

The authors declare no conflict of interest.

Appendix A

Figure A1. Location of the three available piezometers on the Allier’s alluvial aquifer in Culhat: P40-07, P40-08, and P40-09.
Sustainability 15 03275 g0a1
Table A1. Table summarizing the most important abbreviations used throughout this study.
AbbreviationSignificance
CFClermont–Ferrand weather station (Figure 1b)
SEDLSt-Etienne-de-Ludgares weather station (Figure 1b)
VBVieille-Brioude (Figure 1b)
PPrecipitation
TaAir temperature
PETPotential Evapotranspiration
ETaActual Evapotranspiration
PEFFEffective precipitation
GWRGroundwater recharge
QRiver flow/discharge
QWWater withdrawal
QLIMONSRiver flow in Limons
QVBRiver flow in Vieille-Brioude
QALGNRiver flow for the Alagnon River
QNAUSSWater releases of the Naussac Dam
NSENash–Sutcliffe efficiency criterium

References

  1. Wang, S.; McKenney, D.W.; Shang, J.; Li, J. A National-Scale Assessment of Long-Term Water Budget Closures for Canada’s Watersheds. J. Geophys. Res. Atmos. 2014, 119, 8712–8725. [Google Scholar] [CrossRef]
  2. Thornthwaite, C.W.; Mather, J.R. Instructions and Tables for Computing Potential Evapotranspiration and the Water Balance; Drexel Institute of Technology Laboratory of Climatology: Centerton, NJ, USA, 1957; Volume 10. [Google Scholar]
  3. Milly, P.C.D. Climate, Soil Water Storage, and the Average Annual Water Balance. Water Resour. Res. 1994, 30, 2143–2156. [Google Scholar] [CrossRef]
  4. Hasenmueller, E.A.; Criss, R.E. Water Balance Estimates of Evapotranspiration Rates in Areas with Varying Land Use. In Evapotranspiration—An Overview; Alexandris, S., Ed.; InTech: London, UK, 2013; ISBN 978-953-51-1115-3. [Google Scholar]
  5. Xu, C.-Y.; Singh, V.P. A Review on Monthly Water Balance Models for Water Resources Investigations. Water Resour. Manag. 1998, 12, 31–50. [Google Scholar] [CrossRef]
  6. De Vries, J.J.; Simmers, I. Groundwater Recharge: An Overview of Processes and Challenges. Hydrogeol. J. 2002, 10, 5–17. [Google Scholar] [CrossRef]
  7. Dubois, E.; Larocque, M.; Gagné, S.; Meyzonnat, G. Simulation of Long-Term Spatiotemporal Variations in Regional-Scale Groundwater Recharge: Contributions of a Water Budget Approach in Cold and Humid Climates. Hydrol. Earth Syst. Sci. 2021, 25, 6567–6589. [Google Scholar] [CrossRef]
  8. Pointet, T. The United Nations World Water Development Report 2022 on Groundwater, a Synthesis. LHB 2022, 108, 2090867. [Google Scholar] [CrossRef]
  9. United Nations. The United Nations World Water Development Report 2022: Groundwater: Making the Invisible Visible; UNESCO: Paris, France, 2022; p. 246. [Google Scholar]
  10. Foster, S.S.D.; Chilton, P.J. Groundwater: The Processes and Global Significance of Aquifer Degradation. Phil. Trans. R. Soc. Lond. B 2003, 358, 1957–1972. [Google Scholar] [CrossRef] [PubMed]
  11. Maréchal, J.-C.; Rouillard, J. Groundwater in France: Resources, Use and Management Issues. In Sustainable Groundwater Management; Rinaudo, J.-D., Holley, C., Barnett, S., Montginoul, M., Eds.; Global Issues in Water Policy; Springer International Publishing: Cham, Switzerland, 2020; Volume 24, pp. 17–45. ISBN 978-3-030-32765-1. [Google Scholar]
  12. Yasarer, L.M.W.; Taylor, J.M.; Rigby, J.R.; Locke, M.A. Trends in Land Use, Irrigation, and Streamflow Alteration in the Mississippi River Alluvial Plain. Front. Environ. Sci. 2020, 8, 66. [Google Scholar] [CrossRef]
  13. Dafny, E.; Silburn, D.M. The Hydrogeology of the Condamine River Alluvial Aquifer, Australia: A Critical Assessment. Hydrogeol. J. 2014, 22, 705–727. [Google Scholar] [CrossRef]
  14. Rêgo, J.C.; Albuquerque, J.P.; Filho, J.D.P.; Tsuyuguchi, B.B.; Souza, T.J.; Galvao, C.O. Sustainable and Resilient Exploitation of Small Alluvial Aquifers in the Brazilian Semi-Arid Region. In Groundwater for Sustainable Livelihoods and Equitable Growth; CRC Press: London, UK, 2022; pp. 101–121. ISBN 978-1-00-302410-1. [Google Scholar]
  15. Ferrara, V.; Pappalardo, G. Intensive Exploitation Effects on Alluvial Aquifer of the Catania Plain, Eastern Sicily, Italy. Geofis. Int. 2004, 43, 671–681. [Google Scholar]
  16. Henao Casas, J.D.; Fernández Escalante, E.; Ayuga, F. Alleviating Drought and Water Scarcity in the Mediterranean Region through Managed Aquifer Recharge. Hydrogeol. J. 2022, 30, 1685–1699. [Google Scholar] [CrossRef]
  17. Du, M.; Zavattero, E.; Ma, Q.; Delestre, O.; Gourbesville, P.; Fouché, O. 3D Hydraulic Modeling of a Complex Alluvial Aquifer for Groundwater Resource Management. Procedia Eng. 2016, 154, 340–347. [Google Scholar] [CrossRef]
  18. Cotterman, K.A.; Kendall, A.D.; Basso, B.; Hyndman, D.W. Groundwater Depletion and Climate Change: Future Prospects of Crop Production in the Central High Plains Aquifer. Clim. Change 2018, 146, 187–200. [Google Scholar] [CrossRef]
  19. Gautam, A.; Rai, S.C.; Rai, S.P. Impact of Anthropogenic Activities on the Alluvial Aquifers of North-East Punjab, India. Environ. Monit. Assess. 2020, 192, 527. [Google Scholar] [CrossRef]
  20. Fu, G.; Rojas, R.; Gonzalez, D. Trends in Groundwater Levels in Alluvial Aquifers of the Murray–Darling Basin and Their Attributions. Water 2022, 14, 1808. [Google Scholar] [CrossRef]
  21. Shu, Y.; Villholth, K.G.; Jensen, K.H.; Stisen, S.; Lei, Y. Integrated Hydrological Modeling of the North China Plain: Options for Sustainable Groundwater Use in the Alluvial Plain of Mt. Taihang. J. Hydrol. 2012, 464–465, 79–93. [Google Scholar] [CrossRef]
  22. Godwin, I.A.; Reba, M.L.; Leslie, D.L.; Adams, R.F.; Rigby, J.R. Feasibility of Farm-Scale Infiltration Galleries for Managed Aquifer Recharge in an Agricultural Alluvial Aquifer of Northeast Arkansas. Agric. Water Manag. 2022, 264, 107531. [Google Scholar] [CrossRef]
  23. Petrone, K.C.; Hughes, J.D.; Van Niel, T.G.; Silberstein, R.P. Streamflow Decline in Southwestern Australia, 1950–2008: Streamflow Decline. Geophys. Res. Lett. 2010, 37, L11401. [Google Scholar] [CrossRef]
  24. Shi, R.; Wang, T.; Yang, D.; Yang, Y. Streamflow Decline Threatens Water Security in the Upper Yangtze River. J. Hydrol. 2022, 606, 127448. [Google Scholar] [CrossRef]
  25. Luce, C.H.; Holden, Z.A. Declining Annual Streamflow Distributions in the Pacific Northwest United States, 1948–2006. Geophys. Res. Lett. 2009, 36, L16401. [Google Scholar] [CrossRef]
  26. Das, S.; Sangode, S.J.; Kandekar, A.M. Recent Decline in Streamflow and Sediment Discharge in the Godavari Basin, India (1965–2015). Catena 2021, 206, 105537. [Google Scholar] [CrossRef]
  27. Mair, A.; Fares, A. Influence of Groundwater Pumping and Rainfall Spatio-Temporal Variation on Streamflow. J. Hydrol. 2010, 393, 287–308. [Google Scholar] [CrossRef]
  28. Fang, B.; Kam, J.; Elliott, E.; Tootle, G.; Therrell, M.; Lakshmi, V. The Recent Decline of Apalachicola–Chattahoochee–Flint (ACF) River Basin Streamflow. Hydrology 2022, 9, 140. [Google Scholar] [CrossRef]
  29. Dey, P.; Mishra, A. Separating the Impacts of Climate Change and Human Activities on Streamflow: A Review of Methodologies and Critical Assumptions. J. Hydrol. 2017, 548, 278–290. [Google Scholar] [CrossRef]
  30. Cabus, P. River Flow Prediction through Rainfall–Runoff Modelling with a Probability-Distributed Model (PDM) in Flanders, Belgium. Agric. Water Manag. 2008, 95, 859–868. [Google Scholar] [CrossRef]
  31. Thierion, C.; Longuevergne, L.; Habets, F.; Ledoux, E.; Ackerer, P.; Majdalani, S.; Leblois, E.; Lecluse, S.; Martin, E.; Queguiner, S.; et al. Assessing the Water Balance of the Upper Rhine Graben Hydrosystem. J. Hydrol. 2012, 424–425, 68–83. [Google Scholar] [CrossRef]
  32. Pumo, D.; Arnone, E.; Francipane, A.; Caracciolo, D.; Noto, L.V. Potential Implications of Climate Change and Urbanization on Watershed Hydrology. J. Hydrol. 2017, 554, 80–99. [Google Scholar] [CrossRef]
  33. Lee, H.; McIntyre, N.; Wheater, H.; Young, A. Selection of Conceptual Models for Regionalisation of the Rainfall-Runoff Relationship. J. Hydrol. 2005, 312, 125–147. [Google Scholar] [CrossRef]
  34. Khakbaz, B.; Imam, B.; Hsu, K.; Sorooshian, S. From Lumped to Distributed via Semi-Distributed: Calibration Strategies for Semi-Distributed Hydrologic Models. J. Hydrol. 2012, 418–419, 61–77. [Google Scholar] [CrossRef]
  35. Refsgaard, J.C.; Knudsen, J. Operational Validation and Intercomparison of Different Types of Hydrological Models. Water Resour. Res. 1996, 32, 2189–2202. [Google Scholar] [CrossRef]
  36. McMichael, C.E.; Hope, A.S.; Loaiciga, H.A. Distributed Hydrological Modelling in California Semi-Arid Shrublands: MIKE SHE Model Calibration and Uncertainty Estimation. J. Hydrol. 2006, 317, 307–324. [Google Scholar] [CrossRef]
  37. Goderniaux, P.; Brouyère, S.; Fowler, H.J.; Blenkinsop, S.; Therrien, R.; Orban, P.; Dassargues, A. Large Scale Surface–Subsurface Hydrological Model to Assess Climate Change Impacts on Groundwater Reserves. J. Hydrol. 2009, 373, 122–138. [Google Scholar] [CrossRef]
  38. Brunner, P.; Simmons, C.T. HydroGeoSphere: A Fully Integrated, Physically Based Hydrological Model. Ground Water 2012, 50, 170–176. [Google Scholar] [CrossRef]
  39. Santhi, C.; Arnold, J.G.; Williams, J.R.; Dugas, W.A.; Srinivasan, R.; Hauck, L.M. Validation of the swat model on a large rwer basin with point and nonpoint sources. J. Am. Water Resour. Assoc. 2001, 37, 1169–1188. [Google Scholar] [CrossRef]
  40. Guug, S.S.; Abdul-Ganiyu, S.; Kasei, R.A. Application of SWAT Hydrological Model for Assessing Water Availability at the Sherigu Catchment of Ghana and Southern Burkina Faso. HydroResearch 2020, 3, 124–133. [Google Scholar] [CrossRef]
  41. Duan, Q.; Sorooshian, S.; Gupta, V. Effective and Efficient Global Optimization for Conceptual Rainfall-Runoff Models. Water Resour. Res. 1992, 28, 1015–1031. [Google Scholar] [CrossRef]
  42. Bastola, S.; Ishidaira, H.; Takeuchi, K. Regionalisation of Hydrological Model Parameters under Parameter Uncertainty: A Case Study Involving TOPMODEL and Basins across the Globe. J. Hydrol. 2008, 357, 188–206. [Google Scholar] [CrossRef]
  43. Kim, D.; Naliaka, A.; Zhu, Z.; Ogden, F.L.; McMillan, H.K. Experimental Coupling of TOPMODEL with the National Water Model: Effects of Coupling Interface Complexity on Model Performance. J. Am. Water Resour. Assoc. 2022, 58, 50–74. [Google Scholar] [CrossRef]
  44. Merz, R.; Parajka, J.; Blöschl, G. Scale Effects in Conceptual Hydrological Modeling: Scale effects in conceptual hydrological modeling. Water Resour. Res. 2009, 45, W09405. [Google Scholar] [CrossRef]
  45. Seibert, J.; Bergström, S. A Retrospective on Hydrological Catchment Modelling Based on Half a Century with the HBV Model. Hydrol. Earth Syst. Sci. 2022, 26, 1371–1388. [Google Scholar] [CrossRef]
  46. Perrin, C.; Michel, C.; Andréassian, V. Improvement of a Parsimonious Model for Streamflow Simulation. J. Hydrol. 2003, 279, 275–289. [Google Scholar] [CrossRef]
  47. Sezen, C.; Bezak, N.; Bai, Y.; Šraj, M. Hydrological Modelling of Karst Catchment Using Lumped Conceptual and Data Mining Models. J. Hydrol. 2019, 576, 98–110. [Google Scholar] [CrossRef]
  48. Thiery, D. Forecast of Changes in Piezometric Levels by a Lumped Hydrological Model. J. Hydrol. 1988, 97, 129–148. [Google Scholar] [CrossRef]
  49. Thiéry, D. Logiciel Gardenia. version v8.2. Guide d’utilisation; BRGM: Orléans, France, 2014; p. 140. [Google Scholar]
  50. Mohammed, N.; Celle-Jeanton, H.; Huneau, F.; Le Coustumer, P.; Lavastre, V.; Bertrand, G.; Charrier, G.; Clauzet, M.L. Isotopic and Geochemical Identification of Main Groundwater Supply Sources to an Alluvial Aquifer, the Allier River Valley (France). J. Hydrol. 2014, 508, 181–196. [Google Scholar] [CrossRef]
  51. D’Arcy, D.; Livet, M. Massif Central. In Aquifères et Eaux Souterraines en France; BRGM Editions: Orléans, France, 2006; Volume 2, p. 944. ISBN 2-7159-0980-2. [Google Scholar]
  52. Korobova, E.M.; Veldkamp, A.; Ketner, P.; Kroonenberg, S.B. Element Partitioning in Sediment, Soil and Vegetation in an Alluvial Terrace Chronosequence, Limagne Rift Valley, France: A Landscape Geochemical Study. Catena 1997, 31, 91–117. [Google Scholar] [CrossRef]
  53. Pastre, J.-F. Les nappes alluviales de l’Allier en Limagne (Massif Central, France): Stratigraphie et corrélations avec le volcanisme régional. Quaternaire 2005, 16, 153–175. [Google Scholar] [CrossRef]
  54. Thiéry, D.; Diluca, C.; Diagana, B. Modelling the Aquifer Recovery after a Long Duration Drought in Burkina Faso. In Extreme Hydrological Events: Precipitation, Floods and Droughts-Yokohama (Japon); IAHS Press: Yokohama, Japan, 1993; pp. 43–50. [Google Scholar]
  55. Pointet, T.; Amraoui, N.; Golaz, C.; Mardhel, V.; Negrel, P.; Pennequin, D.; Pinault, J.-L. La contribution des eaux souterraines aux crues exceptionnelles de la Somme en 2001 Observations, hypothèses, modélisation. La Houille Blanche 2003, 89, 112–122. [Google Scholar] [CrossRef]
  56. Habets, F.; Boé, J.; Déqué, M.; Ducharne, A.; Gascoin, S.; Hachour, A.; Martin, E.; Pagé, C.; Sauquet, E.; Terray, L.; et al. Impact of Climate Change on the Hydrogeology of Two Basins in Northern France. Clim. Change 2013, 121, 771–785. [Google Scholar] [CrossRef]
  57. Jeannin, P.-Y.; Artigue, G.; Butscher, C.; Chang, Y.; Charlier, J.-B.; Duran, L.; Gill, L.; Hartmann, A.; Johannet, A.; Jourde, H.; et al. Karst Modelling Challenge 1: Results of Hydrological Modelling. J. Hydrol. 2021, 600, 126508. [Google Scholar] [CrossRef]
  58. Ly, S.; Charles, C.; Degré, A. Different Methods for Spatial Interpolation of Rainfall Data for Operational Hydrology and Hydrological Modeling at Watershed Scale. A Review. Biotechnol. Agron. Soc. Environ. 2013, 17, 392–406. [Google Scholar]
  59. Buytaert, W.; Celleri, R.; Willems, P.; Bièvre, B.D.; Wyseure, G. Spatial and Temporal Rainfall Variability in Mountainous Areas: A Case Study from the South Ecuadorian Andes. J. Hydrol. 2006, 329, 413–421. [Google Scholar] [CrossRef]
  60. Ruelland, D.; Ardoin-Bardin, S.; Billen, G.; Servat, E. Sensitivity of a Lumped and Semi-Distributed Hydrological Model to Several Methods of Rainfall Interpolation on a Large Basin in West Africa. J. Hydrol. 2008, 361, 96–117. [Google Scholar] [CrossRef]
  61. Oudin, L.; Hervieu, F.; Michel, C.; Perrin, C.; Andréassian, V.; Anctil, F.; Loumagne, C. Which Potential Evapotranspiration Input for a Lumped Rainfall–Runoff Model? J. Hydrol. 2005, 303, 290–306. [Google Scholar] [CrossRef]
  62. Nash, J.E.; Sutcliffe, J.V. River Flow Forecasting through Conceptual Models Part I—A Discussion of Principles. J. Hydrol. 1970, 10, 282–290. [Google Scholar] [CrossRef]
  63. Anderson, M.P.; Woessner, W.W.; Hunt, R.J. Applied Groundwater Modeling: Simulation of Flow and Advective Transport, 2nd ed.; Academic Press: San Diego, CA, USA, 2015; ISBN 978-0-12-058103-0. [Google Scholar]
  64. Valérian, F.; Comby, G.; Kappelmann, A.; Gimon, M.; Michaux, M. Adaptation Au Changement Climatique. In Annales des Mines—Responsabilité et Environnement; Les Echos Le Parisien Médias: Paris, France, 2022; p. 116. [Google Scholar]
  65. Soubeyroux, J.-M.; Bernus, S.; Corre, L.; Drouin, A.; Dubuisson, B.; Etchevers, P.; Gouget, V.; Josse, P.; Kerdoncuff, M.; Samacoits, R.; et al. Les Nouvelles Projections Climatiques de Réference DRIAS 2020 Pour la Métropole; Météo-France: Paris, France, 2020; p. 98. [Google Scholar]
  66. Brulebois, E.; Castel, T.; Richard, Y.; Chateau-Smith, C.; Amiotte-Suchet, P. Hydrological Response to an Abrupt Shift in Surface Air Temperature over France in 1987/88. J. Hydrol. 2015, 531, 892–901. [Google Scholar] [CrossRef]
  67. Renard, B.; Lang, M.; Bois, P.; Dupeyrat, A.; Mestre, O.; Niel, H.; Sauquet, E.; Prudhomme, C.; Parey, S.; Paquet, E.; et al. Regional Methods for Trend Detection: Assessing Field Significance and Regional Consistency: Regional methods for trend detection. Water Resour. Res. 2008, 44, W08419. [Google Scholar] [CrossRef]
  68. Tena, A.; Ville, F.; Reñe, A.; Yarnell, S.M.; Batalla, R.J.; Vericat, D. Hydrological Characterization of Hydropeaks in Mountain Rivers (Examples from Southern Pyrenees). River Res. Appl. 2022, rra.4058. [Google Scholar] [CrossRef]
  69. Healy, R.W.; Winter, T.C.; LaBaugh, J.W.; Franke, O.L. Water Budgets: Foundations for Effective Water-Resources and Environmental Management; USGA: Reston, VA, USA, 2007; p. 90. [Google Scholar]
  70. Brutsaert, W. Catchment-Scale Evaporation and the Atmospheric Boundary Layer. Water Resour. Res. 1986, 22, 39S–45S. [Google Scholar] [CrossRef]
  71. Oki, T.; Kanae, S. Global Hydrological Cycles and World Water Resources. Science 2006, 313, 1068–1072. [Google Scholar] [CrossRef]
  72. Daum, J.R.; Desprats, J.F.; Durand, F. Précipitations Efficaces Moyennes Annuelles en France (1965–1994); BRGM: Orléans, France, 1996; p. 17. [Google Scholar]
  73. Tabarmayeh, M.; Zarei, M.; Batelaan, O. A New Approach to Quantification of Groundwater Resource Stress. J. Hydrol. Reg. Stud. 2022, 42, 101161. [Google Scholar] [CrossRef]
  74. Zheng, Z.; Ning, L.; Dai, D.; Chen, L.; Wang, Y.; Ma, Z.; Yang, Z.-L.; Zhan, C. Water Budget Variation, Groundwater Depletion, and Water Resource Vulnerability in the Haihe River Basin during the New Millennium. Phys. Chem. Earth Parts A/B/C 2022, 126, 103141. [Google Scholar] [CrossRef]
  75. Karlović, I.; Marković, T.; Vujnović, T.; Larva, O. Development of a Hydrogeological Conceptual Model of the Varaždin Alluvial Aquifer. Hydrology 2021, 8, 19. [Google Scholar] [CrossRef]
  76. King, A.C.; Raiber, M.; Cox, M.E.; Cendón, D.I. Comparison of Groundwater Recharge Estimation Techniques in an Alluvial Aquifer System with an Intermittent/Ephemeral Stream (Queensland, Australia). Hydrogeol. J. 2017, 25, 1759–1777. [Google Scholar] [CrossRef]
  77. Al-ahmadi, M.E.; El-Fiky, A.A. Hydrogeochemical Evaluation of Shallow Alluvial Aquifer of Wadi Marwani, Western Saudi Arabia. J. King Saud Univ.-Sci. 2009, 21, 179–190. [Google Scholar] [CrossRef]
  78. Coelho, V.H.R.; Montenegro, S.; Almeida, C.N.; Silva, B.B.; Oliveira, L.M.; Gusmão, A.C.V.; Freitas, E.S.; Montenegro, A.A.A. Alluvial Groundwater Recharge Estimation in Semi-Arid Environment Using Remotely Sensed Data. J. Hydrol. 2017, 548, 1–15. [Google Scholar] [CrossRef]
  79. Yang, L.; Zeng, S.; Xia, J.; Wang, Y.; Huang, R.; Chen, M. Effects of the Three Gorges Dam on the Downstream Streamflow Based on a Large-Scale Hydrological and Hydrodynamics Coupled Model. J. Hydrol. Reg. Stud. 2022, 40, 101039. [Google Scholar] [CrossRef]
  80. Hwang, J.; Kumar, H.; Ruhi, A.; Sankarasubramanian, A.; Devineni, N. Quantifying Dam-Induced Fluctuations in Streamflow Frequencies Across the Colorado River Basin. Water Resour. Res. 2021, 57, e2021WR029753. [Google Scholar] [CrossRef]
  81. Assani, A.A.; Gravel, É.; Buffin-Bélanger, T.; Roy, A.G. Impacts Des Barrages Sur Les Débits Annuels Minimums En Fonction Des Régimes Hydrologiques Artificialisés Au Québec (Canada). Rev. Des Sci. De L’eau 2005, 18, 103–127. [Google Scholar] [CrossRef]
  82. Constantz, J.; Essaid, H. Influence of Groundwater Pumping on Streamflow Restoration Following Upstream Dam Removal. Hydrol. Processes 2007, 21, 2823–2834. [Google Scholar] [CrossRef]
  83. Bhatti, A.Z.; Farooque, A.A.; Krouglicof, N.; Li, Q.; Peters, W.; Abbas, F.; Acharya, B. An Overview of Climate Change Induced Hydrological Variations in Canada for Irrigation Strategies. Sustainability 2021, 13, 4833. [Google Scholar] [CrossRef]
  84. Achugbu, I.C.; Olufayo, A.A.; Balogun, I.A.; Dudhia, J.; McAllister, M.; Adefisan, E.A.; Naabil, E. Potential Effects of Land Use Land Cover Change on Streamflow over the Sokoto Rima River Basin. Heliyon 2022, 8, e09779. [Google Scholar] [CrossRef]
  85. Vicente-Serrano, S.M.; Peña-Gallardo, M.; Hannaford, J.; Murphy, C.; Lorenzo-Lacruz, J.; Dominguez-Castro, F.; López-Moreno, J.I.; Beguería, S.; Noguera, I.; Harrigan, S.; et al. Climate, Irrigation, and Land Cover Change Explain Streamflow Trends in Countries Bordering the Northeast Atlantic. Geophys. Res. Lett. 2019, 46, 10821–10833. [Google Scholar] [CrossRef] [Green Version]
  86. Lorenzo-Lacruz, J.; Morán-Tejeda, E.; Vicente-Serrano, S.M.; Hannaford, J.; García, C.; Peña-Angulo, D.; Murphy, C. Streamflow Frequency Changes across Western Europe and Interactions with North Atlantic Atmospheric Circulation Patterns. Glob. Planet. Change 2022, 212, 103797. [Google Scholar] [CrossRef]
  87. Mas-Pla, J.; Menció, A.; Marsiñach, A. Basement Groundwater as a Complementary Resource for Overexploited Stream-Connected Alluvial Aquifers. Water Resour. Manag. 2013, 27, 293–308. [Google Scholar] [CrossRef]
  88. Gupta, C.P.; Ahmed, S.; Gurunadha Rao, V.V.S. Conjunctive Utilization of Surface Water and Groundwater to Arrest the Water-Level Decline in an Alluvial Aquifer. J. Hydrol. 1985, 76, 351–361. [Google Scholar] [CrossRef]
  89. Ambast, S.K.; Tyagi, N.K.; Raul, S.K. Management of Declining Groundwater in the Trans Indo-Gangetic Plain (India): Some Options. Agric. Water Manag. 2006, 82, 279–296. [Google Scholar] [CrossRef]
  90. Reba, M.L.; Massey, J.H.; Adviento-Borbe, M.A.; Leslie, D.; Yaeger, M.A.; Anders, M.; Farris, J. Aquifer Depletion in the Lower Mississippi River Basin: Challenges and Solutions. J. Contemp. Water Res. Educ. 2017, 162, 128–139. [Google Scholar] [CrossRef]
  91. Tribouillois, H.; Constantin, J.; Casal, L.; Villerd, J.; Therond, O. Introducing and Expanding Cover Crops at the Watershed Scale: Impact on Water Flows. Agric. Ecosyst. Environ. 2022, 337, 108050. [Google Scholar] [CrossRef]
  92. Martin, E.; Gascoin, S.; Grusson, Y.; Murgue, C.; Bardeau, M.; Anctil, F.; Ferrant, S.; Lardy, R.; Le Moigne, P.; Leenhardt, D.; et al. On the Use of Hydrological Models and Satellite Data to Study the Water Budget of River Basins Affected by Human Activities: Examples from the Garonne Basin of France. Surv. Geophys. 2016, 37, 223–247. [Google Scholar] [CrossRef]
  93. Thirel, G.; Gerlinger, K.; Perrin, C.; Drogue, G.; Renard, B.; Wagner, J.-P. Quels futurs possibles pour les débits des affluents français du Rhin (Moselle, Sarre, Ill)? La Houille Blanche 2019, 105, 140–149. [Google Scholar] [CrossRef]
  94. Chauveau, M.; Chazot, S.; Perrin, C.; Bourgin, P.-Y.; Sauquet, E.; Vidal, J.-P.; Rouchy, N.; Martin, E.; David, J.; Norotte, T.; et al. Quels impacts des changements climatiques sur les eaux de surface en France à l’horizon 2070 ? La Houille Blanche 2013, 99, 5–15. [Google Scholar] [CrossRef]
  95. BRGM/ARMINES. Hydrologie Souterraine—Explore 2070 Eau et Changement Climatique; BRGM: Orléans, France, 2012; p. 54. [Google Scholar]
  96. Kim, J.; Choi, J.; Choi, C.; Park, S. Impacts of Changes in Climate and Land Use/Land Cover under IPCC RCP Scenarios on Streamflow in the Hoeya River Basin, Korea. Sci. Total Environ. 2013, 452–453, 181–195. [Google Scholar] [CrossRef] [PubMed]
  97. Eisner, S.; Flörke, M.; Chamorro, A.; Daggupati, P.; Donnelly, C.; Huang, J.; Hundecha, Y.; Koch, H.; Kalugin, A.; Krylenko, I.; et al. An Ensemble Analysis of Climate Change Impacts on Streamflow Seasonality across 11 Large River Basins. Clim. Change 2017, 141, 401–417. [Google Scholar] [CrossRef]
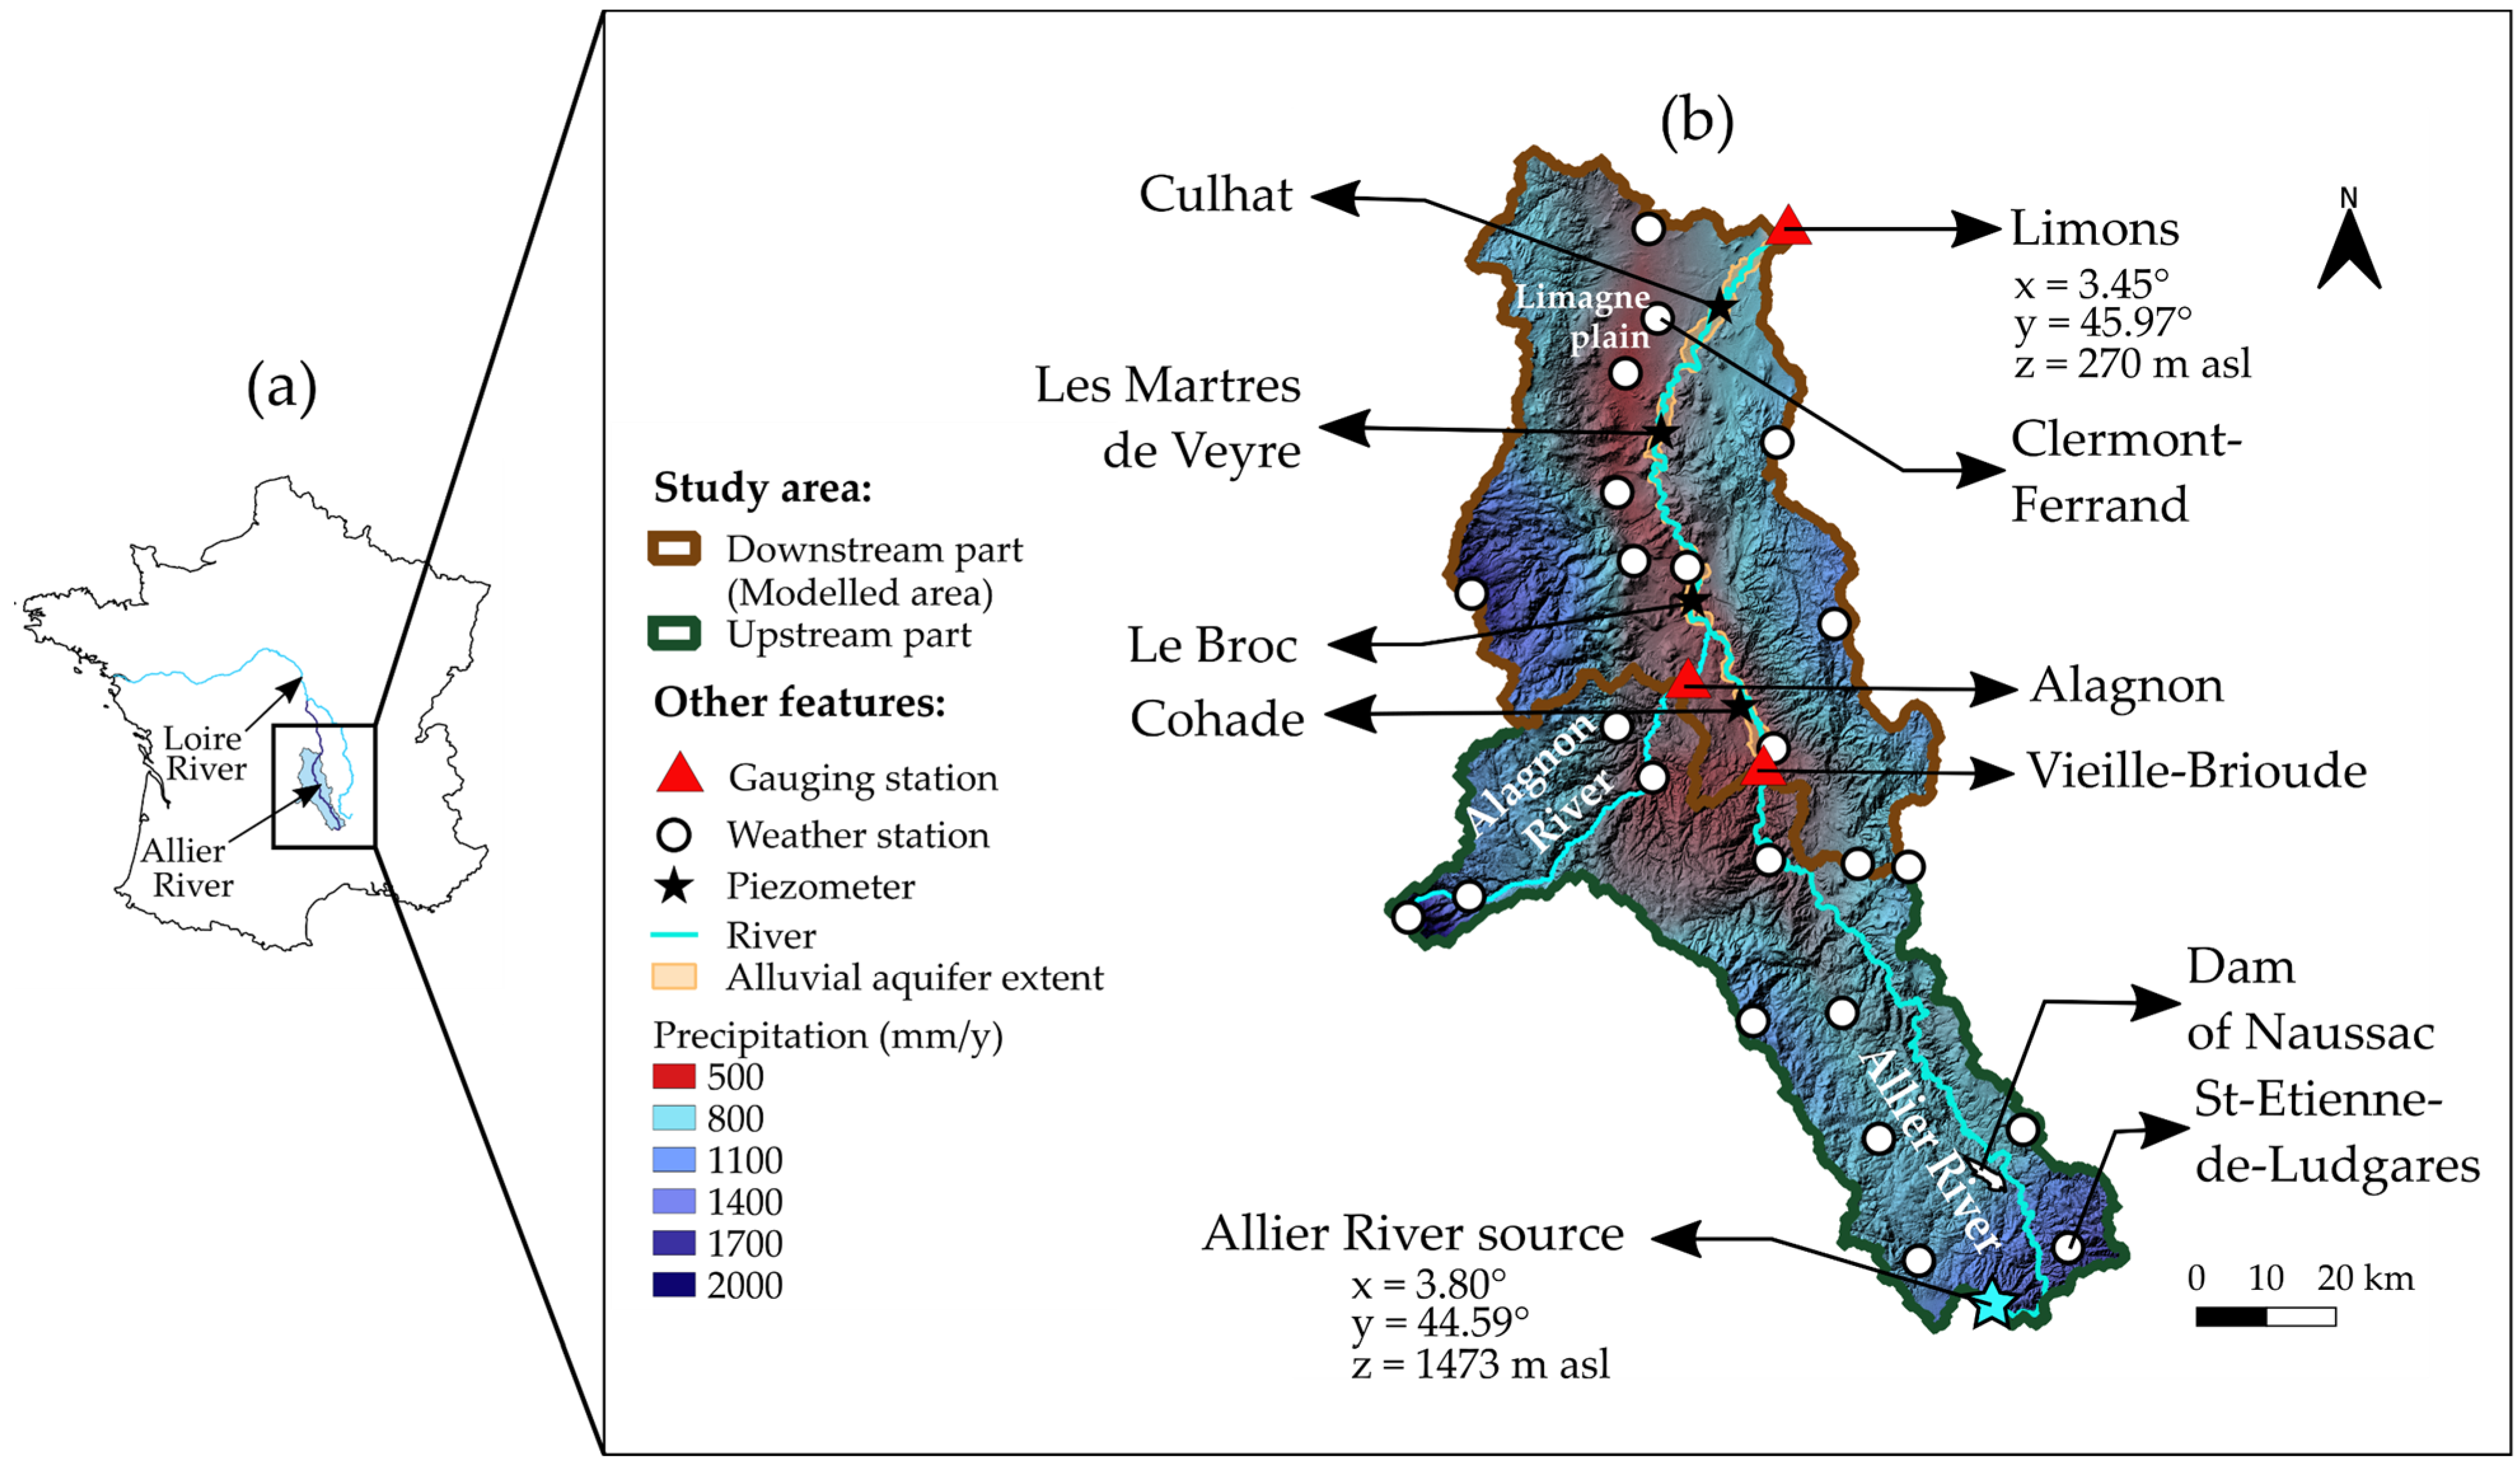
Figure 1. (a) Location of the Allier River, the Loire River, and the Southern Allier River Watershed in France. (b) Merged maps of elevation levels and distribution of mean annual precipitation in the study area (Météo-France, 2000–2020).
Sustainability 15 03275 g001
Figure 2. Functional scheme of the reservoir model Gardenia, which was adapted from Thiéry (2014) [49].
Sustainability 15 03275 g002
Figure 3. Evolution of the mean air temperature anomaly (°C) in France forRCP2.6, RCP4.5, and RCP8.5, adapted from Valérian et al. (2022) [64].
Sustainability 15 03275 g003
Figure 4. (a) Annual air temperature Ta (°C) at Clermont–Ferrand weather station, (b) annual precipitation P (mm/y) at Clermont–Ferrand and St-Etienne-de-Ludgarès (SEDL) weather stations, (c) annual discharge volume Q (Mm3/y) measured by the gauging stations of Limons (QLIMONS) and Vieille-Brioude (QVB). The red frame indicates the modelling period (2000–2020).
Sustainability 15 03275 g004
Figure 5. Evolution from 2000 to 2020 for the upstream and downstream parts of the study area (as defined in Figure 1) of (a,b) mean annual air temperature Ta (°C), (c,d) annual precipitation P, potential evapotranspiration sum PET (mm/y), (e,f) mean annual discharge of the Allier River in Limons (QLIMONS) and Vieille-Brioude (QVB) (Mm3/y), and (g,h) mean annual groundwater levels H of the alluvial aquifer (m asl) in Cohade (HCOHADE) and in Culhat (HCULHAT).
Sustainability 15 03275 g005
Figure 6. Annual volume of water injected into the river by the Naussac Dam (QNAUSS) and annual volume of water withdrawn for domestic supplies and irrigation (QW), all expressed in Mm3/y. The trend lines are given for each presented component.
Sustainability 15 03275 g006
Figure 7. (a) Distribution of the Allier River’s flow rates (m3/s) over a year, which was averaged on a daily basis from 2000 to 2020 in Vieille-Brioude (QVB) and Limons (QLIMONS), from which Naussac Dam’s daily releases were subtracted (QVB-NAUSS and QLIMONS-NAUSS), (b) distribution of the groundwater levels (m asl) over a year, which was averaged on a daily basis from 2007 to 2020, for three piezometers in Culhat (HCULHAT).
Sustainability 15 03275 g007
Figure 8. (a) Evolution of the simulated vs. observed Allier River discharge (m3/s) in Limons with the corresponding correlation plots considering a calibration using (b) 2000–2014 timestep and (c) a validation using 2015–2020 timestep; (d) evolution of the simulated vs. observed groundwater levels in Culhat (m asl) with the corresponding correlation plots considering a calibration using (e) 2010–2016 timestep and (f) a validation using 2017–2020 timestep. In (a,d), precipitation (mm/d) was determined for the downstream part (Figure 1b) of the study area.
Sustainability 15 03275 g008
Figure 9. Water balance of the downstream part of the study area (as defined in Figure 1b) for the 2000–2020 period: inflows (QIN + PEFF) and outflows (QOUT). ΔS is the difference between inflows and outflows. All fluxes were expressed in Mm3/y.
Sustainability 15 03275 g009
Figure 10. (a) QLIMONS (m3/s) and (b) HCULHAT for piezometer P40-07 m asl, both yearly averages for 2030–2070, were presented for the “best” case (RCM Aladin63 in RCP2.6) and “worst” case (RCM RegCM4-6 in RCP8.5). The error bars represent the standard deviations determined for 2030–2070 and “Ref” (reference), which stand for the observed QLIMONS for 2000–2020 and HCULHAT (P40-07) for 2007–2020.
Sustainability 15 03275 g010
Figure 11. (ac) Annual mean distribution of QLIMONS (m3/s) and (bd) annual mean distribution of HCULHAT for piezometer P40-07 (m asl) over 2030–2070 compared to the river flow reference (2000–2020) and the groundwater level reference (2007–2020). The green areas mean that the forecasted flow/level is above the reference and the reverse is represented by red areas. The yearly mean flow/level over 2030–2070 period for the reference and the forecast are also shown.
Sustainability 15 03275 g011
Table 1. List of collected data together with their sources (internet access links are provided in the Data Availability Statement), units, sampling timesteps, and available time periods.
ParametersUnitsTimestepSourceTime Period
Precipitation (P)mmDailyMétéo-France2000–2020
Air temperature (Ta)°CDailyMétéo-France2000–2020
River flow rate (Q)m3/sDailyHydroportail2000–2020
Piezometric level (H)m aslDailyADES2007–2020
Abstraction (QW)Mm3/yYearlyEPLoire2000–2019
Dam discharge (QNAUSS)m3/sDailyBNPE/AELB2000–2020
Table 2. Optimized parameters in Gardenia and their descriptions: soil reservoir capacity SRES, distribution height of runoff–infiltration HR-I, underground exchange factor FEXCH, flow delay time FD, half infiltration time of the water table Infilt1/2, half drying time of groundwater flow Dry1/2, groundwater base level GBF, and storage coefficient SCOEFF.
ParametersUnitsDescription
SRESmmWater capacity of the soil layer.
HR-ImmWater height that leads to an equal distribution of the fast flow (R) and of the low flow (GWR).
FEXCH%The model is allowed to export/import flow to/from reservoir Sz.
FDdaysDelay between the emptying of Uz and Sz until it reaches the outlet.
Infiltr1/2monthTime between a PEFF reaction and an increase in the low flow component of the groundwater reservoir.
Dry1/2monthTime upon which, when no GWR occurs, the groundwater flow is divided by two.
GBFm aslLevel that would be reached after an infinite time with no GWR.
SCOEFF%Storage coefficient of the aquifer.
Table 3. Yearly mean of air temperature (°C) and precipitation sums (mm/y) averaged over 2030–2070 for the defined “best case”, RCM Aladin63 in RCP2.6, and for the “worst case”, RegCM4-6 in RCP8.5, based on collected data from DRIAS-2020. They all refer to the downstream part of the study area (Figure 1b) compared to values obtained for the reference period “Ref”: 2000–2020.
ParameterRefRCM Aladin63
RCP2.6
RCM RegCM4-6
RCP8.5
Air temperature (°C)11.5011.3012.55
Precipitation (mm/y) 770909886
Table 4. Post-calibration of the optimized parameters and their adjustment ranges.
ParameterUnitInitial ValueMinMaxCalibrated
Value
SRESmm2500650131.5
HR-Imm701999948.6
FEXCH%0−7080−31.0
FDday00102.2
Infilt1/2month0.50.05100.05
Dry1/2month20.05150.36
GBFm asl0--290.5
SCOEFF(%)101301.6
Disclaimer/Publisher’s Note: The statements, opinions and data contained in all publications are solely those of the individual author(s) and contributor(s) and not of MDPI and/or the editor(s). MDPI and/or the editor(s) disclaim responsibility for any injury to people or property resulting from any ideas, methods, instructions or products referred to in the content.