Article

Effect of Carbide Slag Combined with Biochar on Improving Acidic Soil of Copper Sulfide Mines

1
School of Energy and Mechanical Engineering, Jiangxi University of Science and Technology, Nanchang 330013, China
2
Chengmenshan Copper Mine, Men Township, Jiujiang 332199, China
*
Author to whom correspondence should be addressed.
Sustainability 2023, 15(4), 3206; https://doi.org/10.3390/su15043206
Submission received: 17 December 2022 / Revised: 1 February 2023 / Accepted: 3 February 2023 / Published: 9 February 2023

Abstract

:
Heavy metal-rich acidic soils of copper sulfide mines can easily cause harm to the surrounding environment and ecosystem safety if not treated properly. Currently, the most common method of mine ecological remediation is to improve acidic soils of copper sulfide mines by adding different types of amendments. In this paper, different dosages of biochar and carbide slag applied singly and in combination were designed to investigate the changes of physicochemical properties and ryegrass growth in the acidic soil of copper sulfide mines. Through soil incubation experiments and potting tests, different treatments explored the improvement effect of carbide slag combined with biochar on the acidic soil of copper sulfide mines. Then, it was found that 2% (w/w) carbide slag in combination with 10% (w/w) biochar had the best effect on the improvement of copper-sulfide mine acidic soil. Among them, carbide slag significantly increased the pH, cation exchange capacity (CEC) and acid neutralization capacity (ANC), and reduced the electrical conductivity (EC), net acid generation (NAG) and sulfate ion (SO42−) concentrations in the acidic soil of copper sulfide mines; biochar obviously reduced the bio-effectiveness of heavy metals Cu, Pb and Zn, and DPTA-Cu, Pb and Zn decreased by 8~80%, 7~76% and 17~79%, respectively. Apart from that, there was a positive cooperativity between carbide slag and biochar, and their application effectively controlled the acidification process and heavy metal toxicity in the acidic soil of copper sulfide mines. In summary, the results will provide a theoretical basis for the large-scale reclamation of carbide slag and biochar in improving acidic soils of copper sulfide mines, filling the gap of calcium carbide slag and biochar in soil remediation.

1. Introduction

The development of human production activities cannot be separated from mine resources, especially in developing countries, where mines and their related industries play a crucial role in their economic growth and industrial development [1,2]. However, large-scale open-pit mining operations (e.g., mining, mine processing, and waste tailings disposal) often result in serious damage to the environment surrounding the mines, when the soil is affected negatively for the longest time and the widest range [3]. During the mining process, sulfide-containing deposits oxidize with oxygen, water and bacteria, leading to acid mine drainage (AMD), which is rich in various heavy metals [4]. Wastelands contaminated by acid mine drainage often possess some extreme soil properties, such as extremely acidic soils, nutrient deficiencies and excessive heavy metal content. Moreover, heavy metal ions in extreme acidic environments can further intensify leakage and precipitation [5], cause vegetation obliteration and deterioration of river water bodies, and even pose a great threat to human health through the food chain [6]. Therefore, it is urgent to remediate contaminated soil in metal mines and to achieve sustainable development of the mining industry [7].
Over the decades, a variety of soil remediation techniques (physical, chemical and biological) have been developed. Traditional soil remediation methods are usually soil incineration [8], in situ vitrification [9], soil consolidation [10], soil excavation and landfill [11,12], soil washing [13] and electric remediation [14]. Nonetheless, all of them are too costly, labor-intensive, time-consuming and cannot be applied in large-scale engineering [15]. The conventional treatment of AMD is mainly adding chemical neutralizers and oxidizers, but this method is also featured with high cost, and the process is likely to generate a large amount of non-processable sludge, which further increases pollution [16].
In recent years, assisted natural remediation (ANR) may be a cost-effective alternative to traditional techniques for remediation of polymetallic-contaminated soils, because it is less expensive, simple to operate, not contaminating topsoil when treating contaminants and somewhat eco-friendly. ANR technology is based on the addition of certain amendments and/or plantings to reactivate and enhance the natural attenuation mechanisms (adsorption, precipitation, complexation and redox reactions) in the soil, reducing the leachate rate, biological effectiveness and toxicity of heavy metals to plants, thereby immobilizing them in situ and affecting the microbial activity, plant development and nutrient cycling in the soil [17,18].
Among numerous organic amendments, biochar is a promising soil improvement material. It is a highly aromatized solid product rich in N, P, K, Ca, Na, Mg, Si and other mineral elements produced by anaerobic or anaerobic pyrolysis of plants or animal biomass or fertilizer at high temperatures [19]. It is widely used in agriculture and environmental protection fields in instances such as increasing the carbon sink and remediation of environmental pollution due to its great specific surface area, well-developed pores, and rich functional groups [20]. In addition, the application of biochar amendment to the reclamation of acidic metal-contaminated soil is a cost effective and environmentally friendly technology [21]. Studies have shown that biochar can be added to phytoremediation of polymetallic soils to reduce the mobility and permeability of heavy metals in the soil since biochar can reduce the toxicity of several heavy metals in hyperaccumulators. For example, in soil-leaching experiments using oxygen-limited burning of corn stover biochar at 600 °C, biochar reduced the migration of Cu, Zn and Pb to a great extent [22]. The use of lychee-dried biochar combined with soil replacement technology was effective in enhancing soil acidity and microbial activity and reducing the effective As, Pb, Cd, Cu and Zn content in soil [23]. Furthermore, according to the study, the use of hemp oak wood biochar under oxygen-limited combustion at 400 degrees Celsius in copper metal tailings was reported to reduce the migration of Cu, Ni and Pb by 87%, 86% and 84%, respectively [24]. Pot experiments using 2% (w/w) bamboo biochar on copper tailings with rapeseed as the test species demonstrated that bamboo biochar observably reduced the uptake and translocation rates of Cu, Cr, Pb and Zn by rapeseed plants and increased the biological yield of rapeseed plants [25]. Biochar affects soil properties by enhancing the complexation ability of soil with heavy metals, and when the ambient pH around biochar increases, the negative charge carried on its surface subsequently surges, thus enhancing the adsorption ability of positively charged metal ions. Hence, the magnitude of biochar’s ability to adsorb and immobilize heavy metal ions depends on its pH value [26,27,28,29]. Without acidification, the application of biochar can reduce the extractability and bio-effectiveness of Cd, Zn and Pb [30]. However, the pH of biochar made from different raw materials and different pyrolysis temperatures varies dramatically, and the alkaline material carried by biochar itself is not sufficient to improve the pH of very acidic metal soils [31].
Carbide slag is an industrial waste residue produced after the hydrolysis of calcium carbide to obtain acetylene gas, whose main component is CaO, and the pH of the slag liquid is generally above 12 [32]. Application of carbide slag can increase soil pH and reduce the bioavailability of heavy metals [33].
In conclusion, biochar can reduce the harm of heavy metals to environment, but cannot significantly improve the pH of extremely acidic soil, and the effect of biochar on soil improvement is weakened. Therefore, the combination of carbide slag and biochar will not only increase the pH of copper sulfide acid soil, but also further reduce its concentration of heavy metals. However, the use of carbide slag as amendment to improve acidic soil of copper sulfide mine is rarely reported. Therefore, the main content of this study is to explore the effects of carbide slag and biochar on the acidity and heavy metal toxicity of acidic soil of copper sulfide mine, and the results will provide theoretical basis for the large-scale utilization of biochar and carbide slag as acid soil amendments for copper sulfide.

2. Materials and Methods

2.1. Test Soil and Amendments

The test soil was obtained from Chengmenshan Copper Mine, Jiangxi Province, China (115°49′16″ E, 29°41′57″ N). A total of 500 kg of 14 soil samples from the top 20 cm of the unvegetated soil profile was collected by the snake sampling method (Suitable for large area, uneven terrain and uneven distribution of land, and the whole sampling area was 12.988 km2) to acquire a representative acidic soil of copper sulfide mines. The surface soil of the abandoned site contains a large number of sulfide minerals and heavy metals, and its physicochemical properties are extreme acidity (pH < 3) and high salinity (EC > 2 ds m−1). The physicochemical property of acidic soils of copper sulfide mines and amendments are shown in Table 1. Furthermore, the amendments used in this study were carbide slag and straw biochar, with the former sourced from a local cement plant, while the latter was purchased from China Resources Mengtian (Jiangsu) Environmental Remediation Co.

2.2. Soil Culture and Potting Test

The acidic soil of copper sulfide mines was dried naturally in the room, ground and sieved through the 2 mm aperture. The homogenized soil was 2 kg by dry weight in plastic pots (23.5 cm in diameter and 14 cm in height). Carbide slag and biochar are poured into the treated soil and then mixed thoroughly. The mixing ratio such as C1B1(1% (w/w) carbide slag + 5% (w/w) biochar), which represents 2000 g soil mixed with 20 g carbide slag and 100 g biochar. Additionally, a two-factor, three-level orthogonal experiment (Table 2) was performed with three replications for each treatment. The soil was thoroughly mixed with the amendment, and then the soil water content in the pots was adjusted to 70% of the field water holding capacity with deionized water. To speed up soil improvement, the soil samples mixed with amendments were maintained in a constant temperature humidity incubator (lower limit: 25 °C, upper limit: 30 °C, and humidity: 90%) for one month, and then transferred to indoor culture for the second month, during which water was added daily for loosening the soil for 60 days. At the end of the soil culture, 1.5 g of full-grained, uniformly sized perennial ryegrass seeds were sown in each pot, and then transplanted to outdoors and arranged randomly. Depending on soil moisture conditions, equal amounts of tap water were provided daily or every other day to ensure that the field water holding capacity of the potted soil was 70%, and the exuded solution was repeatedly recycled for watering. Other than that, the position of the pots was randomly adjusted every 14 days to avoid light effects on plant growth, while mature perennial ryegrass plants were harvested after 90 days, using ceramic scissors to harvest branches at 1 cm above the ground. In each pot, five subsamples of 5–10 cm depth were spooned and mixed to form a composite sample to measure soil properties.

2.3. Chemical Analysis

At the end of the experiment, each soil sample was placed in a drying oven at 105 °C for drying, and then crushed, ground, and screened for subsequent soil measurement and analysis.
Soil pH was measured in the soil/cement slurry at 1:2.5 (w/v), and soil electrical conductivity (EC) was measured in the soil/cement slurry at 1:5 (w/v) [34]. Net acid generation (NAG) of soil was determined by weighing 2.5 g of soil samples in a 500 mL conical flask, adding 250 mL of 15% H2O2, placing it in a fume hood for 24 h, boiling for 1 h to remove the remaining H2O2, cooling to room temperature and titrating to pH 7 with 0.1 mol L−1 NaOH [35].
NAG kg   t 1 = 0.1 × m × 98 2 × w
where m and w represent the weight of the sample and the molecular mass of sulfuric acid, respectively.
Soil acid neutralizing capacity (ANC) was measured by weighing 1 g of soil sample in a 50 mL triangular flask, adding 25 mL of 0.2 mol L−1 HCl, heating at 90 °C for 3 h, and cooling and titrating with 0.2 mol L−1 NaOH to pH =7 [36].
ANC kg   t 1 = 25 m × 0.2 × 98 2 × w
where m and w represent the weight of the sample and the molecular mass of sulfuric acid, respectively.
Soil sulfate ion concentration was measured by the barium sulfate turbidimetric method [37]. Weigh appropriate soil samples (passed through a 60-mesh sieve), and follow this by putting them into a polyethylene bottle, adding the corresponding water according to the soil–water ratio = 1:5, covering the bottle tightly, and shaking on a thermostatic shaker at a temperature of 20 ± 2 °C for 16 h featuring a shaking frequency of 150–200 r/min. Afterwards, filter the sample through slow-speed filter paper on a cloth funnel, collect the extract and record the volume of extract Vt. After that, pipette a certain number (Vc) of filtered specimens in a 500 mL conical flask, before adding 2 drops of methyl orange indicator solution, hydrochloric acid solution dropwise to be red and excess, and water to a total volume of 200 mL. Later, it was boiled for 5 min, and 10 mL of hot (about 80 °C) barium chloride solution was added slowly with stirring and left in a water bath at 80 °C for 2 h, followed by filtering through a crucible-type filter with a dry constant weight (M1) at (105 ± 2) °C. Furthermore, wash the precipitate with water until the filtrate is free of chloride ions (tested with silver nitrate solution). The crucible filter was dried to constant weight (M2) at (105 ± 2) °C while a blank control was made, and the difference M0 was recorded. In addition, the results were calculated according to the following equation.
0.4116 × M 2 M 1 M 0 × 10 6 × V t M s × V c
where W is the soluble sulfate content of soil, mg kg−1; M2 refers to the mass of the crucible filter and precipitate, g; M1 denotes the mass of the empty crucible filter, g; M0 indicates the mass of blank control precipitate, g; Ms represents the mass of air-dried soil weighed; 0.4116 means the conversion factor from BaSO4 to SO42−; Vt is the volume of extraction solution, mL; while Vc signifies the volume of measured liquid, mL.
Soil cation exchange capacity (CEC) was measured using the sodium acetate-flame photometric method [38]. The resultant calculation followed the following formula.
CEC = C × V t m × 23 × 1000 × 100
where CEC is the amount of soil cation exchange, cmol kg−1; C refers to the concentration of Na+ found from the working curve, mg L−1; Vt denotes the volume of the reading solution, 100 mL; 23 represents the molar mass of Na+, g mo1−1; 1000 signifies the divisor that counts mL as L; and m indicates the mass of the soil sample, g.
The total content of soil heavy metals was measured by inductively coupled plasma emission spectrometry. The soil passed through the 40-mesh sieve and was put into sample bottles for spare. Afterwards, 105 °C drying was performed to reach constant weight, followed by weighing 0.4 g of the sample to be measured in the digestion tube, adding 5 mL 98% H2SO4 and 2 mL 70% HCIO4 in the 360 °C digestion apparatus for 1 h and deionized water set to 100 mL, weighing 0.2 g of the dried plant specimen in a conical flask, and adding 5 mL nitric acid and 1 mL of perchloric acid before being placed on a graphite digestion apparatus at 200 °C until the solution in the conical flask became colorless and transparent (this process lasts for about 2–3 h, during which hydrogen peroxide can be added dropwise). Later, they were poured into a 50 mL volumetric flask and fixed to the scale with distilled water. Finally, it was determined with inductively coupled plasma emission spectrometer ICP-OES (Optima 5300DV, PerkinElmer, Shelton, CT, USA).
The BCF (bio-concentration factor) and the TF (transfer factor) of ryegrass are shown in the following equation.
BCF = C root C soil ;
TF = C shoot C root
where Croot is the concentration of heavy metals in the roots of ryegrass, g kg−1; Csoil is the concentration of heavy metals in soil; Cshoot refers to the concentration of heavy metals in the shoots of ryegrass, g kg−1.
As a cumulative bioindicator plant with high accumulation and tolerance to toxic substances such as heavy metals Cu, Zn, Cr and Pb, ryegrass is often used to monitor the accumulation of trace elements in the organism and is a tool for assessing the bio-effectiveness of heavy metals [30]. Therefore, in this study, heavy metal concentrations in ryegrass were taken as an indicator of soil heavy metal bio-effectiveness. Beyond that, soil BCF was defined as the ratio of plant-branch heavy metal concentration to inter-root soil heavy metal concentration, and TF was defined as the ratio of plant above-ground part heavy metal concentration to root heavy metal concentration (as shown in the equation). The ability of heavy metals to migrate in plants is expressed by BCF and TF values as indicators to evaluate the toxicity of heavy metals and the amount of heavy metal migration from soil to plants. The larger the value, the easier it is for plants to migrate heavy metals from soil to roots, from roots to stems and from soil to stems.
The effective state heavy metal concentrations were determined by DTPA-leaching inductively coupled plasma emission spectrometry. To be specific, 1.967 g DTPA (diethylenetriamine pentaacetic acid, analytically pure) was weighed into a 1 L volumetric flask, while 14.992 g of TEA (triethanolamine) was added, dissolved with deionized water and diluted to 950 mL. Additionally, 1.47 g of CaCl2 2H2O was added to dissolve it, and the pH was adjusted to 7.30 with 6 mol/L of HCL. Finally, the extract was diluted with deionized water. The DTPA extract was prepared by fixing the volume with deionized water. The sample was weighed into a 100 mL test tube, while 50 mL of DTPA reagents were added, shaken at 25 °C for 2 h and filtered, followed by the contents of available elements in the extract were determined directly by ICP-OES (Optima 5300DV, PerkinElmer, Shelton, Connecticut, USA). Moreover, the content W (mg kg−1) of each available state element in the soil samples was calculated according to the following equation.
W = ρ ρ 0 × V × f m × W dm
where W is the concentration of the available element in the soil sample, mg kg−1; ρ refers to the mass concentration of the available element in the measured sample from the standard curve, mg L−1; ρ0 denotes the mass concentration of the available element in the laboratory blank sample, mg L−1; V represents the volume of leaching solution added to the sample preparation, mL; f signifies the dilution of the sample; m means the mass of the sample after weighing and sieving, g; Wdm indicates the dry matter content of the soil sample, %.

2.4. Statistical Analysis Methods

Excel was used for data preprocessing, and the means and standard deviations of the data were calculated by SPSS version 23.0 (SPSS, Version 23.0, Armonk, NY, USA: IBM Corp.). In addition, the significance of the data at the 0.05 level was tested by two-way ANOVA (analysis of variance), whereas Origin 2021 was employed for graphing and correlation analysis.

3. Results

3.1. Properties Possessed by Acidic Soil of Copper Sulfide Mines and Amendments

Acidic soil of copper sulfide mines (S) has the extremely low pH and contains a variety of heavy metals (such as Cu, Zn, Pb, etc.). Its heavy metal content exceeded the local soil background value, and the total Cu, Zn and Pb content was far more than the Chinese agricultural land risk screening value (Cu ≤ 50 mg kg−1, Zn ≤ 200 mg kg−1, Pb ≤ 70 mg kg−1, Ministry of Ecology and Environment of China, GB15618-2018). Additionally, the pH of the amendment carbide slag (C) and biochar (B) was considerably higher than that of the untreated soil, and the addition of the amendment did not lead to an increase in total heavy metals in the untreated soil because the total heavy metals were noticeably lower than those in the acidic soil of copper sulfide mines (CuTotal = 2233.5 mg kg−1, ZnTotal = 2367.8 mg kg−1, PbTotal = 2736.7 mg kg−1). Apart from that, the total organic carbon (TOC) content of biochar was higher than that of the untreated soil, which could provide organic matter for the mine soil to a certain extent.

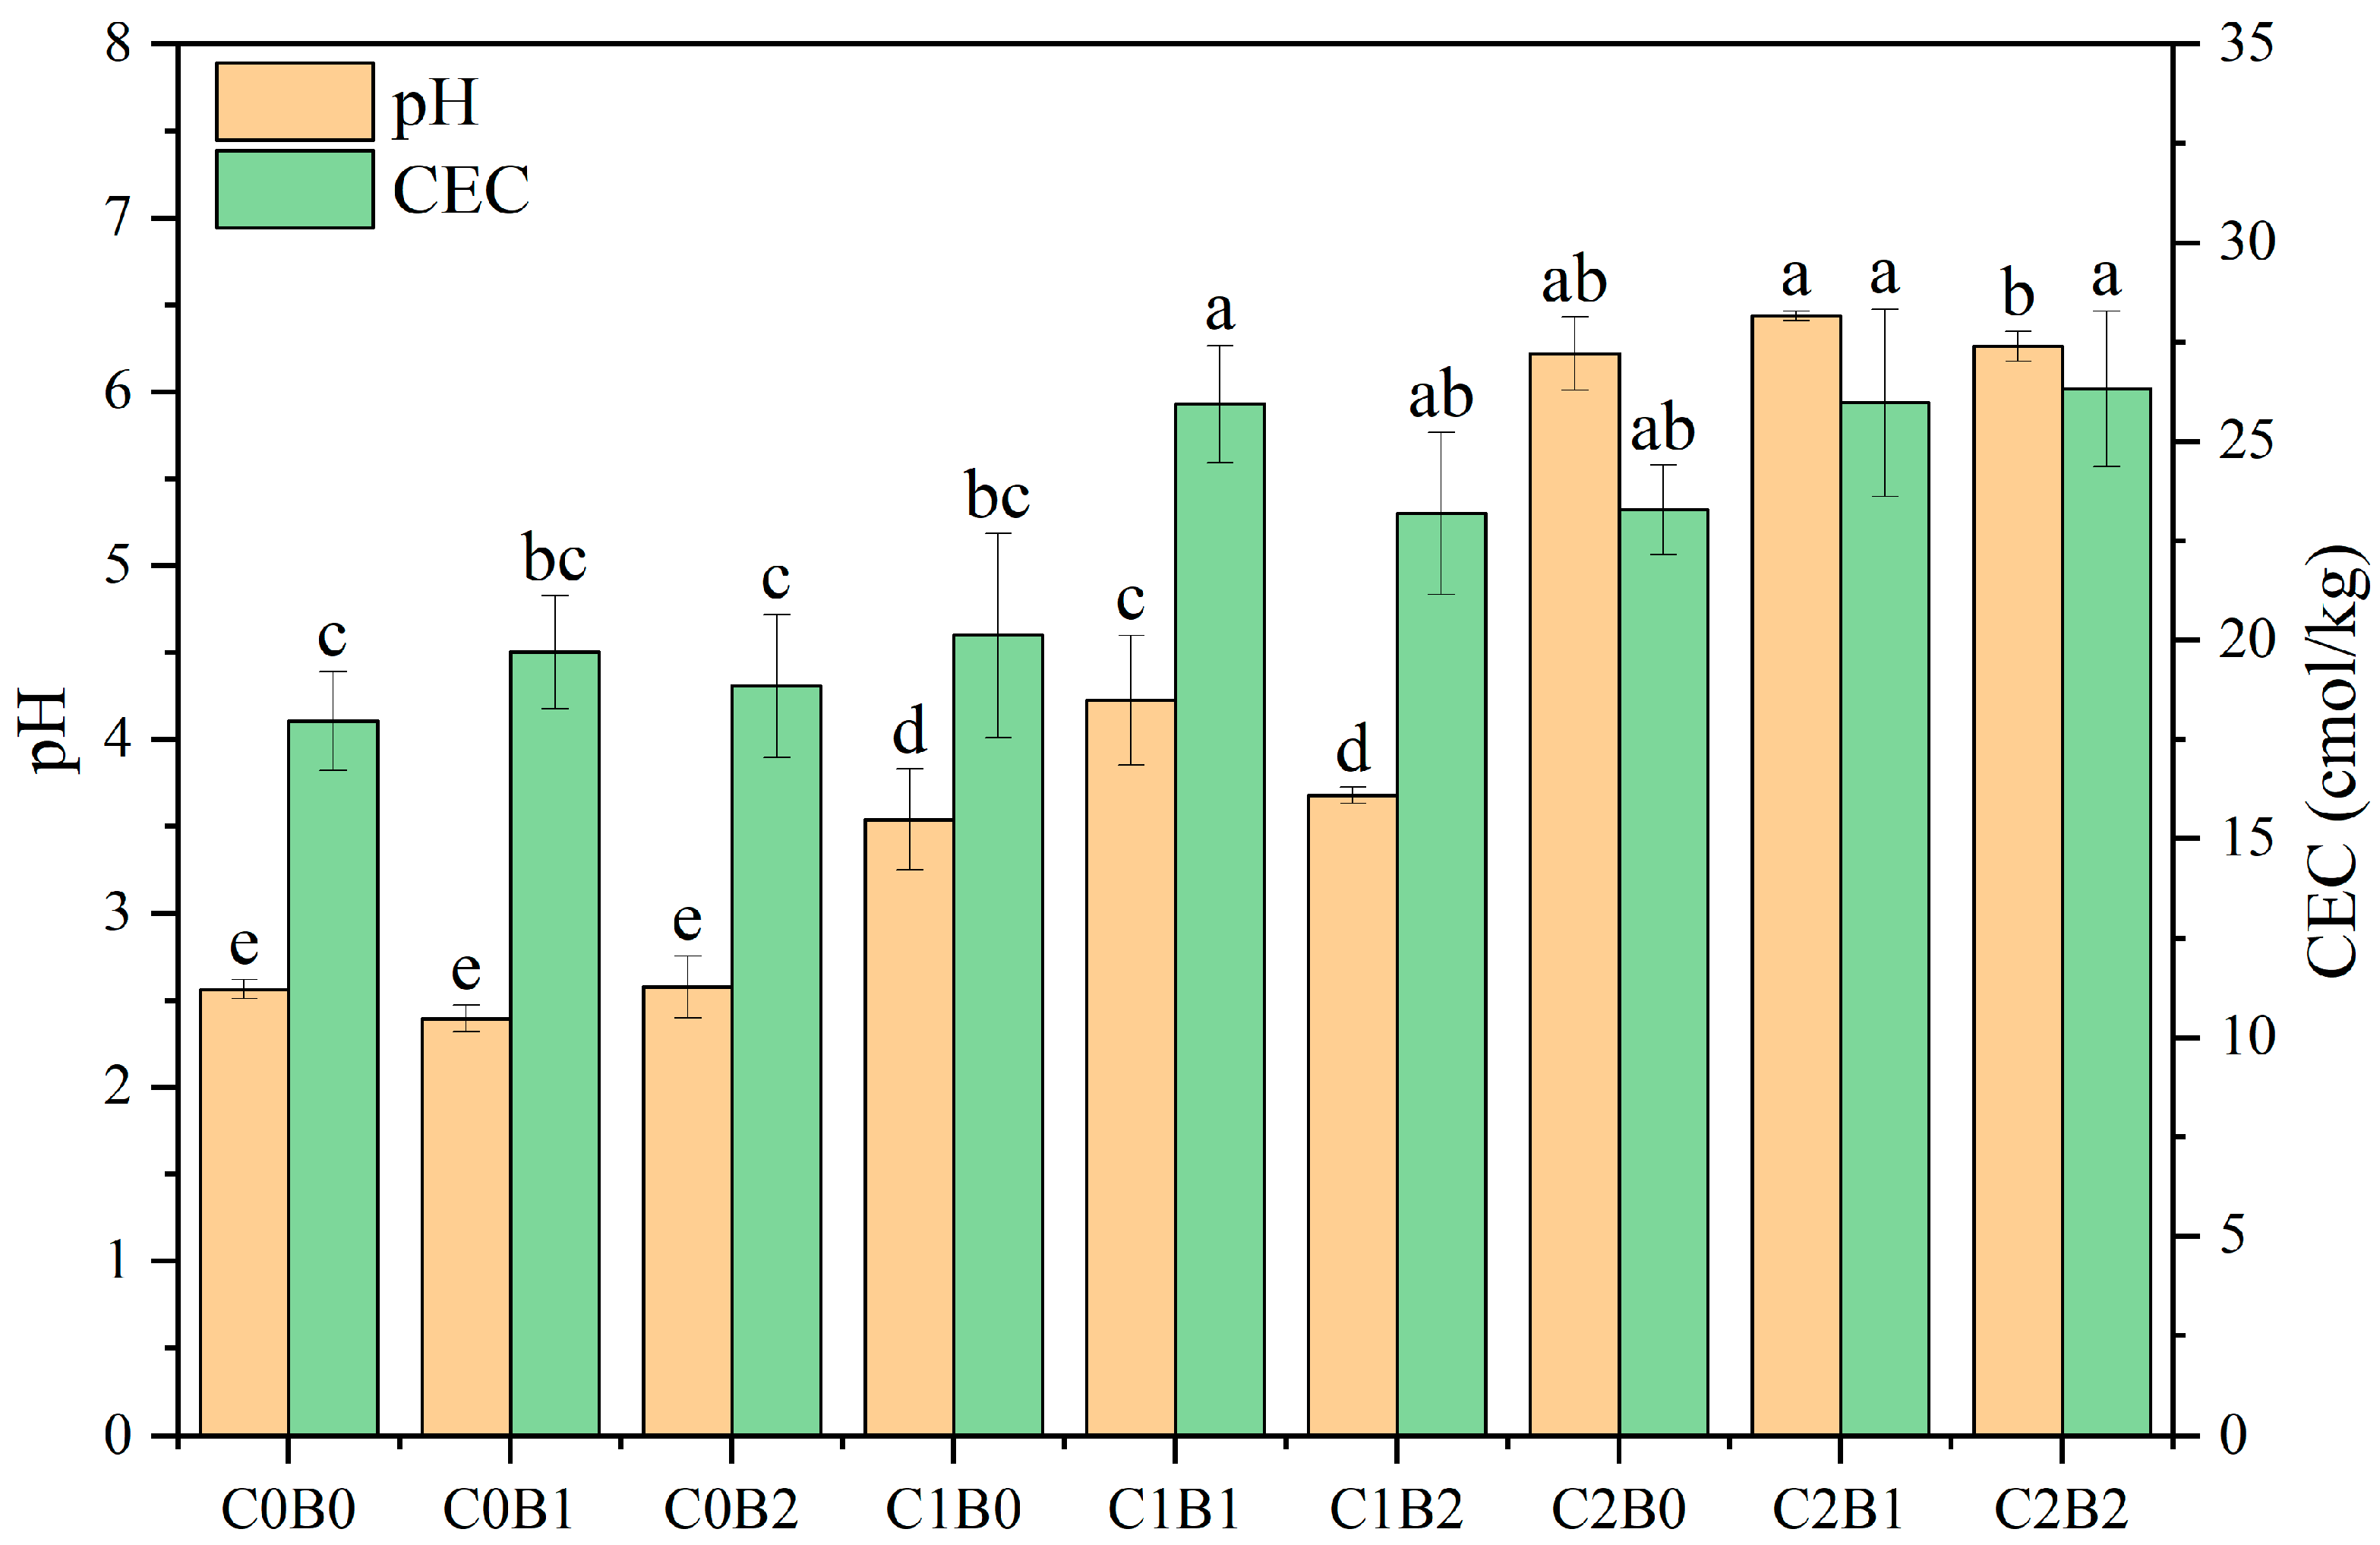
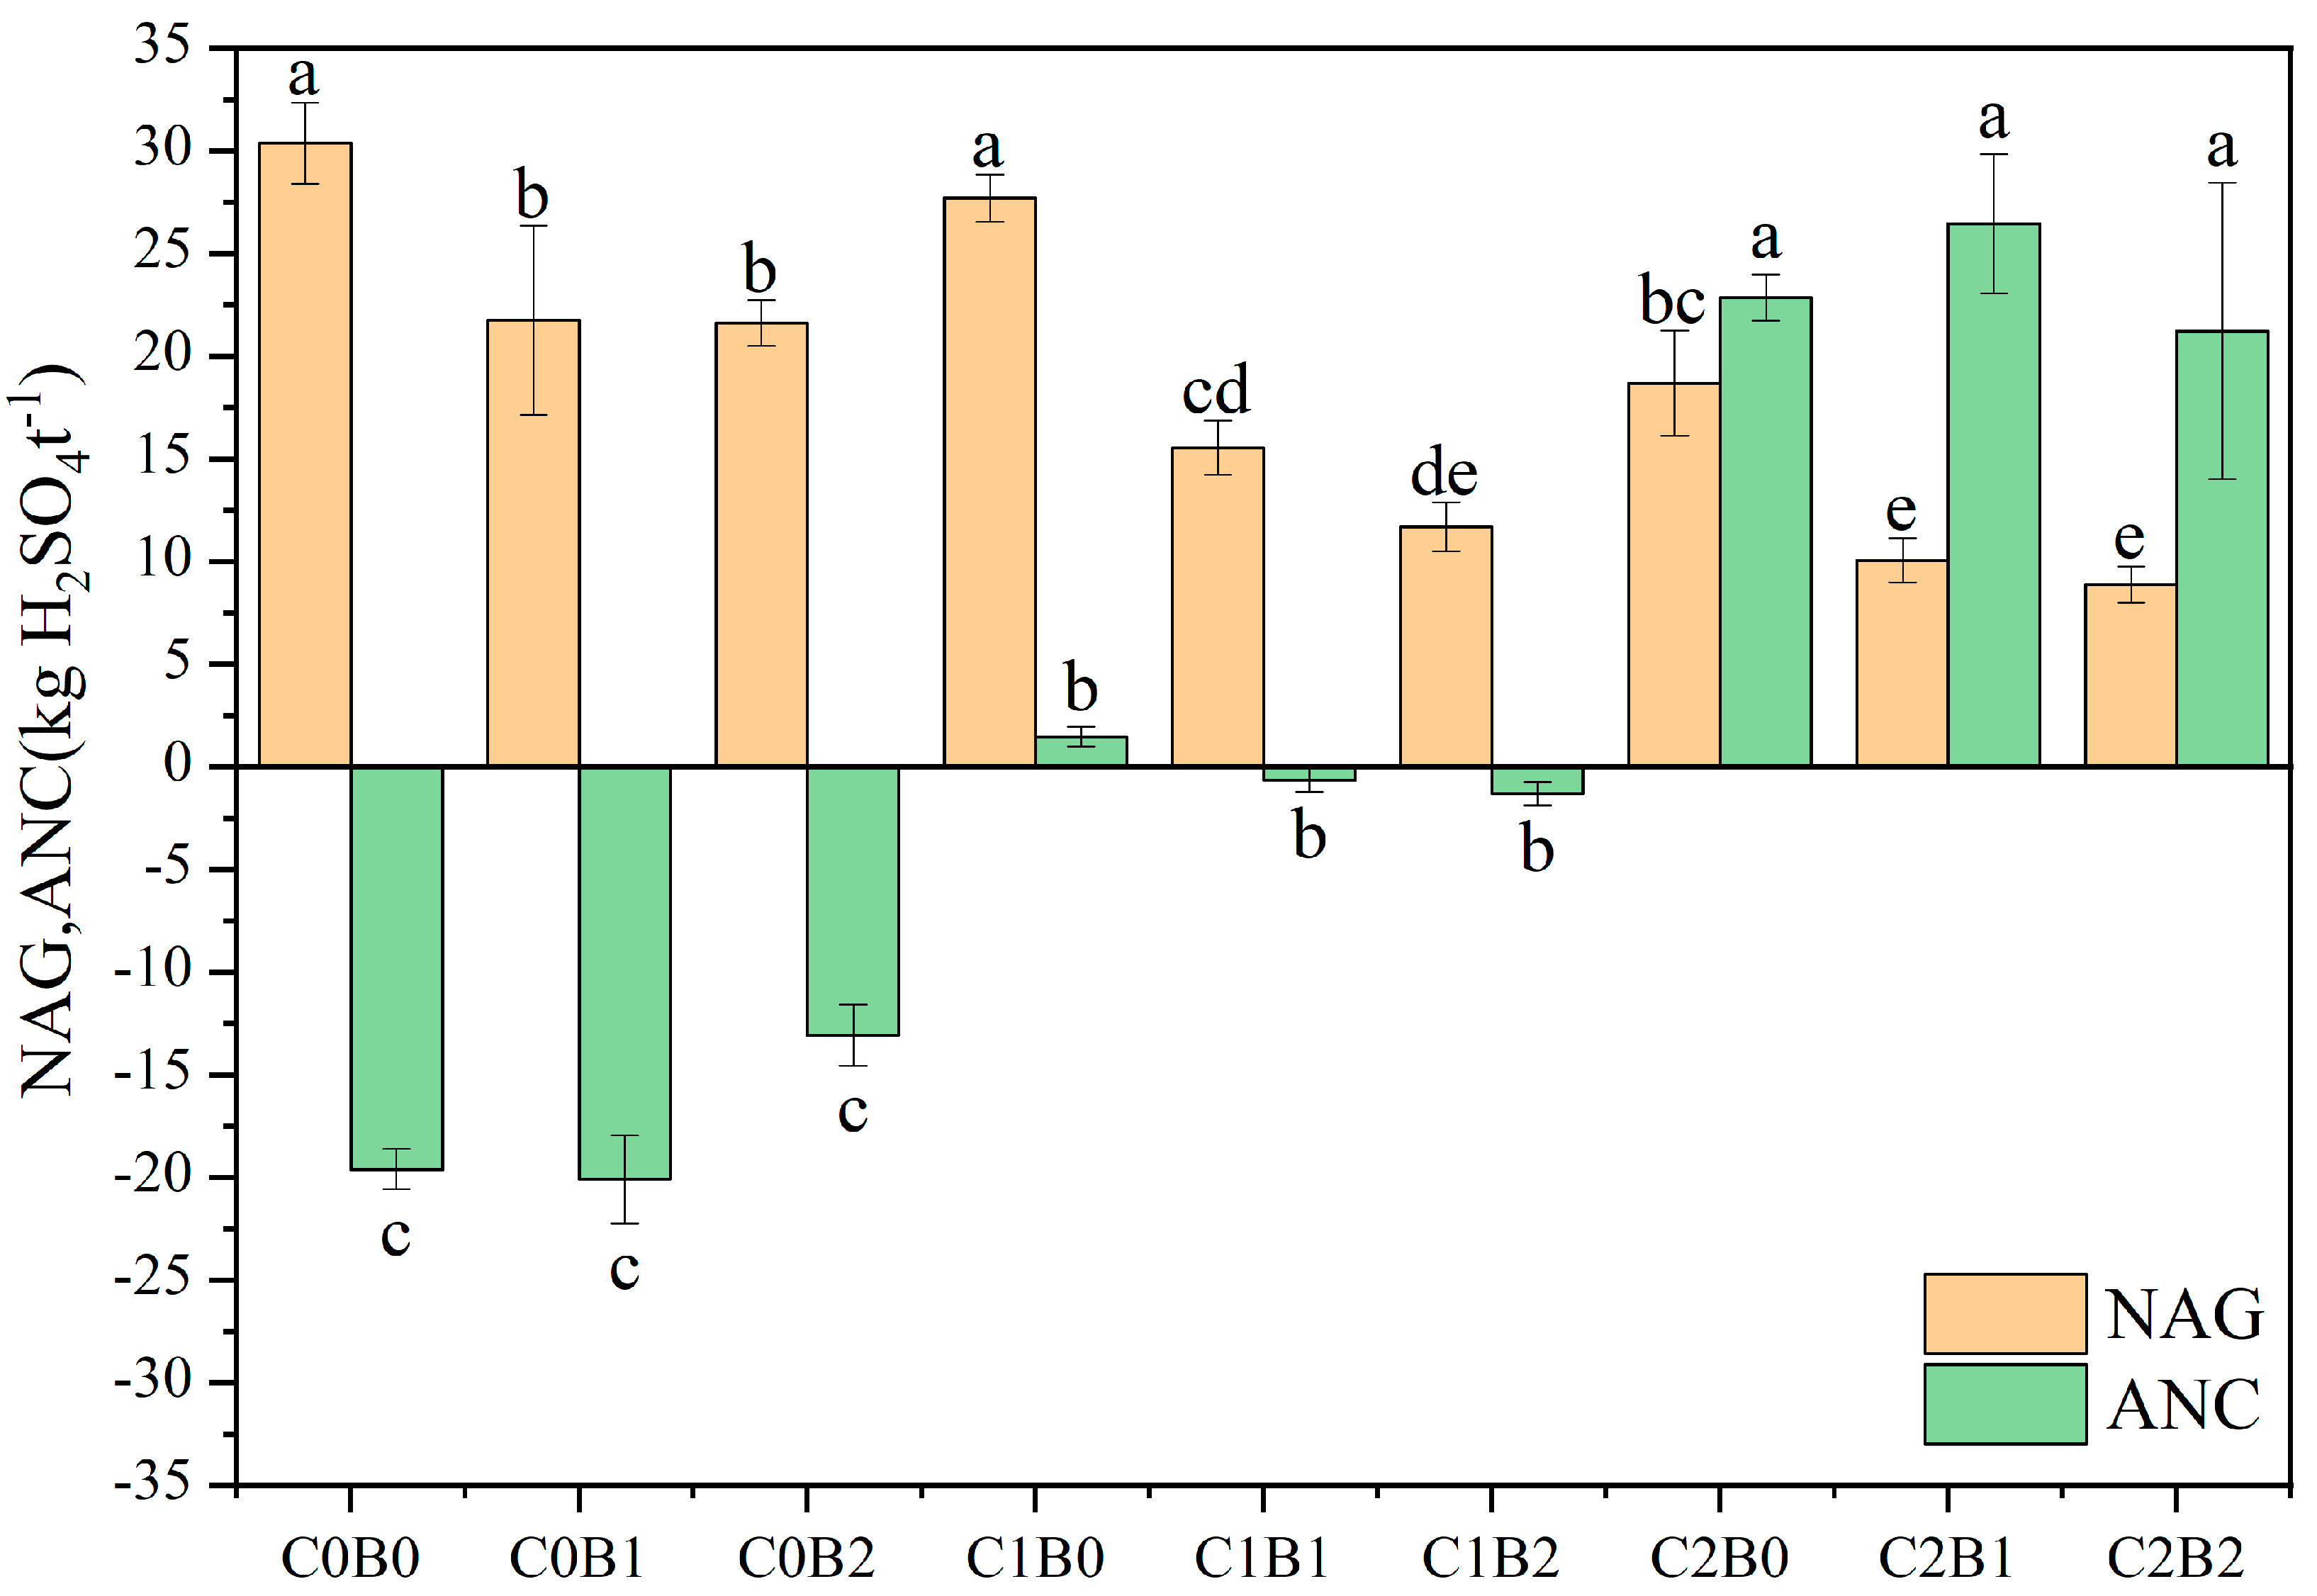
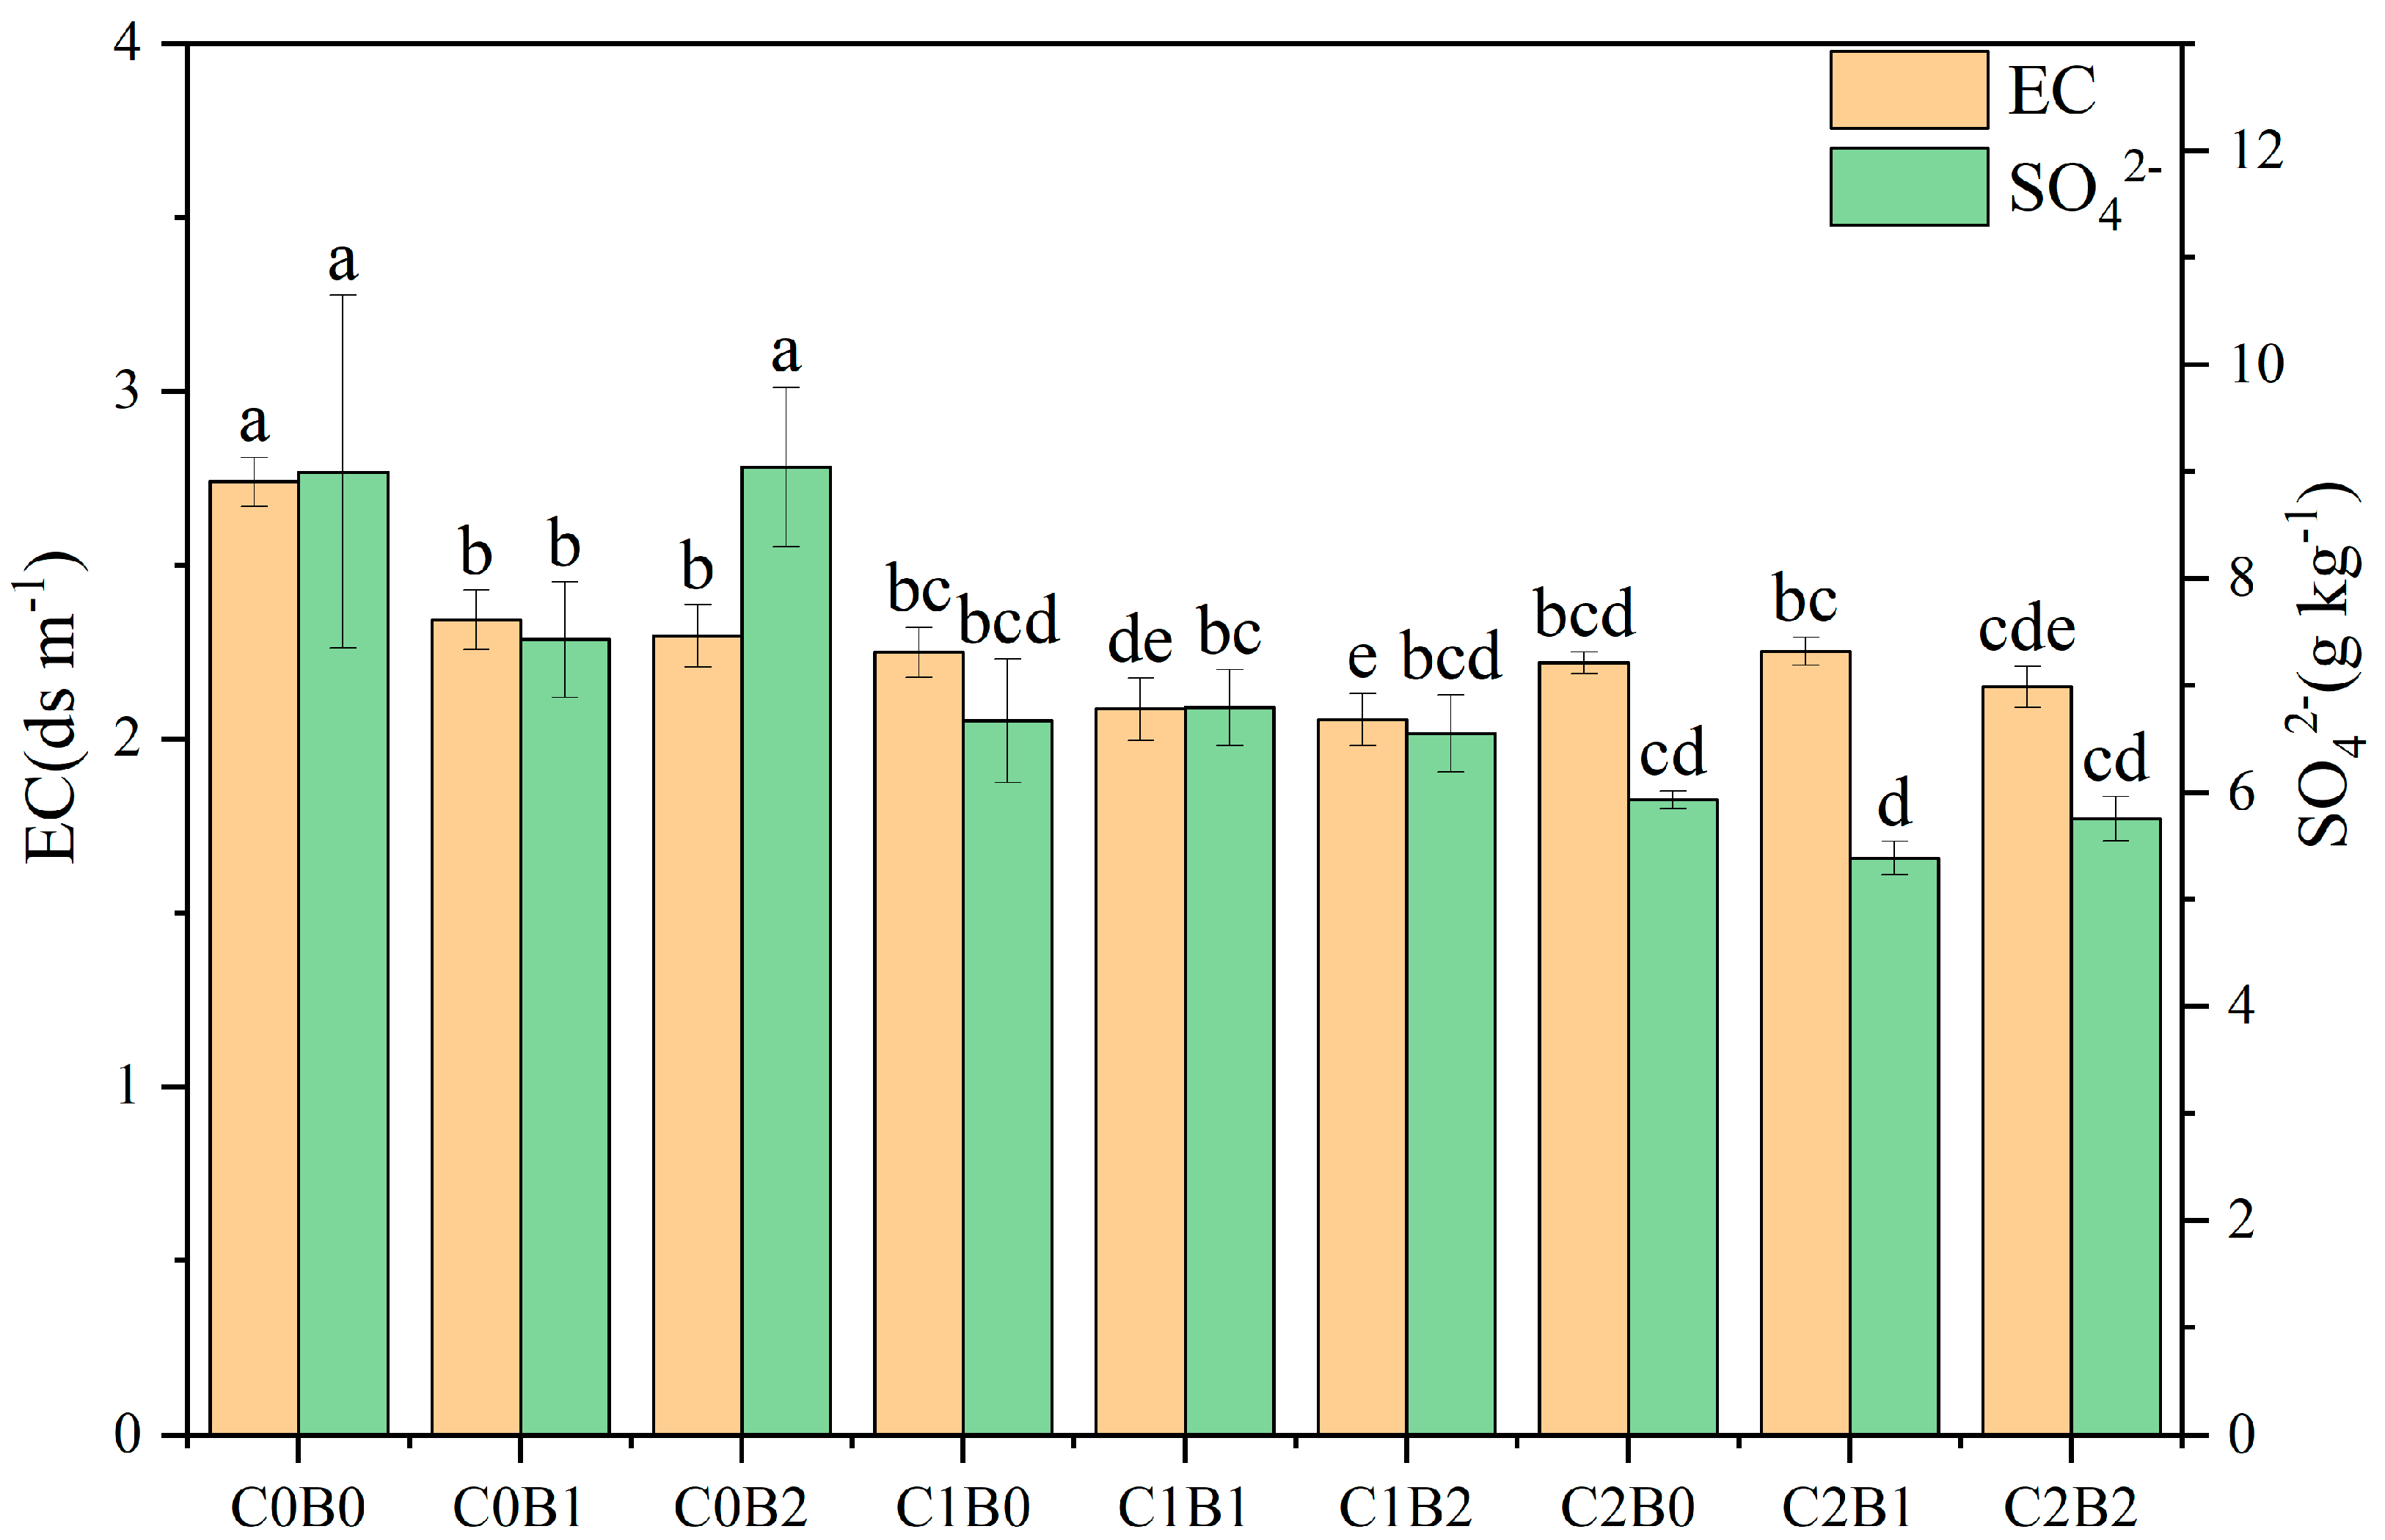
3.2. Changes in Physicochemical Properties Possessed by Acidic Soil of Copper Sulfide Mines

As shown in the Figure 1, compared to C0B0 (0 (w/w) carbide slag + 0 (w/w) biochar) treatment, carbide slag single application (C1B0 (1% (w/w) carbide slag + 0 (w/w) biochar), C2B0 (2% (w/w) carbide slag + 0 (w/w) biochar)) and combination of biochar and carbide slag (C1B1 (1% (w/w) carbide slag + 5% (w/w) biochar), C1B2 (1% (w/w) carbide slag + 10% (w/w) biochar), C2B1 (2% (w/w) carbide slag + 5% (w/w) biochar), C2B2 (2% (w/w) carbide slag + 10% (w/w) biochar)) significantly increased untreated soil pH by 38% to 142% and 44% to 151%, respectively. Under the treatment of carbide slag single application, soil pH tended to increase with increasing application rate, and the difference between treatments was observable (p < 0.05). In contrast, the increase in application rate did not increase the untreated soil pH under biochar single application (C0B1 (0 (w/w) carbide slag + 5% (w/w) biochar), C0B2 (0 (w/w) carbide slag + 10% (w/w) biochar)), and the difference between treatments was not significant (p > 0.05). Furthermore, the difference of soil pH among treatments C2B0 (2% (w/w) carbide slag + 0 (w/w) biochar), C2B1 (2% (w/w) carbide slag + 5% (w/w) biochar) and C2B2 (2% (w/w) carbide slag + 10% (w/w) biochar) was unobvious, indicating that biochar had no significant effect on raising the pH of the acidic soil of copper sulfide mines, and the amount of carbide slag at 2% (w/w) already achieved the purpose of improving soil pH.
Compared with the control, the CEC content of the acidic soil (Figure 1) of copper sulfide mines was increased by 12–30%, 5–10% and 29–47% with carbide slag single application (C1B0, C2B0), biochar single application (C0B1, C0B2) and the combination of carbide slag and biochar, respectively (C1B1, C1B2, C2B1, C2B2). Additionally, soil CEC content increased with increasing application rate in the treatments of carbide slag (C1B0, C2B0) and biochar (C0B1, C0B2) single application, but the difference between biochar treatments was not significant (p > 0.05). Soil CEC content was not dramatically different between the treatment groups of carbide slag and biochar combination (p > 0.05), but the difference in soil CEC content was obvious (p < 0.05) compared with the treatment groups of carbide slag and biochar single application. Furthermore, two-factor ANOVA demonstrated that carbide slag had a highly significant effect (p < 0.01) on pH and CEC content of acidic soil in copper sulfide mines, while biochar had no significant effect (p > 0.05) on pH and CEC content of acidic soil in copper sulfide mines, and there was no interaction (p > 0.05) between the two on soil pH and CEC content. In addition to that, correlation analysis showed that soil pH was positively correlated with CEC content.
The net acid production potential (NAG) of the blank treatment group C0B0 (0 carbide slag (w/w) + 0 biochar (w/w)) was 30.38 kg H2SO4 t−1, which means that the mine could produce 30.38 kg sulfuric acid per ton of topsoil after complete oxidation, and the acid neutralization capacity (ANC) was 19.6 kg H2SO4 t−1 (Figure 2). It can be seen that carbide slag and biochar have different effects on NAG and ANC of copper sulfide acid soil by single application and combined application. Under the treatment of carbide slag, biochar single application, the soil NAG gradually decreased with the increase in application rate, and the decrease ranged from 9% to 71%. Soil NAG reached a minimum value of 8.89 kg H2SO4 t−1 in treatment group C2B2 (2% carbide slag (w/w) + 10% biochar (w/w)); soil ANC gradually increased with increasing application rate, when the increase varied from 33% to 216%, and reached a maximum value of 26.46 kg H2SO4 t−1 in treatment group C2B1 (2% carbide slag (w/w) + 5% biochar (w/w)) H2SO4 t−1. It is noteworthy that soil ANC values started to be greater than NAG values when the amount of carbide slag was greater than 1% (w/w). Other than that, two-factor ANOVA showed that carbide slag had an extremely significant (p < 0.01) effect on NAG and ANC in acidic copper sulfide soil, while biochar had a significant (p < 0.05) effect on NAG in copper sulfide acid soil, but no significant (p > 0.05) effect on ANC of soil. Moreover, there was interaction (p < 0.05) between them on soil NAG, but not on soil ANC. Additionally, correlation analysis revealed that soil NAG was negatively related to ANC.
Compared with the blank control C0B0 (0 carbide slag (w/w) + 0 biochar (w/w)), carbide slag and biochar single application and combination significantly (p < 0.05) reduced the EC and sulfate concentration in acidic soil of copper sulfide mines as the amount of amendment applied increased (Figure 3). Soil EC decreased from 14% to 25%, featuring the lowest as treatment group C1B2 (1% carbide slag (w/w) + 10% biochar (w/w)) with an EC value of 2.06 ds m−1; SO42− concentration decreased from 17% to 40%, featuring the lowest as treatment group C2B1 (2% carbide slag (w/w) + 5% biochar (w/w)) with an SO42− concentration of 5.39 g kg−1. Additionally, a two-way ANOVA showed that there was a highly significant effect of carbide slag on EC and SO42− concentration, and an extremely obvious effect of biochar on EC in acidic soil of copper sulfide mines, but no significant effect of biochar on SO42− concentration in soil. Furthermore, an interaction existed between carbide slag and biochar on soil EC (p < 0.05), but not on soil SO42− concentration (p > 0.05). In addition, correlation analysis demonstrated that soil EC was positively correlated with SO42− concentration.

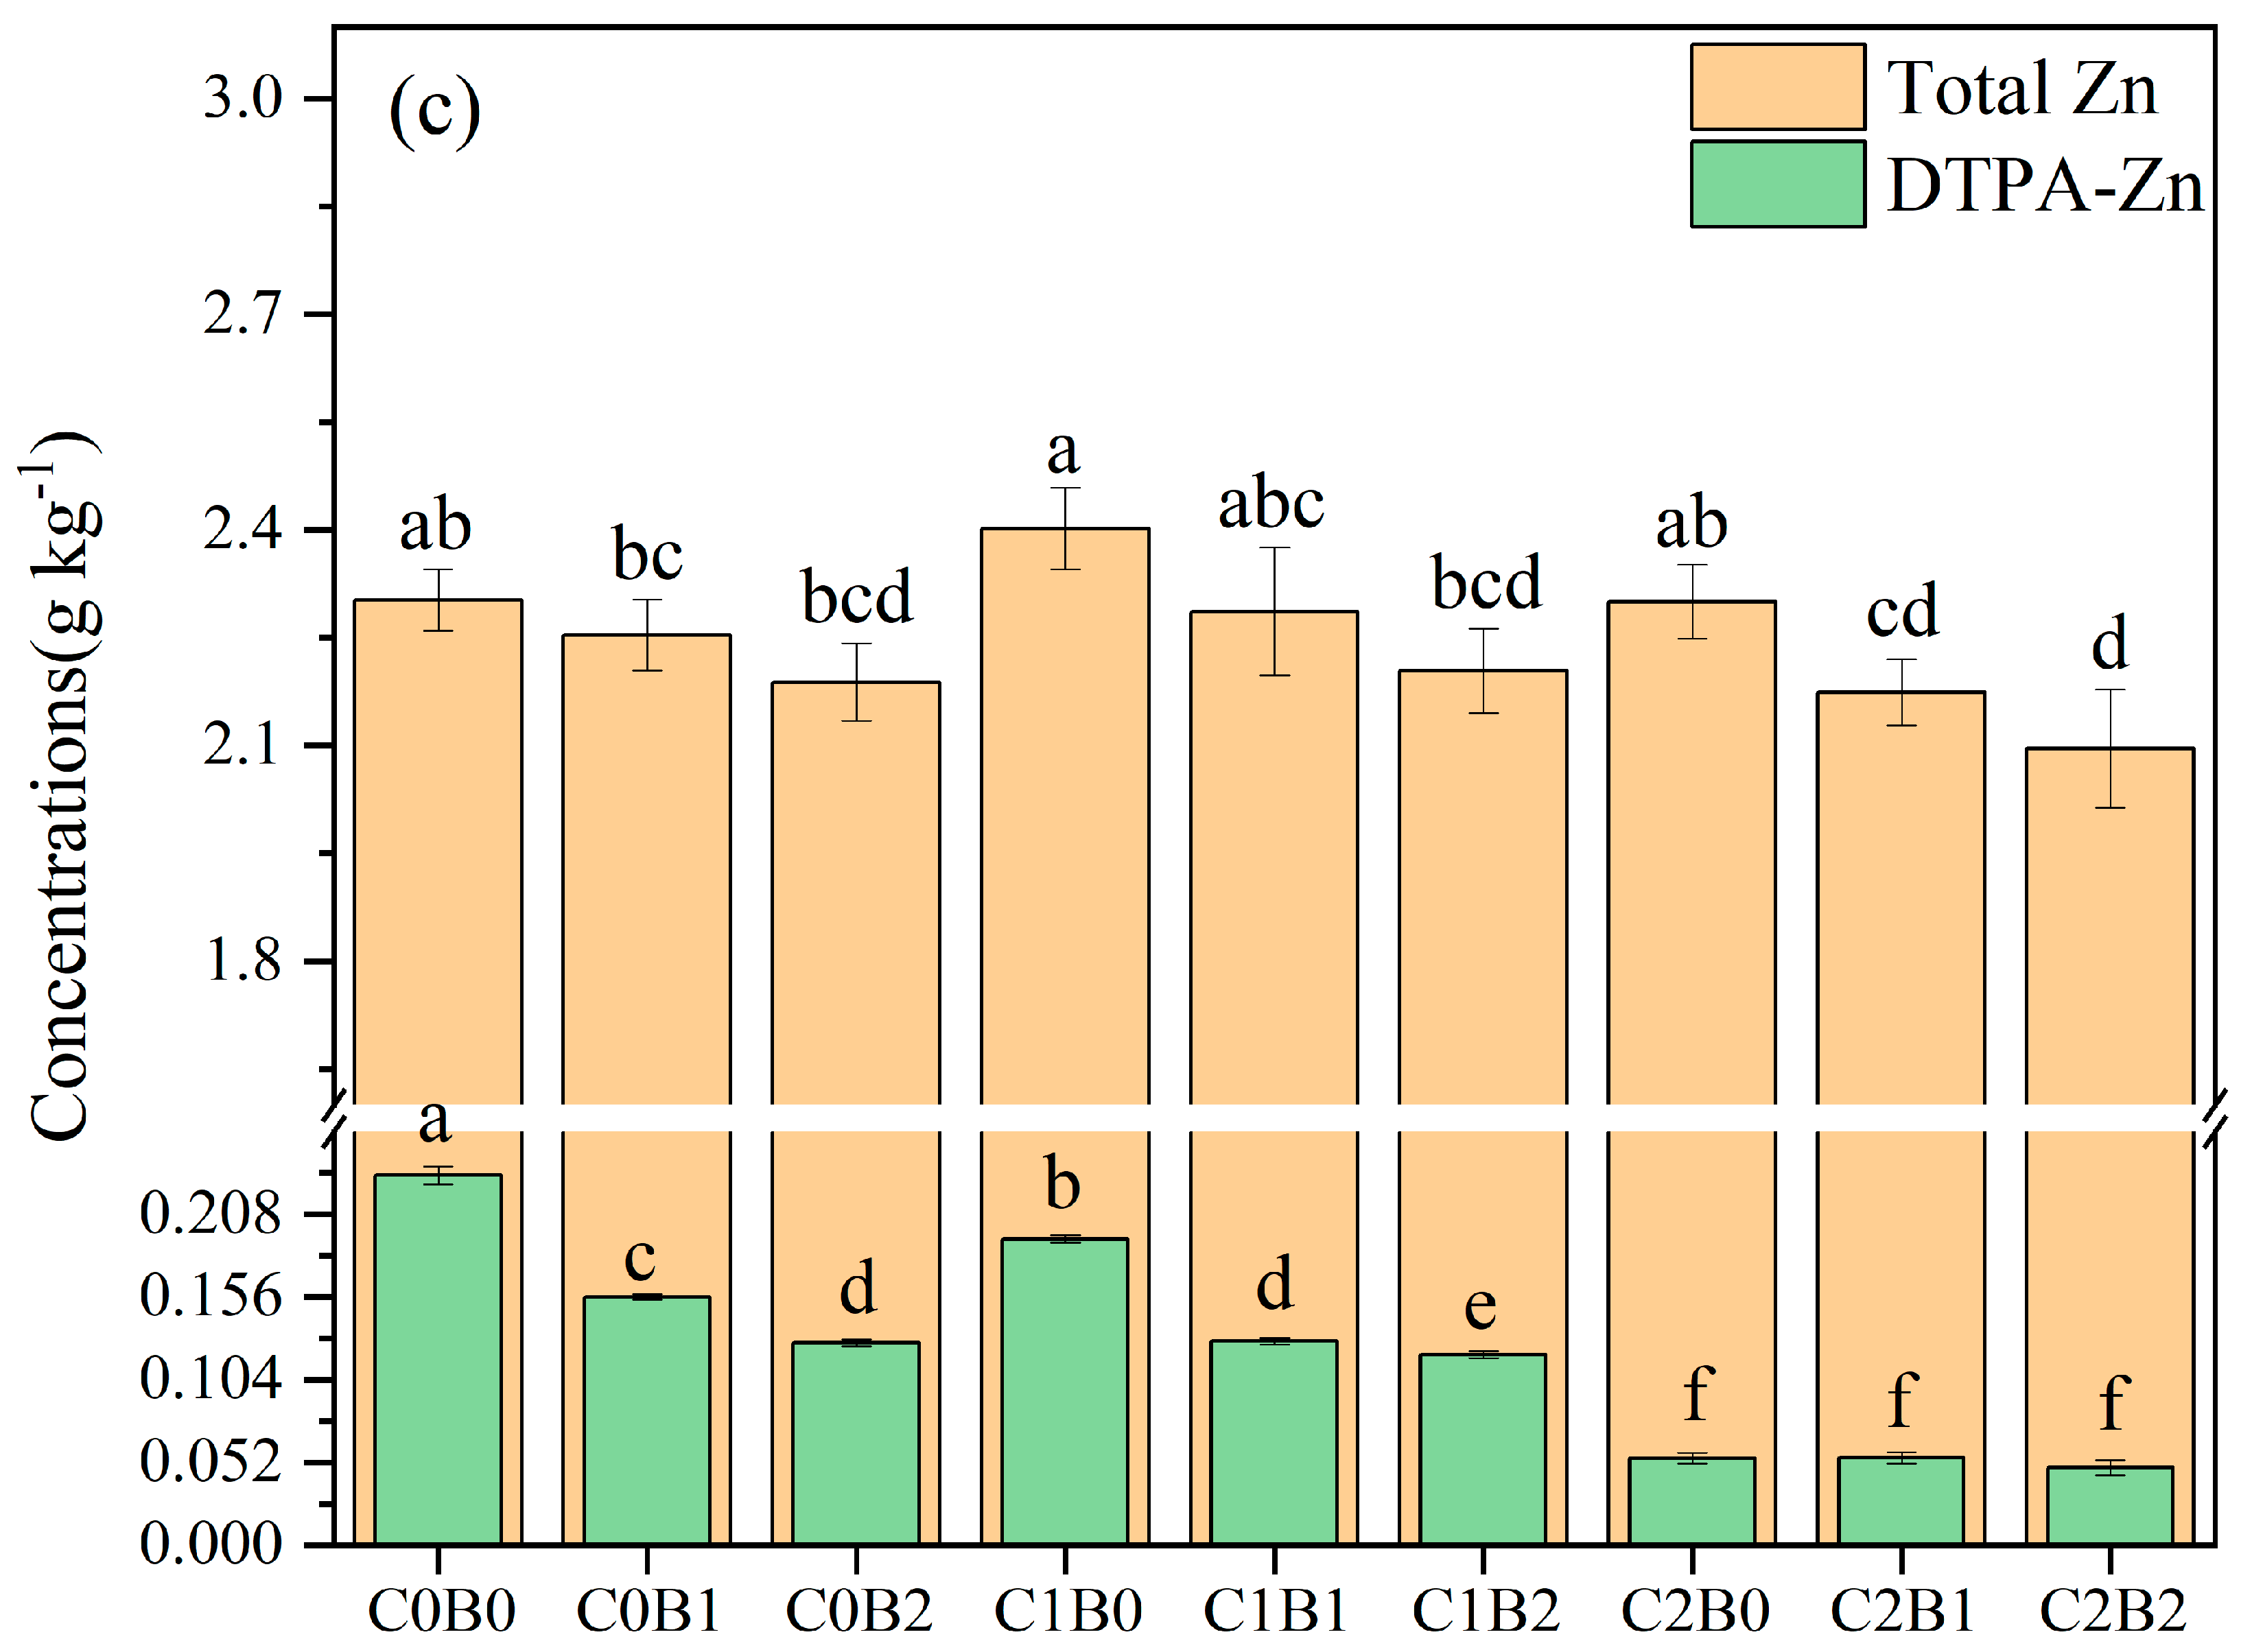
3.3. Changes in Heavy Metal Concentrations in Acidic Soils of Copper Sulfide Mines

Before addition of amendments, the concentrations of Cu, Pb, Zn and DTPA-extracted heavy metals in acidic copper sulfide soil were very high, and the percentage of DPTA-Cu, Pb and Zn in the total amount was up to 9.4%, 6.1% and 5.5%, respectively, indicating high toxicity of heavy metals in soil. Compared with the control C0B0 (0 carbide slag (w/w) + 0 biochar (w/w)) treatment group, the total content of heavy metals Cu, Pb and Zn in the acidic soil of copper sulfide mines remained approximately constant with little overall change (Figure 4). However, at a constant amount of carbide slag application, the total content of heavy metals showed a weak decreasing trend with the increase in biochar dosages, which may be due to the dilution of the total heavy metals by the added improver. Apart from that, biochar single application, carbide slag and biochar combined application obviously (p < 0.05) reduced heavy metal concentrations in the DPTA-extracted state, when 8–80%, 7–76% and 17–79% were for DPTA-Cu, -Pb, and -Zn, accordingly. Beyond that, the treatment group with the highest reduction in DPTA-Cu, -Pb and -Zn was C2B2 (2% carbide slag (w/w) + 10% biochar (w/w)). Moreover, the two-way ANOVA revealed that both carbide slag and biochar had significant effects on the DTPA-extracted heavy metal content in the acidic soil of copper sulfide mines, and there was an interaction between them (p < 0.05).

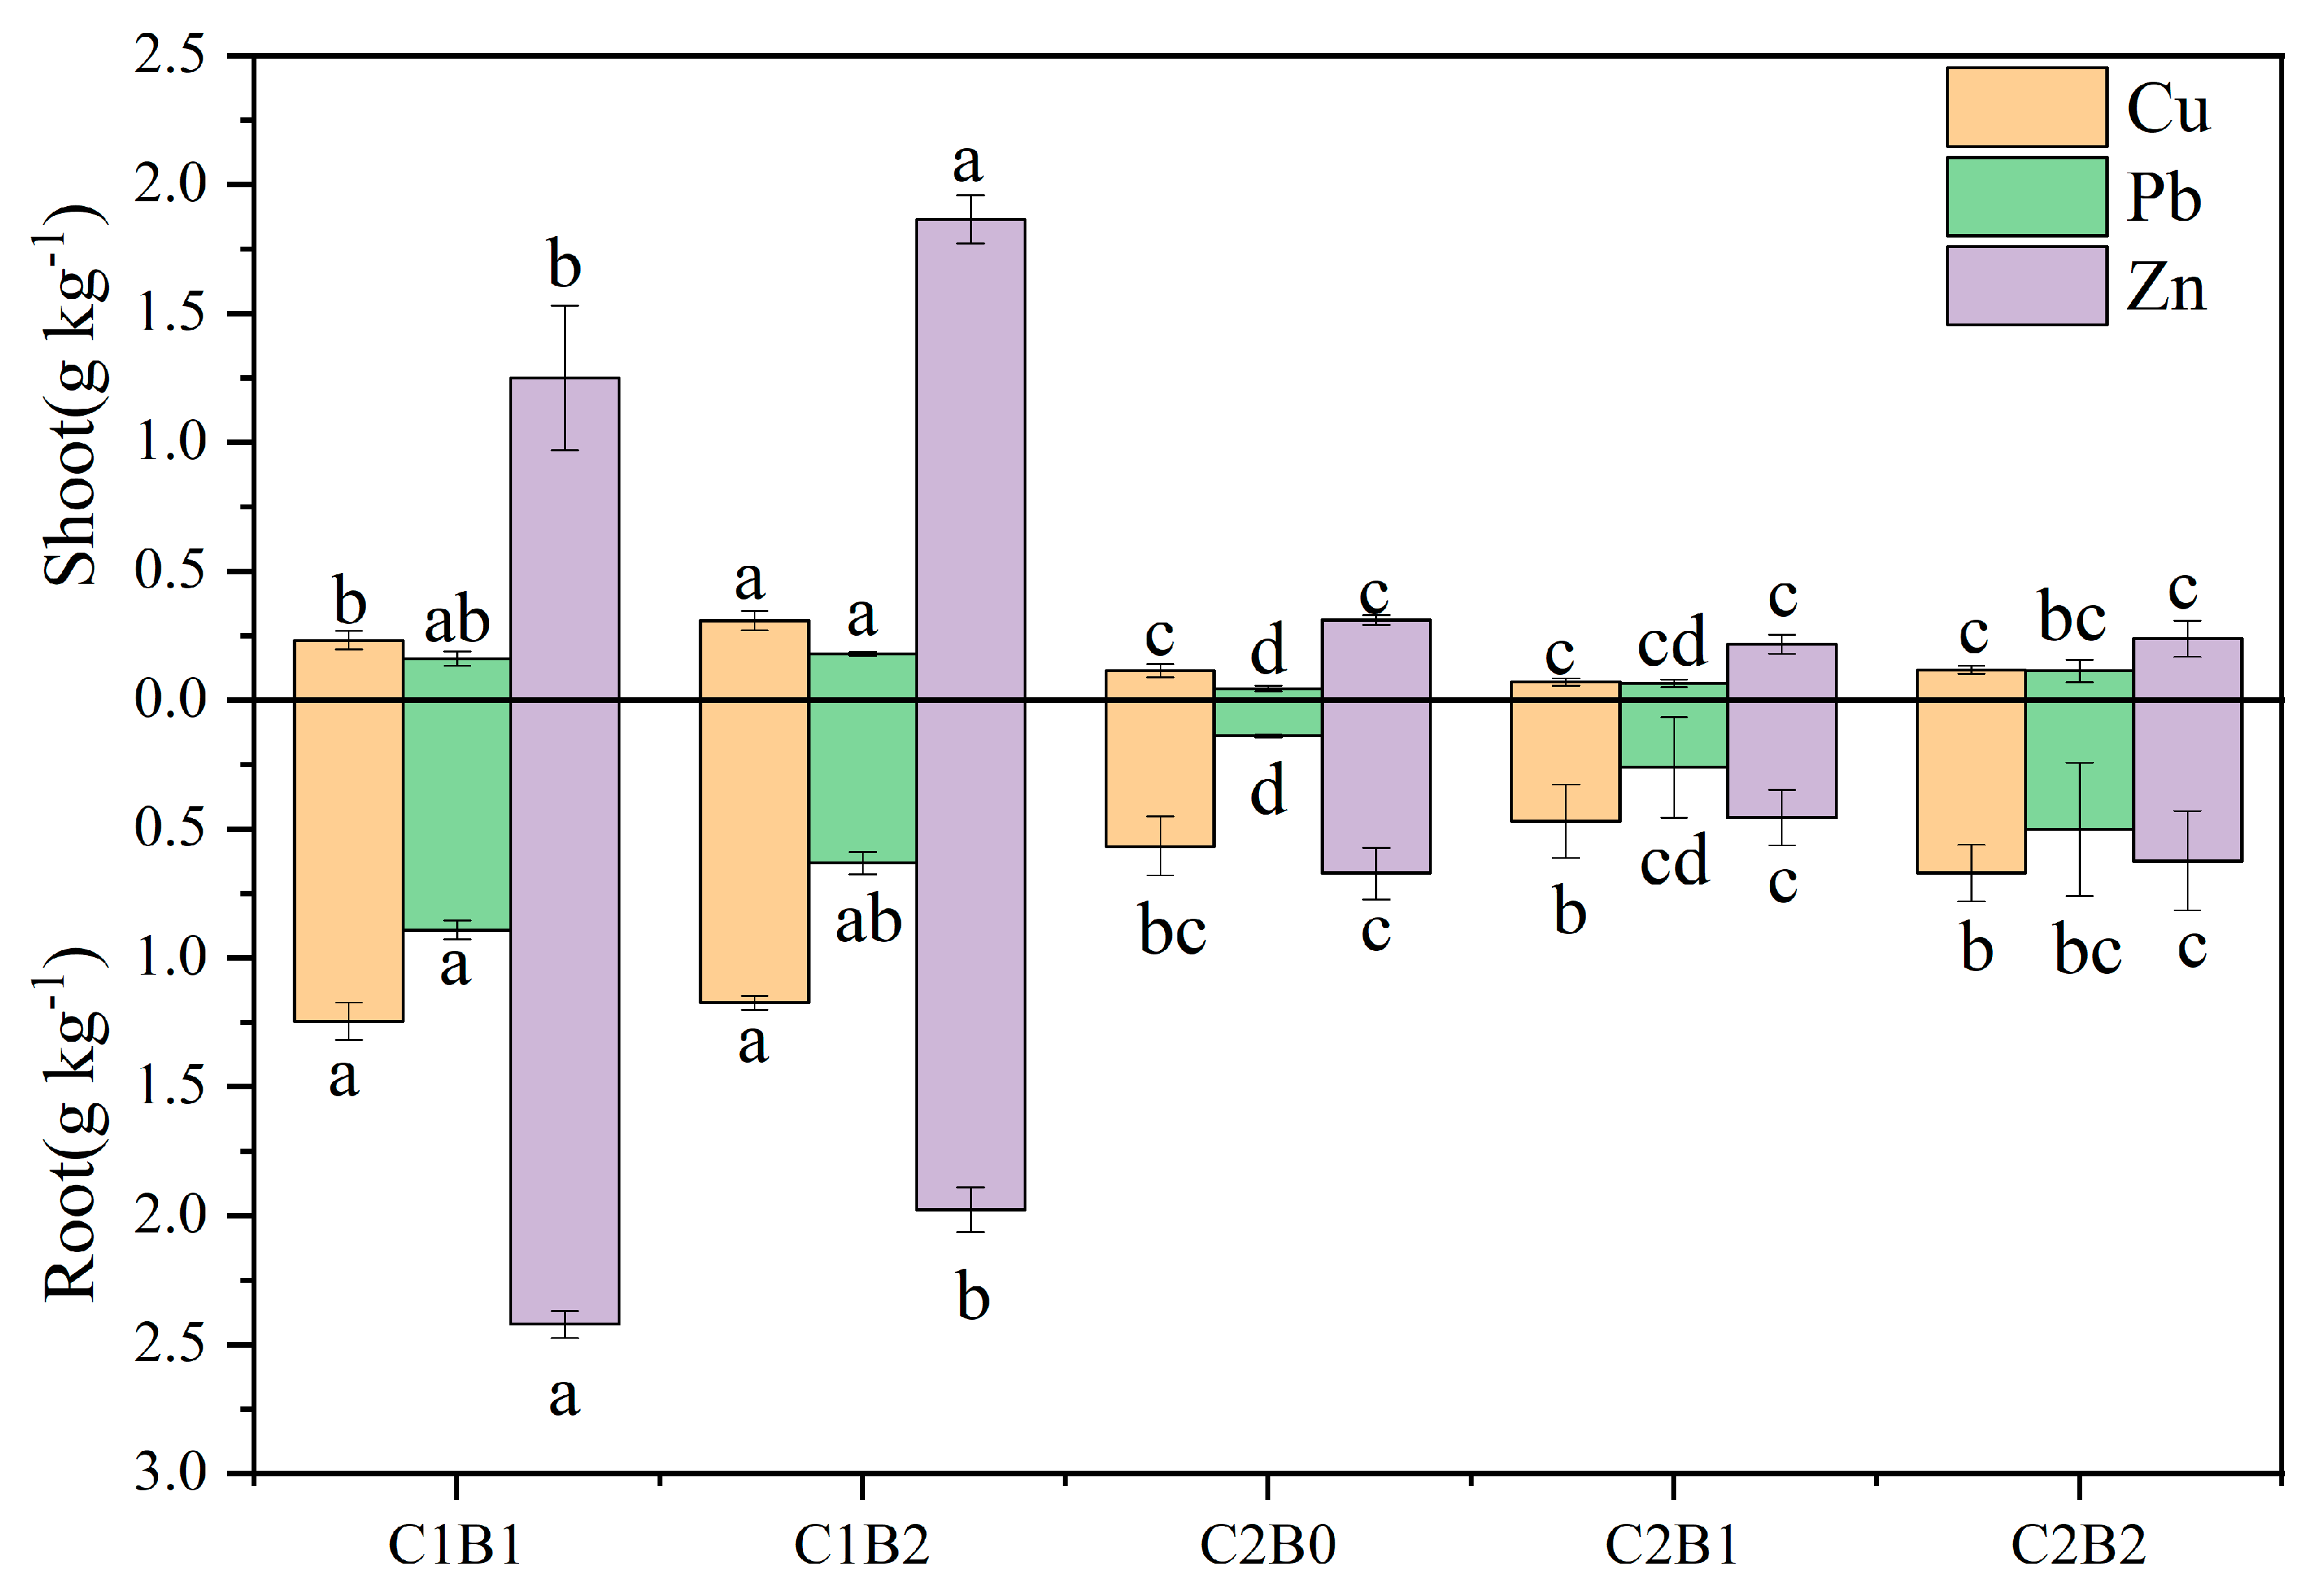
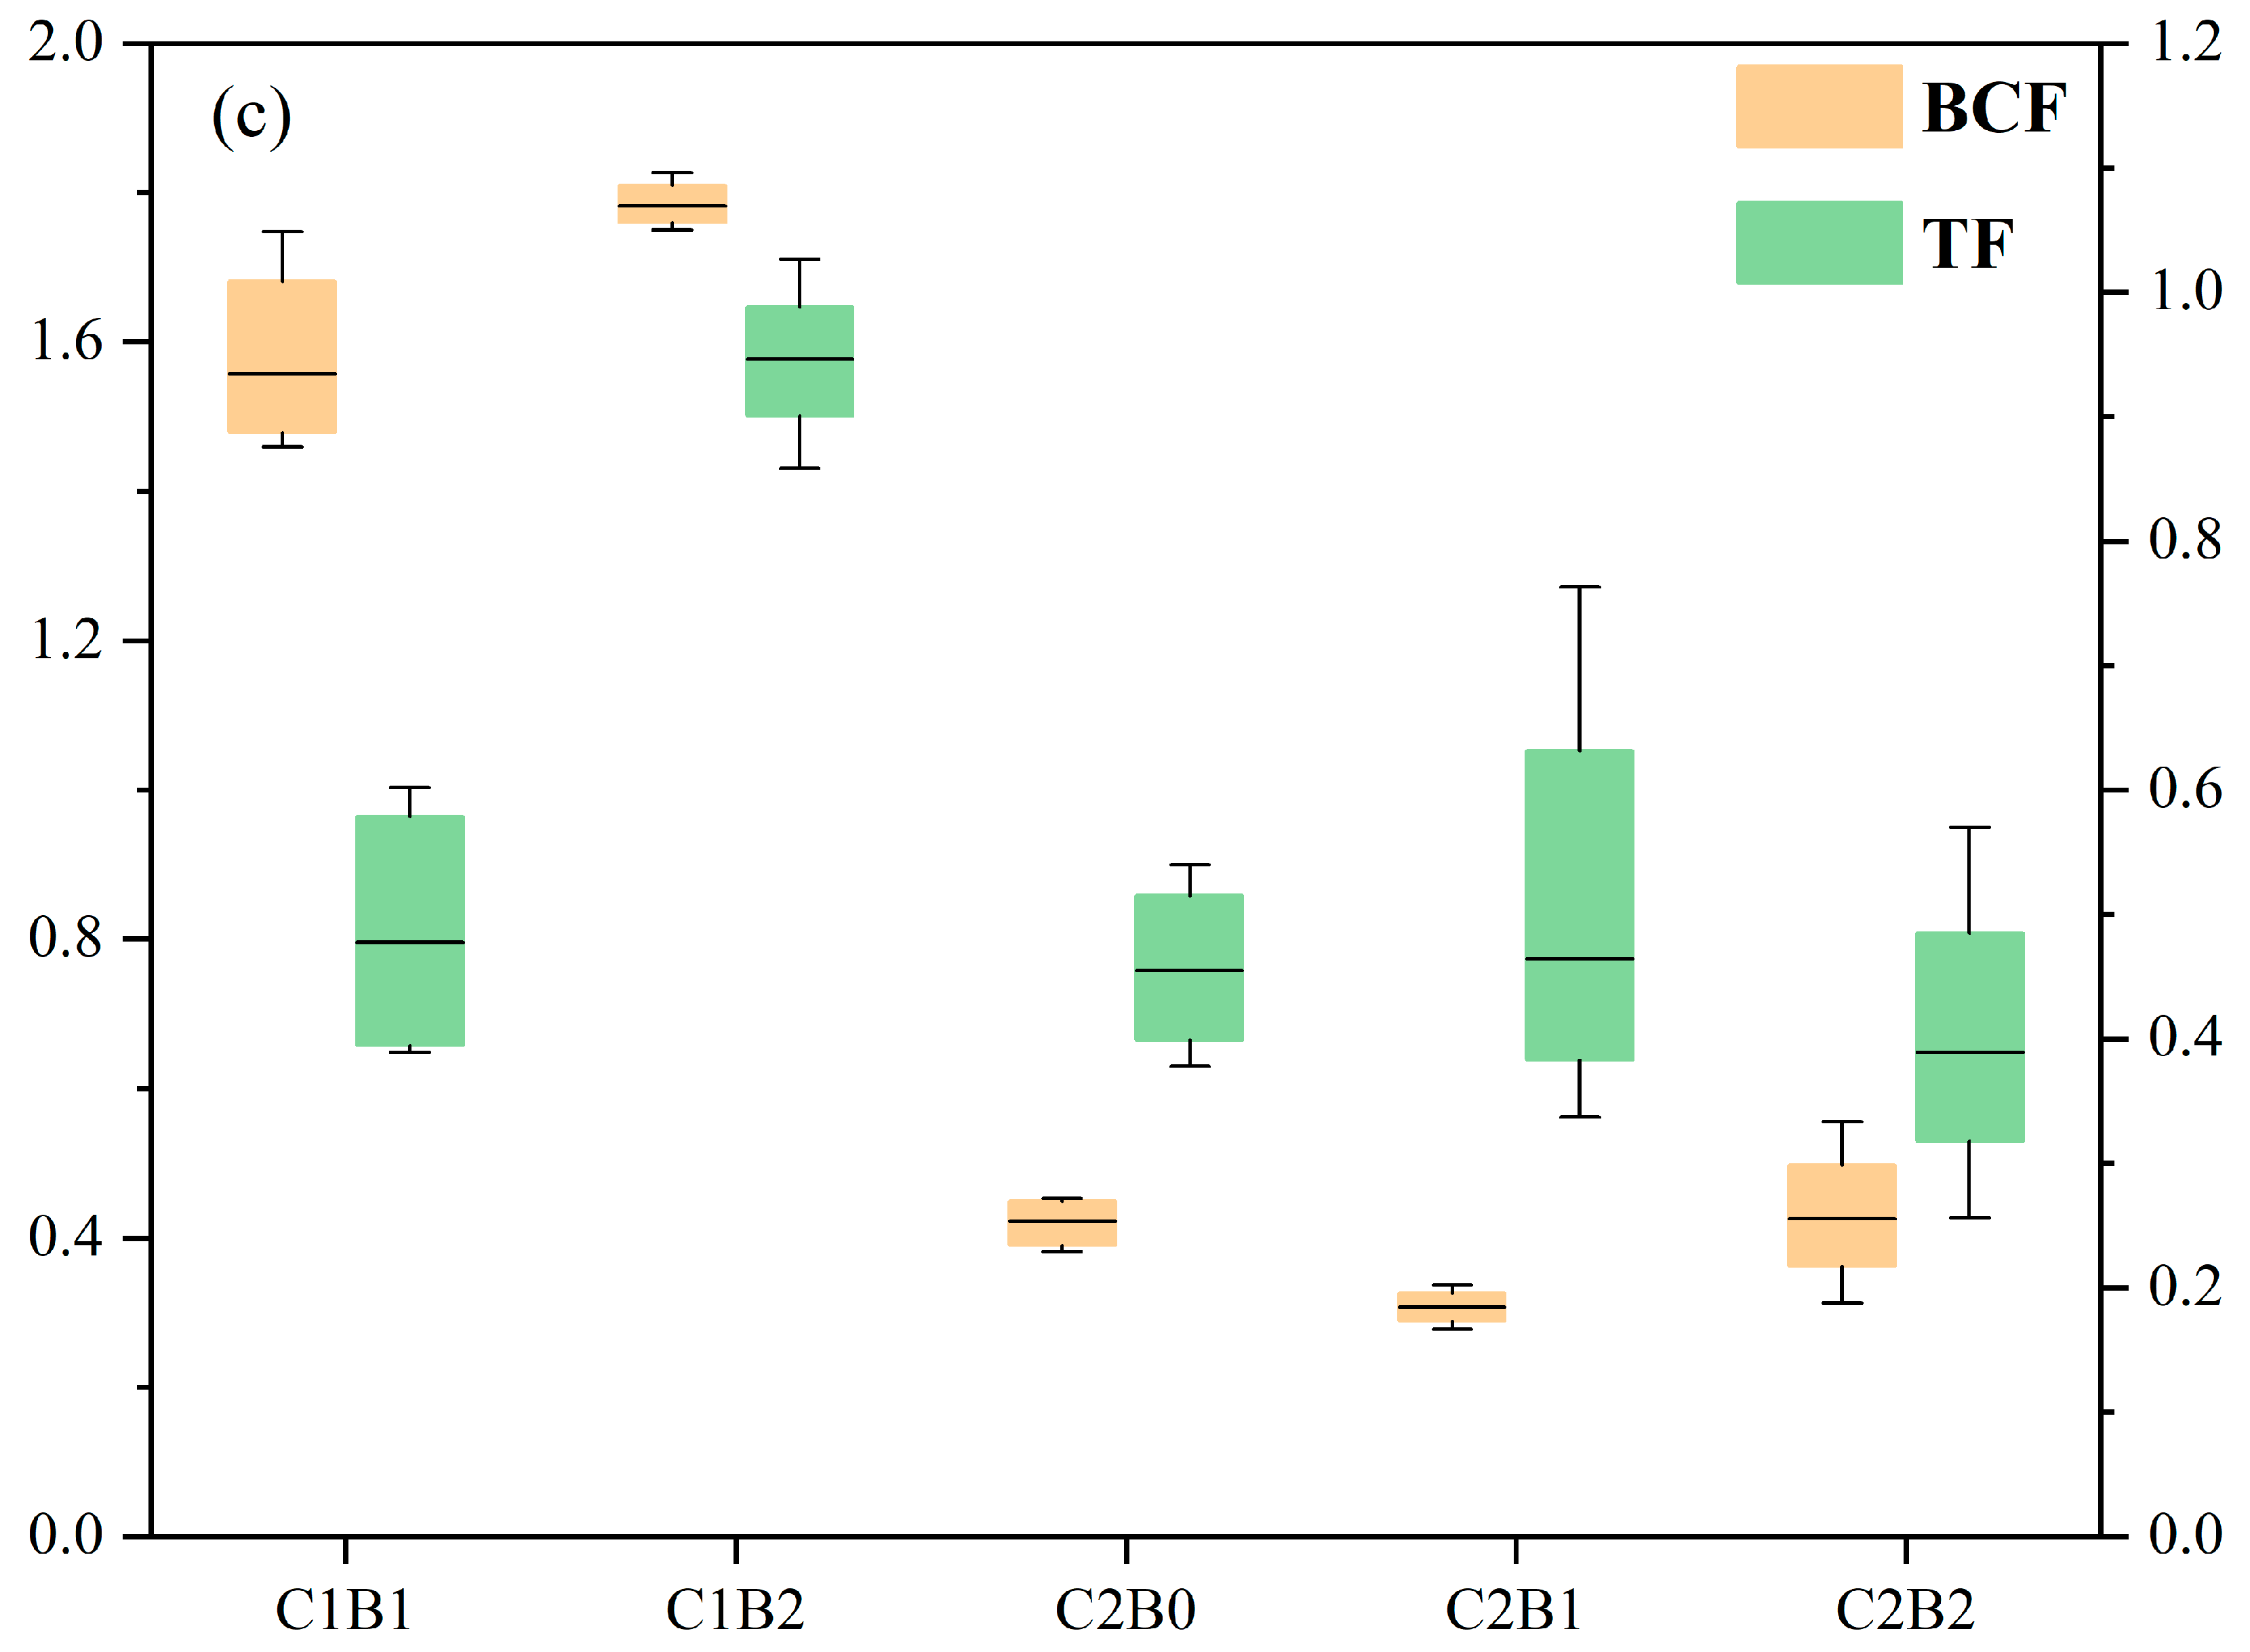
3.4. Accumulation and Transport of Heavy Metals in Ryegrass

All treatment groups of ryegrass seeds were able to germinate, and the seedlings grew well in the first two weeks after germination. However, two weeks later, the growth of ryegrass in the biochar single application group and treatment group C1B0 (1% (w/w) carbide slag + 0 (w/w) biochar) began to stagnate, showing obvious symptoms of nutrient deficiency and metal poisoning, and the branch parts gradually turned yellow and withered until complete death. As displayed in Figure 5, Cu and Pb accumulated mainly in the ryegrass roots and less in the branch parts. The heavy metal concentration of Zn in ryegrass was much higher than that of Cu and Pb. With the addition of carbide slag, the concentration of Zn decreased substantially, but was always higher than that of Cu and Pb. Additionally, compared with treatment groups C1B1 (1% (w/w) carbide slag + 5% (w/w) biochar) and C1B2 (1% (w/w) carbide slag + 10% (w/w) biochar), the concentrations of heavy metals Cu, Pb and Zn (branches + roots) of plants in the 2% (w/w) carbide slag treatment groups decreased by 47% to 65%, 38% to 83% and 73% to 82%, respectively. Furthermore, two-way ANOVA manifested that there was a very huge effect (p < 0.01) of carbide slag and biochar on the Cu, Pb and Zn contents of plants, and there was an interaction between them (p < 0.05).
As shown in Figure 6, with the addition of amendments, the BCF of ryegrass for Cu, Pb and Zn generally experienced a decreasing trend, and the TF generally tended to be stable with little change, except for the heavy metal Zn in treatment group C2B0 (2% carbide slag (w/w) + 0 biochar (w/w)), where the TF ranged from 0.86 to 1.02, which was noticeably higher than that of the other treatment groups. In addition, the BCF and TF of rye grass for Cu and Pb were all less than 1. Additionally, for Zn, the BCF of treatment groups C1B1 (1% (w/w) carbide slag + 5% (w/w) biochar) and C1B2 (1% (w/w) carbide slag + 10% (w/w) biochar) was remarkably greater than 1, but the BCF decreased to a great extent with the addition of improvers (Figure 7).

4. Discussion

In general, the extremely low pH and high concentration of heavy metals in acidic soils of copper sulfide mines result in some biological toxicity in them. Under the environment of strong acidity, metal ions such as Cu, Zn, Cr, Pb, Fe, Mn and Al are released and freed in the form of free state in the acidic soil of copper sulfide mines, which is extremely toxic [39]. In other words, acidification and heavy metal toxicity are the two major constraints for the ecological restoration of copper sulfide mines, and there may be positive cooperativity between them. Therefore, for the remediation concerning acidic soils of copper sulfide mines, two main issues, namely (i) acid production and (ii) biological effectiveness of heavy metals should be addressed.

4.1. Effect of Amendments on Soil Acidity Potential

In this study, the acidic soil pH, CEC, and ANC of copper sulfide mines treated with carbide slag dramatically increased; EC, NAG and sulfate ions showed a significant decrease, whereas carbide slag significantly increased the acidic soil pH of copper sulfide mines, which, in our opinion, mainly results from the highly alkaline components in carbide slag, such as alkaline oxides of calcium and magnesium. Moreover, previous studies have shown that the application of carbide slag can substantially increase soil pH [40]. When the soil pH increased, the -OH dissociation on the surface of soil colloids increased, which increased the amount of negative charge on the soil surface and increased CEC. In addition, the soil CEC was positively correlated with pH, and the results were consistent with previous studies [41].
Acid-neutralization capacity (ANC) is the ability of the soil pH to remain relatively stable after acidic compounds enter the soil and can partially determine the soil pH [42]. Additionally, net acid generation potential (NAG) refers to the addition of H2O2 in soil, while the acid released during the reaction immediately reacts with the alkaline material, and the acid yield measured after complete reaction is the net acid generation of the sample [43]. In most cases, NAG was significantly and negatively correlated with ANC to a great extent, and both accurately predicted and determined the acid-production potential of the waste as well as the rate of acid production [44]. Furthermore, in this study, the ANC of acidic soils from copper sulfide mines increased and the NAG decreased as the amount of amendment applied increased. At a carbide slag dosage of 2% (w/w), soil ANC > NAG theoretically implies that soil re-acidification does not occur, probably due to the neutralization and cementation of the alkaline oxides in the amendment with the acidic compounds [45]. Another significant effect of the amendment treatment groups was the decrease in electrical conductivity (EC) of the acidic soil of copper sulfide mines, presenting a decrease in the sulfate concentration in the soil solution. At the same time, the significant decrease in sulfate concentration may be related to the generation of salt precipitation from sulfate ions and Fe, Ca, Al and Mg ions in the soil [46].

4.2. Effect of Amendments on the Toxicity of Heavy Metals in Soil

In addition to excess acid production, heavy metal bioavailability is another critical issue in restoring the ecology of acidic copper sulfide mines. According to previous studies, pH affects the presence pattern of heavy metals by influencing their adsorption and desorption in soil [47]. In this study, all treatment groups added with amendments obviously (p < 0.05) reduced DTPA-extracted state Cu, Pb and Zn concentrations in acidic soils of copper sulfide mines (as shown). Additionally, the combined application of the two amendments was more effective than carbide slag and biochar single application, with a greater decrease in the effective state of heavy metals, indicating a positive cooperativity of biochar and carbide slag on the remediation of heavy metals in acidic soils of copper sulfide mines. Apart from that, the inhibition of heavy metal bio-effectiveness by biochar may be because of its high adsorption capacity, which can restrain the available state of heavy metals that are free around it [22]. Moreover, the alkalinity of the carbide slag increased the negative charge on the soil surface while increasing the soil pH, which further assisted the biochar to enhance the sorption capacity of heavy metals [48]. The organic functional groups on biochar can be stably bound to Cu through complexation reactions, thus directly immobilizing Cu, while increasing the whole organic carbon content of the soil improves the stabilization efficiency of Pb by forming Pb complexes with organics [49]; additionally, the functional groups such as carbonyl, carboxyl, alcohol, hydroxyl, or phenolic hydroxyl groups of biochar are involved in the immobilization of Zn [50].

4.3. Transport and Accumulation of Heavy Metals in Ryegrass

It is visibly from Figure 5 that the heavy metals concentrations were relatively higher in roots compared to the shoots. Previous studies have shown that lower accumulation of these heavy metals in shoots is associated with lower movement from roots to shoots [51].
The ability of various tolerance and sequestration mechanisms to protect plant systems from heavy metals under a pH of 5 shows a distinct increase [52]. In general, the trends of heavy metal concentrations above and below ground were similar between treatments (Figure 6) The accumulation of plant heavy metals decreased with the addition of amendments, which could be attributed to the increase in soil pH, thus in turn reducing the heavy metal effectiveness [52]. Furthermore, the biological effectiveness and leachability of heavy metals in the soil were further reduced by the strong adsorption capacity of biochar [23]. In this study, the BCF and TF of all heavy metals decreased with amendment adding for two reasons: (i) fixation of heavy metals (reduced bioavailability) and (ii) the increase in biomass of ryegrass, thus diluting the concentration of heavy metals in its body [27]. The monitoring of soil acidification and the migration and accumulation of heavy metals in soil-plant system should be a long-term process. It is suggested that this project should continue to conduct follow-up research on a longer time scale.

5. Conclusions

In this study, it was found that carbide slag and biochar could dramatically increase pH, CEC and ANC, significantly decrease EC, NAG and SO42−, and finally control acidification and re-acidification of acidic soil of copper sulfide mines, hence reducing the biological effectiveness of Cu, Zn and Pb and promoting plant growth. The combined application of 2% (w/w) carbide slag with 10% (w/w) biochar was the most effective treatment for acidic soils of copper sulfide mines. In the future, as a type of industrial waste slag, it could replace lime as an amendment for the acidic soil of copper sulfide mines to realize the large-scale utilization of carbide slag in the copper sulfide mine.

Author Contributions

Conceptualization, H.H.; Methodology, J.X.; Software, X.Z.; Validation, X.W.; Investigation, J.H.; Resources, X.D. All authors have read and agreed to the published version of the manuscript.

Funding

This research was funded by [Key R & D projects of Jiangxi Provincial Department of Science and Technology] grant number [S2021ZPYFE0413].

Conflicts of Interest

The authors declare no conflict of interest.

References

  1. Hilson, G.; Murck, B. Sustainable development in the mining industry: Clarifying the corporate perspective. Resour. Policy 2000, 26, 227–238. [Google Scholar] [CrossRef]
  2. Yousfi, R.; El Ouaer, Z.; Dahri, N.; Ouddane, B.; Rigane, H. Evaluating the Heavy Metals-Associated Ecological Risks in Soil and Sediments of a Decommissioned Tunisian Mine. Pol. J. Environ. Stud. 2019, 28, 2981–2993. [Google Scholar] [CrossRef] [PubMed]
  3. Klik, B.K.; Gusiatin, Z.M.; Kulikowska, D. Suitability of environmental indices in assessment of soil remediation with conventional and next generation washing agents. Sci. Rep. 2020, 10, 20586. [Google Scholar] [CrossRef] [PubMed]
  4. Hakkou, R.; Benzaazoua, M.; Bussière, B. Acid Mine Drainage at the Abandoned Kettara Mine (Morocco): Environmental Characterization. Mine Water Environ. 2008, 27, 145–159. [Google Scholar] [CrossRef]
  5. Xu, R.; Zhang, M.; Lin, H.; Gao, P.; Yang, Z.; Wang, D.; Sun, X.; Li, B.; Wang, Q.; Sun, W. Response of soil protozoa to acid mine drainage in a contaminated terrace. J. Hazard. Mater. 2021, 421, 126790. [Google Scholar] [CrossRef] [PubMed]
  6. Ali, H.; Khan, E.; Sajad, M.A. Phytoremediation of heavy metals—Concepts and applications. Chemosphere 2013, 91, 869–881. [Google Scholar] [CrossRef]
  7. Franks, D.; Boger, D.V.; Côte, C.M.; Mulligan, D.R. Sustainable development principles for the disposal of mining and mineral processing wastes. Resour. Policy 2011, 36, 114–122. [Google Scholar] [CrossRef]
  8. Waterland, L.R.; King, C.; Richards, M.K.; Thurnau, R.C. Incineration treatment of arsenic-contaminated soil. Remediat. J. 1991, 1, 227–237. [Google Scholar] [CrossRef]
  9. Piepel, G.F.; Shade, J.W. In Situ Vitrification and the Effects of Soil Additives-A Mixture Experiment Case Study. J. Am. Ceram. Soc. 1992, 75, 112–116. Available online: https://www.researchgate.net/publication/318447223_In-Situ_Vitrification_and_the_Effects_of_Soil_Additives-A_Mixture_Experiment_Case_Study (accessed on 15 November 2022). [CrossRef]
  10. Dermatas, D.; Meng, X. Utilization of fly ash for stabilization/solidification of heavy metal contaminated soils. Eng. Geol. 2003, 70, 377–394. [Google Scholar] [CrossRef]
  11. Brown, S.; Sprenger, M.; Maxemchuk, A.; Compton, H. Ecosystem Function in Alluvial Tailings after Biosolids and Lime Addition. J. Environ. Qual. 2005, 34, 139–148. [Google Scholar] [CrossRef] [PubMed]
  12. Néel, C.; Bril, H.; Courtin-Nomade, A.; Dutreuil, J.-P. Factors affecting natural development of soil on 35-year-old sulphide-rich mine tailings. Geoderma 2003, 111, 1–20. [Google Scholar] [CrossRef]
  13. Fedje, K.K.; Yillin, L.; Strömvall, A.-M. Remediation of metal polluted hotspot areas through enhanced soil washing–Evaluation of leaching methods. J. Environ. Manag. 2013, 128, 489–496. [Google Scholar] [CrossRef] [PubMed]
  14. Cameselle, C.; Chirakkara, R.A.; Reddy, K.R. Electrokinetic-enhanced phytoremediation of soils: Status and opportunities. Chemosphere 2013, 93, 626–636. [Google Scholar] [CrossRef]
  15. Wuana, R.A.; Okieimen, F.E. Heavy Metals in Contaminated Soils: A Review of Sources, Chemistry, Risks and Best Available Strategies for Remediation. ISRN Ecol. 2011, 2011, 402647. [Google Scholar] [CrossRef]
  16. Mokolobate, M.S.; Haynes, R.J. Comparative liming effect of four organic residues applied to an acid soil. Biol. Fertil. Soils 2002, 35, 79–85. [Google Scholar]
  17. RoyChowdhury, A.; Sarkar, D.; Datta, R. A combined chemical and phytoremediation method for reclamation of acid mine drainage–impacted soils. Environ. Sci. Pollut. Res. 2019, 26, 14414–14425. [Google Scholar] [CrossRef]
  18. Yu, H.; Ma, J.; Chen, F.; Zhang, Q.; Wang, Y.; Bian, Z. Effective remediation of electronic waste contaminated soil by the combination of metal immobilization and phytoremediation. J. Environ. Chem. Eng. 2022, 10, 107410. [Google Scholar] [CrossRef]
  19. International Biochar Initiative (IBI). Standardized Product Definition and Product Testing Guidelines for Biochar that is Used in Soil; International Biochar Initiative (IBI): Princeton Junction, NJ, USA, 2012. [Google Scholar]
  20. Pandey, D.; Daverey, A.; Arunachalam, K. Biochar: Production, properties and emerging role as a support for enzyme immobilization. J. Clean. Prod. 2020, 255, 120267. [Google Scholar] [CrossRef]
  21. He, M.; Xiong, X.; Wang, L.; Hou, D.; Bolan, N.S.; Ok, Y.S.; Rinklebe, J.; Tsang, D.C. A critical review on performance indicators for evaluating soil biota and soil health of biochar-amended soils. J. Hazard. Mater. 2021, 414, 125378. [Google Scholar] [CrossRef]
  22. Jia, M.; Wang, F.; Bian, Y.; Jin, X.; Song, Y.; Kengara, F.O.; Xu, R.; Jiang, X. Effects of pH and metal ions on oxytetracycline sorption to maize-straw-derived biochar. Bioresour. Technol. 2013, 136, 87–93. [Google Scholar] [CrossRef] [PubMed]
  23. Jia, M.; Yu, J.; Li, Z.; Wu, L.; Christie, P. Effects of biochar on the migration and transformation of metal species in a highly acid soil contaminated with multiple metals and leached with solutions of different pH. Chemosphere 2021, 278, 130344. [Google Scholar] [CrossRef] [PubMed]
  24. Rodríguez-Vila, A.; Covelo, E.F.; Forján, R.; Asensio, V. Recovering a copper mine soil using organic amendments and phytomanagement with Brassica juncea L. J. Environ. Manag. 2015, 147, 73–80. [Google Scholar] [CrossRef] [PubMed]
  25. Munir, M.A.M.; Liu, G.; Yousaf, B.; Mian, M.; Ali, M.U.; Ahmed, R.; Cheema, A.I.; Naushad, M. Contrasting effects of biochar and hydrothermally treated coal gangue on leachability, bioavailability, speciation and accumulation of heavy metals by rapeseed in copper mine tailings. Ecotoxicol. Environ. Saf. 2020, 191, 110244. [Google Scholar] [CrossRef]
  26. Hartley, W.; Dickinson, N.M.; Riby, P.; Lepp, N.W. Arsenic mobility in brownfield soils amended with green waste compost or biochar and planted with Miscanthus. Environ. Pollut. 2009, 157, 2654–2662. [Google Scholar] [CrossRef]
  27. Park, J.H.; Choppala, G.K.; Bolan, N.S.; Chung, J.W.; Chuasavathi, T. Biochar reduces the bioavailability and phytotoxicity of heavy metals. Plant Soil 2011, 348, 439–451. [Google Scholar] [CrossRef]
  28. Park, J.H.; Lamb, D.; Paneerselvam, P.; Choppala, G.; Bolan, N.; Chung, J.-W. Role of organic amendments on enhanced bioremediation of heavy metal(loid) contaminated soils. J. Hazard. Mater. 2011, 185, 549–574. [Google Scholar] [CrossRef]
  29. Zhang, X.; Wang, H.; He, L.; Lu, K.; Sarmah, A.; Li, J.; Bolan, N.S.; Pei, J.; Huang, H. Using biochar for remediation of soils contaminated with heavy metals and organic pollutants. Environ. Sci. Pollut. Res. 2013, 20, 8472–8483. [Google Scholar] [CrossRef]
  30. Houben, D.; Evrard, L.; Sonnet, P. Mobility, bioavailability and pH-dependent leaching of cadmium, zinc and lead in a contaminated soil amended with biochar. Chemosphere 2013, 92, 1450–1457. [Google Scholar] [CrossRef]
  31. Sun, Y.; Gao, B.; Yao, Y.; Fang, J.; Zhang, M.; Zhou, Y.; Chen, H.; Yang, L. Effects of feedstock type, production method, and pyrolysis temperature on biochar and hydrochar properties. Chem. Eng. J. 2014, 240, 574–578. [Google Scholar] [CrossRef]
  32. Sun, R.; Li, Y.; Zhao, J.; Liu, C.; Lu, C. CO2 capture using carbide slag modified by propionic acid in calcium looping process for hydrogen production. Int. J. Hydrogen Energy 2013, 38, 13655–13663. [Google Scholar] [CrossRef]
  33. Meng, J.; Zhong, L.; Wang, L.; Liu, X.; Tang, C.; Chen, H.; Xu, J. Contrasting effects of alkaline amendments on the bioavailability and uptake of Cd in rice plants in a Cd-contaminated acid paddy soil. Environ. Sci. Pollut. Res. 2018, 25, 8827–8835. [Google Scholar] [CrossRef]
  34. Sudmeyer, R. Climate in the Pilbara; Department of Agriculture and Food: Western Australia, Perth, Australia, 2016. [Google Scholar]
  35. Shu, W.; Ye, Z.; Lan, C.; Zhang, Z.; Wong, M. Acidification of lead/zinc mine tailings and its effect on heavy metal mobility. Environ. Int. 2001, 26, 389–394. [Google Scholar] [CrossRef]
  36. Meng, Y.-N.; Li, T.-P.; Shi, Z.; Cai, J.-P.; Xu, Z.-W.; Jiang, Y. Effects of fertilization and water addition on soil acid neutralizing capacity in an old-field grassland. J. Appl. Ecol. 2020, 31, 1579–1586. [Google Scholar]
  37. Bao, S. Soil and Agricultural Chemistry Analysis China. Available online: https://www.researchgate.net/publication/301822463_Soil_and_agricultural_chemistry_analysis (accessed on 15 November 2022).
  38. Rayment, G.E.; Lyons, D.J. New, Comprehensive Soil Chemical Methods Book for Australasia. Commun. Soil Sci. Plant Anal. 2012, 43, 412–418. [Google Scholar] [CrossRef]
  39. Mendez, M.O.; Maier, R.M. Phytostabilization of Mine Tailings in Arid and Semiarid Environments—An Emerging Remediation Technology. Environ. Health Perspect. 2008, 116, 278–283. [Google Scholar] [CrossRef] [PubMed]
  40. Liu, G.; Meng, J.; Huang, Y.; Dai, Z.; Tang, C.; Xu, J. Effects of carbide slag, lodestone and biochar on the immobilization, plant uptake and translocation of As and Cd in a contaminated paddy soil. Environ. Pollut. 2020, 266, 115194. [Google Scholar] [CrossRef] [PubMed]
  41. Li, F.-L.; Qiu, Y.; Xu, X.; Yang, F.; Wang, Z.; Feng, J.; Wang, J. EDTA-enhanced phytoremediation of heavy metals from sludge soil by Italian ryegrass (Lolium perenne L.). Ecotoxicol. Environ. Saf. 2020, 191, 110185. [Google Scholar] [CrossRef]
  42. Curtin, D.; Trolove, S. Predicting pH buffering capacity of New Zealand soils from organic matter content and mineral characteristics. Soil Res. 2013, 51, 494–502. [Google Scholar] [CrossRef]
  43. Plante, B.; Bussière, B.; Benzaazoua, M. Static tests response on 5 Canadian hard rock mine tailings with low net acid-generating potentials. J. Geochem. Explor. 2012, 114, 57–69. [Google Scholar] [CrossRef]
  44. Yang, S.X.; Li, J.T.; Yang, B.; Liao, B.; Zhang, J.T.; Shu, W.S. Effectiveness of amendments on re-acidification and heavy metal immobilization in an extremely acidic mine soil. J. Environ. Monit. 2011, 13, 1876–1883. [Google Scholar] [CrossRef] [PubMed]
  45. Holland, J.; Bennett, A.; Newton, A.; White, P.; McKenzie, B.; George, T.; Pakeman, R.; Bailey, J.; Fornara, D.; Hayes, R. Liming impacts on soils, crops and biodiversity in the UK: A review. Sci. Total. Environ. 2018, 610–611, 316–332. [Google Scholar] [CrossRef] [PubMed]
  46. Fernández-Caliani, J.; Barba-Brioso, C. Metal immobilization in hazardous contaminated minesoils after marble slurry waste application. A field assessment at the Tharsis mining district (Spain). J. Hazard. Mater. 2010, 181, 817–826. [Google Scholar] [CrossRef] [PubMed]
  47. Tahervand, S.; Jalali, M. Sorption, desorption, and speciation of Cd, Ni, and Fe by four calcareous soils as affected by pH. Environ. Monit. Assess. 2016, 188, 322. [Google Scholar] [CrossRef]
  48. Appel, C.; Ma, L. Concentration, pH, and Surface Charge Effects on Cadmium and Lead Sorption in Three Tropical Soils. J. Environ. Qual. 2002, 31, 581–589. [Google Scholar] [CrossRef]
  49. Wang, Z.; Shen, R.; Ji, S.; Xie, L.; Zhang, H. Effects of biochar derived from sewage sludge and sewage sludge/cotton stalks on the immobilization and phytoavailability of Pb, Cu, and Zn in sandy loam soil. J. Hazard. Mater. 2021, 419, 126468. [Google Scholar] [CrossRef]
  50. Soria, R.I.; Rolfe, S.A.; Betancourth, M.P.; Thornton, S.F. The relationship between properties of plant-based biochars and sorption of Cd(II), Pb(II) and Zn(II) in soil model systems. Heliyon 2020, 6, e05388. [Google Scholar] [CrossRef]
  51. Lebrun, M.; Miard, F.; Nandillon, R.; Scippa, G.S.; Bourgerie, S.; Morabito, D. Biochar effect associated with compost and iron to promote Pb and As soil stabilization and Salix viminalis L. growth. Chemosphere 2019, 222, 810–822. [Google Scholar] [CrossRef]
  52. Sytar, O.; Kumar, A.; Latowski, D.; Kuczynska, P.; Strzałka, K.; Prasad, M.N.V. Heavy metal-induced oxidative damage, defense reactions, and detoxification mechanisms in plants. Acta Physiol. Plant. 2013, 35, 985–999. [Google Scholar] [CrossRef]
Figure 1. Effects of different proportions of amendments on soil pH, CEC (cation exchange capacity). Values are means ± SD (n = 3). Different letters indicate significant differences at p ≤ 0.05 according to the Tukey’s HSD test. C0B0, C0B1, C0B2, C1B0, C1B1, C1B2, C2B0, C2B1 and C2B2 are represented. The dosage of amendments are 0 (w/w) carbide slag + 0 (w/w) biochar, 0 (w/w) carbide slag + 5% (w/w) biochar, 0 (w/w) carbide slag + 10% (w/w) biochar, 1% (w/w) carbide slag + 0 (w/w) biochar, 1% (w/w) carbide slag + 5% (w/w) biochar, 1% (w/w) carbide slag + 10% (w/w) biochar, 2% (w/w) carbide slag + 0 (w/w) biochar, 2% (w/w) carbide slag + 5% (w/w) biochar and 2% (w/w) carbide slag + (10% (w/w) biochar, respectively, the same below.
Sustainability 15 03206 g001
Figure 2. Effects of different proportions of amendments on soil NAG (net acid generation), ANC (acid neutralization capacity). Values are means ± SD (n = 3). Different letters indicate significant differences at p ≤ 0.05 according to the Tukey’s HSD test.
Sustainability 15 03206 g002
Figure 3. Effects of different proportions of amendments on soil EC (electrical conductivity) and SO42− concentration. Values are means ± SD (n = 3). Different letters indicate significant differences at p ≤ 0.05 according to the Tukey’s HSD test.
Sustainability 15 03206 g003
Figure 4. Effects of different proportions of amendments on soil total content of heavy metal, DPTA-extracted state of Cu (a), Pb (b), Zn (c). Values are means ± SD (n = 3). Different letters indicate significant differences at p ≤ 0.05 according to the Tukey’s HSD test.
Sustainability 15 03206 g004aSustainability 15 03206 g004b
Figure 5. Effects of different proportions of amendments on the content of Cu, Pb and Zn in ryegrass. Values are means ± SD (n = 3). Different letters indicate significant differences at p ≤ 0.05 according to the Tukey’s HSD test.
Sustainability 15 03206 g005
Figure 6. Effects of different proportions of amendments on BCF (bio-concentration factor), and TF (transfer factor) of Cu (a), Pb (b), Zn (c). The solid line is the median, the box represents the upper and lower quartiles and whiskers are the 10th and 90th percentiles.
Sustainability 15 03206 g006aSustainability 15 03206 g006b
Figure 7. Pearson correlation analysis heat map of soil physiochemical properties and DTPA-extracted Cu, Pb and Zn. The darker the orange, the greater the positive correlation between the two factors; the darker the purple, the greater the negative correlation between the two factors.
Sustainability 15 03206 g007
Table 1. Characteristics of the copper sulfide acid soil (S), carbide slag (C) and biochar (B).
SCB
pH2.43 ± 0.0813.21 ± 0.229 ± 0.12
TOC (g kg−1)14.67 ± 0.394.65 ± 0.2935.74 ± 0.95
Na2O (%)0.250.490.79
Al2O3 (%)14.840.9820.48
SiO2 (%)27.412.3557.31
SO3 (%)5.190.471.27
CaO (%)2.4193.924.54
P2O5 (%)0.290.090.20
K2O (%)1.250.092.95
SO3 (%)5.190.471.27
Fe2O3 (%)42.790.4910.81
CuTotal (mg kg−1)2233.5 ± 30.348.7 ± 2.217.1 ± 2.6
ZnTotal2367.8 ± 23.370.3 ± 0.929.1 ± 1.5
PbTotal2736.7 ± 17.0ND90.3 ± 1.1
CrTotal32.5 ± 1.4ND26.5 ± 2.8
TiTotal38.2 ± 6.5NDND
Values are means (n = 3) ±SD
Table 2. The Orthogonal test schemes.
TreatmentCarbide Slag (w/w)Biochar (w/w)
COB000
C0B105%
C0B2010%
C1B01%0
C1B11%5%
C1B21%10%
C2B02%0
C2B12%5%
C2B22%10%
Disclaimer/Publisher’s Note: The statements, opinions and data contained in all publications are solely those of the individual author(s) and contributor(s) and not of MDPI and/or the editor(s). MDPI and/or the editor(s) disclaim responsibility for any injury to people or property resulting from any ideas, methods, instructions or products referred to in the content.

