


Emergency Vehicle Driving Assistance System Using Recurrent Neural Network with Navigational Data Processing Method


Abstract
:1. Introduction
2. Related Works
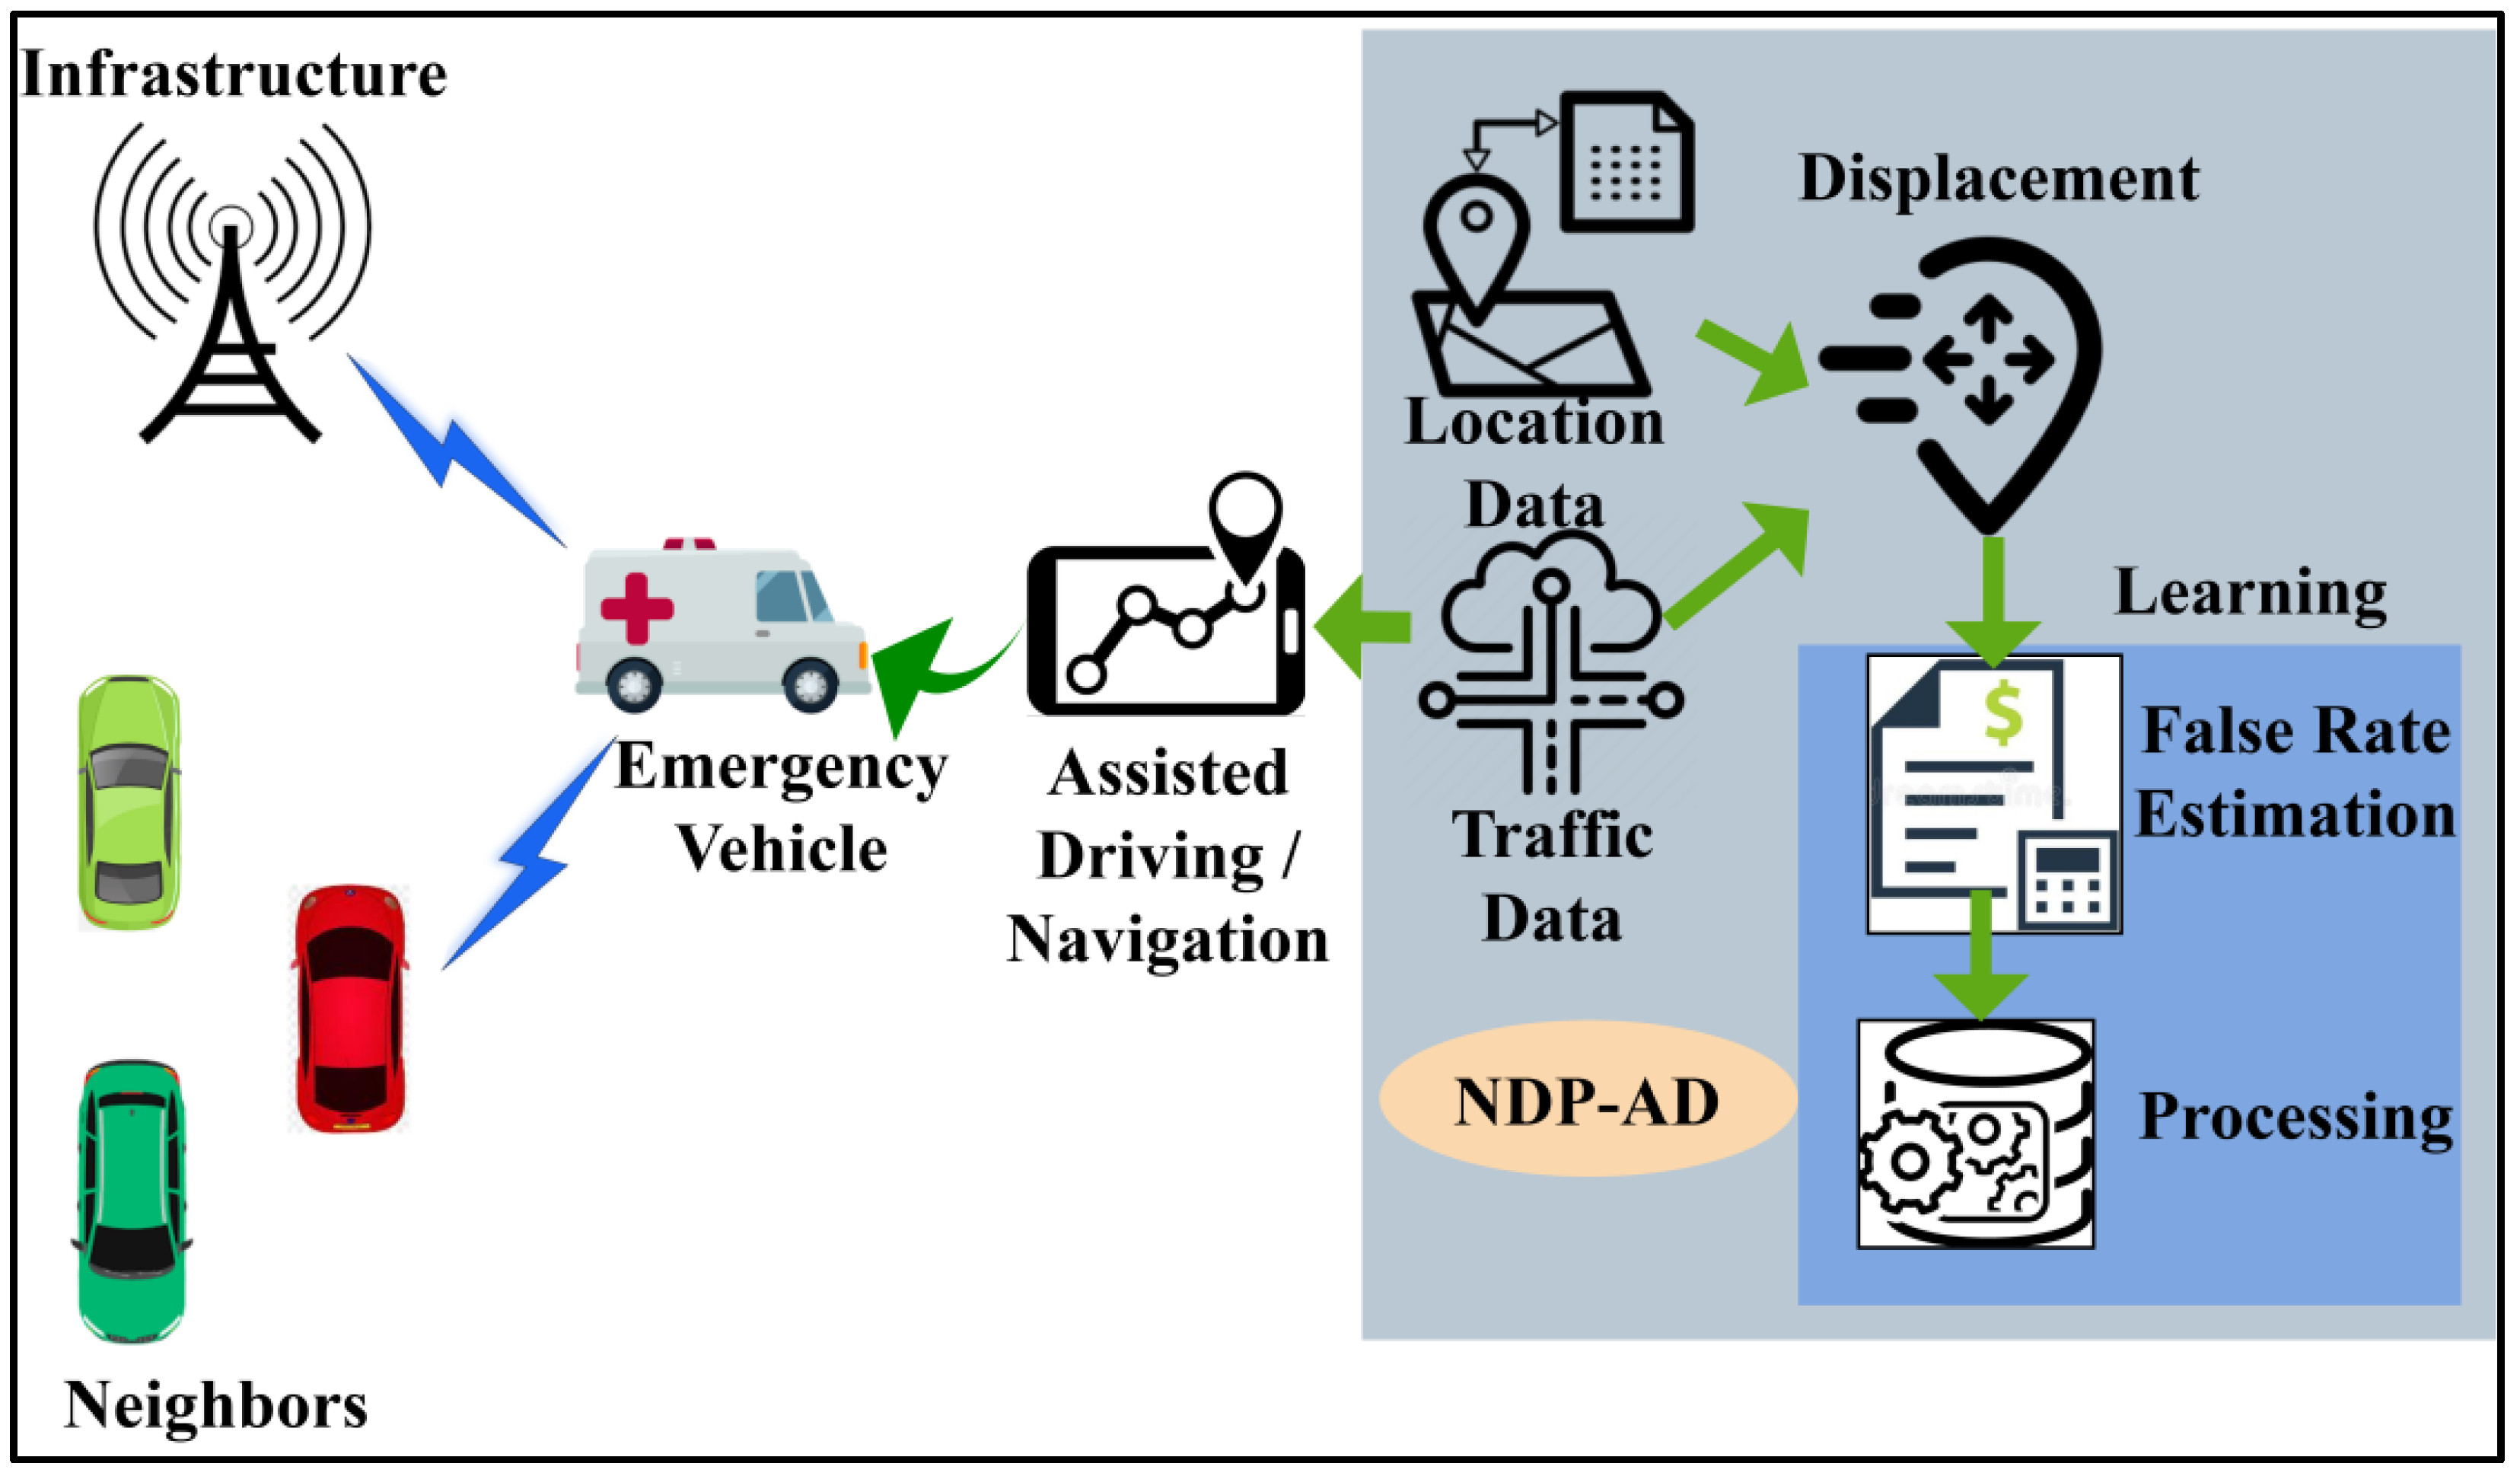
3. Navigation Data Processing for Assisted Driving Method
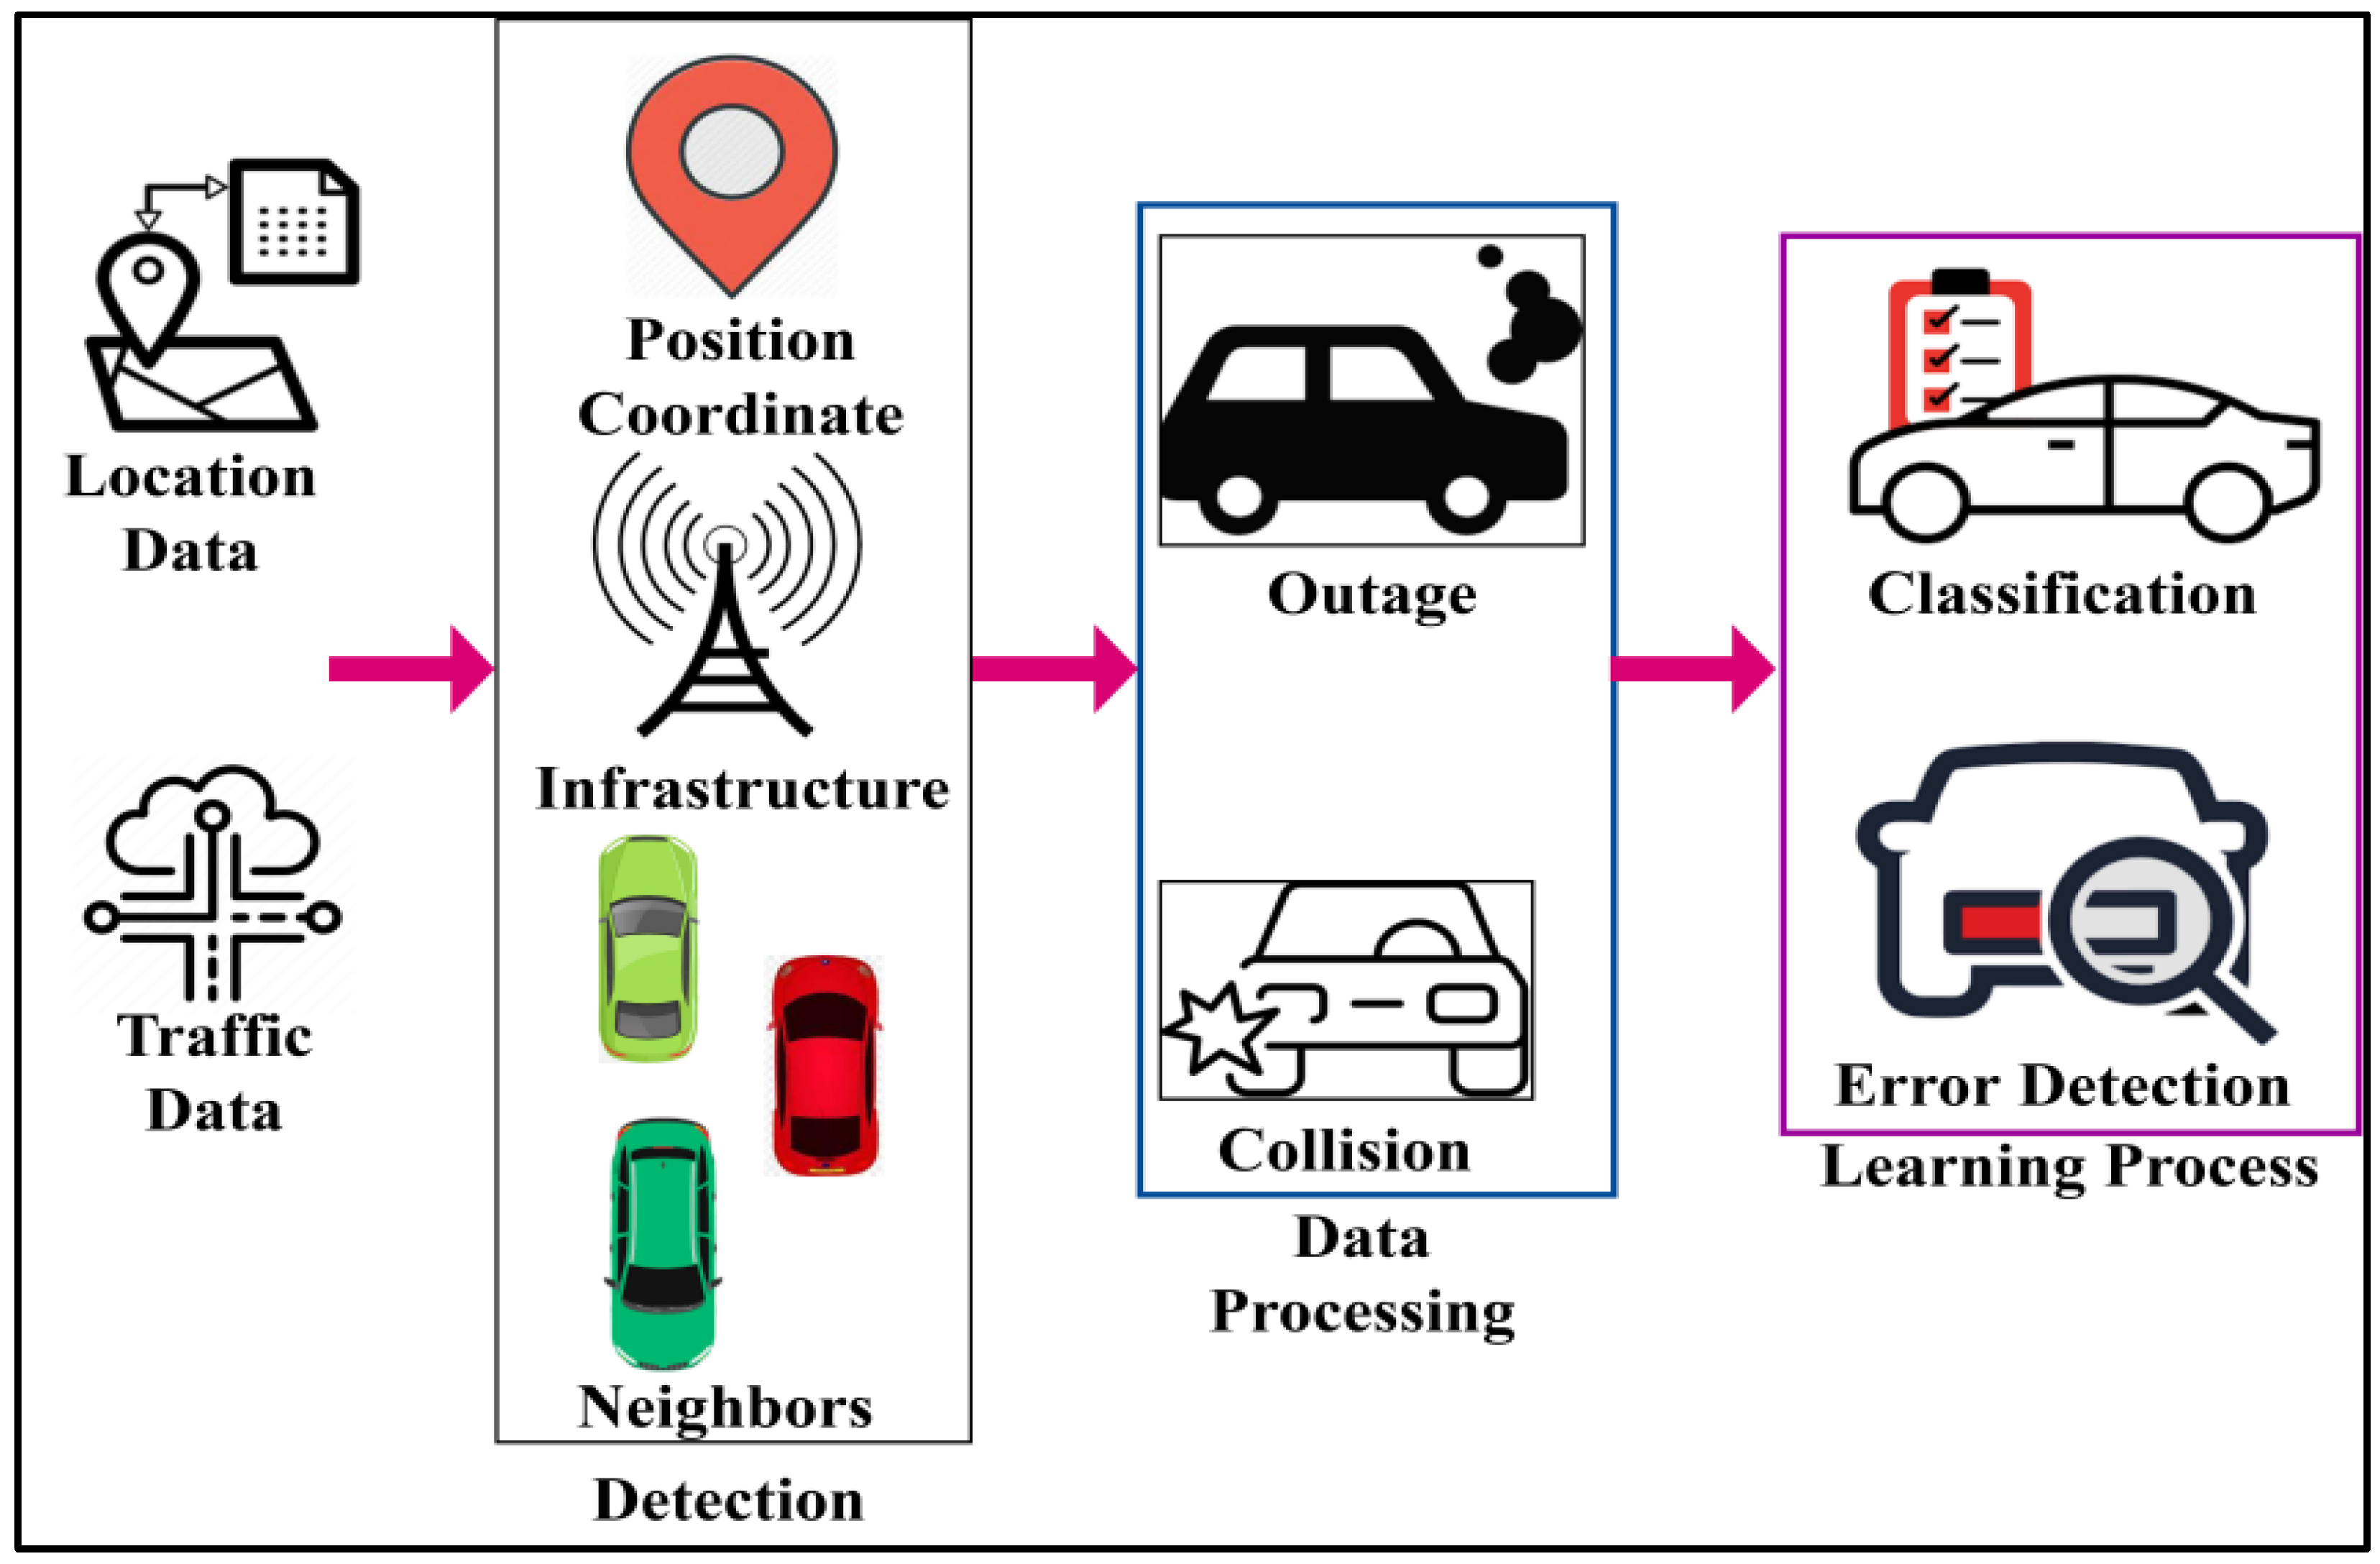
4. Emergency Vehicle-Based Data Processing
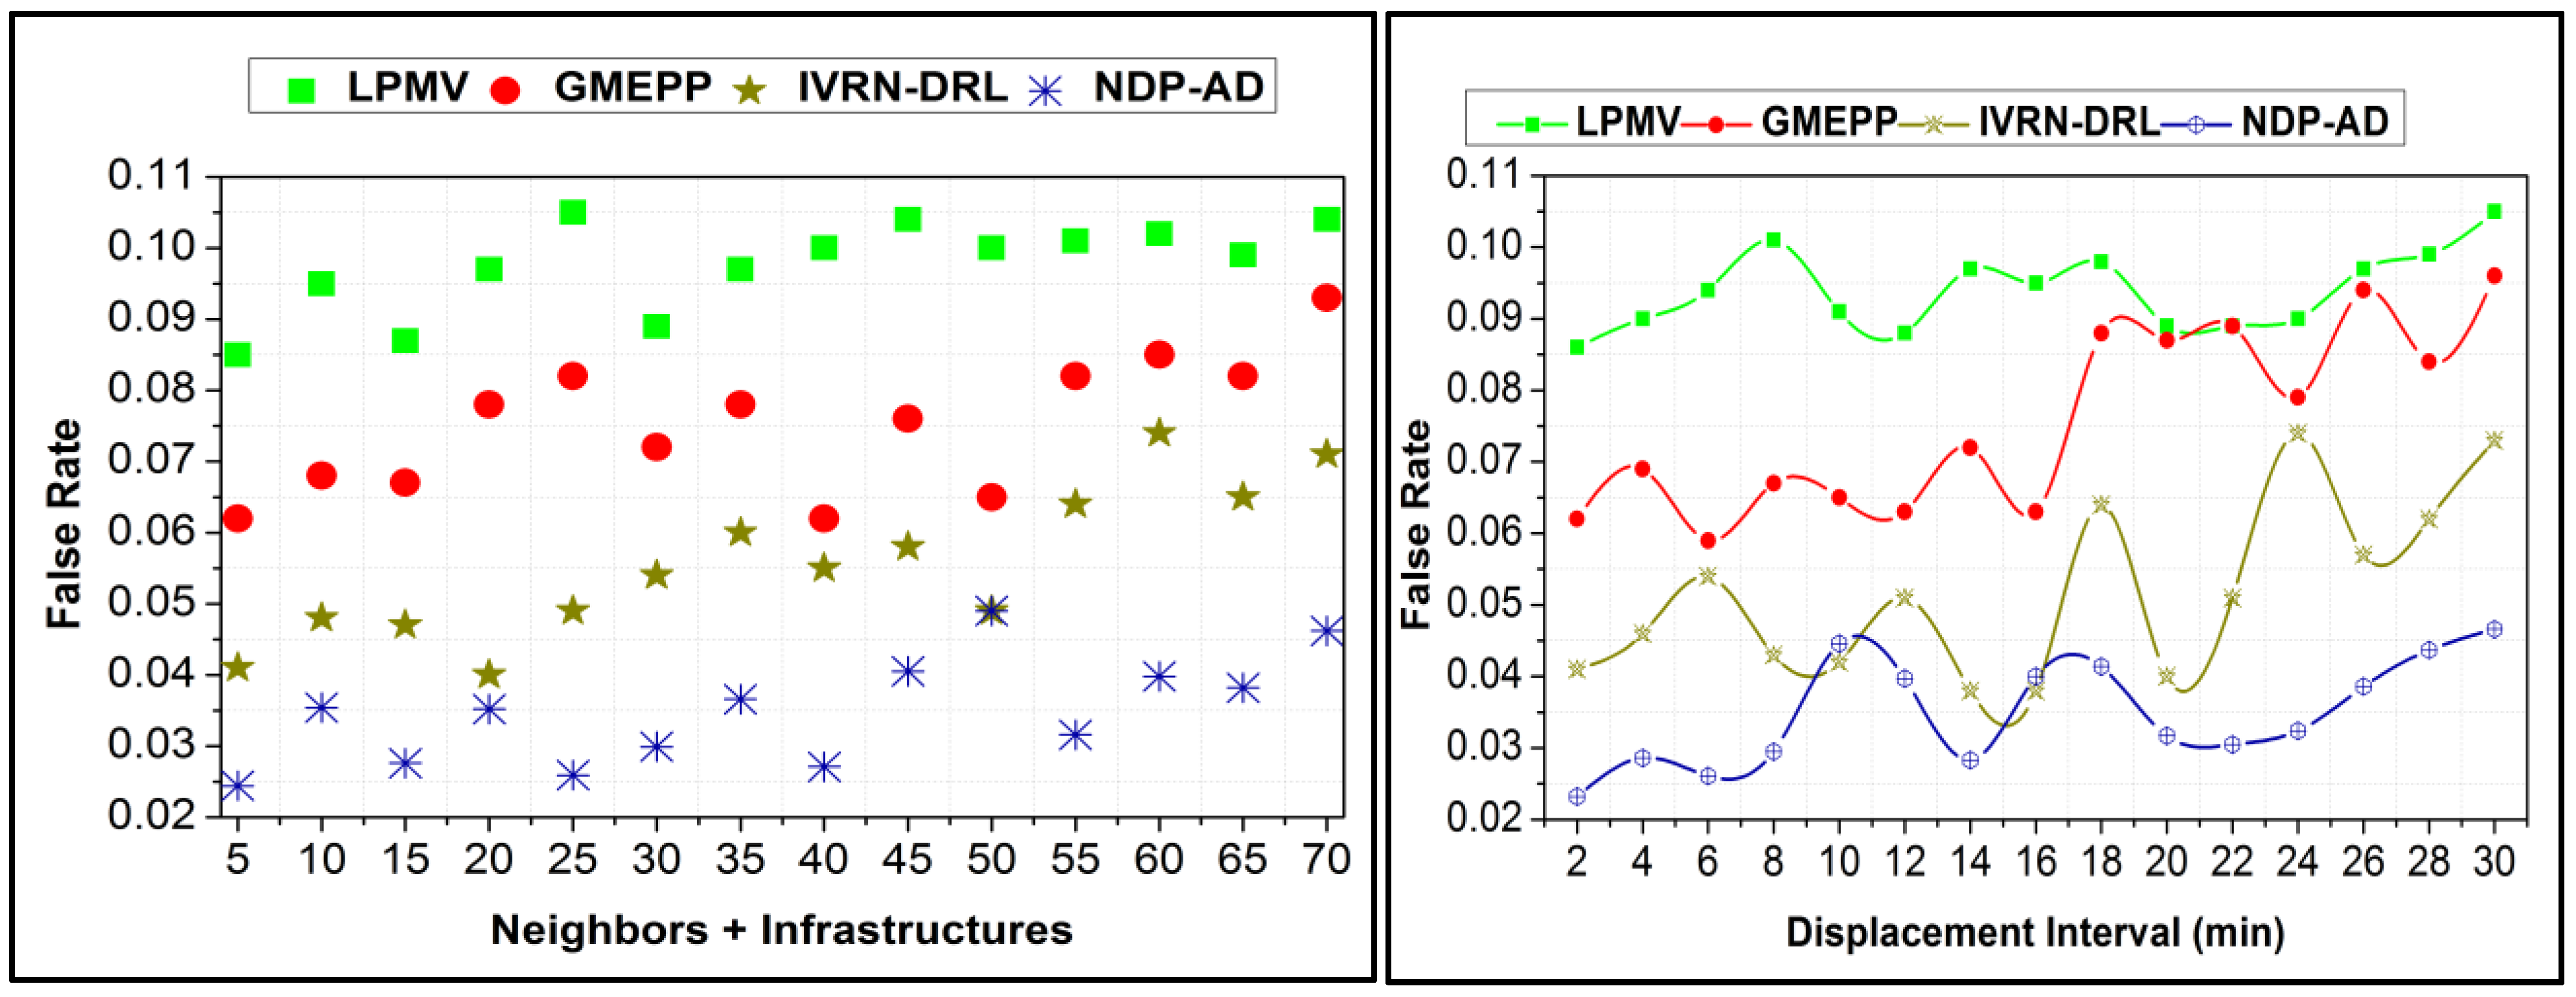
False Rate Classification
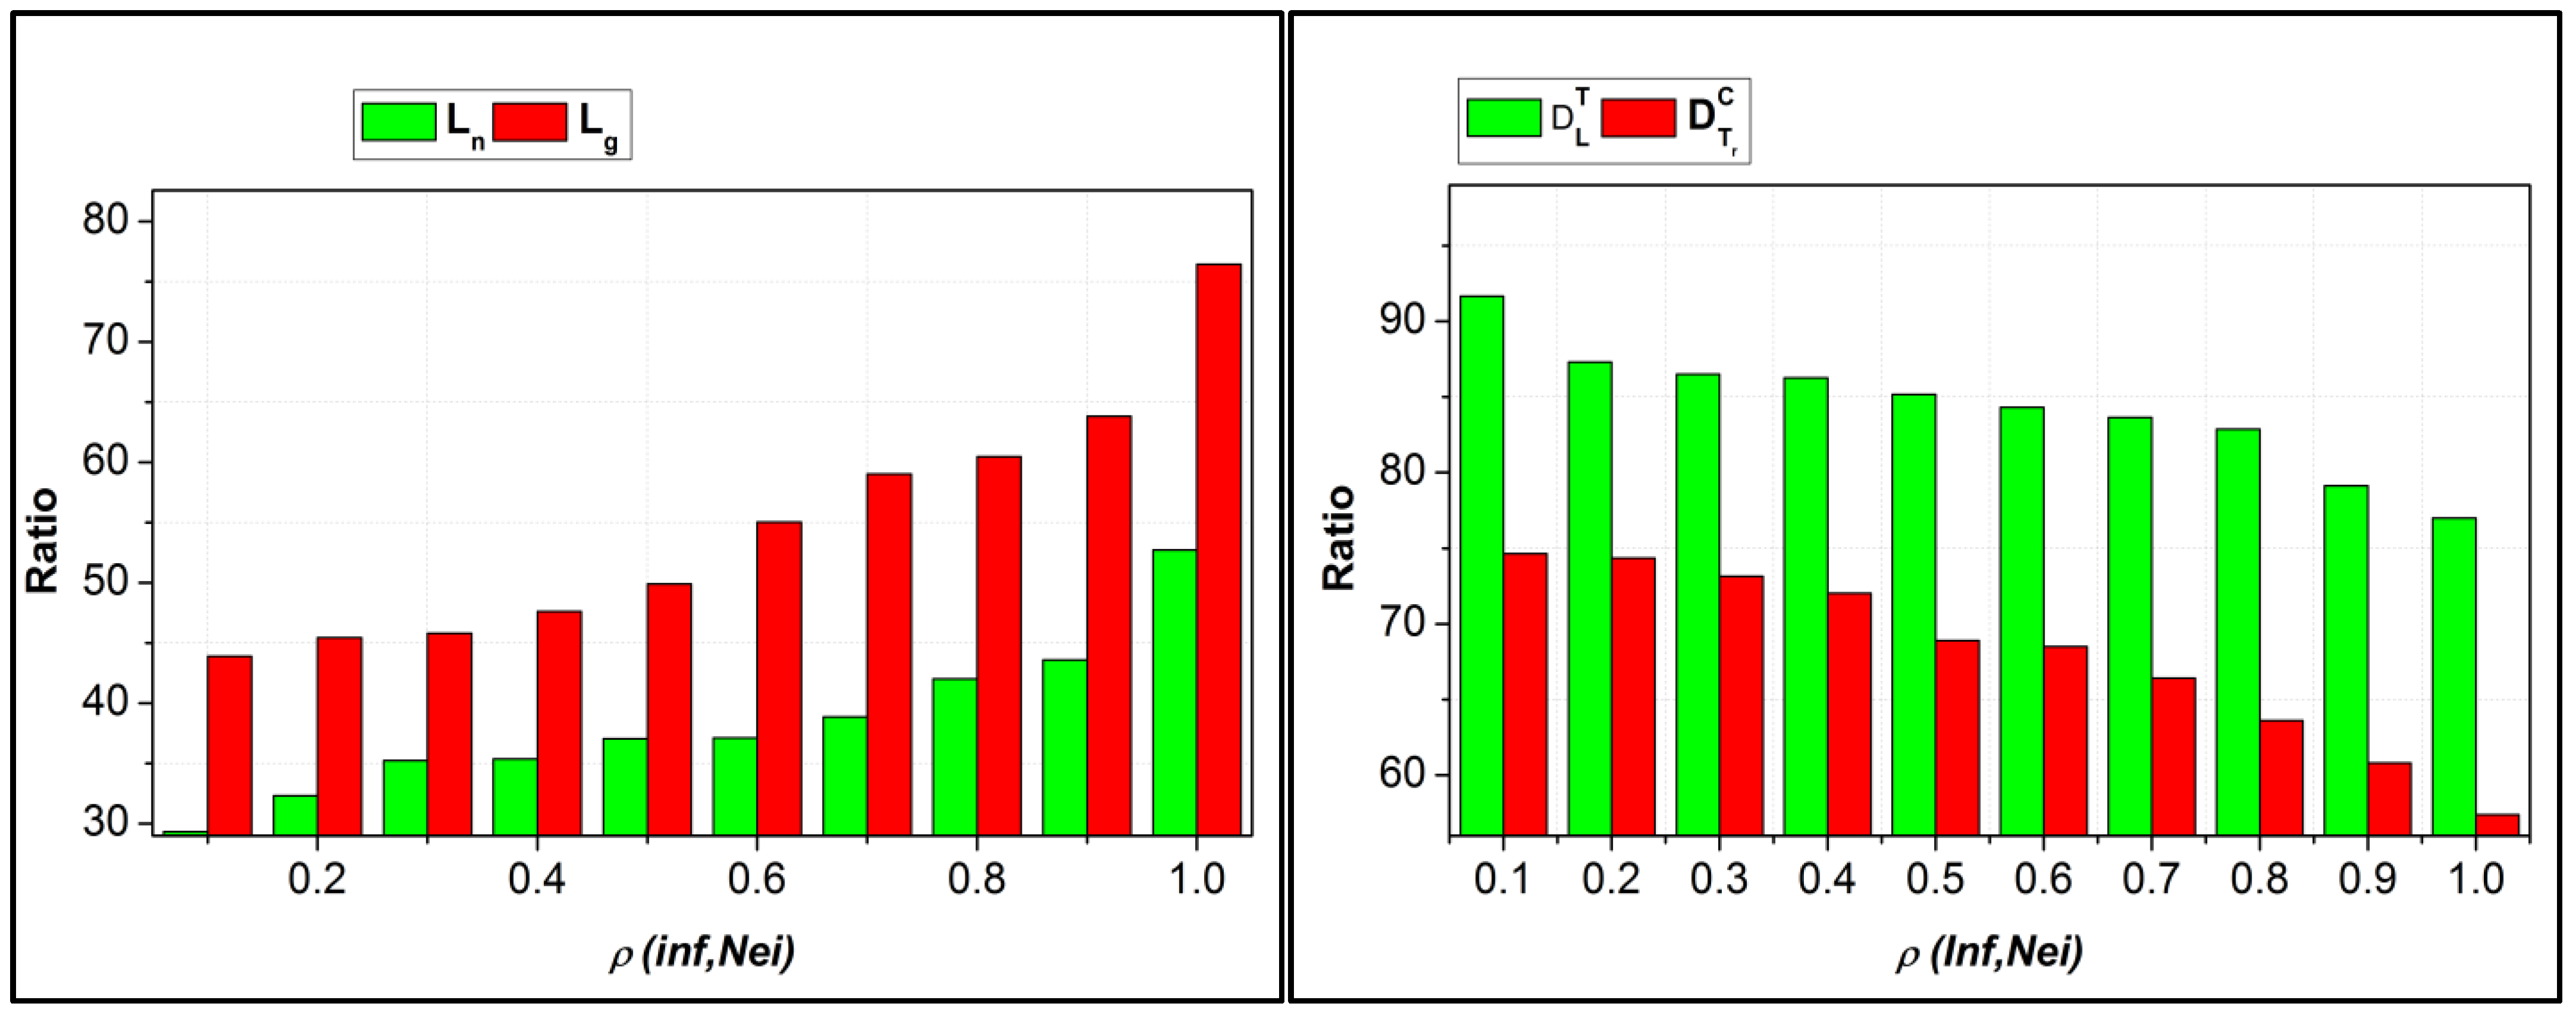
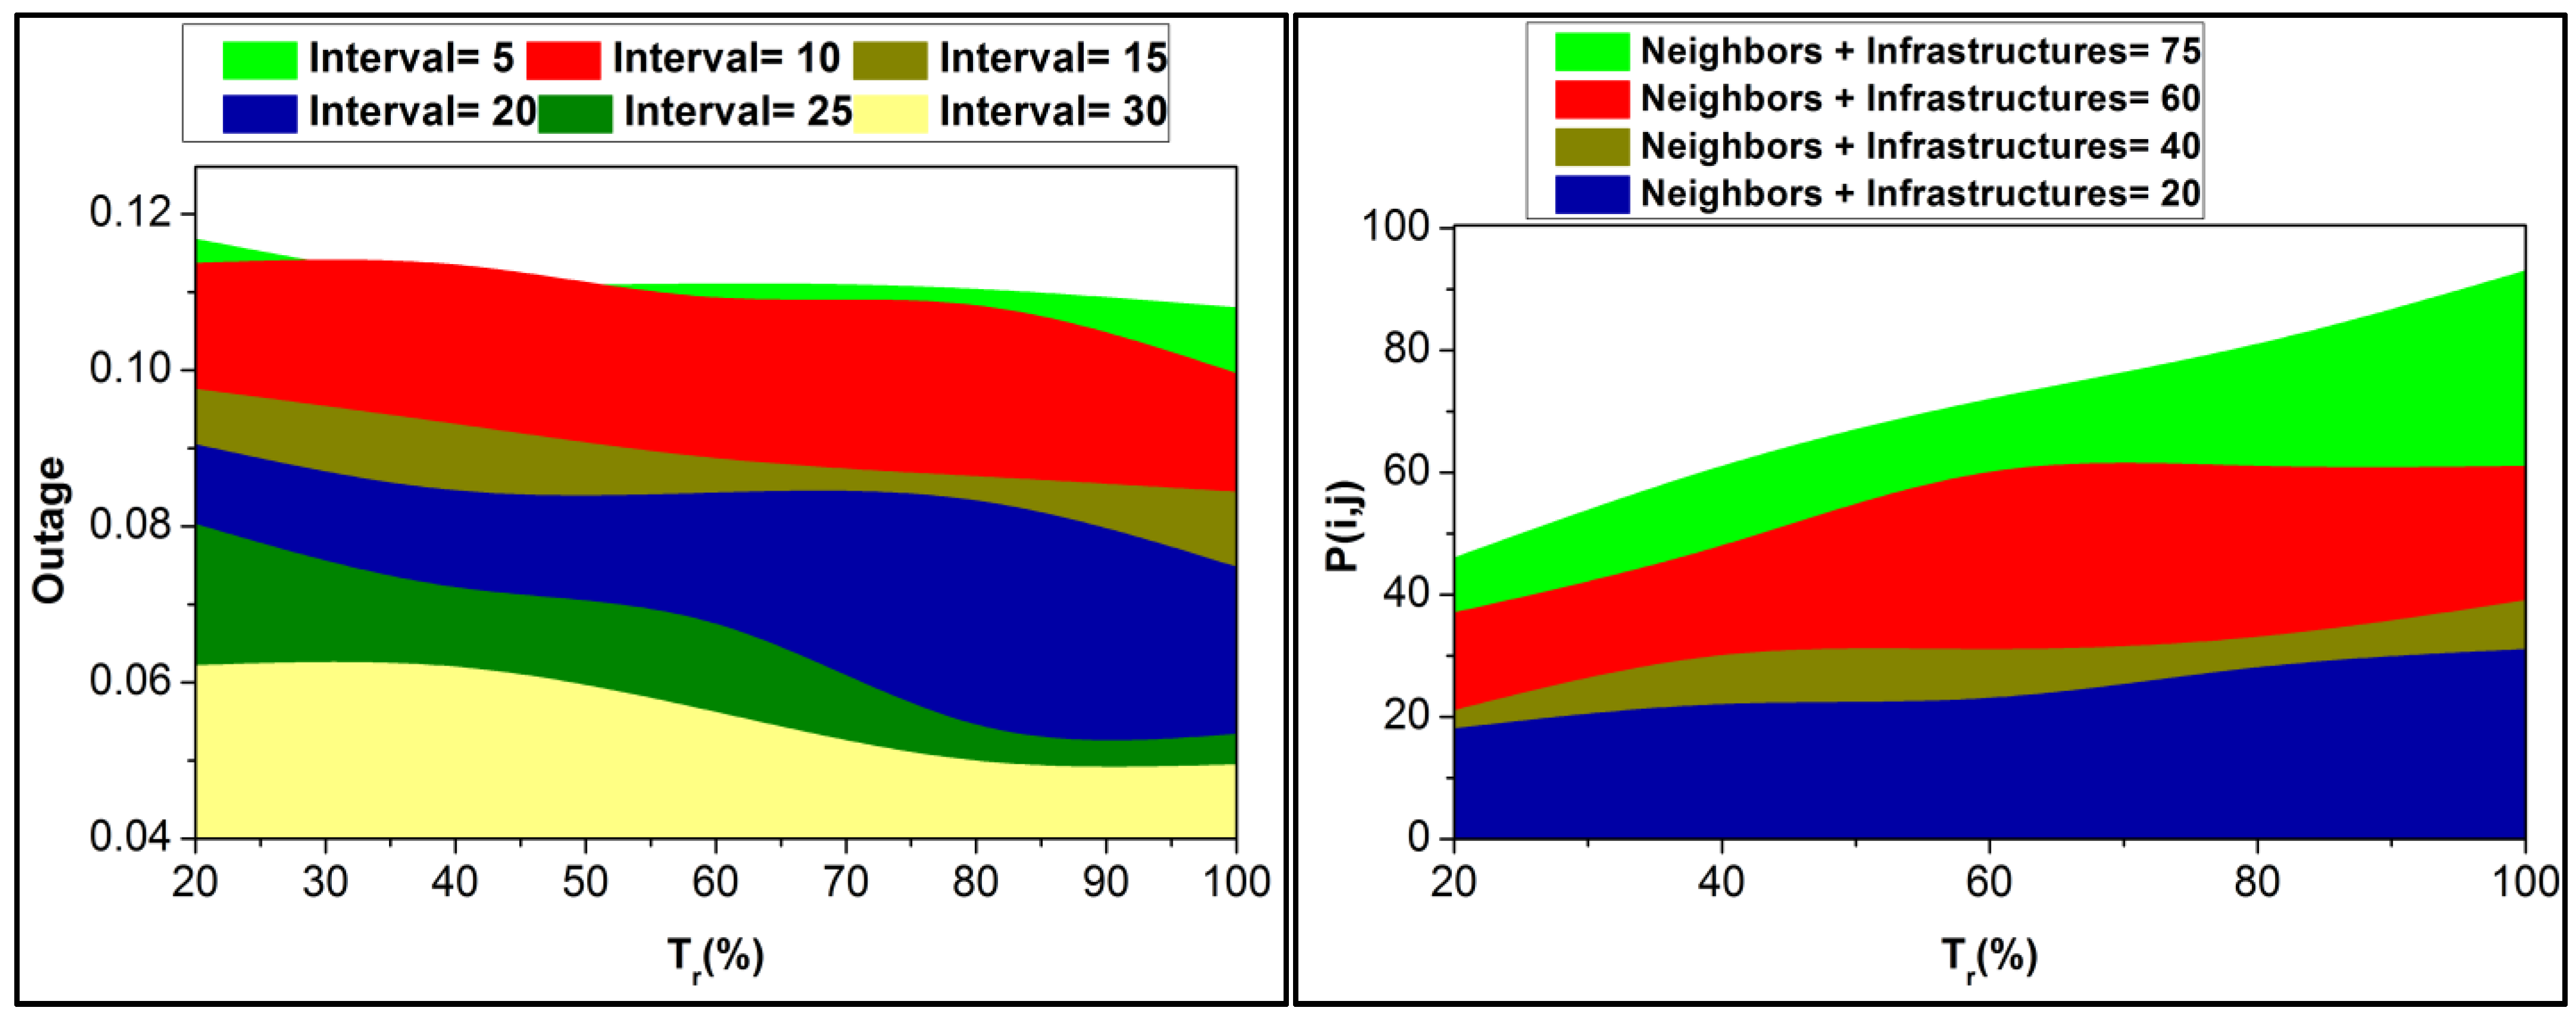
5. Results and Discussion
5.1. False Rate
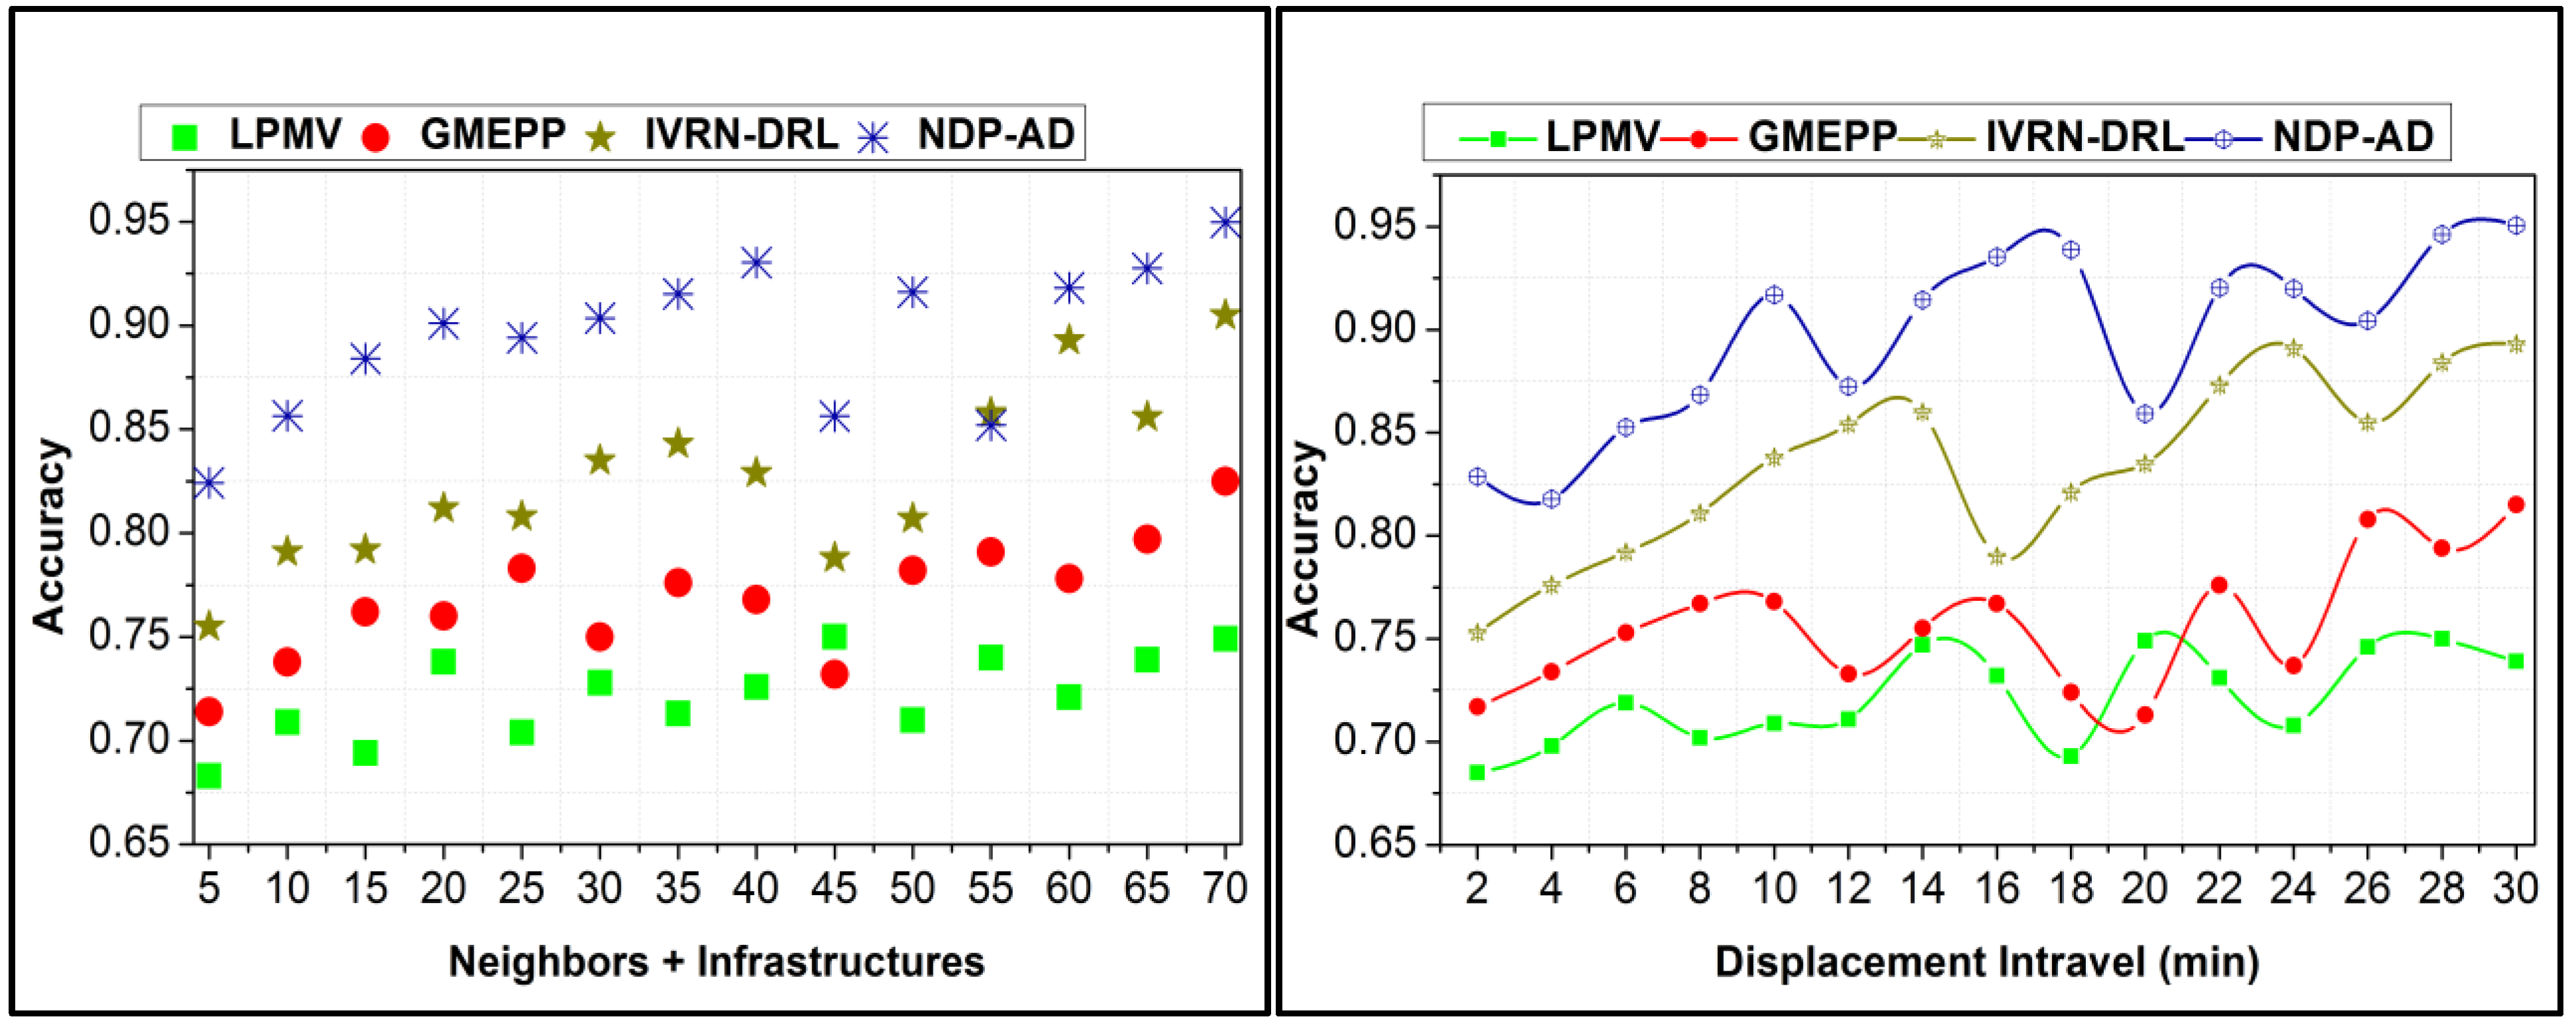
5.2. Accuracy
5.3. Data Utilisation
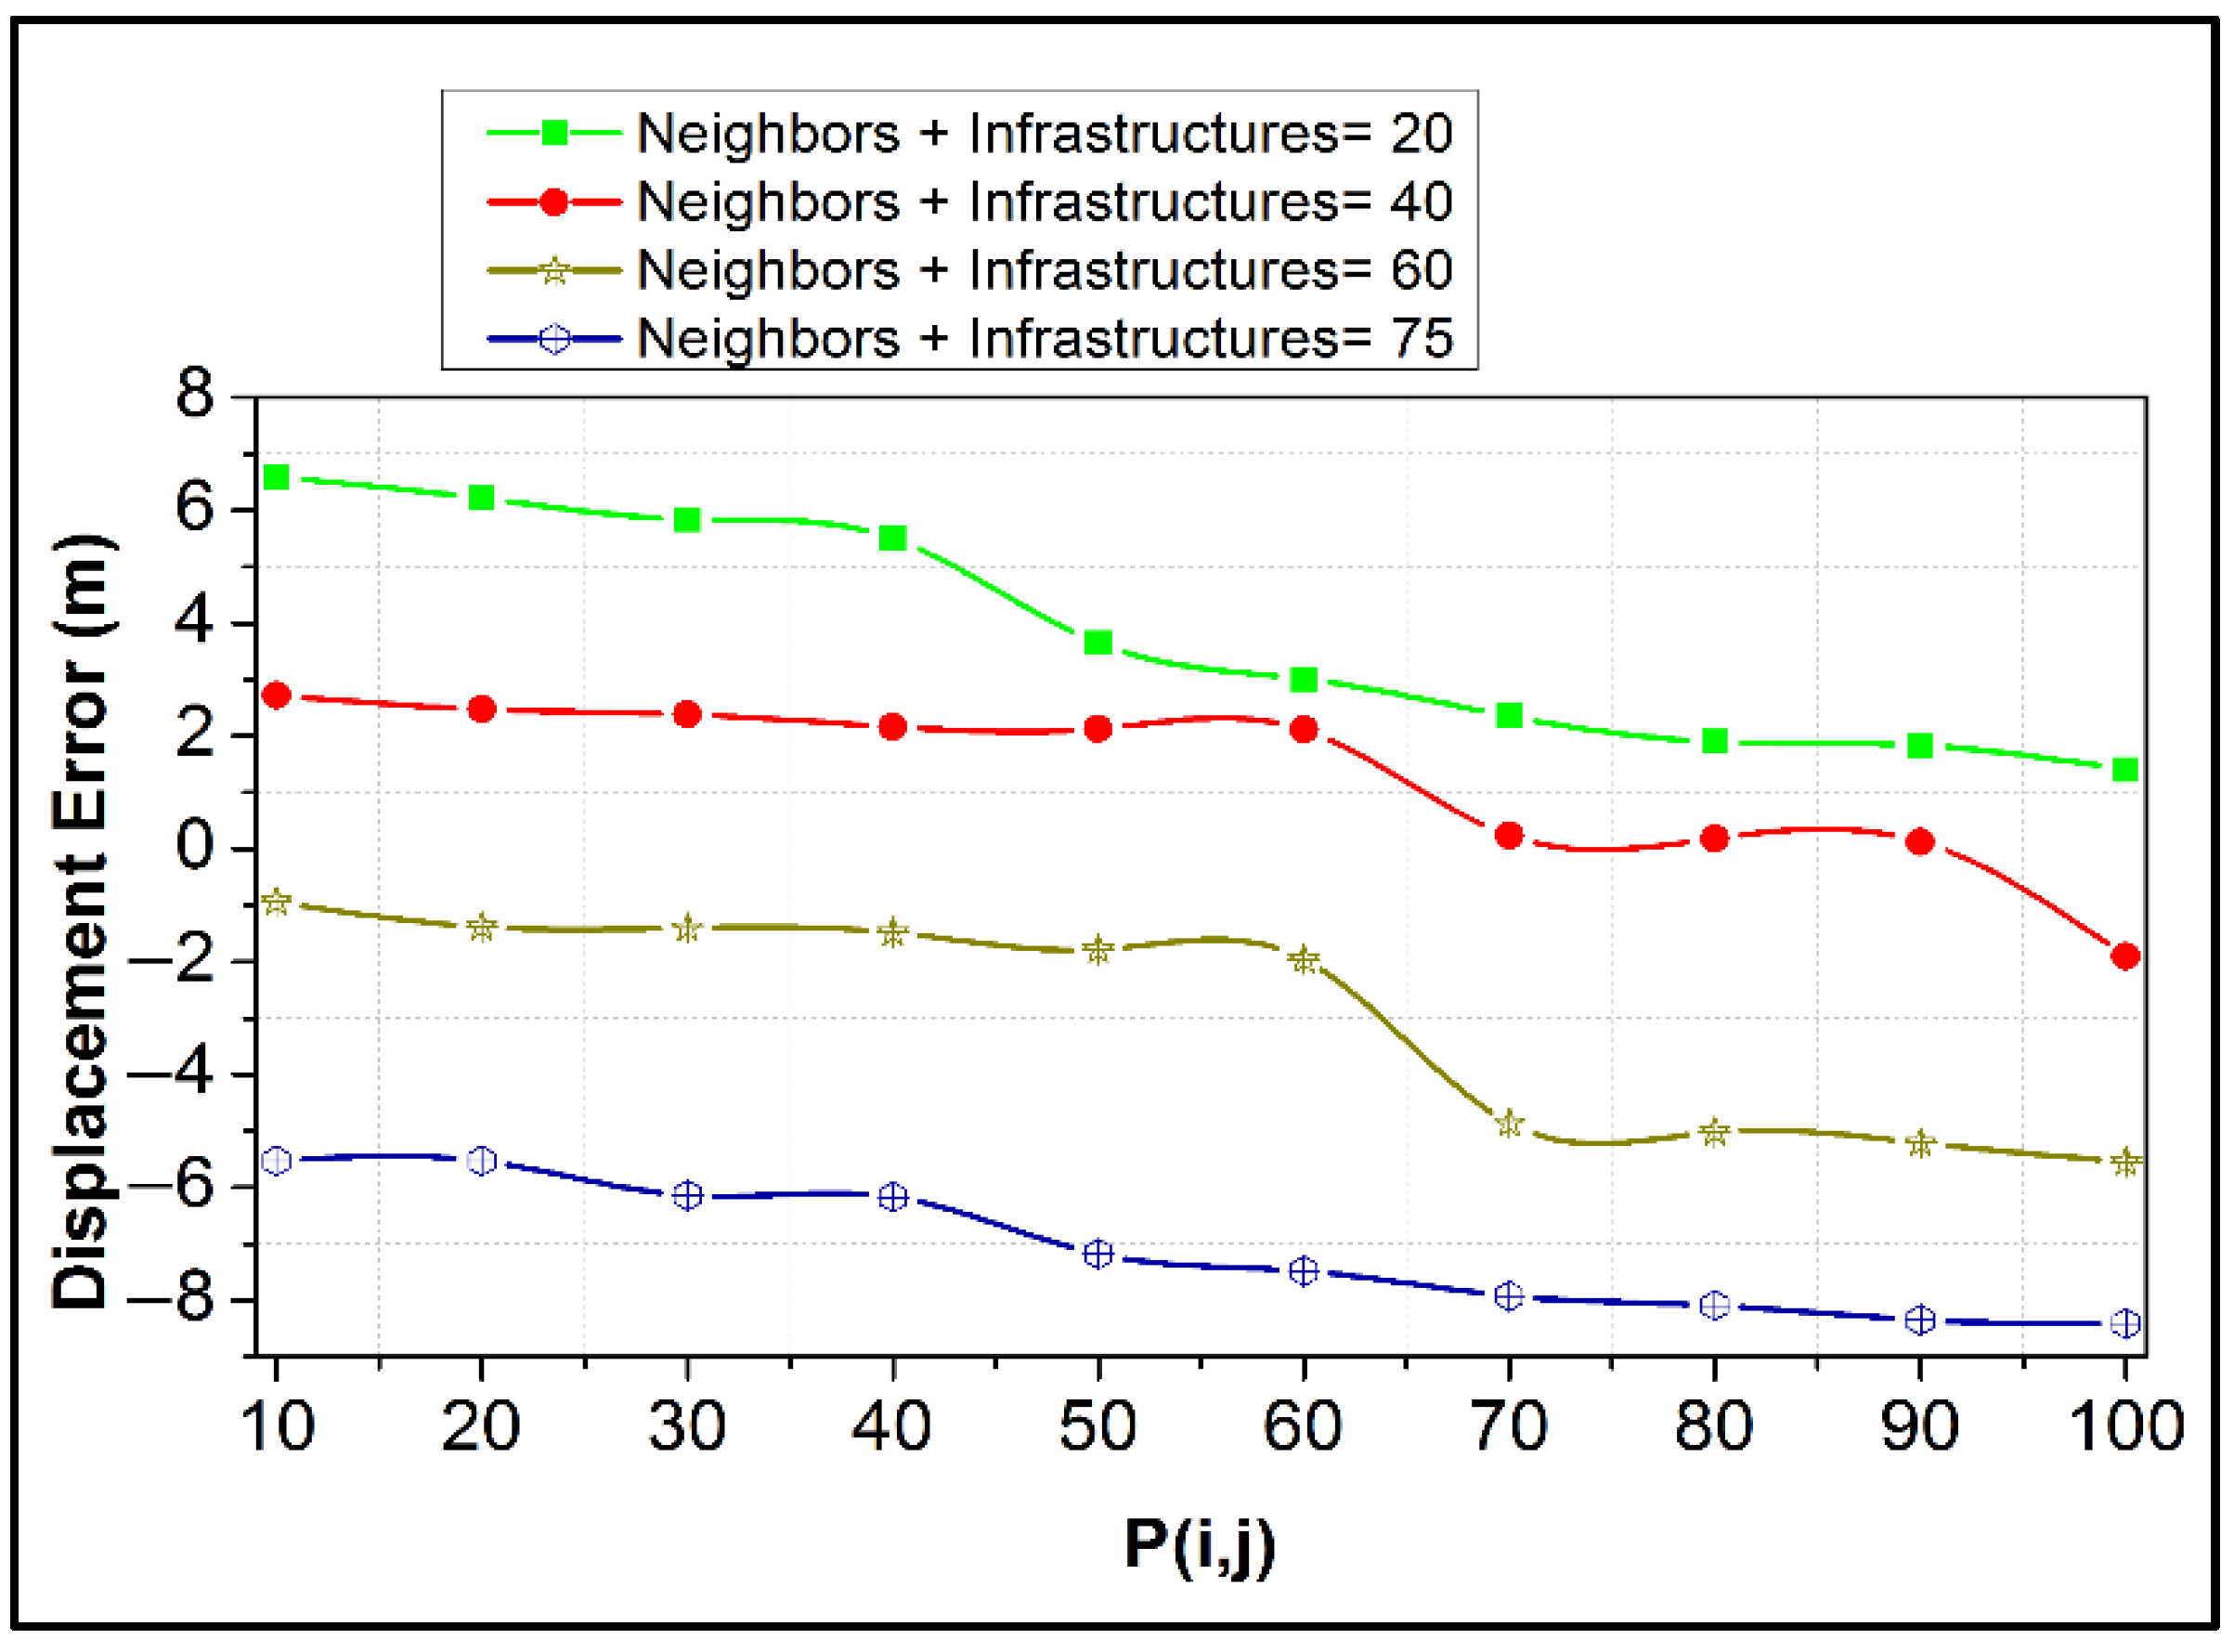
5.4. Displacement Error
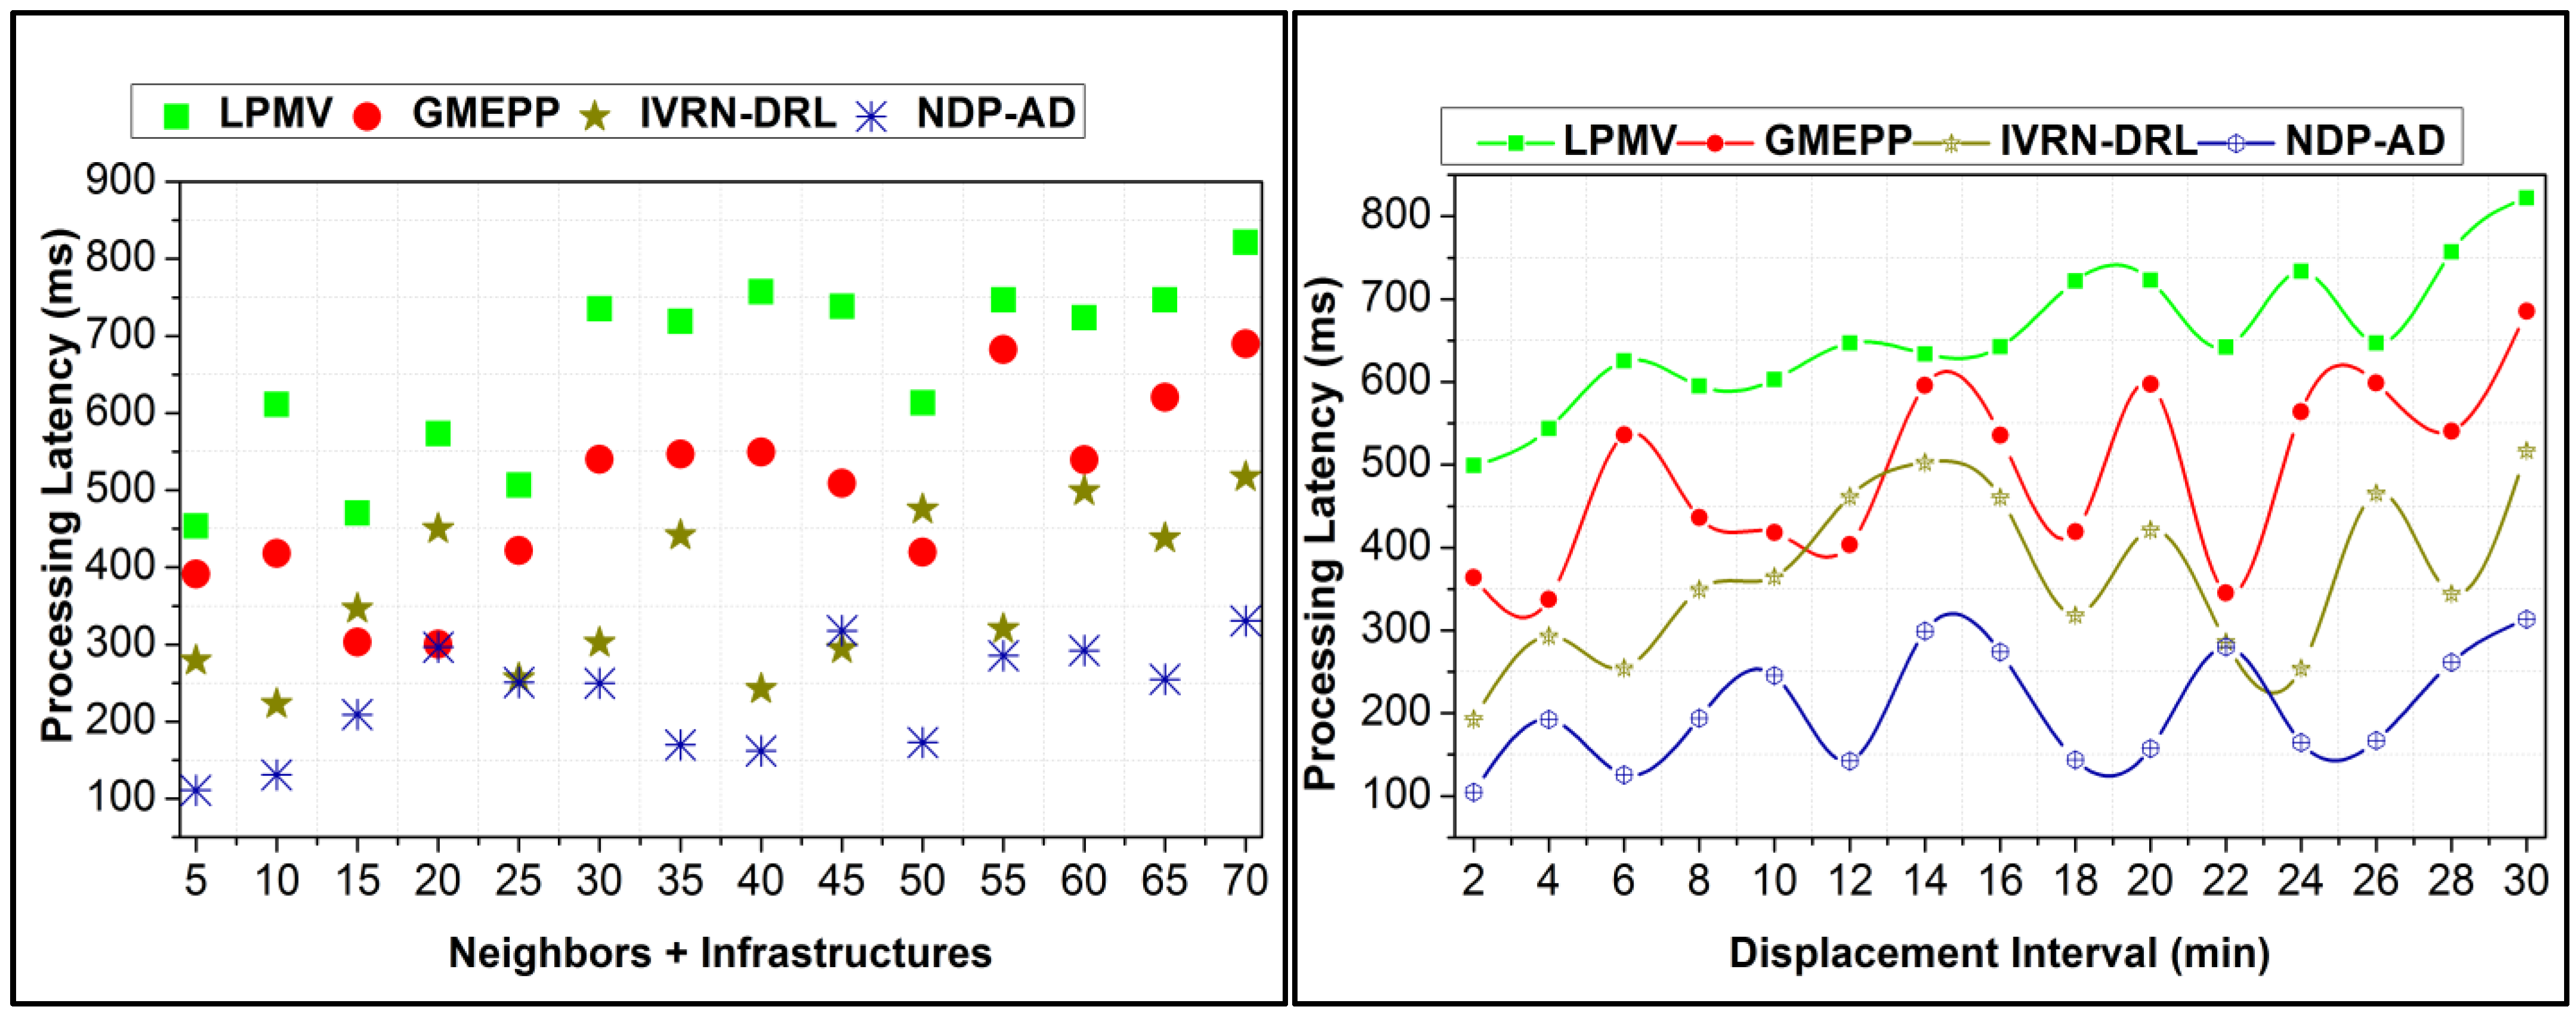
5.5. Processing Latency
6. Conclusions
Author Contributions
Funding
Conflicts of Interest
References
- Rosayyan, P.; Subramaniam, S.; Ganesan, S.I. Decentralised Emergency Service Vehicle Pre-Emption System Using RF Communication and GNSS-Based Geo-Fencing. IEEE Trans. Intell. Transp. Syst. 2020, 22, 7726–7735. [Google Scholar] [CrossRef]
- Humagain, S.; Sinha, R.; Lai, E.; Ranjitkar, P. A systematic review of route optimisation and pre-emption methods for emergency vehicles. Transp. Rev. 2020, 40, 35–53. [Google Scholar]
- Zhao, H.T.; Zhao, X.; Jian-cheng, L.; Xin, L.Y. Cellular automata model for Urban Road traffic flow Considering Internet of Vehicles and emergency vehicles. J. Comput. Sci. 2020, 47, 101221. [Google Scholar]
- Wu, J.; Kulcsár, B.; Ahn, S.; Qu, X. Emergency vehicle lane pre-clearing: From microscopic cooperation to routing decision making. Transp. Res. Part B Methodol. 2020, 141, 223–239. [Google Scholar] [CrossRef]
- Park, J.; Kim, D.; Huh, K. Emergency collision avoidance by steering in critical situations. Int. J. Automot. Technol. 2021, 22, 173–184. [Google Scholar]
- Rahman, M.M.; Islam, M.K.; Al-Shayeb, A.; Arifuzzaman, M. Towards sustainable road safety in Saudi Arabia: Exploring traffic accident causes associated with driving behavior using a Bayesian belief network. Sustainability 2022, 14, 6315. [Google Scholar]
- Alyavina, E.; Nikitas, A.; Njoya, E.T. Mobility as a service and sustainable travel behaviour: A thematic analysis study. Transp. Res. Part F Traffic Psychol. Behav. 2020, 73, 362–381. [Google Scholar]
- Ahmed, H.U.; Huang, Y.; Lu, P.; Bridgelall, R. Technology Developments and Impacts of Connected and Autonomous Vehicles: An Overview. Smart Cities 2022, 5, 382–404. [Google Scholar]
- Parekh, D.; Poddar, N.; Rajpurkar, A.; Chahal, M.; Kumar, N.; Joshi, G.P.; Cho, W. A Review on Autonomous Vehicles: Progress, Methods and Challenges. Electronics 2022, 11, 2162. [Google Scholar]
- Farsimadan, E.; Palmieri, F.; Moradi, L.; Conte, D.; Paternoster, B. Vehicle-to-everything (V2X) communication scenarios for vehicular ad-hoc networking (VANET): An overview. In International Conference on Computational Science and Its Applications; Springer: Cham, Switzerland, 2021; pp. 15–30. [Google Scholar]
- Motienko, A. Integration of information and communication system for public health data collection and intelligent transportation system in large city. Transp. Res. Procedia 2020, 50, 466–472. [Google Scholar]
- Liu, Y.; Liu, Y. A Data Fusion Model for Millimeter-Wave Radar and Vision Sensor in Advanced Driving Assistance System. Int. J. Automot. Technol. 2021, 22, 1695–1709. [Google Scholar] [CrossRef]
- Yan, L.; Gong, Y.; Chen, Z.; Li, Z.; Guo, J. Automatic identification method for driving risk status based on multi-sensor data. Pers. Ubiquitous Comput. 2021, 1–17. [Google Scholar] [CrossRef]
- Park, K.; Kwahk, J.; Han, S.H.; Song, M.; Choi, D.G.; Jang, H.; Jeong, I.S. Modelling the intrusive feelings of advanced driver assistance systems based on vehicle activity log data: Case study for the lane keeping assistance system. Int. J. Automot. Technol. 2019, 20, 455–463. [Google Scholar]
- Wu, J.; Wang, J.; Chen, Q.; Yuan, Z.; Zhou, P.; Wang, X.; Fu, C. Resource Allocation for Delay-sensitive Vehicle-to-Multi-Edges (V2Es) Communications in Vehicular Networks: A Multi-Agent Deep Reinforcement Learning Approach. IEEE Trans. Netw. Sci. Eng. 2021, 8, 1873–1886. [Google Scholar] [CrossRef]
- Fehér, Á.; Aradi, S.; Bécsi, T. Hierarchical evasive path planning using reinforcement learning and model predictive control. IEEE Access 2020, 8, 187470–187482. [Google Scholar]
- Ahamed, N.N.; Karthikeyan, P. A Reinforcement Learning Integrated in Heuristic search method for self-driving vehicle using blockchain in supply chain management. Int. J. Intell. Netw. 2020, 1, 92–101. [Google Scholar]
- Mastalerz, M.W.; Malinowski, A.; Kwiatkowski, S.; Śniegula, A.; Wieczorek, B. Passenger BIBO detection with IoT support and machine learning techniques for intelligent transport systems. Procedia Comput. Sci. 2020, 176, 3780–3793. [Google Scholar] [CrossRef]
- Bautista-Montesano, R.; Bustamante-Bello, R.; Ramirez-Mendoza, R.A. Explainable navigation system using fuzzy reinforcement learning. Int. J. Interact. Des. Manuf. 2020, 14, 1411–1428. [Google Scholar]
- Halim, Z.; Sulaiman, M.; Waqas, M.; Aydın, D. Deep neural network-based identification of driving risk utilising driver dependent vehicle driving features: A scheme for critical infrastructure protection. J. Ambient. Intell. Humaniz. Comput. 2022, 1–19. [Google Scholar]
- Yang, B.; Ding, Z.; Yuan, L.; Yan, J.; Guo, L.; Cai, Z. A novel urban emergency path planning method based on vector grid map. IEEE Access 2020, 8, 154338–154353. [Google Scholar] [CrossRef]
- Zhao, Z.; Zhou, L.; Luo, Y.; Li, K. Emergency steering evasion assistance control based on driving behavior analysis. IEEE Trans. Intell. Transp. Syst. 2018, 20, 457–475. [Google Scholar] [CrossRef]
- Wang, Z.; Zlatanova, S. Safe route determination for first responders in the presence of moving obstacles. IEEE Trans. Intell. Transp. Syst. 2019, 21, 1044–1053. [Google Scholar]
- Deng, H.; Zhao, Y.; Feng, S.; Wang, Q.; Lin, F. Shared Control for Intelligent Vehicle Based on Handling Inverse Dynamics and Driving Intention. IEEE Trans. Veh. Technol. 2022, 71, 2706–2720. [Google Scholar] [CrossRef]
- Bylykbashi, K.; Qafzezi, E.; Ampririt, P.; Ikeda, M.; Matsuo, K.; Barolli, L. Effect of vehicle technical condition on real-time driving risk management in Internet of Vehicles: Design and performance evaluation of an integrated fuzzy-based system. Internet Things 2021, 13, 100363. [Google Scholar]
- Koh, S.; Zhou, B.; Fang, H.; Yang, P.; Yang, Z.; Yang, Q.; Ji, Z. Real-time deep reinforcement learning based vehicle navigation. Appl. Soft Comput. 2020, 96, 106694. [Google Scholar] [CrossRef]
- Patel, R.; Mange, S.; Mulik, S.; Mehendale, N. AI based emergency vehicle priority system. CCF Trans. Pervasive Comput. Interact. 2022, 4, 285–297. [Google Scholar] [CrossRef]
- Gaikwad, M.J.; Sengar, P.P.; Miglani, P.N. An IoT-Based Support System for Cars in Case of Critical Health Emergency. SN Comput. Sci. 2021, 2, 140. [Google Scholar]
- Wang, X.; Qi, X.; Wang, P.; Yang, J. Decision making framework for autonomous vehicles driving behavior in complex scenarios via hierarchical state machine. Auton. Intell. Syst. 2021, 1, 10. [Google Scholar]
- Papaioannou, S.; Kolios, P.; Theocharides, T.; Panayiotou, C.G.; Polycarpou, M.M. Towards Automated 3D Search Planning for Emergency Response Missions. J. Intell. Robot. Syst. 2021, 103, 2. [Google Scholar]
- Yang, G.; Yao, Y. Vehicle local path planning and time consistency of unmanned driving system based on convolutional neural network. Neural Comput. Appl. 2021, 34, 12385–12398. [Google Scholar]
- Oubbati, O.S.; Atiquzzaman, M.; Lorenz, P.; Baz, A.; Alhakami, H. SEARCH: An SDN-enabled approach for vehicle path-planning. IEEE Trans. Veh. Technol. 2020, 69, 14523–14536. [Google Scholar]
- Cheng, J.; Yan, H.; Zhou, A.; Liu, C.; Cheng, D.; Gao, S.; Cheng, D. Location prediction model based on the Internet of vehicles for assistance to medical vehicles. IEEE Access 2019, 8, 10754–10767. [Google Scholar]
- Cui, Q.; Ding, R.; Wei, C.; Zhou, B. A hierarchical framework of emergency collision avoidance amid surrounding vehicles in highway driving. Control. Eng. Pract. 2021, 109, 104751. [Google Scholar] [CrossRef]


| Metrics | LPMV | GMEPP | IVRN-DRL | NDP-AD | Findings |
|---|---|---|---|---|---|
| False Rate | 0.104 | 0.093 | 0.071 | 0.0462 | 12.94% Less |
| Accuracy | 0.749 | 0.825 | 0.905 | 0.9498 | 12.35% High |
| Data Utilization (%) | 67.93 | 78.71 | 87.11 | 98.345 | 10.21% High |
| Displacement Error (m) | 7.3 | 3.21 | −1.14 | −5.87 | 8.65% Less |
| Processing Latency (ms) | 821.53 | 689.98 | 517.41 | 330.598 | 8.52% Less |
| Metrics | LPMV | GMEPP | IVRN-DRL | NDP-AD | Findings |
|---|---|---|---|---|---|
| False Rate | 0.105 | 0.096 | 0.073 | 0.0466 | 13.42% Less |
| Accuracy | 0.739 | 0.815 | 0.893 | 0.9506 | 13.49% High |
| Data Utilization (%) | 68.45 | 79.96 | 87.15 | 97.482 | 9.48% High |
| Displacement Error (m) | 7.25 | 2.59 | −1.68 | −5.201 | 8.74% Less |
| Processing Latency (ms) | 822.21 | 685.45 | 517.12 | 313.608 | 8.92% Less |
Disclaimer/Publisher’s Note: The statements, opinions and data contained in all publications are solely those of the individual author(s) and contributor(s) and not of MDPI and/or the editor(s). MDPI and/or the editor(s) disclaim responsibility for any injury to people or property resulting from any ideas, methods, instructions or products referred to in the content. |
© 2023 by the authors. Licensee MDPI, Basel, Switzerland. This article is an open access article distributed under the terms and conditions of the Creative Commons Attribution (CC BY) license (https://creativecommons.org/licenses/by/4.0/).
Share and Cite
Anjum, M.; Shahab, S. Emergency Vehicle Driving Assistance System Using Recurrent Neural Network with Navigational Data Processing Method. Sustainability 2023, 15, 3069. https://doi.org/10.3390/su15043069
Anjum M, Shahab S. Emergency Vehicle Driving Assistance System Using Recurrent Neural Network with Navigational Data Processing Method. Sustainability. 2023; 15(4):3069. https://doi.org/10.3390/su15043069
Chicago/Turabian StyleAnjum, Mohd, and Sana Shahab. 2023. "Emergency Vehicle Driving Assistance System Using Recurrent Neural Network with Navigational Data Processing Method" Sustainability 15, no. 4: 3069. https://doi.org/10.3390/su15043069
APA StyleAnjum, M., & Shahab, S. (2023). Emergency Vehicle Driving Assistance System Using Recurrent Neural Network with Navigational Data Processing Method. Sustainability, 15(4), 3069. https://doi.org/10.3390/su15043069