
Analyzing Green Behavior and the Rational Use of Water in Portuguese Higher Education Campi

 ,
,  ,
,  ,
,  ,
,  ,
,  , and
, and 
Abstract
:1. Introduction
2. Methodology
2.1. Data Collection and Sample
2.2. Survey Design and Procedures
2.3. Data Treatment and Statistical Analysis
- Campus area per person (m2/person);
- Covered area per person (m2/person);
- Total built area per person (m2/person);
- Total green area per person (m2/person).
- Consumption per capita (L/(person·day));
- Consumption per total area (L/(m2·day));
- Consumption per green area (L/(m2·day));
- Consumption per total covered area (m3/(m2·year));
- Consumption per ground floor area of buildings (m3/(m2·year)).
3. Results and Discussion
3.1. Water Efficiency Indicators
3.2. Good Practices, Curriculum and Dissemination
3.3. Cluster Analysis
4. Conclusions
Author Contributions
Funding
Institutional Review Board Statement
Informed Consent Statement
Data Availability Statement
Acknowledgments
Conflicts of Interest
References
- Guterres, A. Progress towards the Sustainable Development Goals: Report of the Secretary-General. Econ. Soc. Counc. U. N. 2022, 2017, 1–29. [Google Scholar]
- Pinho, H.J.O.; Mateus, D.M.R. Sustainable production of reclaimed water by constructed wetlands for combined irrigation and microalgae cultivation applications. Hydrology 2021, 8, 30. [Google Scholar] [CrossRef]
- Somoza-Tornos, A.; Rives-Jiménez, M.; Espuña, A.; Graells, M. A Circular Economy Approach to the Design of a Water Network Targeting the Use of Regenerated Water. Comput. Aided Chem. Eng. 2019, 47, 119–124. [Google Scholar] [CrossRef]
- Rebelo, A.; Quadrado, M.; Franco, A.; Lacasta, N.; Machado, P. Water reuse in Portugal: New legislation trends to support the definition of water quality standards based on risk characterization. Water Cycle 2020, 1, 41–53. [Google Scholar] [CrossRef]
- McDonald, D.A.; Marois, T.; Spronk, S. Public Banks + Public Water = SDG 6? Water Altern. 2021, 14, 117–134. [Google Scholar]
- UN-Water. Financing Water and Sanitation Facts and Figures. Available online: https://www.unwater.org/water-facts/financing-water-and-sanitation (accessed on 21 November 2022).
- Wiegleb, V.; Bruns, A. Hydro-social arrangements and paradigmatic change in water governance: An analysis of the sustainable development goals (SDGs). Sustain. Sci. 2018, 13, 1155–1166. [Google Scholar] [CrossRef]
- Mateus, D.M.R.; Costa, M.C.O.; Gomes, M.M.M.S.; Pinho, H.J.O. Promoting Education for Sustainable Development: A Collaborative Project Between a Higher Education Institution and the Surrounding School Community. In Handbook of Best Practices in Sustainable Development at University Level; de Vasconcelos, C.R.P., Ed.; Springer: Cham, Switzerland, 2022; pp. 411–433. [Google Scholar]
- APA. Avaliação das Disponibilidades Hídricas Atuais e Futuras e Aplicação do Índice de Escassez WEI+. 2021. [Online]. Available online: https://participa.pt/contents/consultationdocument/EstudoWEI_7122021.pdf (accessed on 21 November 2022).
- IPMA. Seca e Desertificação em Portugal. 2020. Available online: https://www.ipma.pt/pt/media/noticias/news.detail.jsp?f=/pt/media/noticias/arquivo/2020/seca_desertificacao_portugal_062020 (accessed on 21 November 2022).
- Ribeiro, J.M.P.; Hoeckesfeld, L.; Dal Magro, C.B.; Favretto, J.; Barichello, R.; Lenzi, F.C.; Secchi, L.; Lima, C.R.M.; Gerra, J.B.S.O.A. Green Campus Initiatives as sustainable development dissemination at higher education institutions: Students’ perceptions. J. Clean. Prod. 2021, 12, 127671. [Google Scholar] [CrossRef]
- Bautista-Puig, N.; Sanz-Casado, E. Sustainability practices in Spanish higher education institutions: An overview of status and implementation. J. Clean. Prod. 2021, 295, 126320. [Google Scholar] [CrossRef]
- Thomashow, M. The Nine Elements of a Sustainable; The MIT Press: Cambridge, MA, USA, 2014. [Google Scholar]
- Raposo, A.; Durão, A.; Piedade, A.; Almeida, G.; Xavier, M.; Rodeia, J. What Futures for Education? An Answer to the Challenge Launched by UNESCO. In Proceedings of the 11th International Conference The Future of Education, Florence, Italy, 1–2 July 2021; pp. 355–359. [Google Scholar] [CrossRef]
- UNESCO (Ed.) Reimagining Our Futures Together: A New Social Contract for Education; UNESCO; Paris, France, 2021; Available online: http://www.unesco.org/open-access/terms-use-ccbysa-en (accessed on 21 November 2022).
- Illankoon, I.M.C.S.; Tam, V.W.Y.; Le, K.N.; Shen, L. Key credit criteria among international green building rating tools. J. Clean. Prod. 2017, 164, 209–220. [Google Scholar] [CrossRef]
- Silvius, G. Sustainability as a new school of thought in project management. J. Clean. Prod. 2017, 166, 1479–1493. [Google Scholar] [CrossRef]
- Sugiarto, A.; Lee, C.W.; Huruta, A.D. A Systematic Review of the Sustainable Campus Concept. Behav. Sci. 2022, 12, 130. [Google Scholar] [CrossRef] [PubMed]
- Zhao, H.; Xu, Y.; Hong, W.C.; Liang, Y.; Zou, D. Smart evaluation of green campus sustainability considering energy utilization. Sustainability 2021, 13, 7653. [Google Scholar] [CrossRef]
- Amr, A.I.; Kamel, S.; El Gohary, G.; Hamhaber, J. Water as an Ecological Factor for a Sustainable Campus Landscape. Procedia-Soc. Behav. Sci. 2015, 216, 181–193. [Google Scholar] [CrossRef]
- Priyadarshini, P.; Abhilash, P.C. Rethinking of higher education institutions as complex adaptive systems for enabling sustainability governance. J. Clean. Prod. 2022, 359, 132083. [Google Scholar] [CrossRef]
- Al-Hazaima, H.; Al Shbail, M.O.; Alshurafat, H.; Ananzeh, H.; Al Shbeil, S.O. Dataset for integration of sustainability education into the accounting curricula of tertiary education institutions in Jordan. Data Br. 2022, 42, 108224. [Google Scholar] [CrossRef]
- Filho, W.L.; Amaro, N.; Avila, L.V.; Brandli, L.; Damke, L.I.; Vasconcelos, C.R.O.; Hernandez-Dias, P.M.; Frankenberger, F.; Fritzen, B.; Valazquez, L.; et al. Mapping sustainability initiatives in higher education institutions in Latin America. J. Clean. Prod. 2021, 315, 128093. [Google Scholar] [CrossRef]
- Klein, L.L.; Alves, A.C.; Abreu, M.F.; Feltrin, T.S. Lean management and sustainable practices in Higher Education Institutions of Brazil and Portugal: A cross country perspective. J. Clean. Prod. 2022, 342, 130868. [Google Scholar] [CrossRef]
- Bonnet, J.F.; Devel, C.; Faucher, P.; Rotunier, J. Analysis of electricity and water end-uses in university campuses: Case-study of the University of Bordeaux in the framework of the Ecocampus European Collaboration. J. Clean. Prod. 2002, 10, 13–24. [Google Scholar] [CrossRef]
- Marinho, M.; Gonçalves, M.D.S.; Kiperstok, A. Water conservation as a tool to support sustainable practices in a Brazilian public university. J. Clean. Prod. 2014, 62, 98–106. [Google Scholar] [CrossRef]
- Zhou, X.; Yan, J.; Zhu, J.; Cai, P. Survey of energy consumption and energy conservation measures for colleges and universities in Guangdong province. Energy Build. 2013, 66, 112–118. [Google Scholar] [CrossRef]
- Abdelalim, A.; O’Brien, W.; Shi, Z. Visualization of energy and water consumption and GHG emissions: A case study of a Canadian University Campus. Energy Build. 2015, 109, 334–352. [Google Scholar] [CrossRef]
- Almeida, A.P.; Sousa, V.; Silva, C.M. Methodology for estimating energy and water consumption patterns in university buildings: Case study, Federal University of Roraima (UFRR). Heliyon 2021, 7, e08642. [Google Scholar] [CrossRef] [PubMed]
- Wichowski, P.; Rutkowska, G.; Kamiński, N.; Trach, Y. Analysis of water consumption in the campus of Warsaw University of life sciences in years 2012-2016. J. Ecol. Eng. 2019, 20, 193–202. [Google Scholar] [CrossRef]
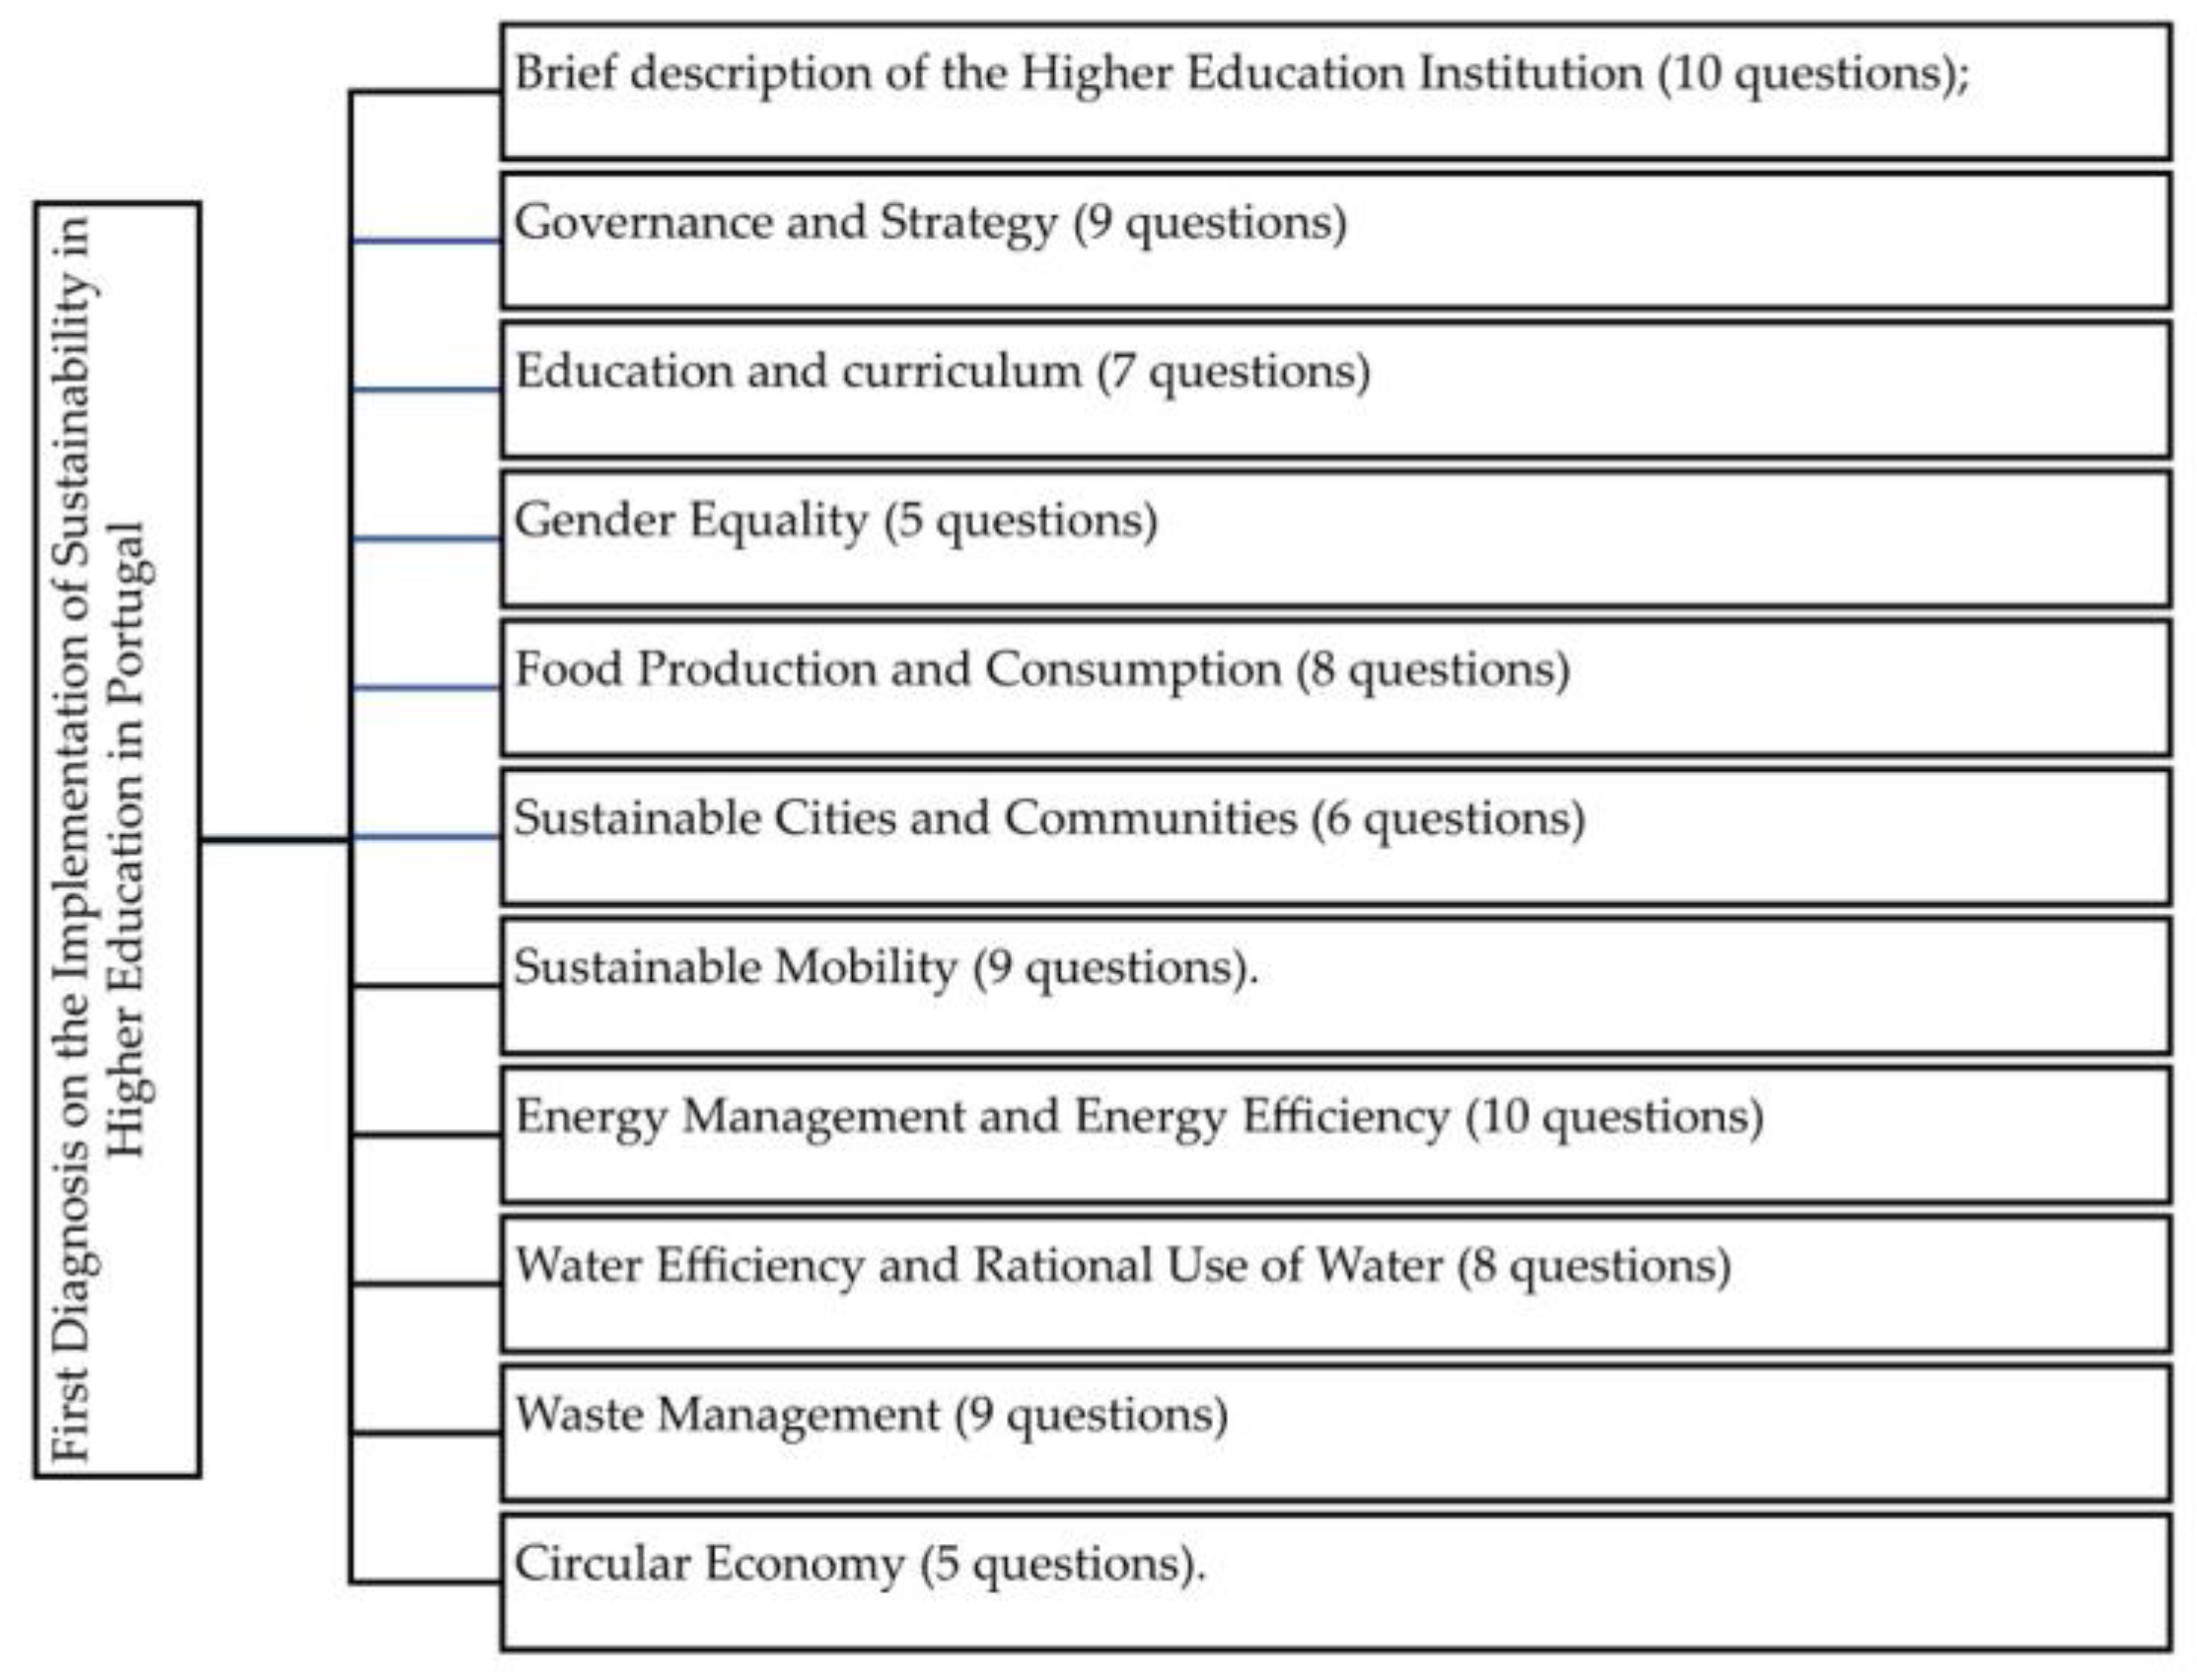
- Rede Campus Sustentável. Primeiro Diagnóstico Sobre Implementação da Sustentabilidade no Ensino Superior em Portugal-Análise dos Resultados de um Inquérito; RCS: Coimbra, Portugal, 2022; ISBN 978-989-33-3247-4. [Google Scholar]
- John, A.A. Köppen Climate Classification. Encyclopedia Britannica. 2022. Available online: https://www.britannica.com/science/Koppen-climate-classification (accessed on 21 November 2022).
- IPMA. Climates Normals. n.d. Available online: https://www.ipma.pt/en/oclima/normais.clima/?print=true (accessed on 19 January 2023).
- Wageningen University & Research. WUR Sustainability Report 2019. 2020. Available online: https://www.wur.nl/nl/show/2019-Sustainability-report.htm (accessed on 21 November 2022).
- Ferreira, J.G.; Matos, M.; Silva, H.; Franca, H.; Duarte, P. Sustainable campus: The experience of the university of lisbon at ist. Sustainability 2021, 13, 8050. [Google Scholar] [CrossRef]
- APA. Programa Nacional para o Uso Eficiente da Água-implementação 2012–2020 (PNUEA). 2012. Available online: https://apambiente.pt/sites/default/files/_SNIAMB_Agua/DRH/PlaneamentoOrdenamento/PlanosGestaoSecaEscassez/PNUEA/PNUEA_2020_Jun2012.pdf (accessed on 19 January 2023).


| Campus | NUTS II 1 | Koppen Climate Classification [32,33] | Age | Other Water Sources | Comments |
|---|---|---|---|---|---|
| 1 | Centro | Csa 2 | 30 | G | Residence, canteen/bar, laboratories, sports facilities |
| 2 | Alentejo | Csa 2 | 20 | L, G | Canteen/bar, laboratory |
| 3 | Área Metropolitana de Lisboa | Csa 2 | 30 | Canteen/bar, laboratories | |
| 4 | Área Metropolitana de Lisboa | Csa 2 | 50 | Canteen/bar, laboratories | |
| 5 | Alentejo | BSk 3 | 16 | G | Canteen/bar, laboratories |
| 6 | Norte | Csb 4 | 30 | G, R | Canteen/bar, laboratories, sports facilities |
| 7 | Área Metropolitana de Lisboa | Csa 2 | 48 | Residence, canteen/bar, laboratories | |
| 8 | Centro | 28 | Canteen/bar | ||
| 9 | Norte | Csb 2 | 30 | G, R | Residence, canteen/bar, laboratories, sports facilities, botanic garden |
| 10 | Norte | Csb 2 | 30 | Residence, canteen/bar, laboratories, sports facilities | |
| 11 | Norte | Csb 2 | 6 | Canteen/bar | |
| 12 | Norte | Csb 2 | 40 | ||
| 13 | Norte | Csb 2 | 13 | Canteen/bar, sports facilities | |
| 14 | Norte | Csb 2 | 10 | Canteen/bar, sports facilities | |
| 15 | Norte | Csb 2 | 50 | G | Residence, canteen/bar, laboratories |
| Objectives | |||
|---|---|---|---|
| Characterization | Infrastructure | Good Practices | Curriculum and Dissemination |
| Number of users (total of teacher, students, and staff) | Description of the water collection and storage infrastructure, if any, and what the collected water is used for. | Are periodic registers of water consumption made? If you answered yes to the previous question, how often? (Hourly; Daily; Weekly; Monthly) | Are there practices to promote water efficiency at the HEI? If you answered yes to the previous question, please describe the most important ones |
| Total area of Campus, | Average age of water supply infrastructure. | How to carry out the monitoring: Manual or Automatic Brief description of the monitoring system. | Is rational water management part of your institution’s curricula? |
| The area of implantation (coverage) and built up area. | Has there been any recent rehabilitation of the infrastructure? If yes, please describe | Are there separate counters in campus buildings? (Yes or No). | How many courses include curricular units with this subject? If you answered yes to the previous question, indicate the courses. Which curricular units contain these contents? |
| Green space area | Is an analysis of invoicing carried out? (Yes or No). Indicate the entity/office responsible for invoice analysis. | Does the HEI promote good practices of water efficiency in the community? If you have answered yes to the previous question, describe the most important ones | |
| Water consumption in 2019 (m3/year) | Are water efficiency assessment indicators calculated? (Yes or No). If you answered yes to the previous one, which ones? | Actions of divulgation and dissemination to the outside of the HEI carried out in the last 5 years. Please describe the initiatives, if any. | |
| What is the origin of the water consumed? (Public water supply: Own water abstraction; Rainfall; Gray water; Others). | Identify the main research projects in the area, carried out in the last 5 years. If there are protocols with companies or water management entities in the last 5 years, identify them. | ||
| Study | Location/School | Climatic Koppen Classification [32] | Year | Per Capita Consumption (L/(Person·day) | Comments |
|---|---|---|---|---|---|
| Bonnet et al. [25] | France | Cfb 1 | 38 | Considers only students but also dorms with 4500 quartos (nearly 10% of the students) | |
| Marinho et al. [26] | Brazil | Af 2 | 1999/2000 2011 | 46.6 26.9 | Implementation of water conservation program: monitoring, leak correction, update cadaster, communication. Nº users increased by 20% |
| Abdelalim et al. [28] | Canada | ET 3 | 39 | ||
| Wichowski et al. [30] | Poland | Cfb 1 | 2015/2016 | 28.1 23.9 | Week consumption Weekend consumption |
| Zhou et al. [27] | China | Cfa 4 | 2006 2010 | 247 211 | Average values for 98 HEIs |
| Almeida et al. [29] | Brazil | Aw 5 | 41 | ||
| WUR, [34] | Netherlands/Wageningen University | Cfb 1 | 2019 | 26 | 10 % reduction in water consumption compared to 2018 |
| Ferreira et al. [35] | Portugal/IST | Csa 6 | 2010 2018 | 30 16 | Monitoring and control from 2012 onwards; intervention in case of leakage; routine inspections. 2010 values considering number of students (30 L/(person·day)) considering total users) |
| Current study | Portugal (15 campi) | 2019 | 12.5 | Average from the 15 campi |
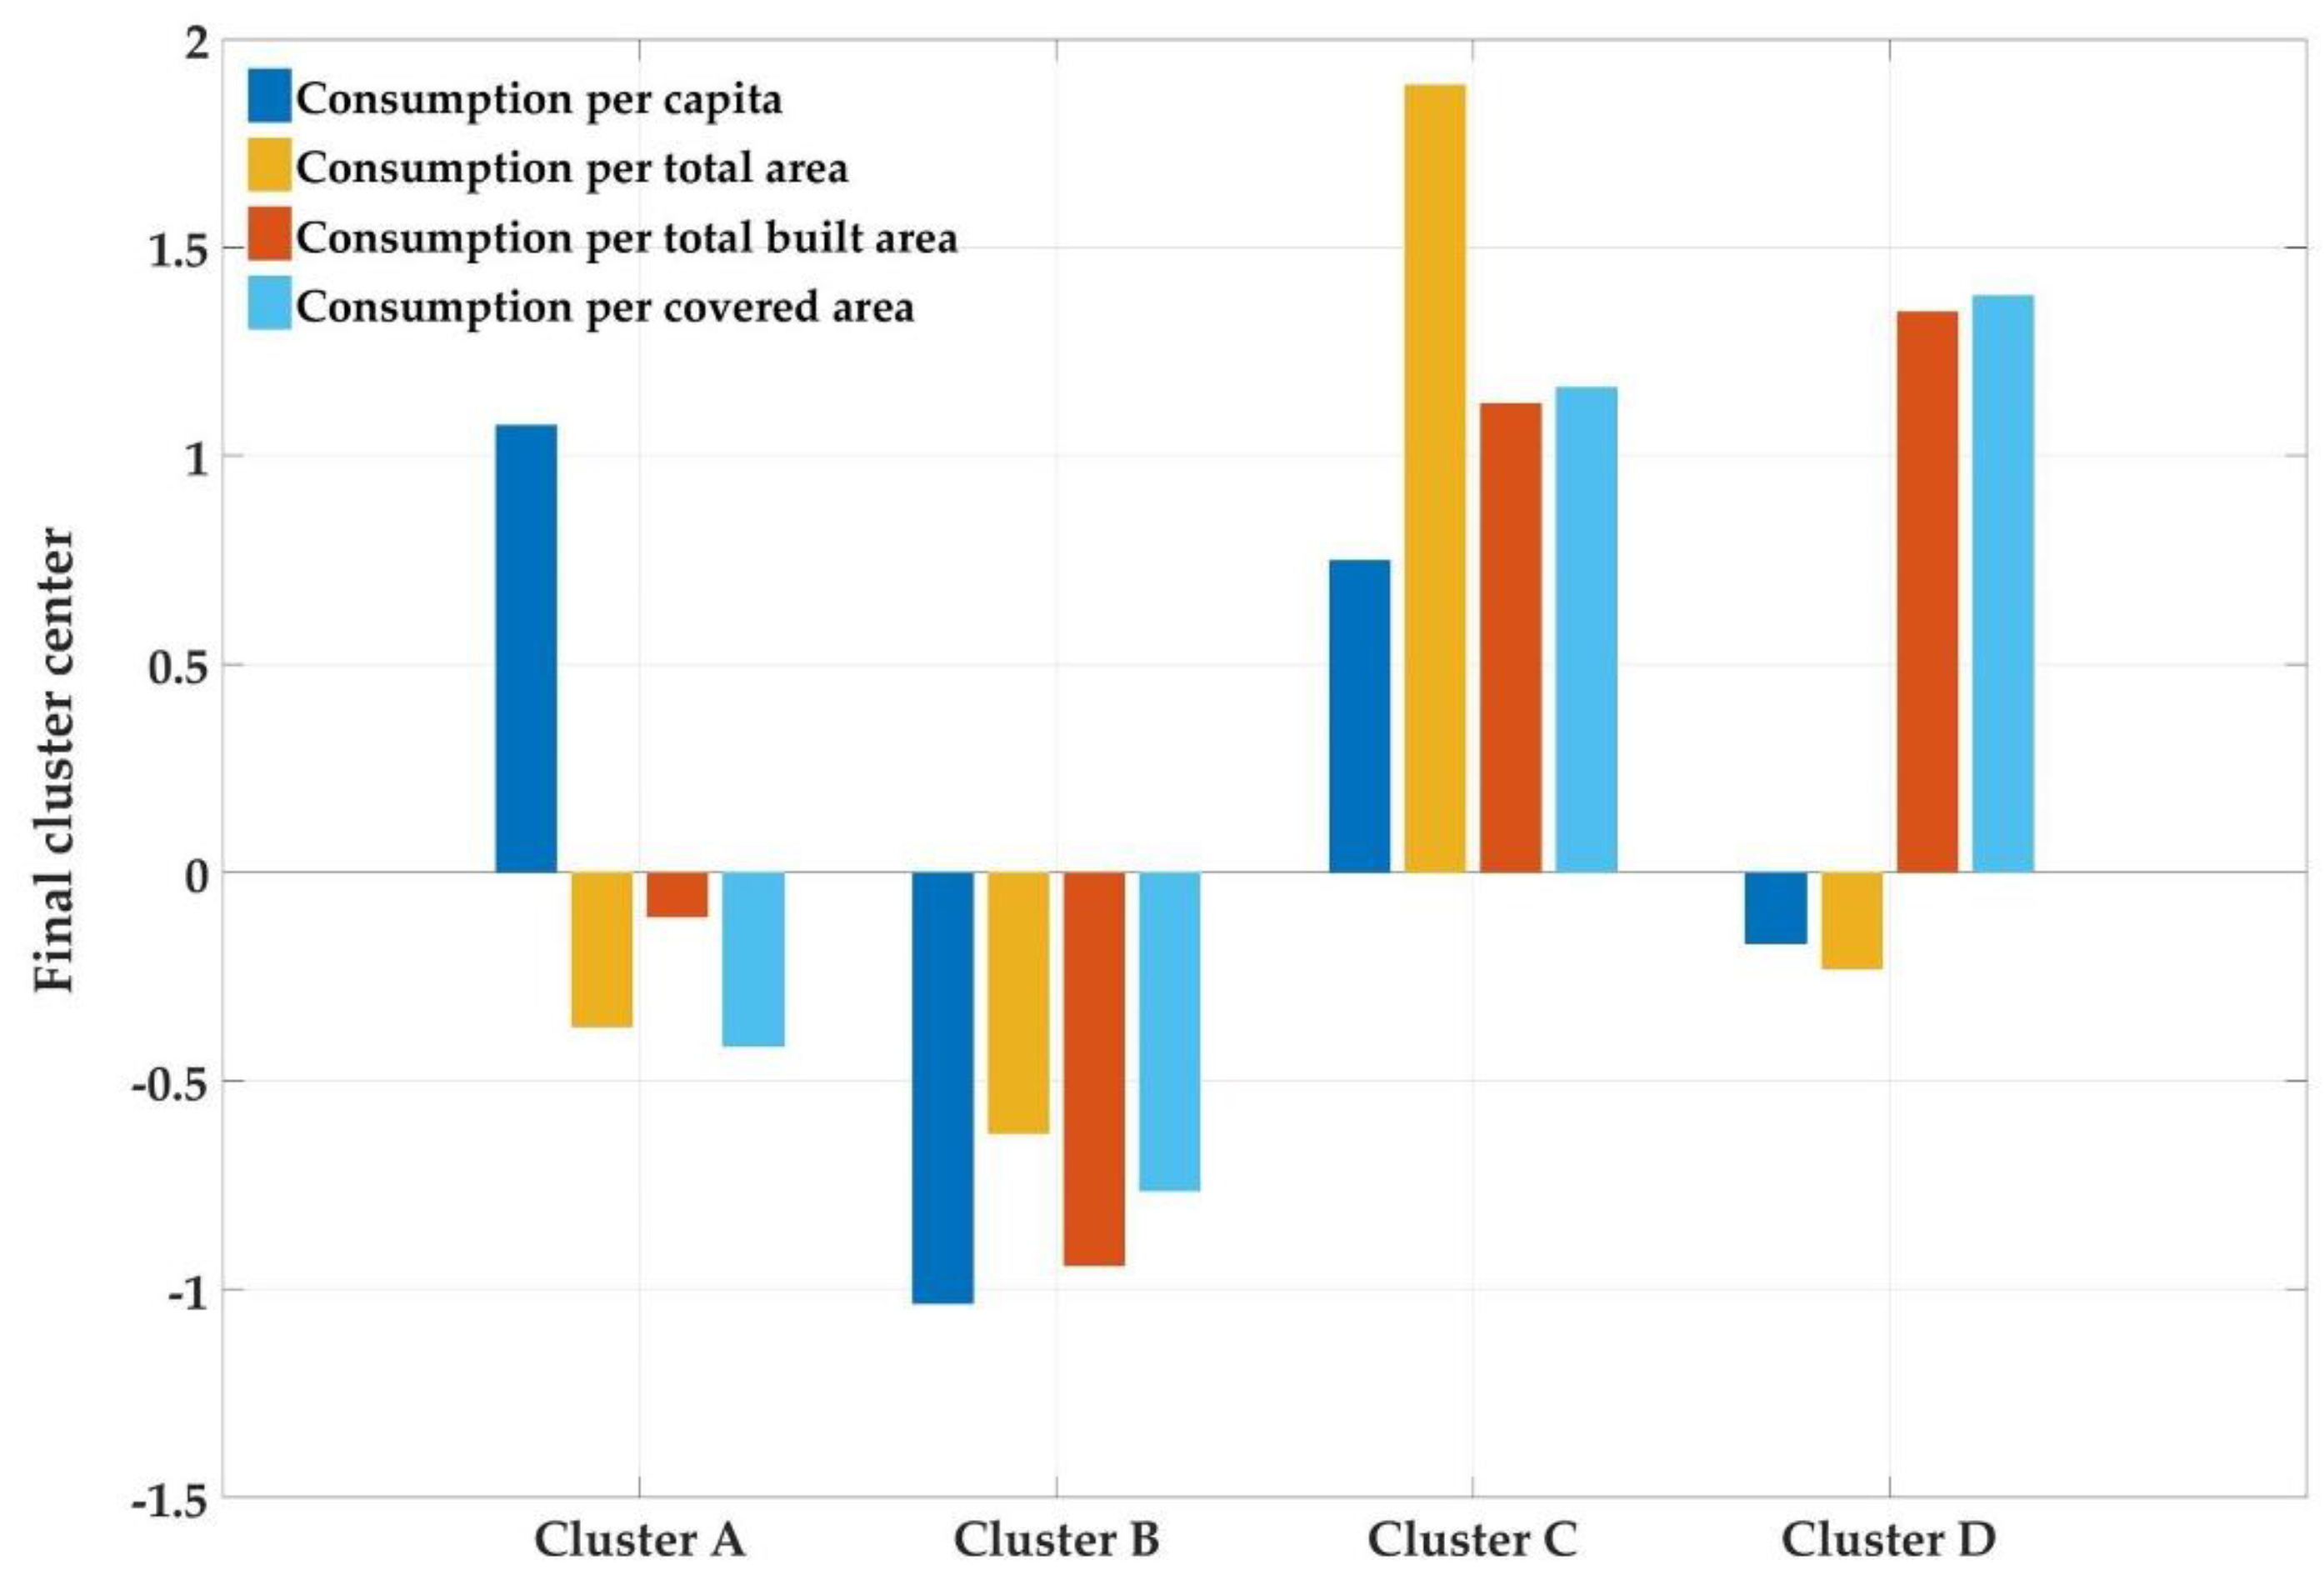
| Campi | 1 | 2 | 3 | 4 | 5 | 6 | 7 | 8 | 9 | 10 | 11 | 12 | 13 | 14 | 15 |
|---|---|---|---|---|---|---|---|---|---|---|---|---|---|---|---|
| Objective—Consumption | A | B | C | C | B | D | C | D | B | A | B | A | B | B | A |
| Objective—Good practices | E | E | G | H | F | E | F | E | E | E | E | E | E | E | E |
Disclaimer/Publisher’s Note: The statements, opinions and data contained in all publications are solely those of the individual author(s) and contributor(s) and not of MDPI and/or the editor(s). MDPI and/or the editor(s) disclaim responsibility for any injury to people or property resulting from any ideas, methods, instructions or products referred to in the content. |
© 2023 by the authors. Licensee MDPI, Basel, Switzerland. This article is an open access article distributed under the terms and conditions of the Creative Commons Attribution (CC BY) license (https://creativecommons.org/licenses/by/4.0/).
Share and Cite
Barreiros, A.M.; Durão, A.; Galvão, A.; Matos, C.; Mateus, D.; Araújo, I.; Neves, L.; Matos, M.; Mourato, S. Analyzing Green Behavior and the Rational Use of Water in Portuguese Higher Education Campi. Sustainability 2023, 15, 3035. https://doi.org/10.3390/su15043035
Barreiros AM, Durão A, Galvão A, Matos C, Mateus D, Araújo I, Neves L, Matos M, Mourato S. Analyzing Green Behavior and the Rational Use of Water in Portuguese Higher Education Campi. Sustainability. 2023; 15(4):3035. https://doi.org/10.3390/su15043035
Chicago/Turabian StyleBarreiros, Ana M., Anabela Durão, Ana Galvão, Cristina Matos, Dina Mateus, Ivo Araújo, Luís Neves, Mário Matos, and Sandra Mourato. 2023. "Analyzing Green Behavior and the Rational Use of Water in Portuguese Higher Education Campi" Sustainability 15, no. 4: 3035. https://doi.org/10.3390/su15043035
APA StyleBarreiros, A. M., Durão, A., Galvão, A., Matos, C., Mateus, D., Araújo, I., Neves, L., Matos, M., & Mourato, S. (2023). Analyzing Green Behavior and the Rational Use of Water in Portuguese Higher Education Campi. Sustainability, 15(4), 3035. https://doi.org/10.3390/su15043035