Article

Investigating the Relationship between Landscape Design Types and Human Thermal Comfort: Case Study of Beijing Olympic Forest Park

Department of Landscape Architecture, College of Architecture and Urban Planning, Beijing University of Civil Engineering and Architecture, Beijing 100044, China
*
Author to whom correspondence should be addressed.
Sustainability 2023, 15(4), 2969; https://doi.org/10.3390/su15042969
Submission received: 24 November 2022 / Revised: 13 January 2023 / Accepted: 23 January 2023 / Published: 6 February 2023
(This article belongs to the Special Issue Air Quality Characterisation and Modelling)

Abstract

:

Simple Summary

Beijing, China, is a megacity with a population of more than 20 million. The hot summer climate and environmental problems caused by urbanization affect the quality of human settlements. Based on the measured data in the Beijing Olympic Forest Park and the analysis of the human body comfort index model, the study concluded that the thermal comfort level of the double-layer plant community area composed of tall deciduous trees such as Sophora japonica and Ginkgo biloba and shrubs or grass native cover plants was higher than that of other areas.

Abstract

Urban green space can improve the local thermal environment and thus the quality of the urban residential environment. Taking the green space of Beijing Olympic Forest Park (BOFP) as an example, this study analysed sample points representing different plant community structures, plant community types, and landscape environments based on 15 years of continuous dynamic measurement and selected typical annual data (from 2020). The study analysed and explained the spatial differentiation characteristics of human thermal comfort (HTC) in green space areas of BOFP using the predicted mean vote (PMV)–predicted percentage dissatisfied (PPD) physical comfort index model, which comprehensively considers both the objective environment and people’s subjective feelings and psychological states. The results showed that the level of HTC in the park’s green space, across community types and across typical landscape environments, differed between areas with different community structures. PMV–PPD mathematical model fitting further verified the above results.

1. Introduction

As urbanisation accelerates, changes in land cover type are reshaping the landscape patterns and physical environments of urban areas. Within built-up urban areas, hard paved surfaces such as roads, large-scale buildings and other structures, and gaseous pollutants and artificial heat discharged by human production and living activities have massively changed the urban thermal environment. In particular, the surface temperature in urban centres is significantly higher than that in the suburbs, which is known as the urban heat island (UHI) effect. The continuous intensification of the UHI effect is not only changing the process of atmospheric circulation between cities and suburbs but also increasing urban energy consumption and atmospheric pollution. This reduces human comfort in the urban environment, which is not conducive to the sustainable development of cities and other human settlements [1,2,3]. Studies of UHIs have focused on three main scales: the urban (including urban region), the landscape, and green space. One urban scale study analysed spatial changes in patterns of temperature in Changsha and their relationships with many related factors, such as natural and human factors, using composite methods. The study found that the UHI effect was consistent with the spatial development trajectory of the city and positively correlated with the intensity of urban construction. The UHI effect was also significantly correlated with urban landscape patterns and human factors, based on analysis of POI spatial big data [4]. Other studies have found significant correlations between urban surface temperature and factors such as surface coverage type and proportion [5], natural water area, and forestland plant community coverage [6,7,8,9,10,11,12,13,14]. In urban scale research, analysis has been conducted mainly through the interpretation and inversion of high-definition satellite image data [1,5,6,7,8,12,13,15,16]. At the landscape scale, Fu et al. (2020) analysed summer thermal environment factors in 183 key cities in China from 1990 to 2016 to identify the mechanisms driving the temporal and spatial evolution of the urban thermal environment in the process of rapid urbanization [17]. Research has shown that the characteristics of urban green space areas, such as community structure and landscape patterns [15,16,18,19,20], as well as buildings (floor area, size) and three-dimensional greening, play significant roles in regulating spatial patterns in the urban thermal environment [7,21,22,23,24,25,26]. It can be concluded that the surface temperature of urban green space areas is lower than that of general urban areas, resulting in an urban cold island (UCI) effect. In urban-scale studies, the most common data acquisition method is fixed-point measurement (as well as spatial interpolation and numerical simulation based on measured data) [20,21,22,27]. In cities that frequently experience a hot summer climate such as Beijing, China, UCI areas such as urban green space can not only significantly reduce and improve the scope and intensity of the UHI, but also increase the level of human comfort in this area and then offer urban residents recreation.
The human thermal comfort (HTC) index quantitatively describes people’s subjective feelings about the local thermal environment. It does so digitally, in a landscape environment. A landscape environment is an objective environment created using natural landscape elements and based on people’s subjective and objective needs. Research on human thermal comfort supports the fine-grained design, analysis, and evaluation of landscape architecture. Extensive research has investigated the regional climatic characteristics of case cities, different landscape/environmental scales, and influencing factors, using various research measures and methods. The discomfort index [27], the wet bulb globe temperature index [19], the synthesis index, physiological equivalent temperature [17,22], and the predicted mean vote–predicted percentage dissatisfied (PMV–PPD) thermal comfort index [21,25] have been used in related research. The above comfort indices have specific objects and ranges. The PMV–PPD thermal comfort index method was developed to analyse comfort in indoor spaces (e.g., train compartments) dependent on air conditioning in the 1970s. The index’s composition includes not only temperature, relative humidity, and wind speed, which reflect objective environmental characteristics, but also human activities, clothing types, and psychological and physiological factors that affect human thermal comfort. In recent years, some researchers have applied this method to evaluate bodily comfort in open spaces in cities in different regions [20,21,25]. The current study used this method to explain the correlations between the characteristics of plant communities in urban green spaces and human thermal comfort. To summarise, urban scale research on the urban thermal environment has mainly described the spatial correlations between urban spatial morphological characteristics and UHI intensity from a quantitative perspective, aiming to serve urban economic and social development, material space planning, etc. Research on landscape patterns and green space has paid more attention to the factors affecting the intensity of UHIs, seeking to provide a scientific basis for the incremental planning, design, and stock renewal of urban space according to the desired intensity and scope of impact of UHI mitigation. As urban green spaces differ in their proportions of forestland, water bodies, grass, and hard pavements, the regional thermal environment shows some spatial differentiation. However, this differentiation has not been adequately reflected in quantitative research, which has thus far failed to examine the impact of different green space landscape types (including plant community structure, community type, and typical landscape environment) on human comfort.
To address the above shortcomings, the research team continuously and dynamically monitored the microenvironmental effects of green space plant communities (such as reducing air fungi, cooling and humidifying, and reducing negative ions in the air) in BOFP for 15 years, from 2005 to 2020. In a previous study, the team used the results to illustrate the spatial characteristics of regional thermal comfort in green space areas of BOFP [27]. The current study addressed the following research questions.
(1)
Which plant community structure(s) and type(s) of green space significantly affect human thermal comfort in BOFP?
(2)
What are the differences in human thermal comfort between typical landscape areas of green space in BOFP?
The research results provide a scientific basis for the planning, design, renewal, and optimisation of landscape green space in BOFP to improve the urban thermal environment and human thermal comfort.

2. Overview of the Study Area and Research Methods
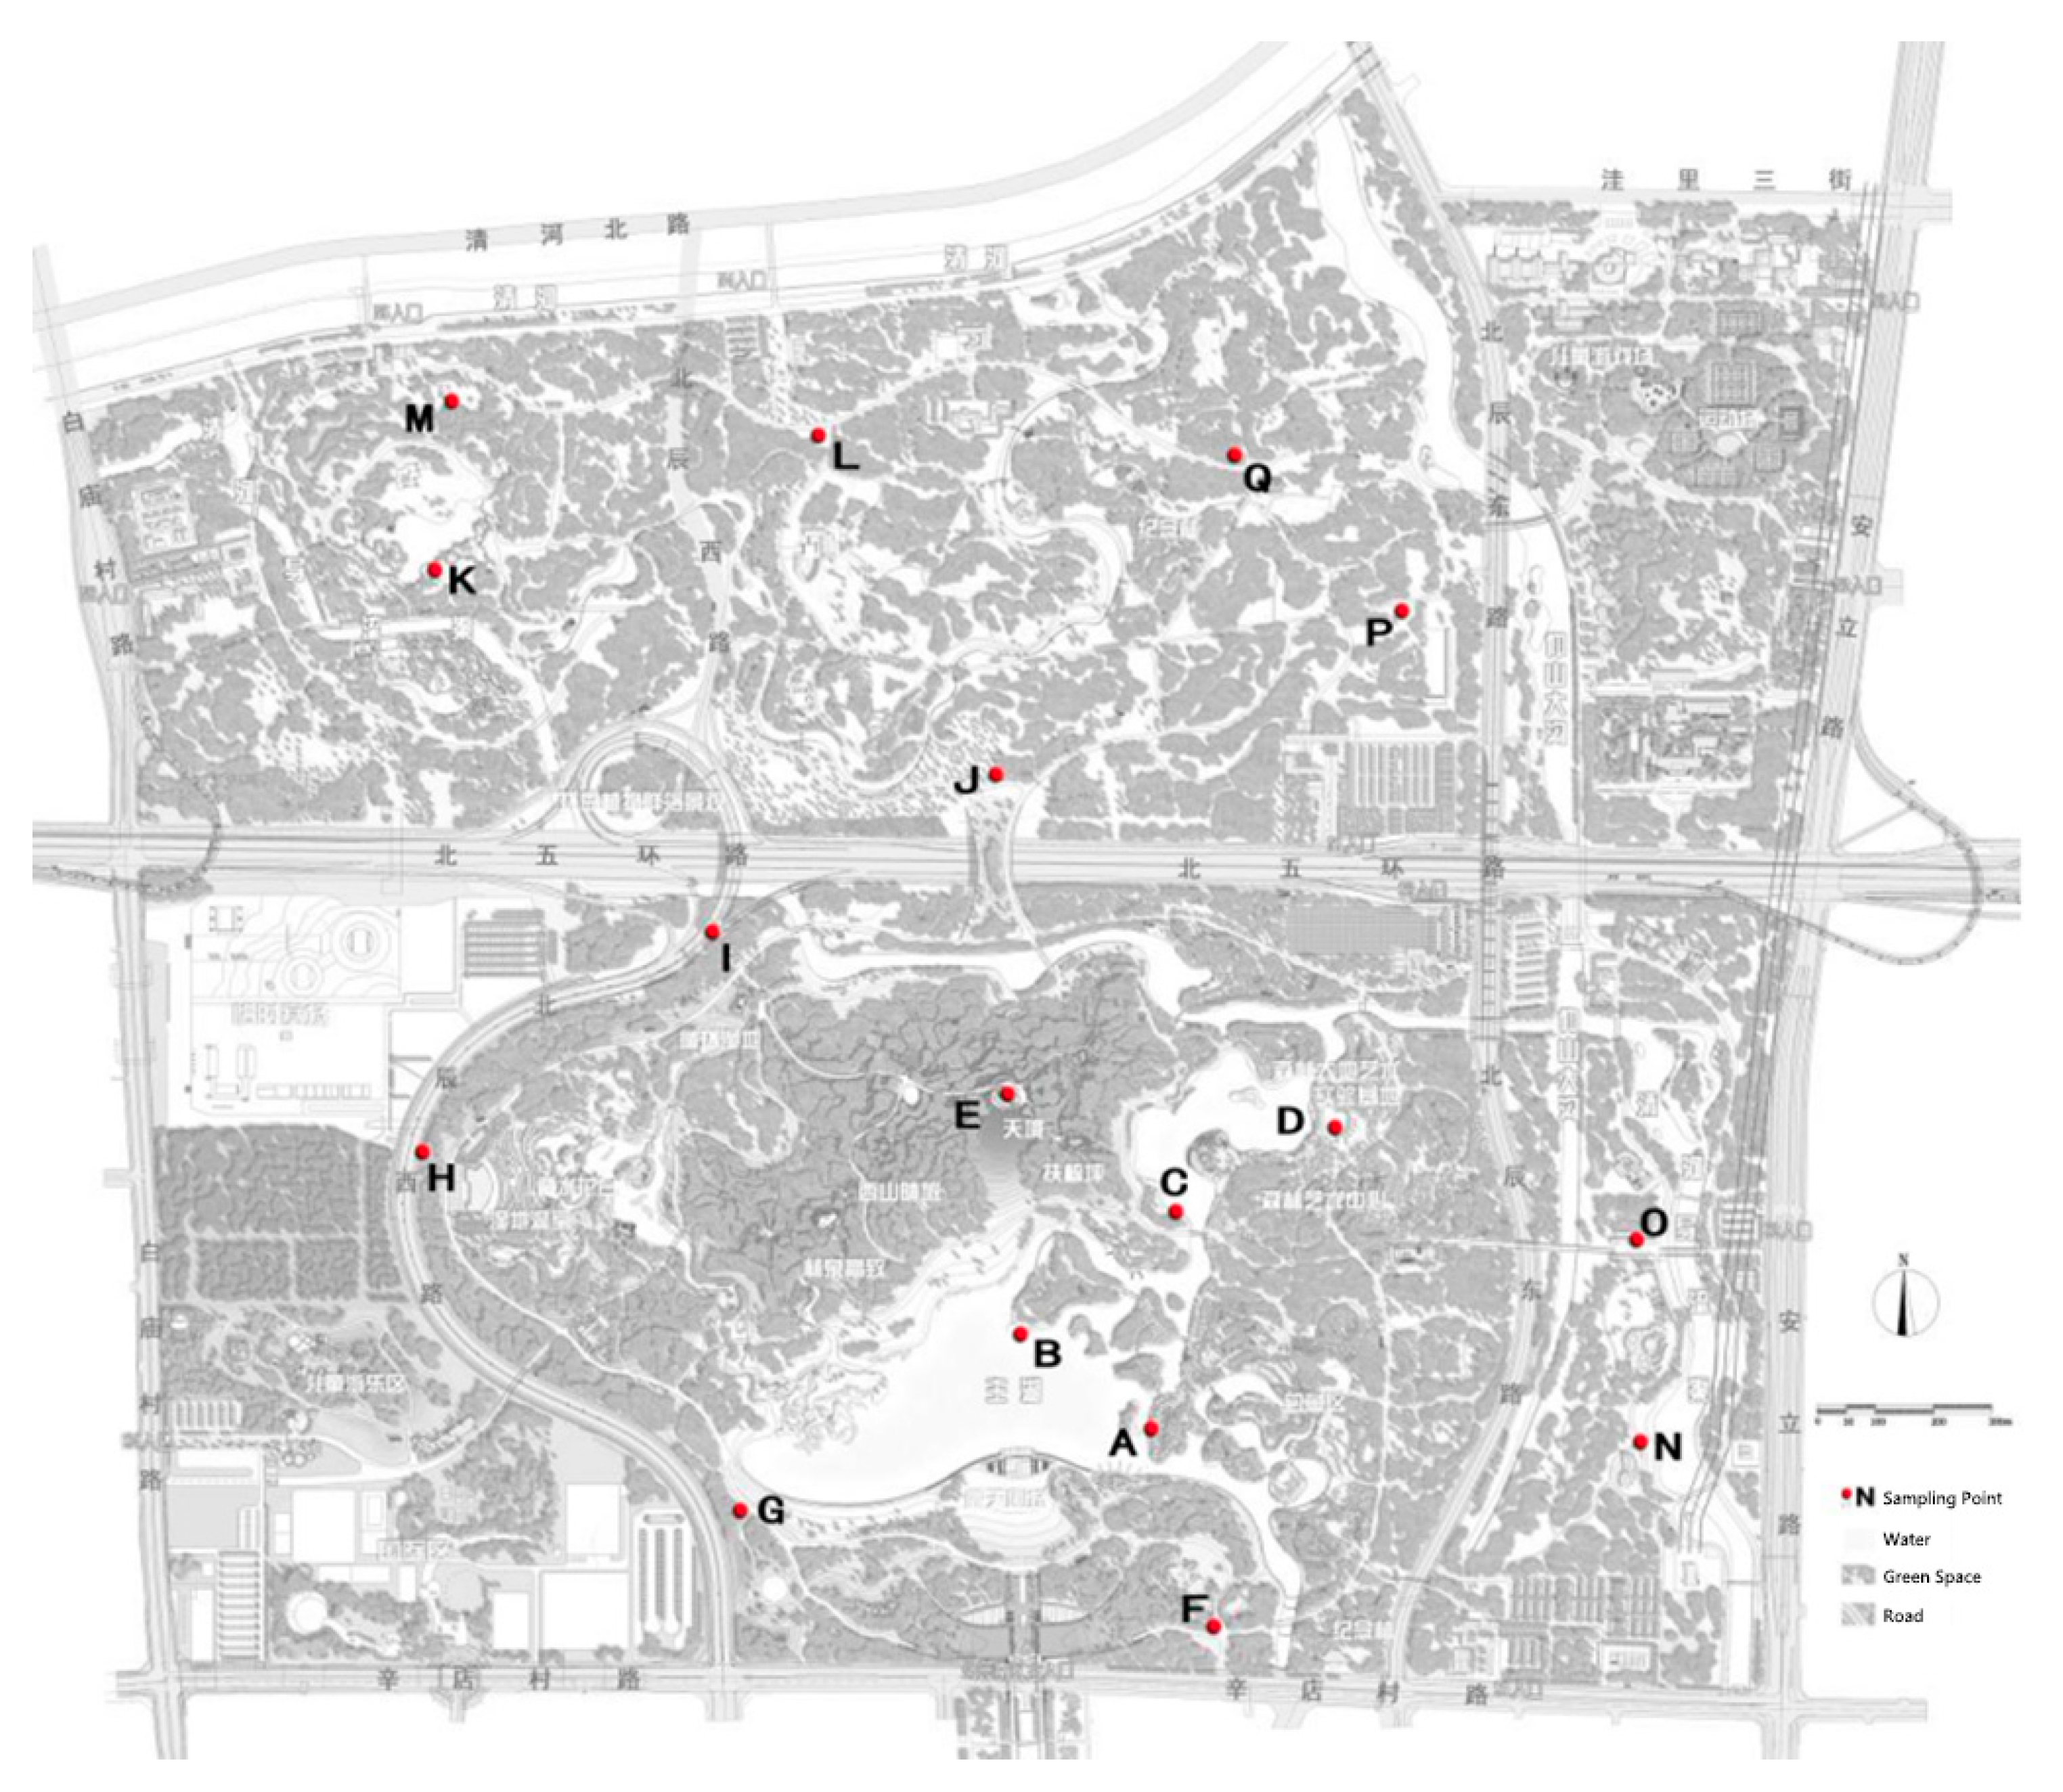
2.1. Study Area

The main green space areas in BOFP are located in Chaoyang district, Beijing (Figure 1). They extend from Kehui Road in the south to Qinghe in the north (across the North Fifth Ring Road), east to Anli Road and west to Lincui Road. The park covers a total area of 680 hectares, of which the southern part covers about 380 hectares (including a venue area in the west) and the northern part covers about 300 hectares.

2.2. Research Methods

2.2.1. Selection of Plant Community Index for Typical Green Space

Plant communities in the green space quadrat of BOFP were categorised as follows. Five types of plant community structure: tree–shrub–grass (TSG), tree-shrub (TS), tree-grass (TG), shrub-grass (SG), and grass/ground cover (G). Five plant community types: coniferous plant community (CP), coniferous and broadleaved mixed plant community (CBP), deciduous broadleaved plant community (DBP), shrub (S) and grass/ground cover (G). Five typical environments: TSG multi-layer plant community (MPC), TS, TG, and SG double-layer plant community (DPC), G single-plant Community (SPC), waterfront plaza (WS), and waterfront plant community (WPC). CK denotes the comparison sample.

2.2.2. Data Collection

(1)
Sample Setting
Using the chessboard sampling method, 17 experimental sample points were selected in the green space of BOFP (Figure 2 and Table 1). To ensure that the test sample points were far away from large-scale crowd activity areas (urban roads, squares, etc.), representative vegetation types were selected to fine-tune their positions [27]. The types and number of plant community structures covered more than three test sites. The two comparison samples were located in the Beijing Olympic Park paved square (near the underground business district), 1 km south of the south gate of BOFP; and in a paved square on the north side of the north fourth ring road of BOFP (near Beijing’s Bird’s Nest National Stadium). Compared with the former, the latter site has more hard pavement, less green space, less diverse plant communities, and more dense crowd activities.
(2)
Test methods
The test instrument was the 6 SWEMA Y-Boat-R multifunctional online environmental detection system (which has 30 channels that can simultaneously collect and store air temperature, radiation temperature, wind speed, and direction data and synchronously measure reference data such as air relative humidity, differential pressure, and heat flux). Three repetitions were set for each index data point. The test was conducted over 3 days between August 10 and 20, 2020. The meteorological conditions were sunny (cloud cover not more than 30%) with a calm wind (3–4 m/s). First, data on green plant community characteristics such as plant height of dominant species, DBH, crown width, canopy height, canopy coverage, and canopy density were obtained by field investigation within the quadrat. Quantitative plant community parameters such as the leaf area index were measured using the CI-110 plant canopy image analyser.
During the sample point measurement, the instrument automatically recorded and stored the measured data. In the data analysis, the arithmetic mean of the automatically recorded data obtained at intervals of 10 min from 08:00 to 18:00 (76 times in total), was taken as the daily mean. The average values automatically recorded at 5-min intervals between 08:50 and 09:10 (obtained at 08:50, 08:55, 09:00, 09:05, and 09:10), between 13:20 and 13:40, and between 17:20 and 17:40 were taken as the morning instantaneous value, noon instantaneous value, and afternoon instantaneous value, respectively. The average values of the comparative sample data were used as background comfort data for the urban area environment.

2.2.3. Data Analysis Methods

(1) PMV–PPD body comfort index
PMV is the estimated average thermal sensation index, which is a quantitative measure of people’s thermal sensation in a specific outdoor thermal environment. It can be used to evaluate and judge whether a certain environmental state meets the requirements for human thermal comfort (the higher the absolute value of PMV, the greater people’s discomfort, which is categorised as “thermal discomfort” or “cold discomfort”, otherwise “comfort”). PPD is a quantitative index measuring people’s predicted dissatisfaction with a specific thermal environment, i.e., the predicted dissatisfaction rate, which is expressed in percentage form (the higher the value, the greater the predicted dissatisfaction). The PMV–PPD index corresponds to the ASHRAE thermal sensation level 7 index. The range of values from cold to hot is −3 to 3, where 0 is the most comfortable state of the environment (as shown in Table 2). The mathematical relationship between PMV and PPD is shown in Figure 3.
The calculation formulas are given below.
PMV   =   ( 0.303 e 0.036 M   +   0.028 )   ×   { ( M     W )     3.0510 3   ×   [ 5733     6.99   ( M     W )     P a ]     0.42   ×   [ ( M   W )     58.15 ]     1.7   ×   10 5   M   ( 5867     Pa )     0.0014   M   ( 34 t a )     3.96   ×   10 8 f cl   ×   [ ( t cl   +   273 ) 4     ( t r ¯   +   273 ) 4 ]     f cl h c ( t cl     t a ) }
PPD   =   100 95 × e ( 0.03353 × P M V 4 + 0.2179 × P M V 2 )
Formula :   t cl   =   35.7 0.028 ( M W ) I c l { 3.96 × 10 8 f c l × [ ( t c l + 273 ) 4 ( t r ¯ + 273 ) 4 ] + f c l h c ( t c l t a ) }
h c   =   { 2.38 | t c l t a | 0.25     W h e n   2.38 | t c l t a |   > 12.1 ν a r 12.1 ν a r               W h e n   2.38 | t c l t a |   < 12.1 ν a r
f cl   =   { 1.00 + 1.290 I c l         W h e n   I c l 0.078   m 2 K W 1.05 + 0.645 I c l         W h e n   I c l > 0.078   m 2 K W
In Formula (1), PMV is the estimated average thermal sensation index; M is the metabolic rate of the human body when engaged in certain activities in the thermal environment (this study focused on aerobic exercise such as fast walking, jogging, and dance-based fitness), W/m2; W is the heat consumed by external work (negligible for most activities), W/m2; Icl is the thermal resistance of clothing, m2·K/W (the background clothing in this study was set as trousers, shirt/T-shirt, shoes, and socks; coefficient = 0.110 m2·K/W); fcl is the ratio of body surface area when clothed to body surface area when exposed; ta is the air temperature, °C; t r ¯ is the average radiation temperature, °C; Var is the relative wind speed, m/s; Pa is the partial pressure of water vapour, Pa; hc is the convective heat transfer coefficient, W/(m2·°C); and tcl is the clothing surface temperature, °C.
hc and tcl can be obtained by formula iteration. PMV can be obtained from metabolic rate, clothing thermal resistance, air temperature, average radiation temperature, wind speed, and other parameters (std.samr.gov.cn).
In Formula (2), when the PMV value is 0, the PPD value is not also 0, because regardless of how comfortable the objective environment is, people’s physical comfort is affected by multiple subjective and objective factors beyond the environment, such as physiological and psychological factors. It was assumed here that even when the objective environment was at its most comfortable, 5% of people would still be dissatisfied (i.e., PPD = 5%).

3. Results

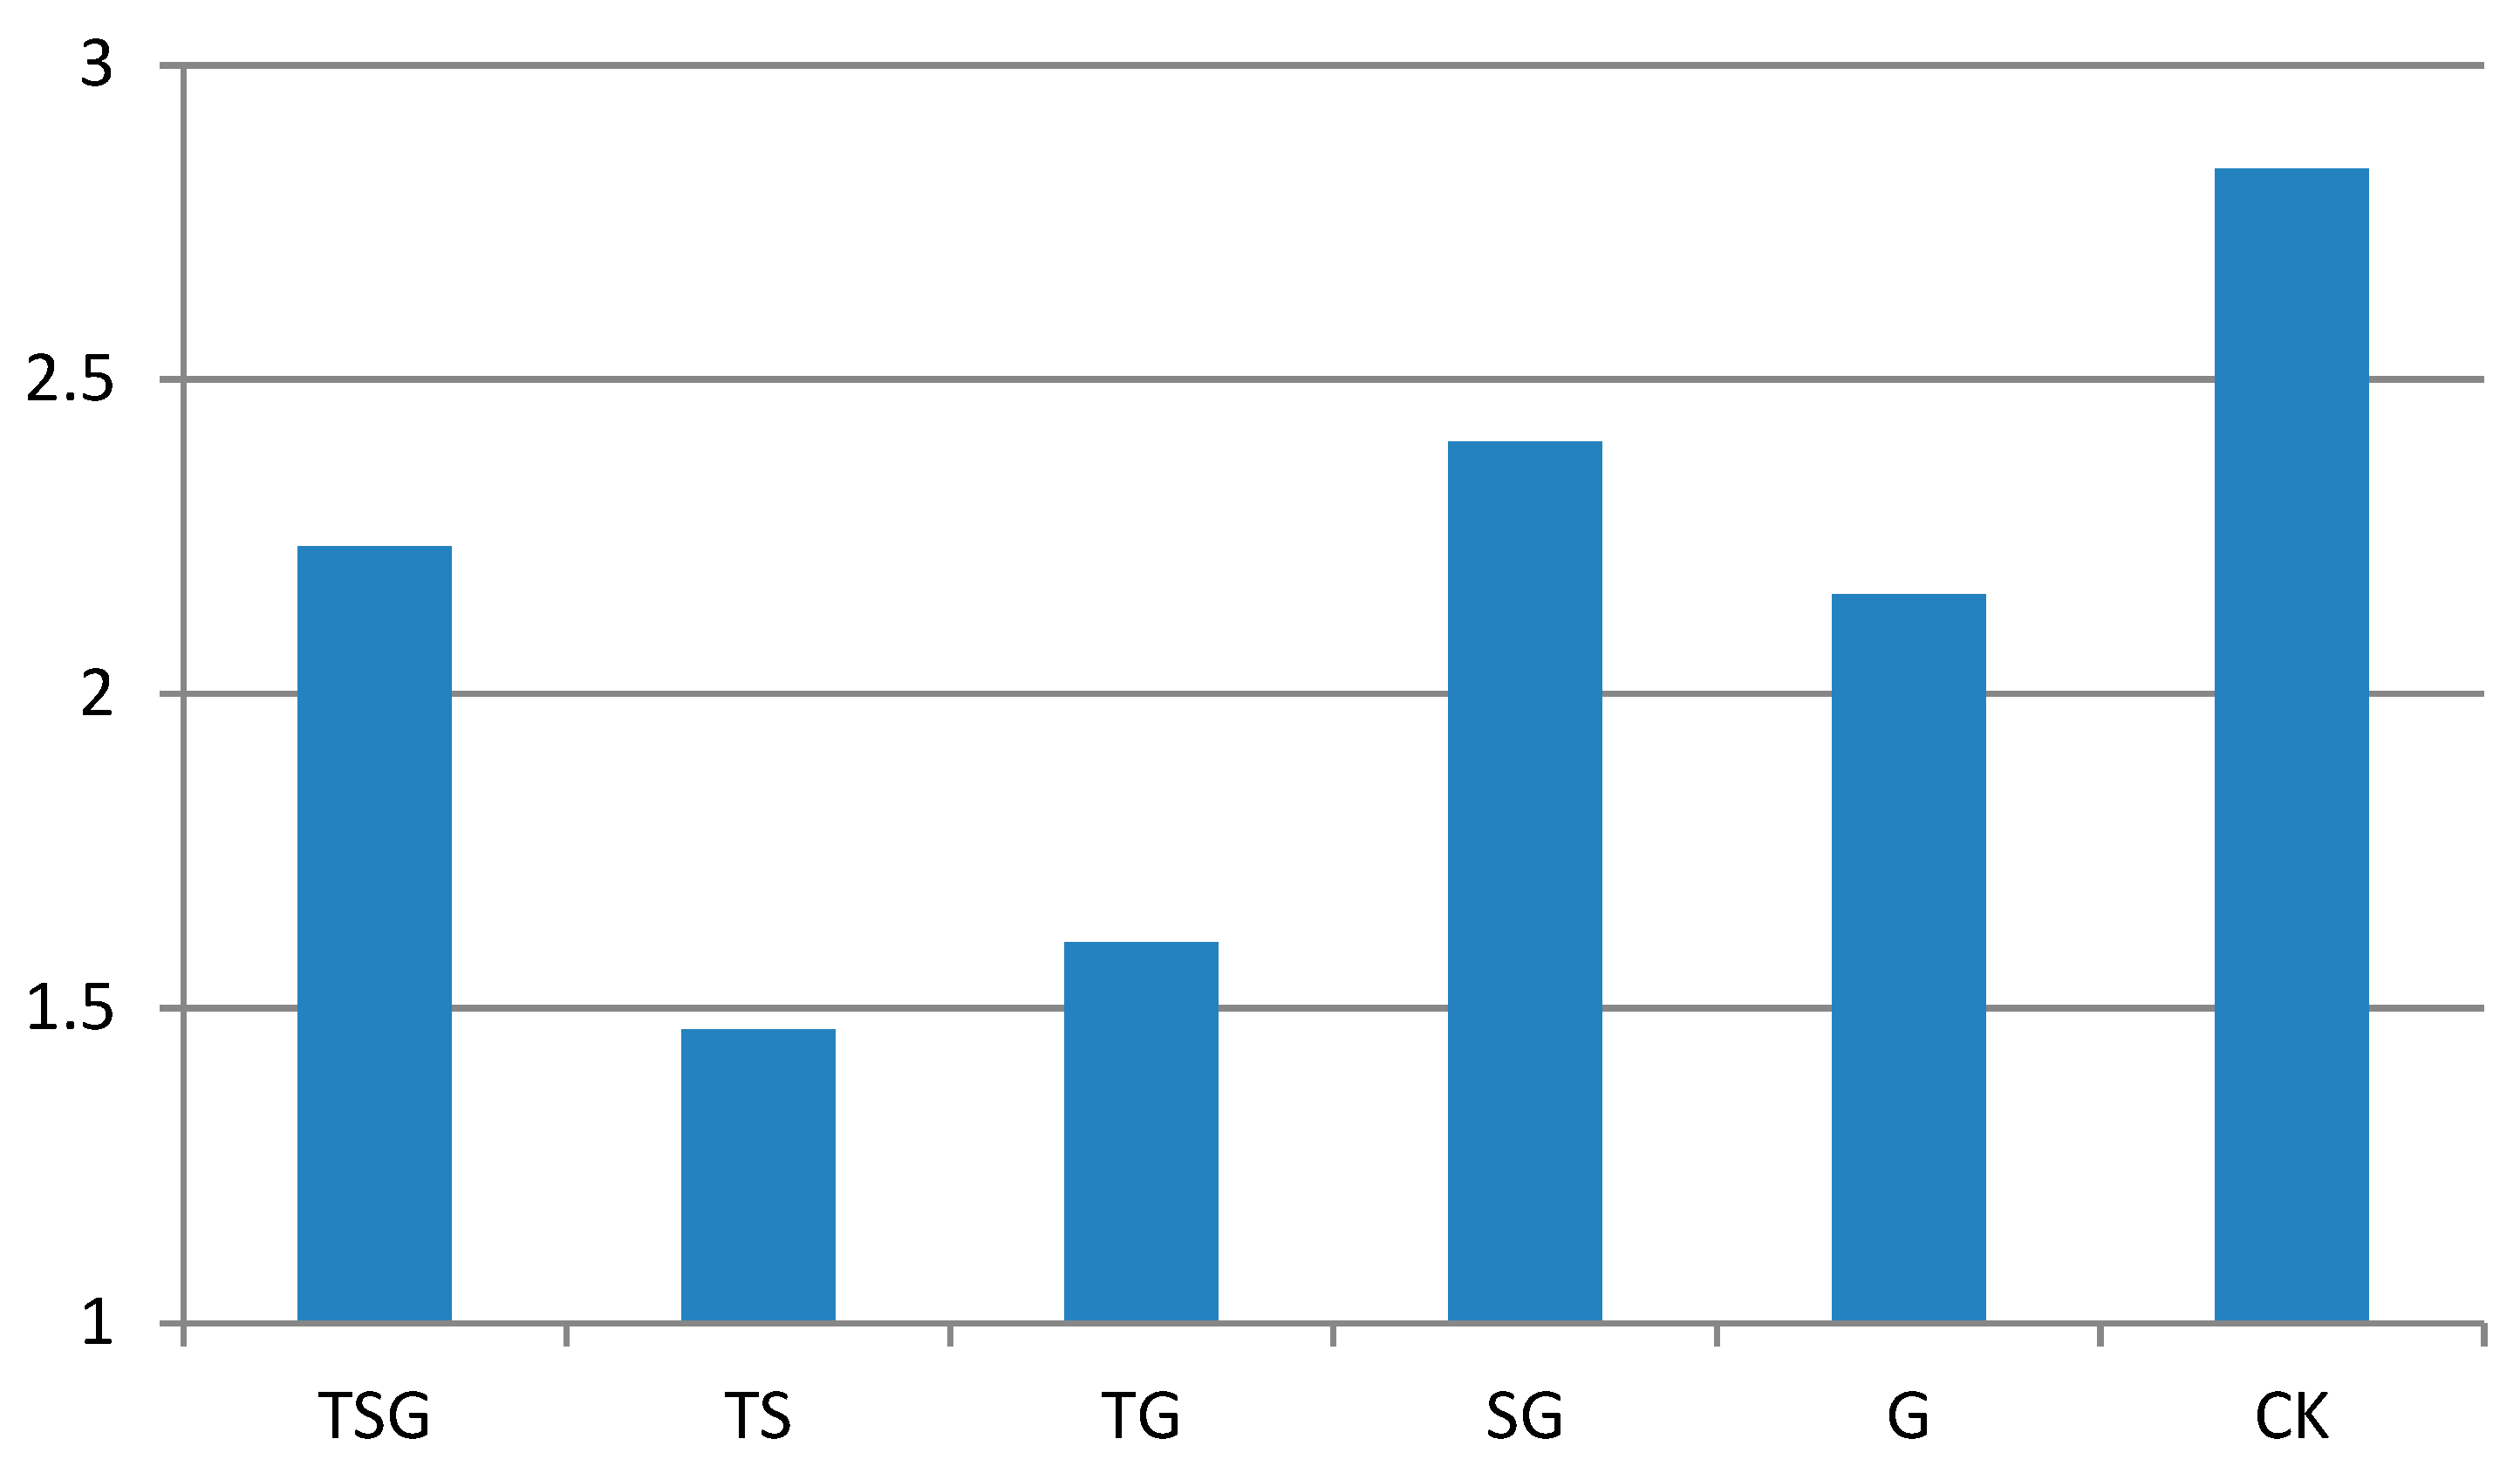
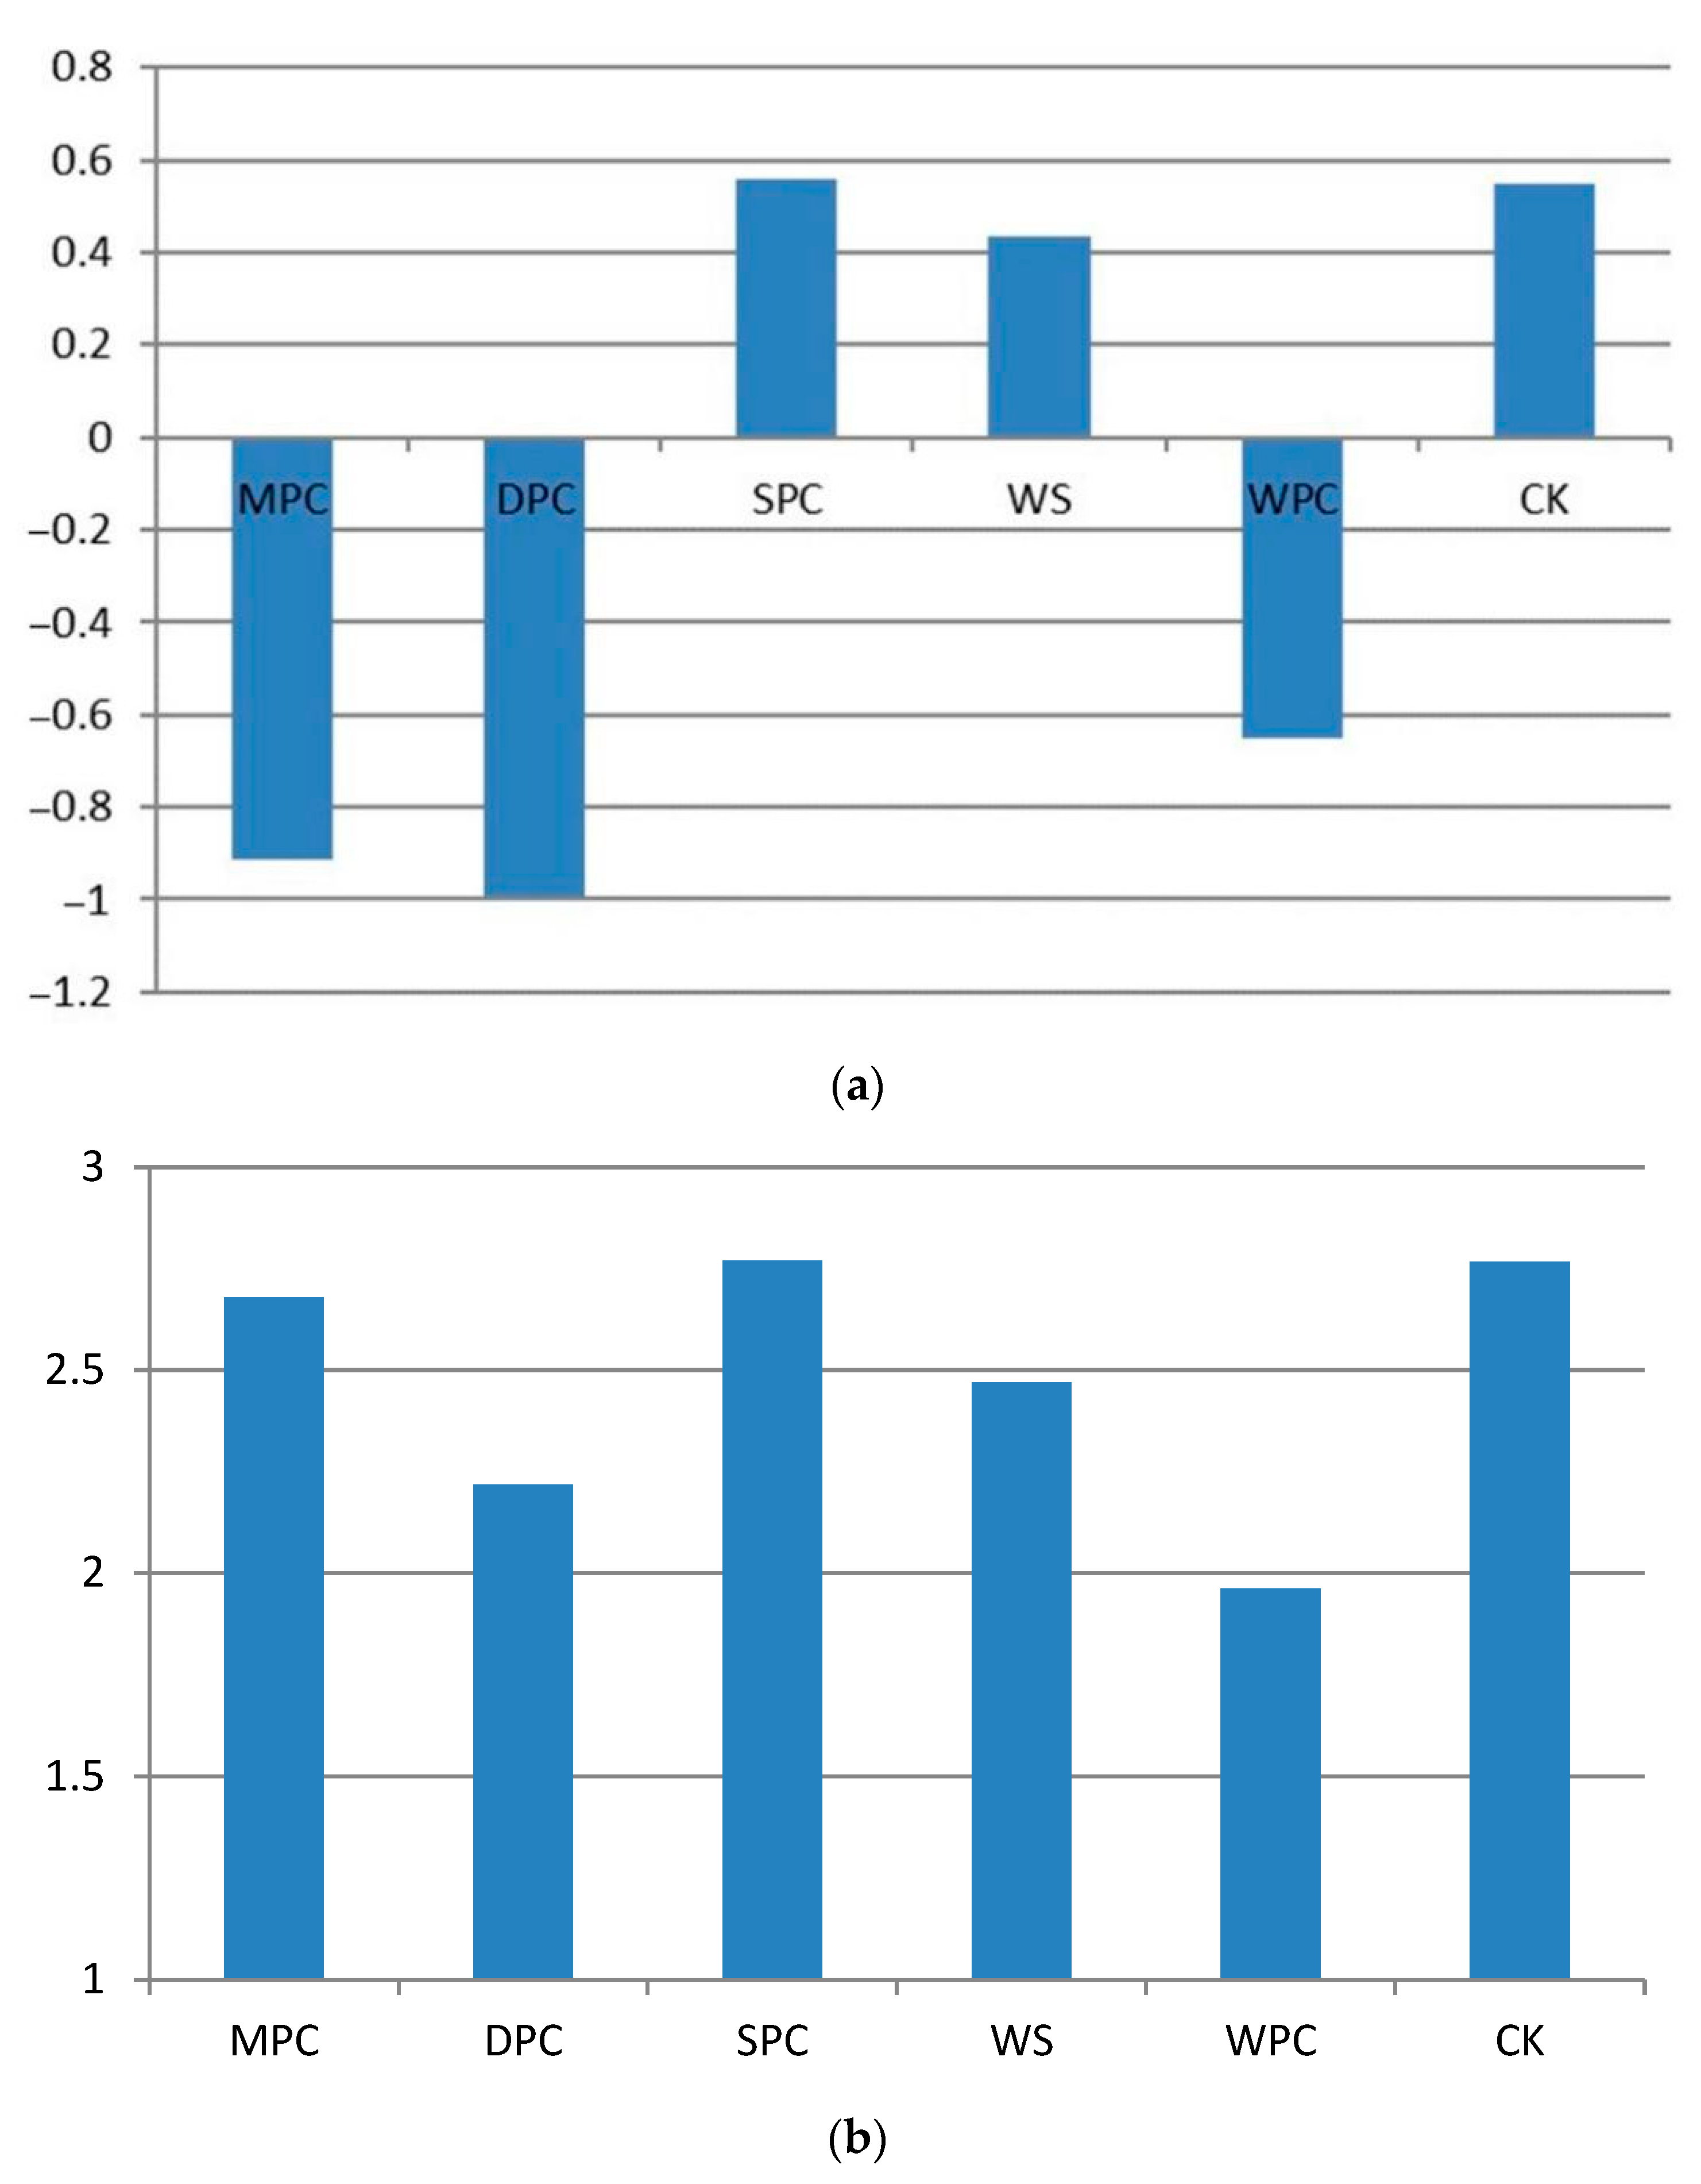
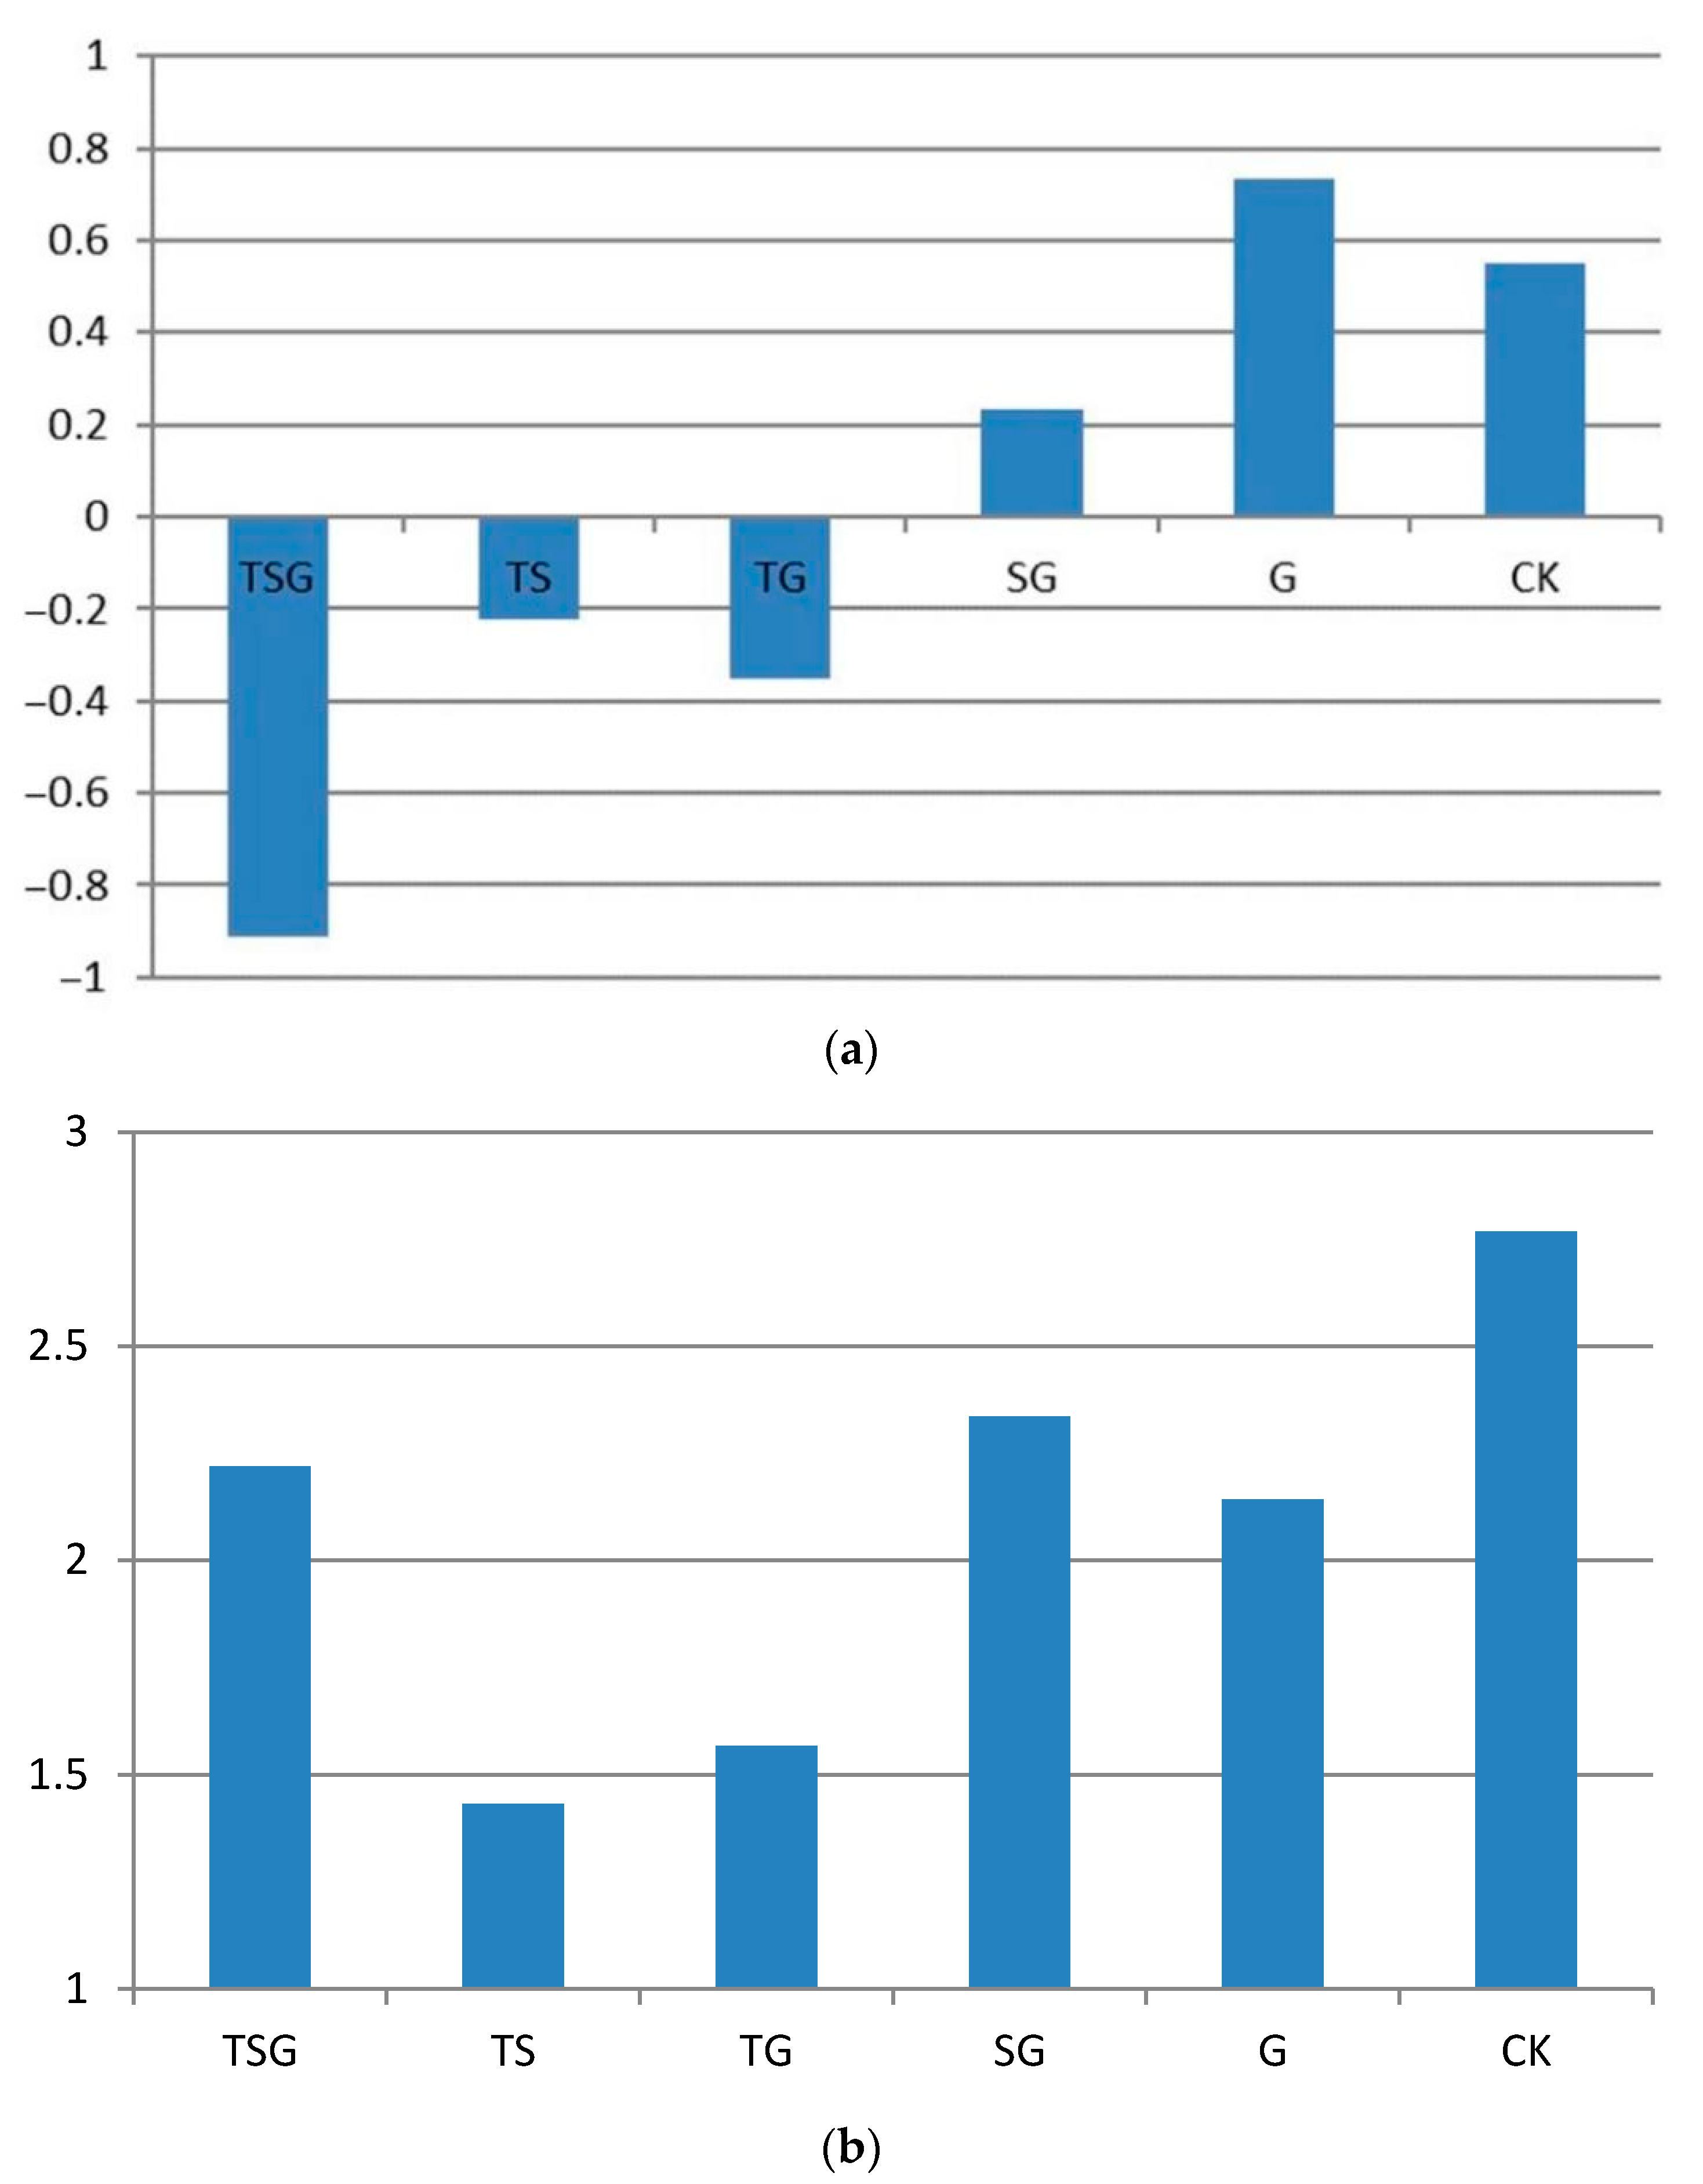
3.1. Differences in Body Comfort between Different Plant Community Structures in Green Space

Figure 4 (including Figure 4a–c) and Figure 5, respectively, show the instantaneous values and mean values of human thermal sensation in areas of green space with different green plant community structures. As shown in Figure 2, the level of morning instantaneous somatosensory comfort in the areas with TG, TS, SG, and G community structures was high. However, TG and TS show negative values in the figure, indicating “cool comfort”, while the SG and G areas were associated with “warm comfort”. As the SG and G community structure areas were directly exposed to solar radiation in the local plant community areas, their temperature rose quickly, while the TS and TG community structure areas did not receive much direct irradiation from sunlight due to their dense forest canopy, resulting in a slow rise in air temperature. The comparison sample also showed a rapid temperature rise, with its areas associated with “warm comfort”. The results shown in Figure 4b,c are very similar, illustrating a gradual intensification of thermal sensation (from noon instantaneous to afternoon instantaneous), reaching the level of “thermal discomfort” before the end of the test and remaining at this level after the test.
Figure 5 presents two main sets of results. Somatosensory comfort in the TG and TS community structure areas was basically at the level of “thermal comfort”, while that in the TSG, SG, and G community structure areas was at the level of “thermal discomfort”. The reason for the former finding may lie in tree canopy shielding, which meant that direct solar radiation intensity and air relative humidity in the forest were controlled within a certain range. In addition, there were relatively few vegetation layers in the forest, which was conducive to the flow of air in the horizontal and vertical directions, making the temperature feel more comfortable. Although the TSG community structure had full canopy coverage, space in the forest was limited, which restricted airflow and thereby limited the dissipation of air humidity and heat. Although the SG and G community structure areas had good ventilation, they experienced strong direct radiation, making them feel hot.

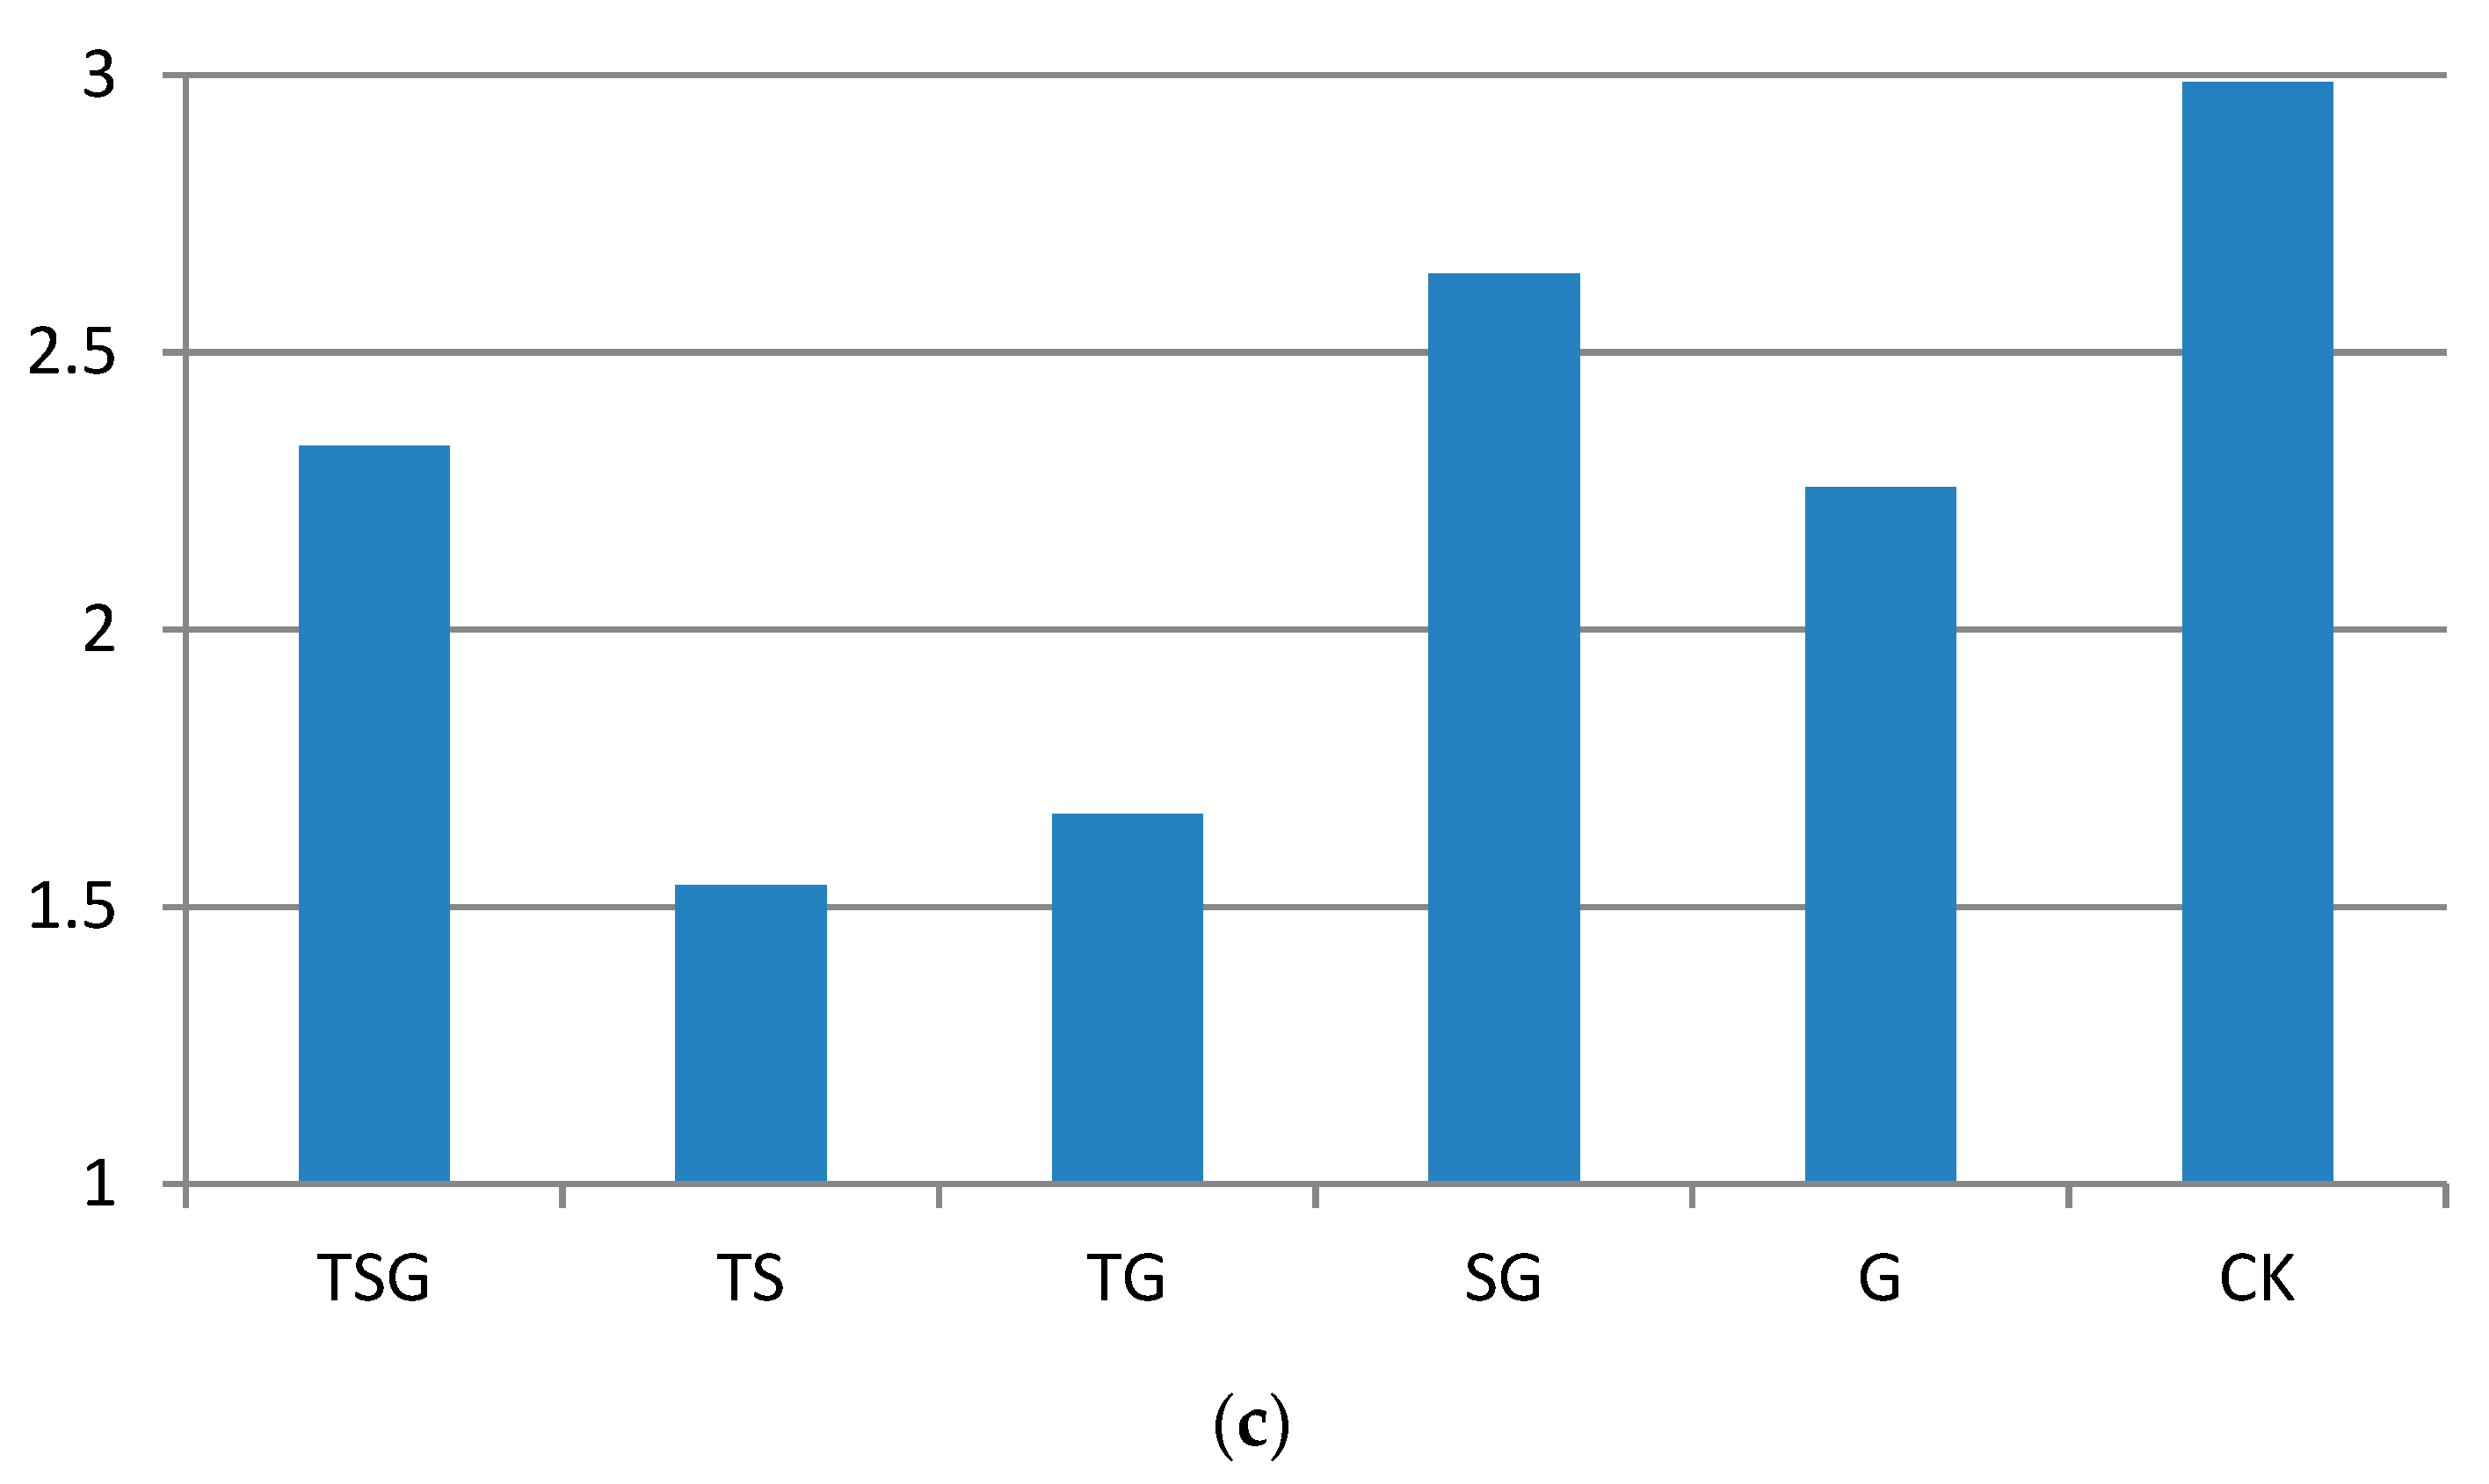
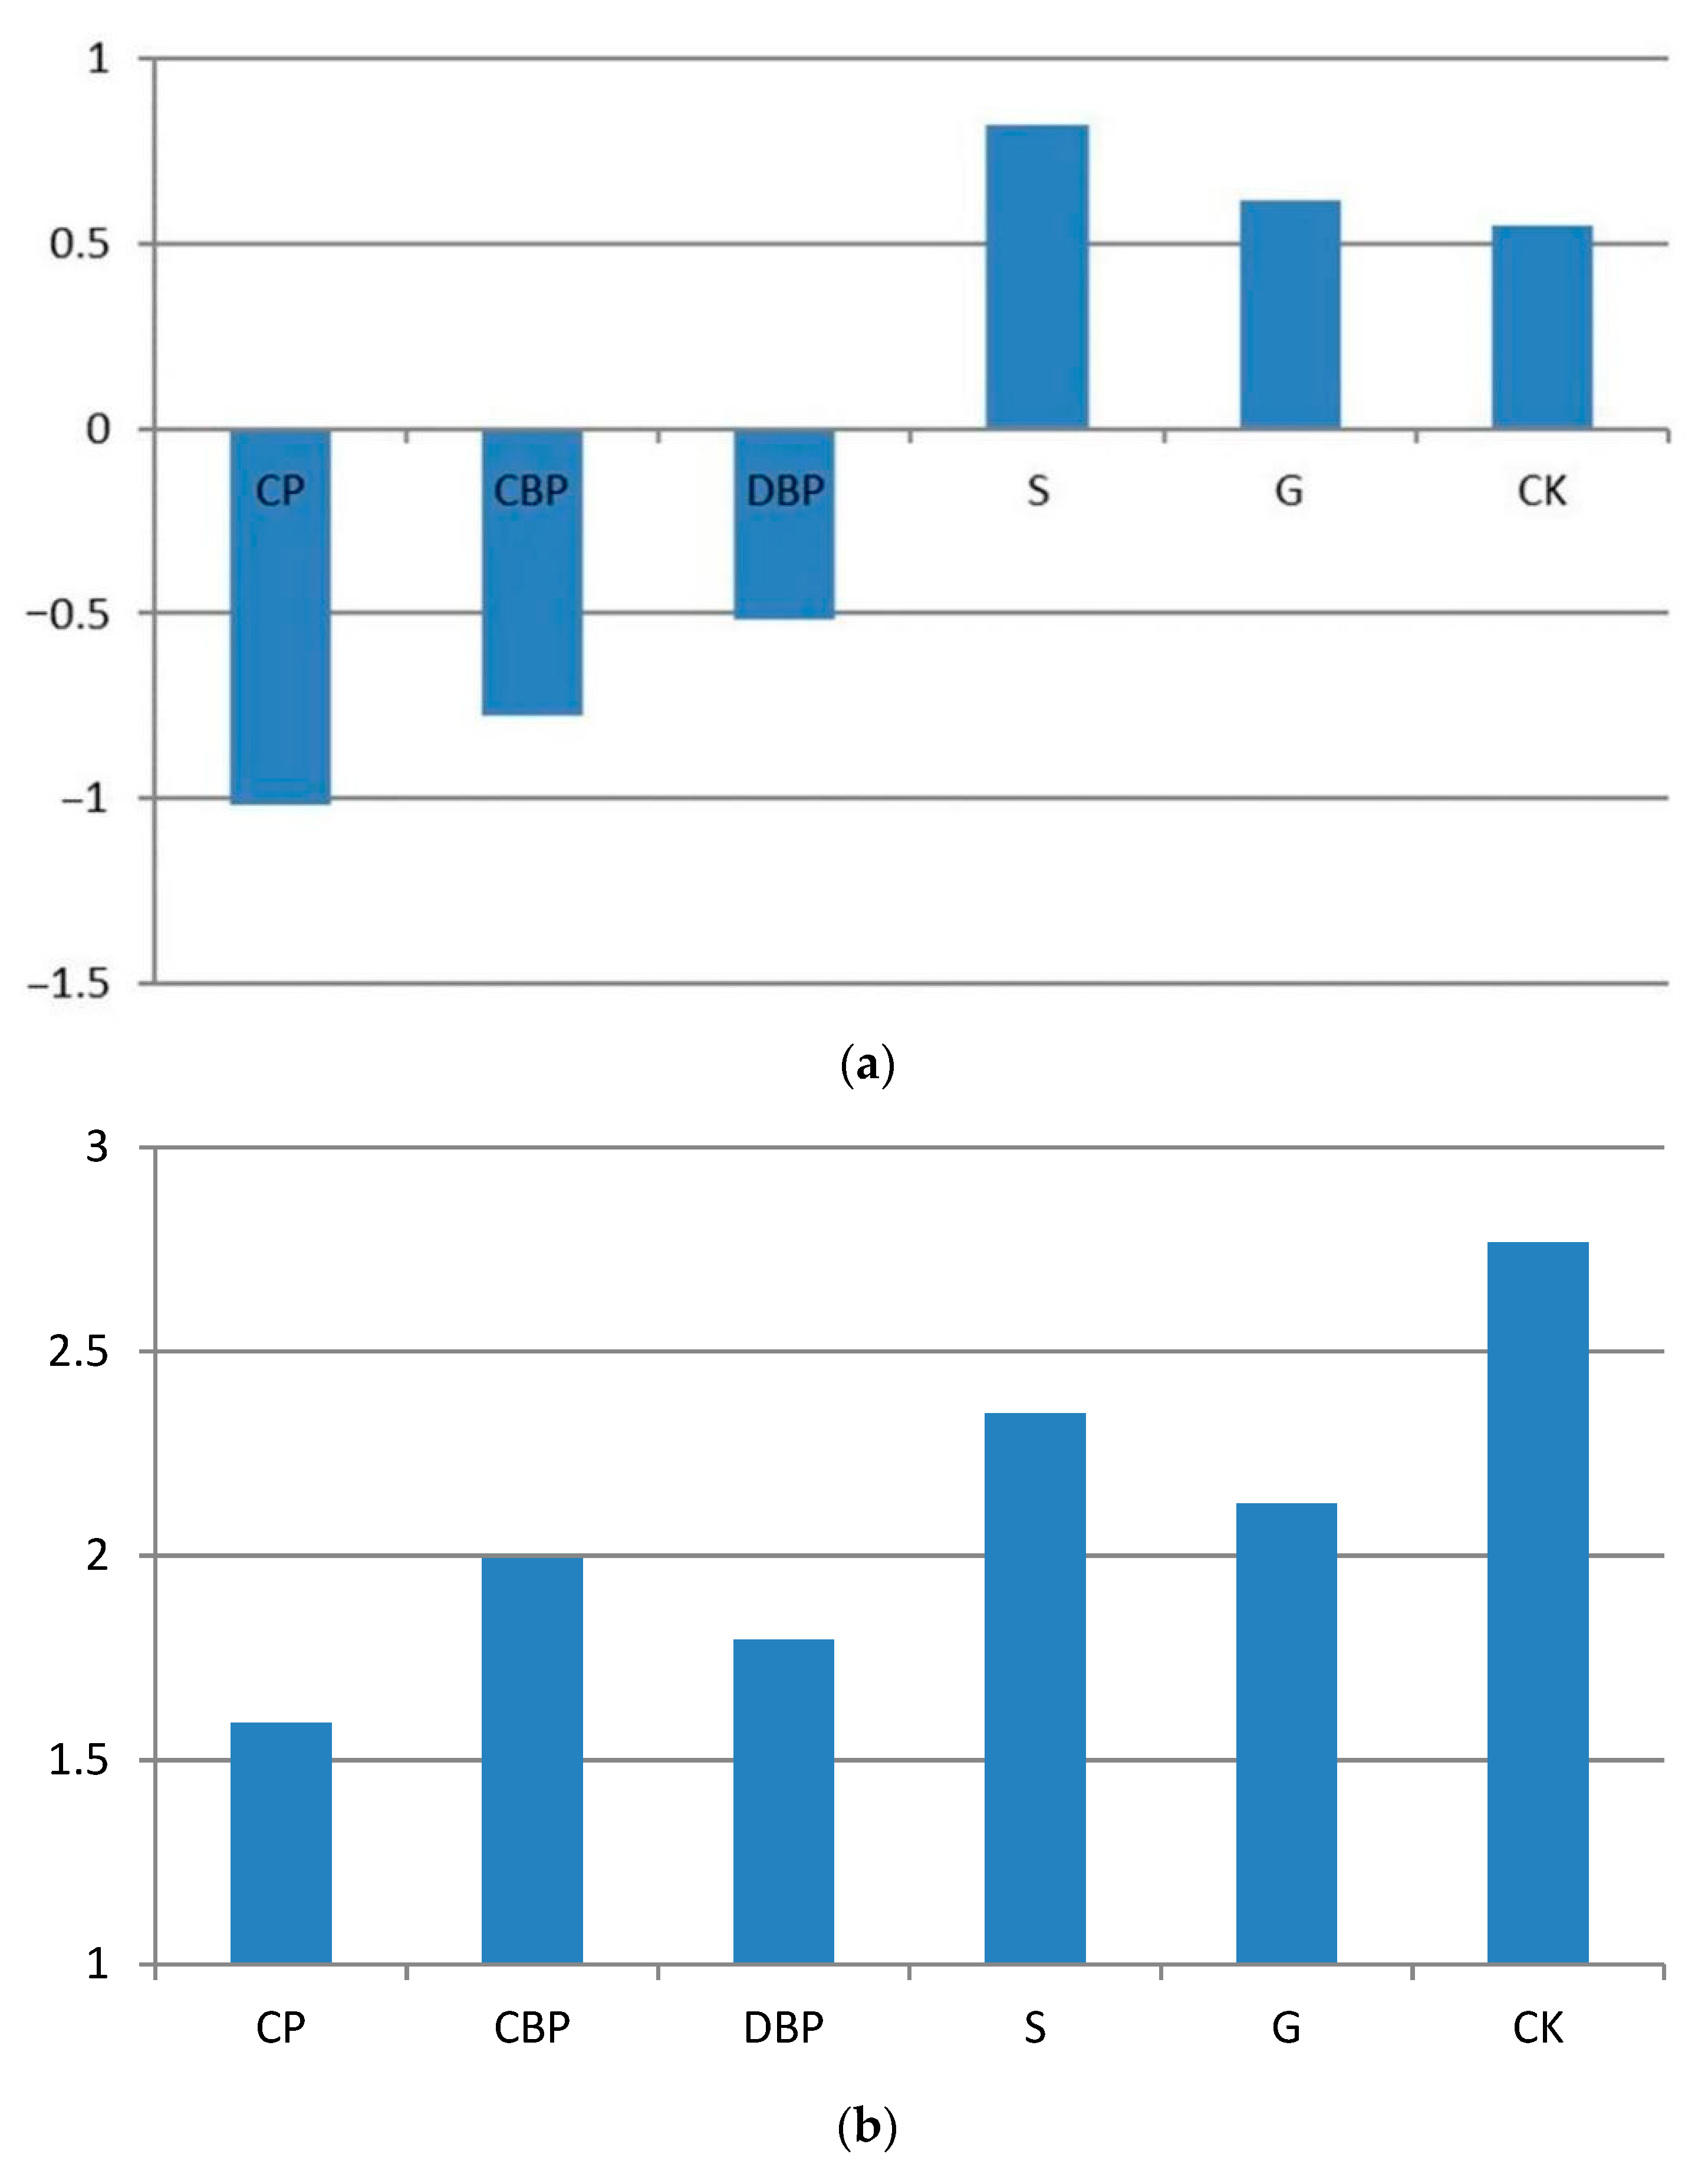
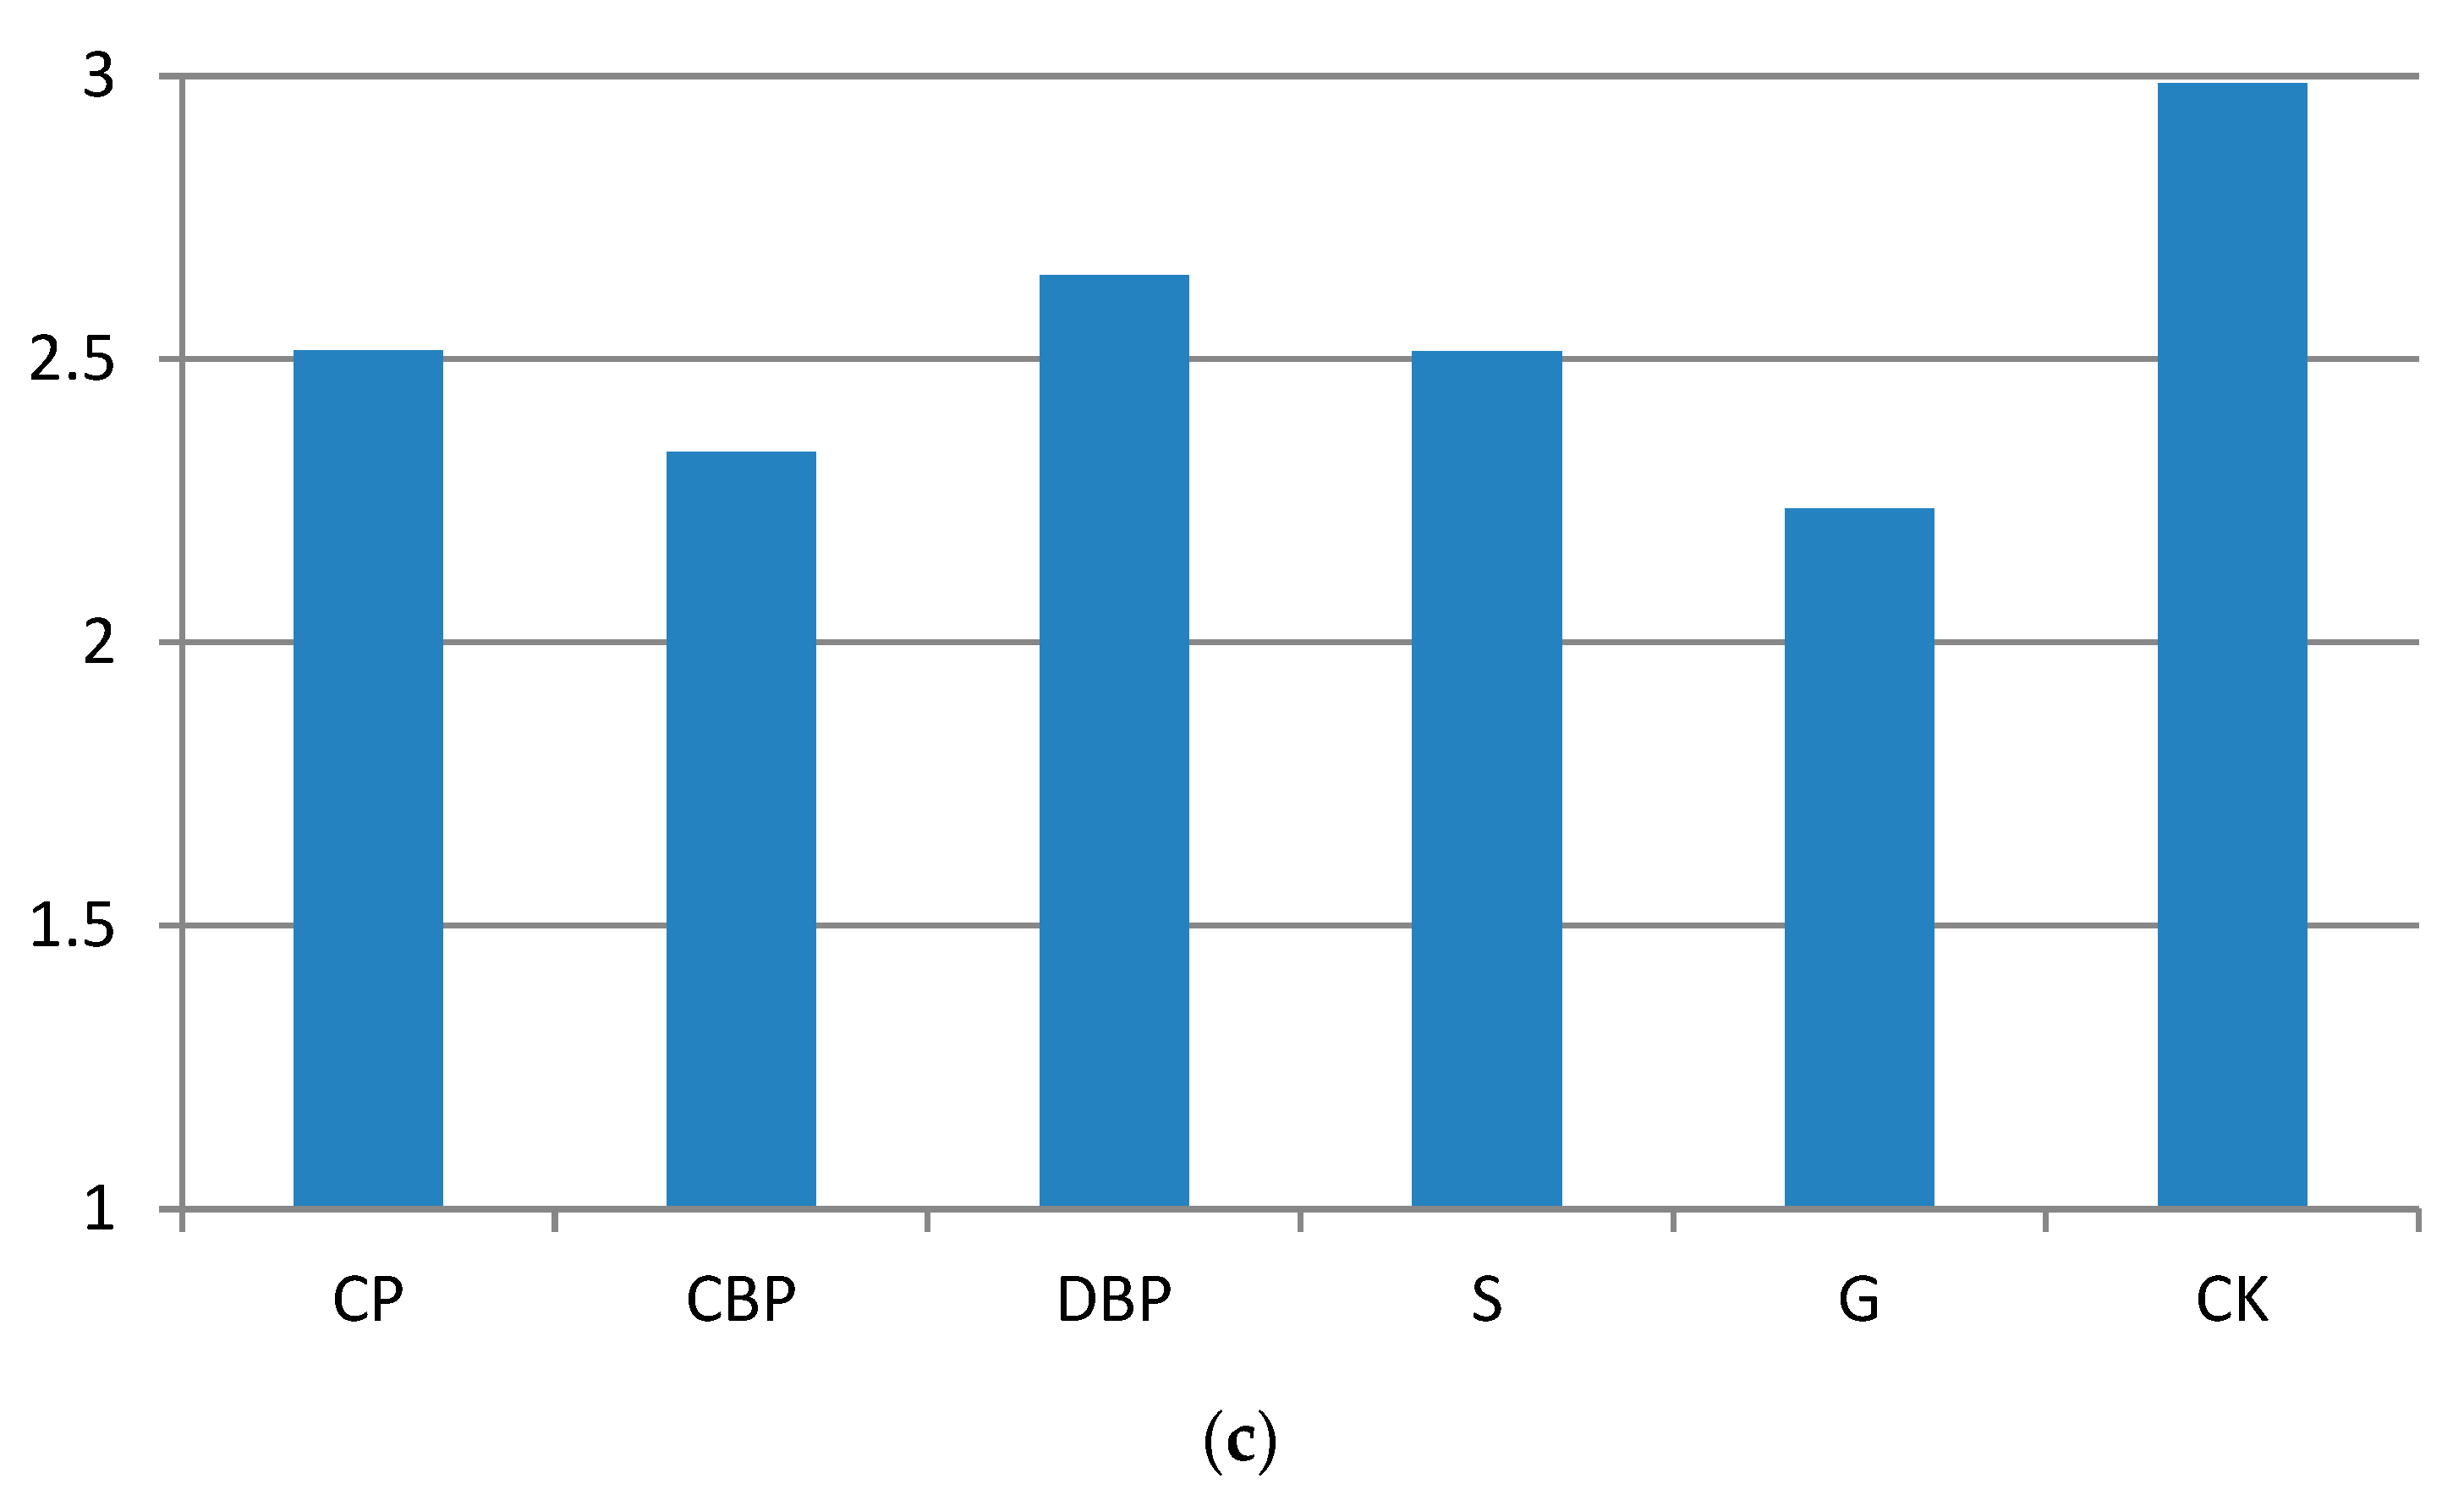
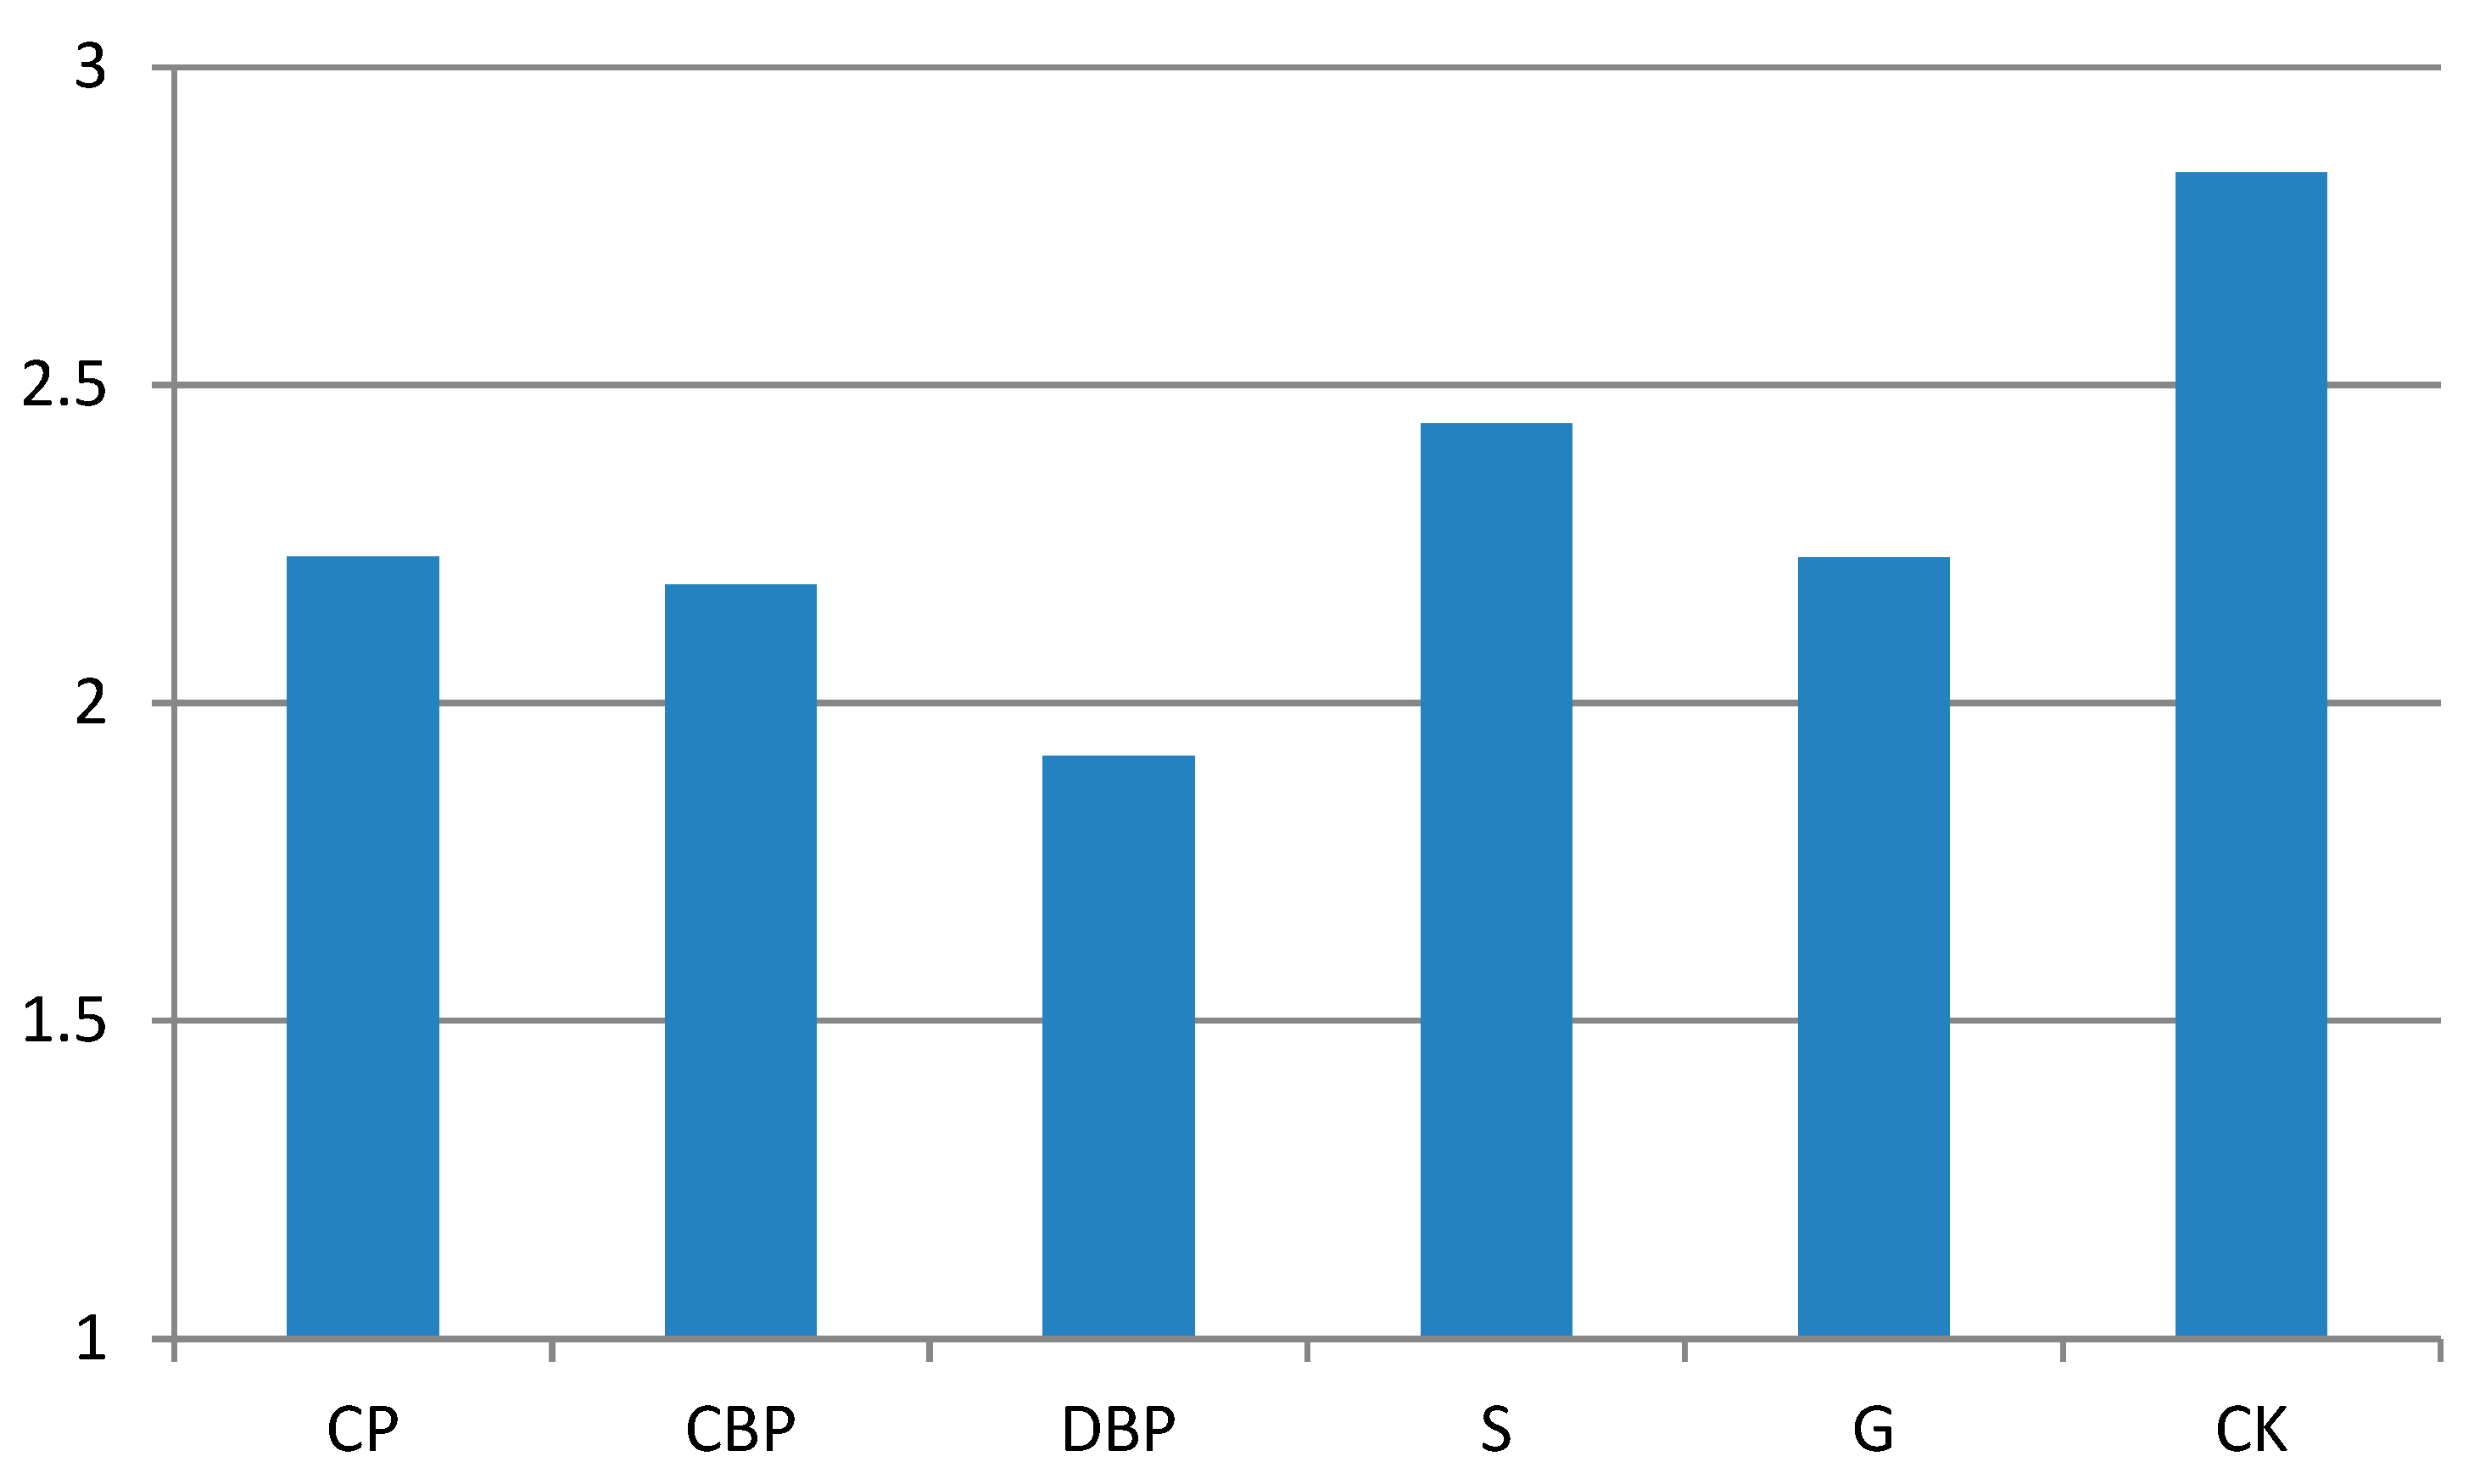
3.2. Differences in Somatosensory Comfort between Green Space with Different Plant Community Types

Figure 6 (including Figure 6a–c) and Figure 7, respectively, show the instantaneous values and mean values of perceived bodily heat across the five green plant community types. As shown in Figure 4a, all five community type areas felt comfortable in the morning. Among them, the S and G community type areas were associated with “warm comfort”, while the CP, DBP, and CBP community type areas were associated with “cool comfort”. The reason for the “warm comfort” experienced in S and G may have been that the air in these areas was heated by direct solar radiation, while the DBP and CBP areas stayed cooler for longer due to their greater canopy closure. However, the CP community type area had small trees and thus no significant canopy coverage. Although direct solar radiation was strong in this area, according to the field observation, the regional environment was still experienced as cool. The reasons for this unexpected finding need to be further studied. The results in Figure 6b,c are similar, showing a continuous increase in thermal sensation from noon to afternoon. At noon (Figure 6b), some of the community type areas were still comfortable, but in the afternoon (Figure 6c), all of the community type areas were associated with “thermal discomfort”. As shown in Figure 5, the somatosensory comfort level in the DBP community type area was “thermal comfort”, while that in the other community type areas was “thermal discomfort”. The reasons for this finding also need to be further studied.

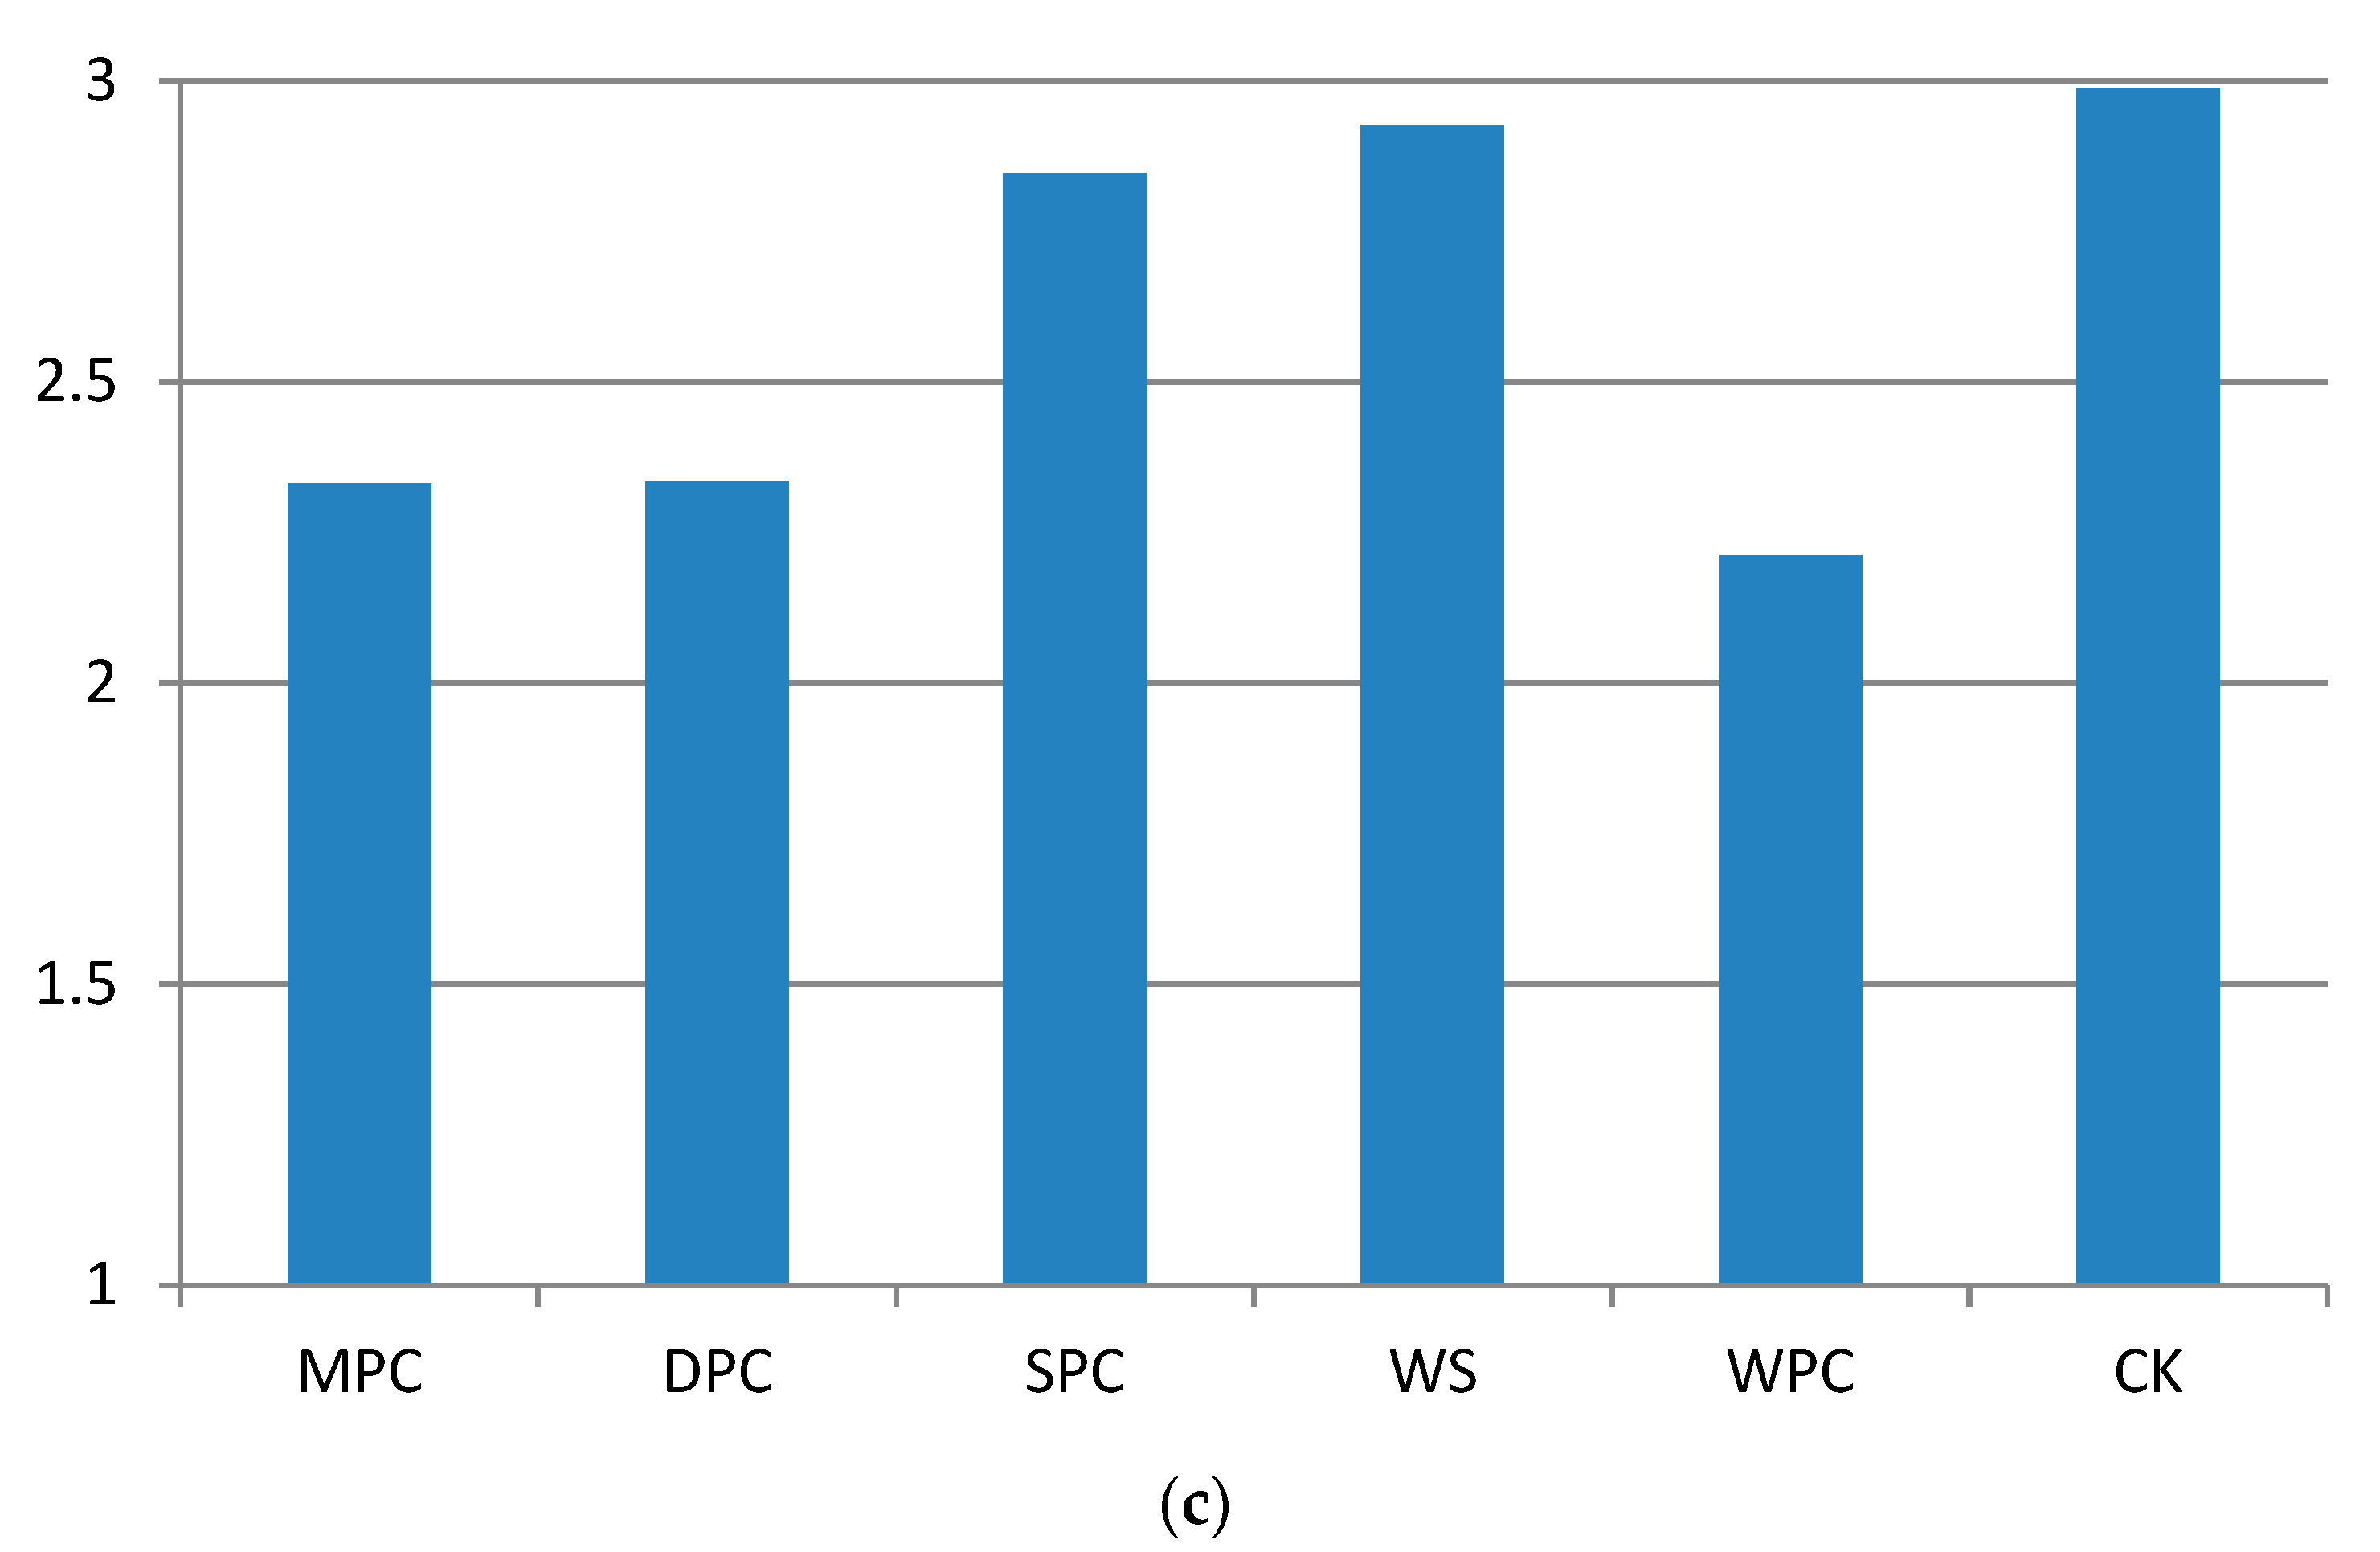
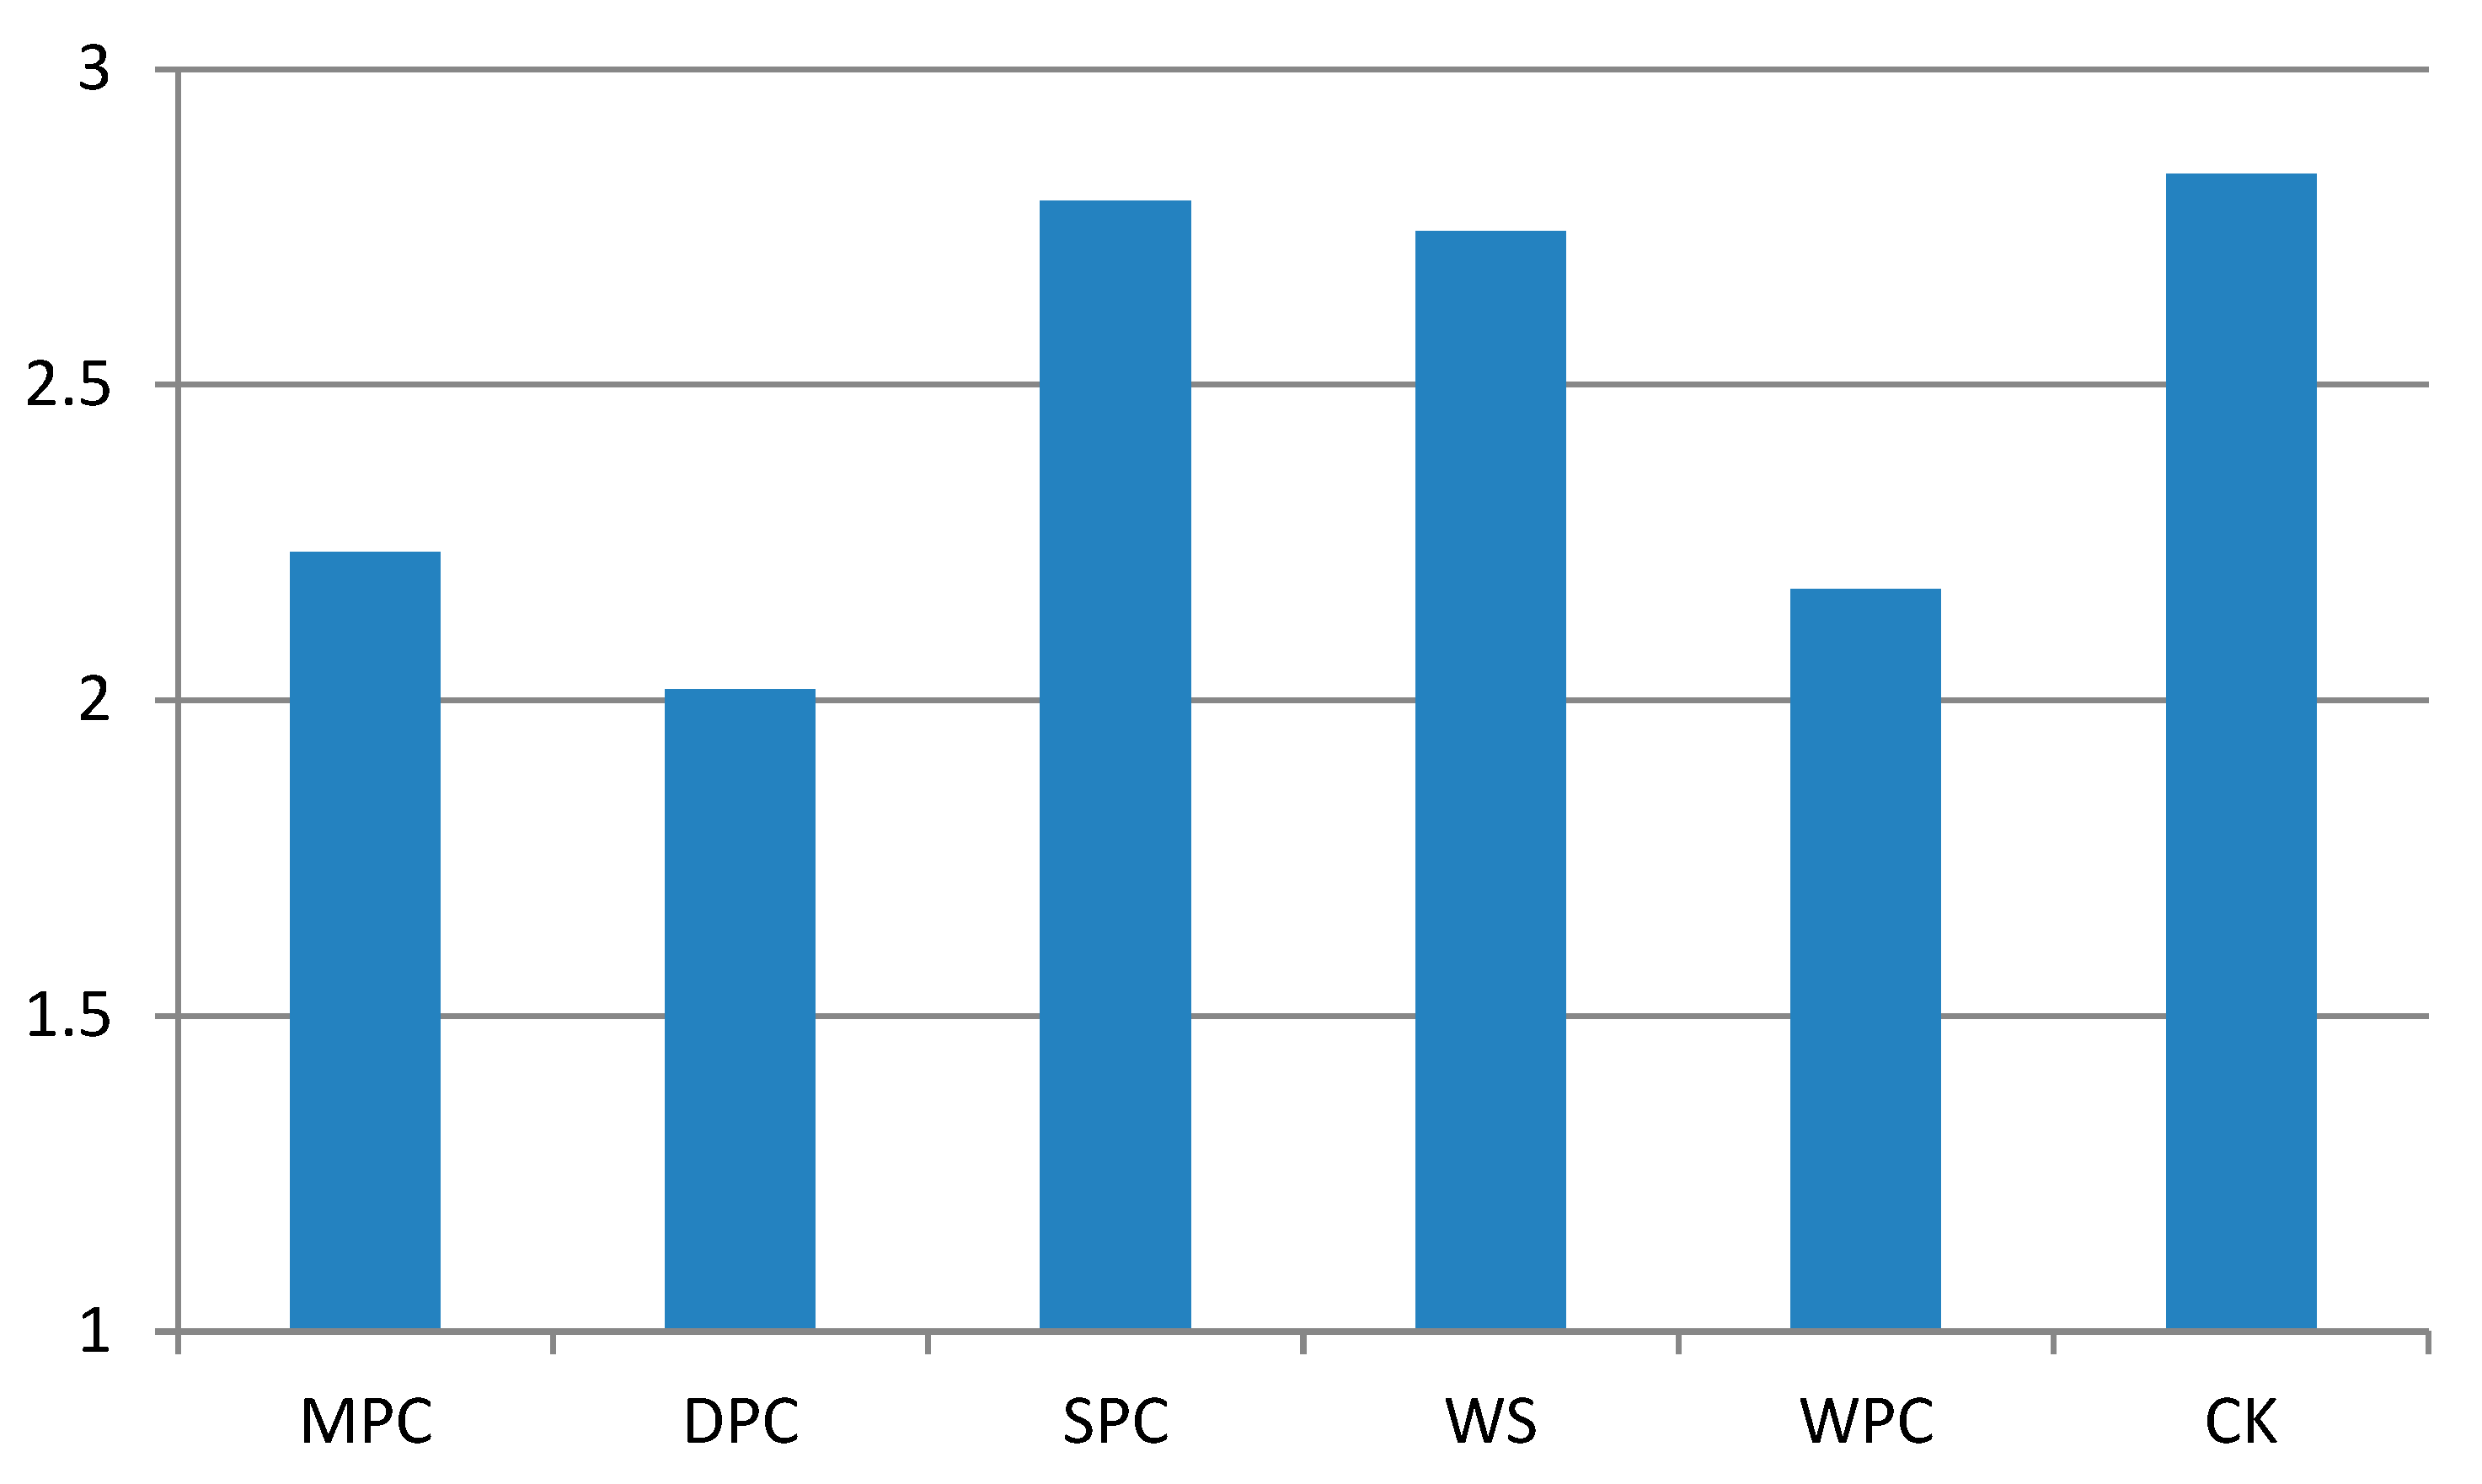
3.3. Differences of Typical Landscape Environment and Body Comfort of Green Space

Figure 8 (including Figure 8a–c) and Figure 9, respectively, show the instantaneous values and mean values of thermal sensation in areas with different typical landscape environments. As shown in Figure 8a, all of the community types in the morning felt comfortable. The MPC, DPC, and WPC community structure areas were associated with “cool comfort”, while the SPC and WS community structure areas were associated with “warm comfort”. As the MPC community structure in this section is the same as the TSG community structure, the corresponding results are the same as those reported in Section 2.1. The results presented in Figure 8b,c are very similar, showing that thermal sensation in the typical landscape environment areas increased or remained roughly stable within the threshold range of “thermal discomfort” (2≤│PMV│≤3). The results in Figure 9 show that thermal sensation in the three landscape environments represented by the MPC, DPC, and WPC community structures ranged from “thermal comfort” to “thermal discomfort”. The WPC community area showed similar characteristics to the DPC community area, which may have been due to its open space and proximity to a water body, which is conducive to ventilation. The two landscape environments of SPC and WS were associated with significant “thermal discomfort”, as they were subject to strong direct solar radiation.

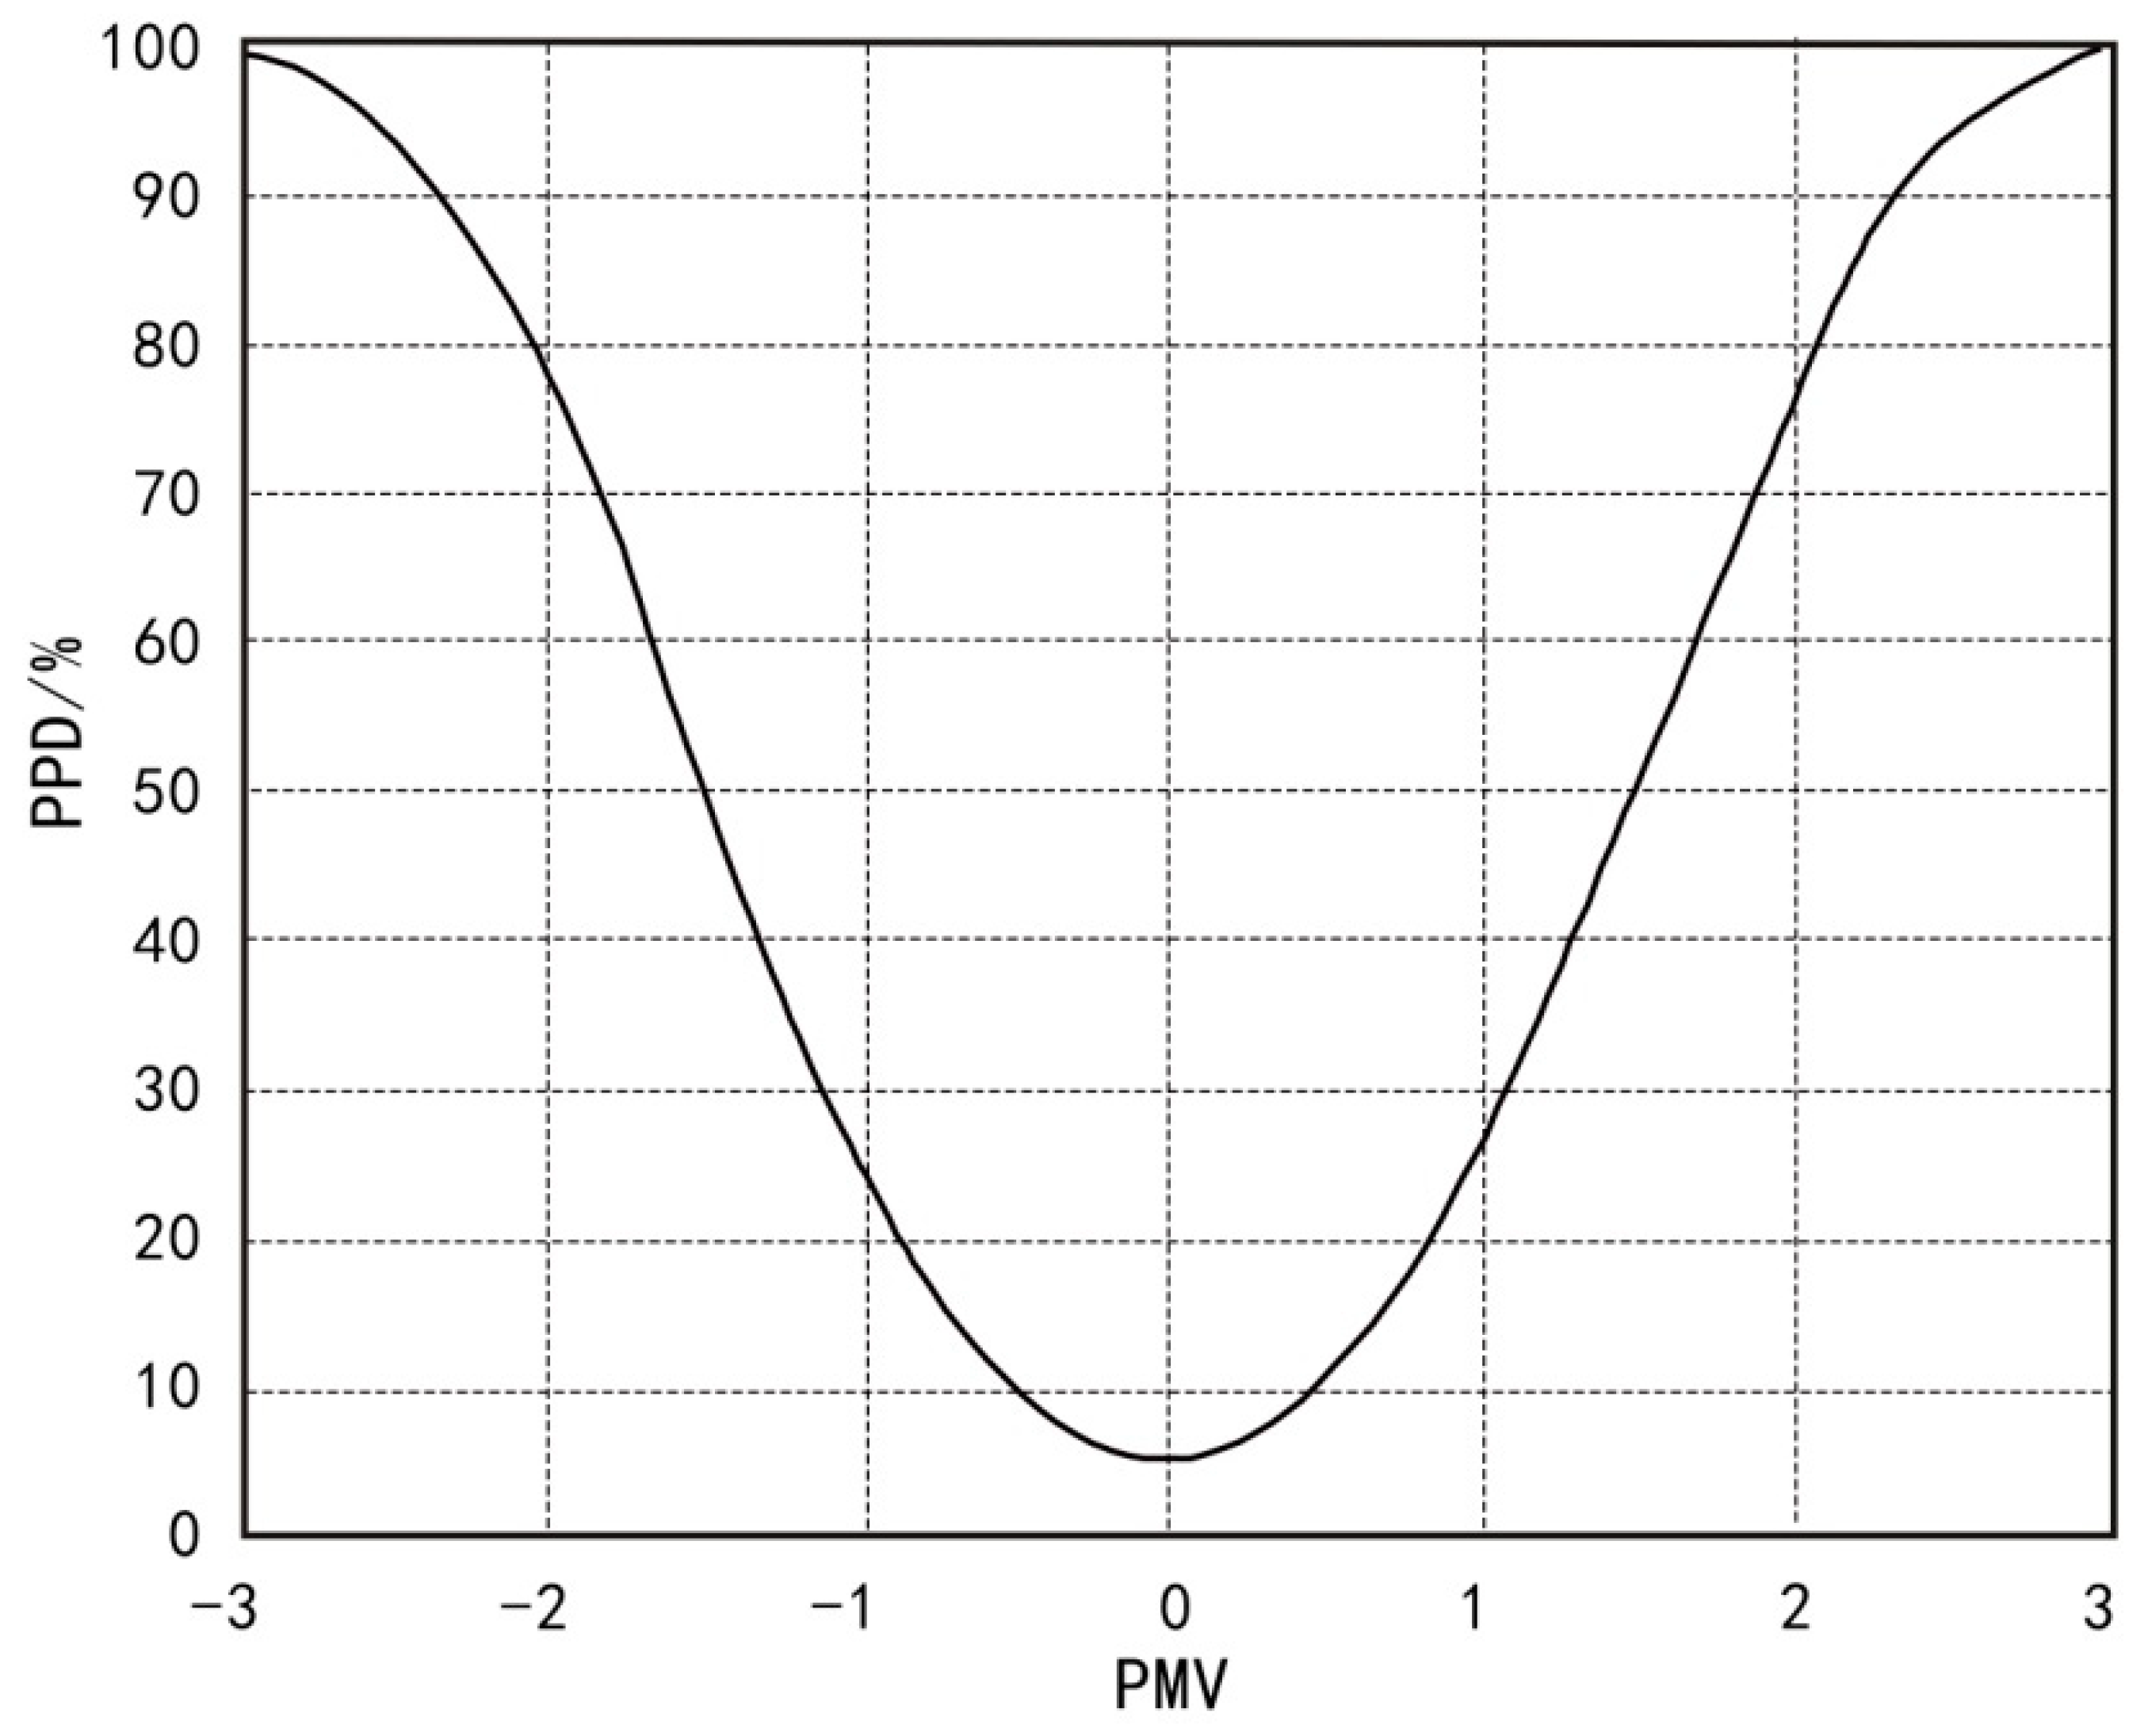
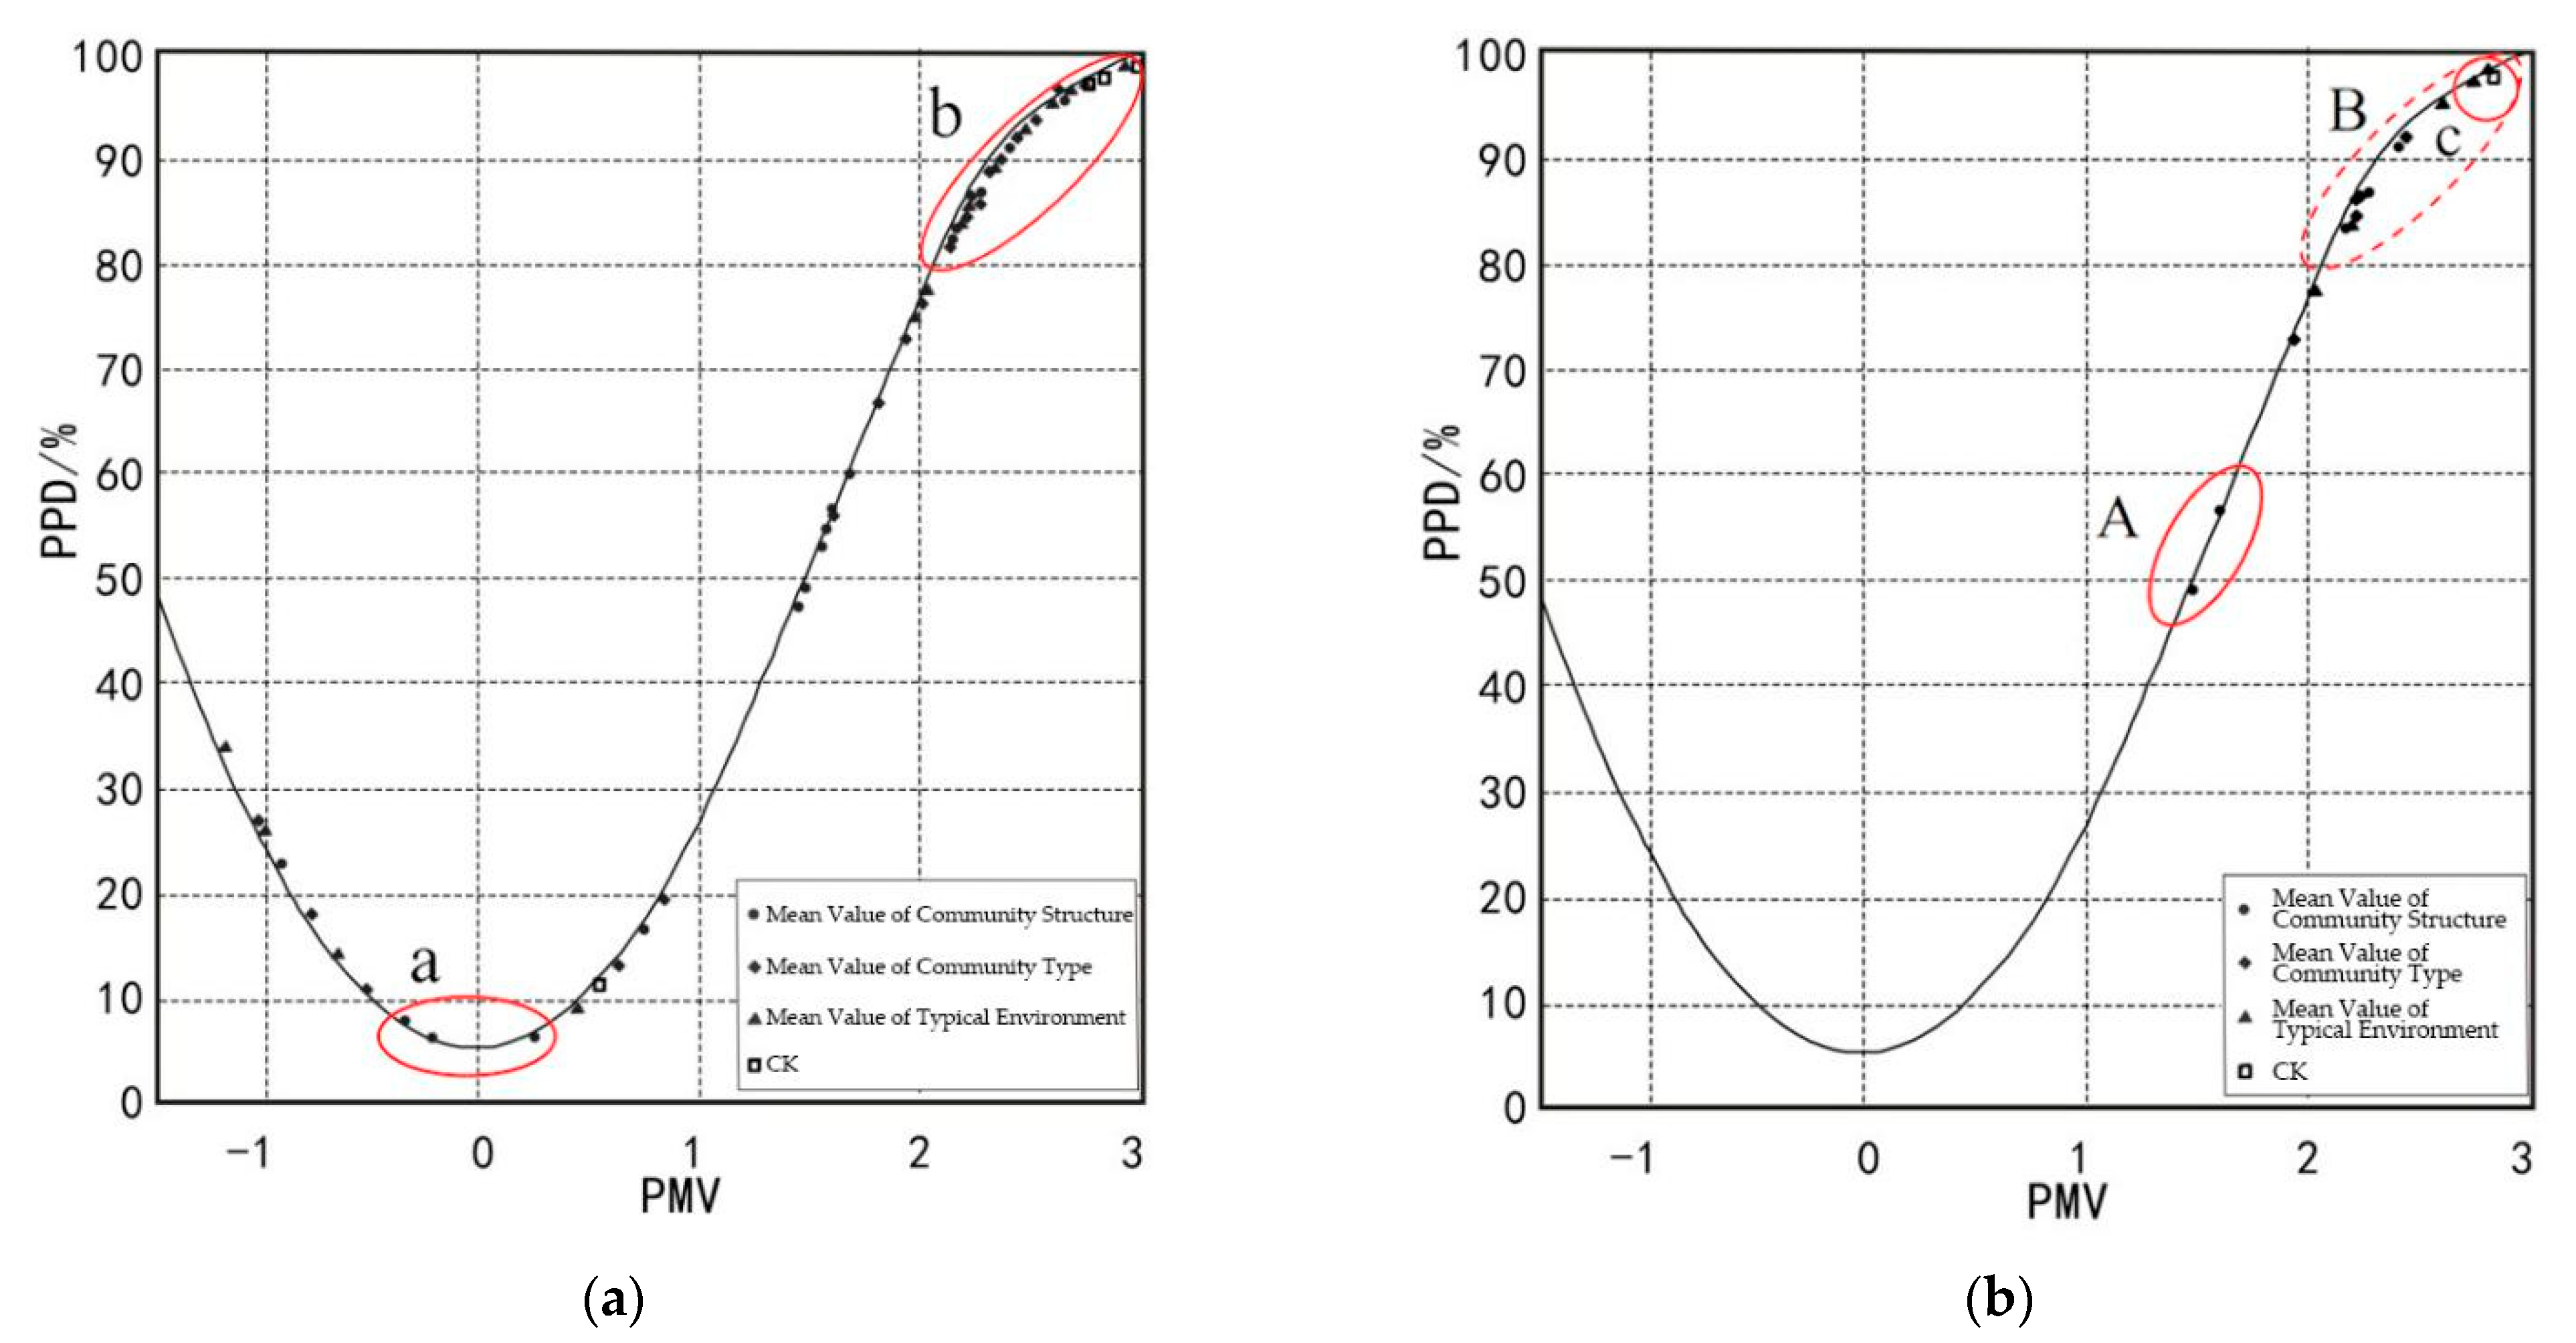
3.4. Fitting PMV–PPD Body Comfort Index to Observed Values across Landscape Types of Green Space

Figure 10 shows the results of fitting the PMV–PPD thermal comfort index to the observed values for the representative landscape types of green space. The background curve in the figure is the PMV–PPD mathematical function relationship (the complete curve is shown in Figure 3). Figure 10a fits the mean and instantaneous values of body comfort across landscape types to the PMV–PPD curve, and Figure 10b fits the mean values of body comfort across landscape types to the PMV–PPD curve. The distribution and degree of aggregation of the body comfort index values on the fitting curve directly reflect the differences in body comfort across green landscape types. As shown in Figure 10a, the instantaneous somatosensory comfort index values of the sample points with green space community structure as the influencing factor are closest to the ideal data points (PMV = 0, PPD = 5%), followed by the values for the waterfront plant community area. The morning instantaneous values for somatosensory comfort show a “comfortable” state (│PMV│ < 1, PPD < 20%). As shown below in Figure 10a, most of the body comfort index values are located around the upper right part of the curve (PMV > 2, PPD > 80%), indicating “thermal discomfort”. This may be related to the choice of August, a summer month, as the test period.
Figure 10b shows the fitting distribution of the mean values of the body comfort index during the test period. The figure shows that the body comfort index values of the sample points with green space community structure as the influencing factor are closest to the ideal data points (indicating thermal comfort), specifically the plant community area with arbour shrubs and grass structures (A in Figure 10b). The somatosensory comfort index values for the comparison sample (CK) and most of the landscape types are located around the upper right part of the curve (B and C in Figure 10b). This suggests that the overall environment was perceived as too hot (i.e., “thermal discomfort”), which may be related to the decision to collect data in August, when the temperature is high.

4. Discussion

4.1. Correlation between Plant Community Structure and Somatosensory Comfort in Green Space

According to previous studies, the three-dimensional size of a plant community is correlated with temperature, relative humidity, and the PMV index [15,21]. Compared with the other structural types, the TSG MPC community structure in this study had the largest volume of green space or greenery, helping to reduce the intensity of the UHI effect. However, as reported in Section 3.1, the level of somatosensory comfort in this environment was not high. This finding is not completely consistent with other studies [21]. In the process of landscape architecture planning and design, the TSG MPC community structure can be adopted in urban areas with a strong heat island effect. However, if a human activity site is located within or near a TSG MPC area, the canopy density of upper trees and coverage of shrubs in the forest should be controlled to maximise ventilation and light transmission and give full play to the advantages of this plant community structure.
Section 3.1 reports that the DPC community structure area with TS and TG had the highest level of somatosensory comfort compared with the other community structure areas, for three reasons:
(1)
The arbour canopy acted as a “buffer zone”, intercepting sunlight travelling into the forest and thereby controlling the temperature in the forest [20];
(2)
Transpiration from forest canopy leaves controlled the relative humidity in the forest [16,18];
(3)
The lack of inter-forest vegetation layers was conducive to horizontal and vertical airflow in the forest, helping to regulate somatosensory comfort. However, the quantitative relationship between canopy closure and somatosensory comfort needs to be further studied.

4.2. Correlation between Plant Community Types and Somatosensory Comfort in Green Space

Section 3.2 reports that the somatosensory comfort of some DBP community structure areas was greater than that of areas with other types of plant communities. This may be related to the high biochemical efficiency of DBP, but further research is needed. Beijing is located in the ecotone of two vegetation types, namely, CBP and DBP. DBP is the main local vegetation type. In the tree species composition of this vegetation type, native trees such as poplar, willow, elm, Sophora japonica, toon, and maple are prevalent. The somatosensory comfort provided by experimental sites with these kinds of plants should be considered. The P test site located in the north of BOFP was a TG DPC community structure area composed of Ginkgo biloba and grass. The physical comfort experienced at this sample point was poor, perhaps because Ginkgo biloba is not native to Beijing, so its growth potential is limited, and it lacks large and dense canopies.

4.3. Correlation between Typical Landscape Environment of Green Space and Physical Comfort

The analysis of the relationship between typical landscape environments and the somatosensory comfort provided by green space provided a multi-perspective verification of the analysis in Section 3.1 and Section 3.2 The results were similar to those in Section 3.1, indicating that DPC community structure areas offered a high level of somatosensory comfort. Somatosensory comfort in WPC community areas was also high because both shade and ventilation were provided by upper trees [20,26,28,29]. Water bodies with a large surface area have always been a scarce landscape resource in Beijing, on account of the climatic conditions of northern China. The water body in the green space of BOFP is artificial. Such landscape features can only be constructed if the area of green space is large enough and investment is sufficient. Therefore, the conclusion that the WPC community areas provided high somatosensory comfort is actually of limited significance for practical application. However, this finding does show that ventilation is conducive to the improvement of somatosensory comfort and that the right ventilation conditions are derived from “wind guiding” or even “wind making”. The scientific basis of this relationship needs to be further studied. Based on the numerical fitting in Section 3.4 combined with the analysis results in Section 3.1, Section 3.2 and Section 3.3, the improved thermal comfort provided by DPC community structure areas (i.e., TS, TG, and DBP) deserves careful attention in future research.
The research reported in this paper was carried out over 15 years. With the continuous growth and development of green space vegetation in BOFP, the three-dimensional quantity of greenery per unit of green space area will become larger and larger (until it reaches a stable value). The role of green space vegetation in improving the urban regional thermal microenvironment may become more and more significant. What are the intensity and scope of this UCI effect? The measurement methods used in this study revealed only the spatial differentiation of body comfort in discontinuous and point areas. How can continuous data be obtained? It may be effective to use remote sensing to gather data for interpretation and inversion while carrying out continuous monitoring. The results support the “evidence-based design” of landscape architecture, providing a scientific foundation for the planning and design of functional green spaces that efficiently improve microenvironmental conditions.

5. Conclusions

The above findings lead to suggestions for urban landscape environmental planning, design, and renewal practice. In areas in which the UHI effect is intense, TS and TG community structures with DBP as the dominant species should be adopted to significantly improve human thermal comfort. However, the focal microenvironmental factors show significant temporal and spatial differentiation due to the varying geographic, climatic, and other characteristics of the city in which BOFP is located, such as differences in landscape patterns, species composition, quantity of regional green space vegetation, and patterns of growth. Given the complexity of the research object—urban green space—the study was unable to comprehensively model the spatial composition of green space plant communities and may have ignored or failed to pay attention to important heterogeneous factors. Therefore, the findings require further testing to ensure their reliability and generalisability.

Author Contributions

Conceptualization, L.Z. and J.P.; methodology, J.P.; software, J.P.; validation, L.Z., H.X. and J.P.; formal analysis, J.P.; investigation, L.Z.; resources, J.P.; data curation, J.P.; writing—original draft preparation, L.Z.; writing—review and editing, L.Z.; visualization, J.P.; supervision, H.X.; project administration, J.P.; funding acquisition, L.Z., H.X. and J.P. All authors have read and agreed to the published version of the manuscript.

Funding

This research received the support from the funding of research enhancement project for young scholars(X21046 and X21044), Beijing University of Civil Engineering and Architecture and the national natural foundation of China (51641801).

Institutional Review Board Statement

Not applicable.

Informed Consent Statement

Not applicable.

Data Availability Statement

Not applicable.

Conflicts of Interest

The authors declare no conflict of interest.

References

  1. Li, Y.; Zhang, J.; Gu, R. Research on the Relationship between Urban Greening and the Effect of Urban Heat Island. Chin. Landsc. Archit. 2004, 20, 72–75. [Google Scholar]
  2. Chen, L.D.; Sun, R.H.; Liu, H.L. Eco-environmental effects of urban landscape pattern changes: Progresses, problems, and perspectives. Acta Ecol. Sin. 2013, 33, 1042–1050. [Google Scholar] [CrossRef]
  3. Nieuwenhuijsen, M.J. New urban models for more sustainable, livable and healthier cities post covid19; reducing air pollution, noise and heat island effects and increasing green space and physical activity. Environ. Int. 2021, 157, 106850. [Google Scholar] [CrossRef] [PubMed]
  4. Ying, X.; Fang, Z. Thermal environment effects of urban human settlements and influencing factors based on multi-source data: A case study of Changsha city. Acta Geogr. Sin. 2020, 75, 2443–2458. [Google Scholar]
  5. Zhang, Y.; Yu, Q.; Li, M.; Huang, Y.; Yue, P.; Wang, J. Simulation of Land Surface Temperature in Haidian District Based on EnKF-3DVar Model. Trans. Chin. Soc. Agric. Mach. 2017, 48, 166–172. [Google Scholar]
  6. Wang, X.; Zhu, Q.; Chen, S.; Liu, X.; Hu, Y. Remote Sensing Retrieval of Water and Heat Fluxes over Urban Green Space and Experimental Validation. Areal Res. Dev. 2010, 29, 63–66. [Google Scholar]
  7. Chen, Q.; Cheng, Q.; Chen, Y.; Li, K.; Wang, D.; Cao, S. Analysis of the Influence of the Urban Building Sky View Factor on Land Surface Thermal Environment. Sci. Surv. Mapp. 2021, 46, 148–155. [Google Scholar]
  8. Xie, J.; Cong, R.; Wang, Y.; Duan, M. Spatiotemporal Characteristics of Surface Temperature and Greening Role in Tongzhou District, Beijing. Chin. Landsc. Archit. 2021, 37, 41–45. [Google Scholar]
  9. Bassett, R.; Janes-Bassett, V.; Phillipson, J.; Young, P.J.; Blair, G.S. Climate driven trends in London’s urban heat island intensity reconstructed over 70 years using a generalized additive model. Urban Clim. 2021, 40, 100990. [Google Scholar] [CrossRef]
  10. Li, Y.; Zhou, D.; Yan, Z. Spatiotemporal Variations in Atmospheric Urban Heat Island Effects and Their Driving Factors in 84 Major Chinese Cities. Huanjingkexue 2021, 42, 5037–5045. [Google Scholar]
  11. Paranunzio, R.; Dwyer, E.; Fitton, J.M.; Alexander, P.J.; O’Dwyer, B. Assessing current and future heat risk in Dublin city, Ireland. Urban Clim. 2021, 40, 100983. [Google Scholar] [CrossRef]
  12. Gao, S.; Sha, J.-M.; Shuai, C. Quantitative Study on the Relationship between Land Surface Temperature and Vegetation Coverin Xiamen City. J. Fujian Norm. Univ. 2019, 35, 14–21. [Google Scholar]
  13. Liu, S.; Xie, M.; Wu, R.; Wang, Y.; Li, X. Influence of the choice of geographic unit on the response of urban thermal environment: Taking Beijing as an example. Prog. Geogr. 2021, 40, 1037–1047. [Google Scholar] [CrossRef]
  14. Ye, W.T.; Chen, Y.H.; Lu, Y.H.; Wu, P. Spatio-temporal variation of land surface temperature and land cover responses in different seasons in Shengjin Lake wetland during 2000–2019 based on Google Earth Engine. Remote Sens. Land Resour. 2021, 33, 228–236. [Google Scholar]
  15. Chen, B.; Xu, S.; Yang, D.; Wang, H. Thermal Environmental Effects of Park Landscape of Main Urban Region in Wuhan. Remote Sens. Inf. 2021, 36, 58–66. [Google Scholar]
  16. Shi, L.; Zhao, M. Cool island effect of urban parks and impact factors in summer: A case study of Xi’an. J. Arid. Land Resour. Environ. 2021, 34, 154–161. [Google Scholar]
  17. Fu, Y. Research on the Evolution Characteristics and Regulation Mechanism of Urban Thermal Environment and Comfort. Doctoral Dissertation, University of the Chinese Academy of Sciences, Beijing, China, 2020. [Google Scholar]
  18. Zhan, H.; Xie, W.-J.; Sun, H.; Huang, H. Using ENVI-met to simulate 3D temperature distribution in vegetated scenes. J. Beijing For. Univ. 2014, 36, 64–74. [Google Scholar]
  19. Chen, R. Microclimate Correlation Analysis of Landscape Elements in City Parks. Landsc. Archit. 2020, 27, 94–99. [Google Scholar]
  20. Zhang, X.; Nie, Q.; Liu, J. Research on urban geothermal comfort improvement strategy based on ENVI-met. Ecol. Sci. 2021, 40, 144–155. [Google Scholar]
  21. Geng, H.; Wei, X.; Zhang, M.; Li, Q. Influenceofvegetationandarchitecture on microclimate based on Envi-met: A case study of Nanjing Agricultural University. J. Beijing For. 2020, 42, 115–124. [Google Scholar]
  22. Wang, K.; Xue, S. Correlation Analysis of Buildings, Green Layout and Human Comfort in Summer in Urban Residential Areas: Taking Zhengzhou as an Example in Cold Region. Build. Sci. 2021, 37, 53–60. [Google Scholar]
  23. Singh, V.K.; Mughal, M.O.; Martilli, A.; Acero, J.A.; Ivanchev, J.; Norford, L.K. Numerical analysis of the impact of anthropogenic emissions on the urban environment of Singapore. Sci. Total Environ. 2022, 806, 150534. [Google Scholar] [CrossRef] [PubMed]
  24. Lai, J.; Zhan, W.; Quan, J.; Liu, Z.; Li, L.; Huang, F.; Hong, F.; Liao, W. Reconciling Debates on the Controls on Surface Urban Heat Island Intensity: Effects of Scale and Sampling. Geophys. Res. Lett. 2021, 48, e2021GL094485. [Google Scholar] [CrossRef]
  25. Chen, Y.; Song, S.; Hou, Y. Effect of Vertical Greening in Summer on Human Comfort in Nanjing. Chin. Landsc. Archit. 2020, 36, 64–69. [Google Scholar]
  26. Zhao, H.Y.; Mao, B. Multi-Scale Optimization on Urban Wind Environment of Changchun City Based on Improved Ventilation and Thermal Comfort. J. Hum. Settl. West China 2020, 35, 24–32. [Google Scholar]
  27. Pan, J.; Li, S. Study on Spatial Pattern of the Function of Thermal Comfort Improvement on Beijing City Parks. Chin. Landsc. Archit. 2015, 37, 91–95. [Google Scholar]
  28. National Standard of the People’s Republic of China. Ergonomics of the Thermal Environment: Analytical Determination and Interpretation of Thermal Comfort Using Calculation of the PMV and PPD Indices and Local Thermal Comfort Criteria. GB/T 18049–2017. Available online: https://openstd.samr.gov.cn/bzgk/gb/index (accessed on 27 January 2023).
  29. Liu, K.; Ma, C.; Chen, W.; Liu, B. Exploration of Waterfront Landscape Planning and Design for Thermal Comfort in Microclimate. Landsc. Archit. 2020, 27, 104–109. [Google Scholar]
Figure 1. Location map of Beijing Olympic Forest Park.
Sustainability 15 02969 g001
Figure 2. Seventeen experimental sample points in the green space of BOFP.
Sustainability 15 02969 g002
Figure 3. Mathematical function relationship between PMV and PPD.
Sustainability 15 02969 g003
Figure 4. (a). Regional thermal sensation in green plant community structure areas (morning instantaneous values). (b). Regional body comfort in green plant community structure areas (noon instantaneous values). (c). Regional body comfort in green plant community structures (afternoon instantaneous values).
Sustainability 15 02969 g004aSustainability 15 02969 g004b
Figure 5. Regional body comfort in green plant community structure areas (mean values).
Sustainability 15 02969 g005
Figure 6. (a). Regional body comfort in green plant community type areas (morning instantaneous values). (b). Regional body comfort in green plant community type areas (noon instantaneous values). (c). Regional body comfort in green plant community type areas (afternoon instantaneous values).
Sustainability 15 02969 g006aSustainability 15 02969 g006b
Figure 7. Regional body comfort in green plant community type areas (mean values).
Sustainability 15 02969 g007
Figure 8. (a) Body comfort in typical landscape environment areas of green space (morning instantaneous values). (b) Body comfort in typical landscape environment areas of green space (noon instantaneous values). (c) Body comfort in typical landscape environment areas of green space (afternoon instantaneous values).
Sustainability 15 02969 g008aSustainability 15 02969 g008b
Figure 9. Body comfort in typical landscape environment areas of green space (mean values).
Sustainability 15 02969 g009
Figure 10. (a). PMV–PPD instantaneous value/mean fitting. (b) PMV–PPD mean fitting. Index Value Fitting of PMV–PPD Body Comfort Across Landscape Types of Green Space. The red circle (a, b, c, A, B) in the Figure 10 shows the aggregation area of PMV-PPD mean value fitting points.
Sustainability 15 02969 g010
Table 1. Biological characteristics of plant communities at green space test sample points in BOFP (synchronous test data).
Sample PointsCommunity StructureCommunity TypeDominant Species (DS)Other
Types
Plant Height (m)DBH (cm)Crown Width (m)Canopy Height
(m)
Canopy Density (CD)
CK 1---------
CK 2---------
ATGDBPPopulus tomentosaPinus tabulaeformis, Sabina chinensis, Midget crabapple, Syringaoblata10–1225–302.0–2.55.0–6.00.65
B--Salix matsudanacvpendulaPhragmitescommunis,
Purple loosestrife
4.5–5.520–254.0–4.52.0–2.50.25
CTSGDBPSalix matsudana f.pendulaLonicera maackii5.5–6.020–253.5–4.03.0–3.50.75
DTSGCBPSabina chinensis;
Sophora japonica
Salix matsudana3.5–4.0/
5.5–6.0
20–252.0–2.5/
4.5–5.0
1.5–2.0/
2.5–3.0
0.85
ETCPPinus tabulaeformisPrunus armeniaa, Lonicera maackii, Vitex negundo3.0–3.510–153.5–4.01.5–2.00.35
FTGDBPSalix matsudanaRobinia pseudoacacia (young), Viburnum dilatatum7.0–8.020–254.5–5.03.0–4.00.85
GSGSSyringa oblataSophora japonica, Forsythia suspensa2.5–3.02.0–2.51.5–2.00.75
HSGSCaryopteris×clandonensis,
‘Worcester Gold’
Euonymus japonicus0.5–1.00.45
ISGSEuonymus japonicusSophora japonica0.5–1.00.45
JSGCPPinus tabulaeformisUlmus pumila, Fontanesia4.5–5.010–152.5–3.02.0–2.50.55
KSGDBPPrunus trilobaPinus tabulaeformis, Sophora japonica3.0–3.52.0–2.51.0–1.50.75
LGGLawn and ground cover plantsPrunus armeniaca0.75
MTSCPPinus tabulaeformisSophora japonica, Syringaoblata3.5–4.010–152.5–3.01.5–2.00.95
NTSGCBPPopulus tomentosaMalus spectabilis, Weigela florida, Lespedeza9.5–10.025–302.5–3.05.0–6.00.90
OTSGDBPSophora japonicaSyringa oblata, Forsythia suspensa6.5–7.020–254.0–4.52.5–3.00.90
PTGDBPGinkgo biloba-4.5–5.015–252.5–3.02.0–2.50.75
QTGDBPSophora japonica, FraxinuschinensisSyringa microphylla, Sorbaria sorbifolia, Prunuscerasifera3.5–4.015–203.0–3.5/5–62–3/3–40.75
Table 2. PMV thermal sensation scale (ASHRAE thermal sensation).
Thermal SensationCold Cool Slightly Cool ModerateSlightly WarmWarm Hot
PMV Value −3−2−10123
Disclaimer/Publisher’s Note: The statements, opinions and data contained in all publications are solely those of the individual author(s) and contributor(s) and not of MDPI and/or the editor(s). MDPI and/or the editor(s) disclaim responsibility for any injury to people or property resulting from any ideas, methods, instructions or products referred to in the content.

