Abstract
This paper aims to investigate corporations’ ESG for sustainable investment in China, with the moderating role of regional marketization. ESG is a form of business value for enterprises, including the three pillars of environmental, social, and governance, aimed at promoting the sustainable development of the economy and society. ESG is vital for corporations’ sustainable investment, but such influence is always limited by the level of regional marketization, which has been rarely studied by the previous literature. In this study, we use data from Chinese A-share listed companies from 2009 to 2021 to conduct an empirical analysis to examine whether ESG performance can improve firm investment and if the degree of regional marketization plays a moderating role. Furthermore, we identify the underlying mechanism of ESG performance influencing corporate investment. It has been discovered that ESG performance improves firm investment, and the impact of ESG performance on investment level enhancement is stronger in places with a higher level of marketization. The further tests still support our results. This study provides a reference to develop ESG and regional marketization to push corporations’ sustainable development.
1. Introduction
Green development and the idea of sustainability are the current trends in economic development. Sustainable development, as defined by the World Commission on Environment and Development (WCED), is “development that meets the needs of the present without compromising future generations’ ability to meet their own needs”. Demanding green development and sustainable development is essential for the ecological environment and social economy because unsustainable exploitation and the consumption of natural resources will lead to ecological damage and a loss of biodiversity, which will ultimately endanger human survival. The concept of ESG was first introduced by the United Nations Global Compact (UNGC) and 20 financial institutions in a report entitled “Who Cares Wins” published in 2004 to promote a more environmentally conscious orientation when considering social responsibility and corporate governance, and is the cutting-edge form of the sustainability concept. ESG comprises three pillars: environmental, social, and governance, which, in addition to economic benefits, takes into account the concern for environmental and social sustainability, focusing on stakeholder benefits and long-term value growth. The study and promotion of the ESG concept is important to promote high-quality economic growth and sustainable social development.
It is commonly believed that investments in ESG can provide numerous benefits to companies [1], including a reduction in corporate risk [2,3], a decrease in the cost of capital [4,5], and an improvement in financial performance [6,7], non-financial performance [8,9], market performance [10], and corporate value [11,12]. Investment ability, investment opportunity, and investment willingness are the main factors that influence firms to make investment decisions. ESG can alleviate the financing constraints faced by firms and enhance their investment ability, and a good relationship with stakeholders can bring more investment opportunities for firms; meanwhile, the risk mitigation effect and corporate governance effect of ESG can enhance management’s willingness to invest, therefore, reasonable expectation of corporate ESG performance can enhance the level of corporate investment. A review of the existing literature shows that no research has yet explored the relationship between ESG performance and corporate investment level. However, it is important to examine the relationship between them. First, investment decisions involve the allocation of core corporate resources and are an important part of corporate strategy, which is crucial for building corporate core competitiveness, generating cash flow, and enhancing share-holder wealth. Secondly, corporate investment is the basis of economic operation, and improving the level and efficiency of corporate investment is essential to enhance the sustainable development of the economy and society. Based on the above analysis, this paper intends to investigate whether corporate ESG performance can improve corporate investment levels, and at the same time, to investigate whether the degree of regional marketization plays a moderating role by taking advantage of the good opportunity brought by the uneven development of China’s regions [13,14]. Based on Chinese A-share listed companies from 2009 to 2021, we examine the relationship between ESG performance and investment, as well as the moderating role of marketization. The findings indicate that (1) ESG performance can significantly increase a company’s level of investment; (2) in regions with higher marketization, ESG performance is more effective in signaling, economic utility, and alleviating financing constraints. Consequently, the effect of ESG performance on investment enhancement is greater; and (3) the economic consequence analysis demonstrates that the investment induced by ESG performance is commensurate with the current state of firm development and will improve investment efficiency. The mediation test demonstrates that financing constraints and agency costs act as a mediator between ESG performance and investment level. An analysis of heterogeneity reveals that the effect of ESG performance on investment level is greater in firms with a smaller size, non-state status, weaker internal control, and in firms that are audited by non-big4 accounting firms.
The research contributions of this paper may include the following: (1) This study advances ESG research. Corporate ESG research includes studies of the drivers and economic consequences of ESG investments made by firms. The investment level is of great importance to companies, the economy, and society, and it is valuable to explore the relationship between corporate ESG performance and investment levels. This paper would contribute to the literature on the economic effects of corporate ESG by examining the relationship between ESG performance, investment level, and investment efficiency, as well as the moderating role of regional marketization. (2) The research on investment level is expanded in this paper. Existing research has concentrated on examining the relationship between a single factor of environmental, social, and governance and the degree of business investment due to the significance of increasing investment levels for economic development. Nevertheless, the interaction between environmental, social, and governance may result in discernible differences between the combined dimension and the single dimension in terms of investment level impact. For example, the positive impact of social aspects may counteract the negative impact of governance deficiencies, causing the impact effect of the integrated dimension to be obscured. This article explores the relationship between investment level and environmental, social, and governance factors. It suggests that despite the possibility of counteracting effects, the combined dimensions still have a positive impact on investment levels, and this paper will be a valuable addition to the literature on investment levels. (3) This paper will provide empirical evidence that regulators can use to better guide businesses in their application of ESG concepts. The investigation of the relationship between ESG performance and investment level and the analysis of the moderating effect on marketization enlightens regulators to modify ESG practices and information disclosure policies in accordance with regional marketization, which is conducive to the government and regulators’ full exercise of their guiding role, the advancement of the ESG concept, and the high-quality development of the economy.
2. Review of Literature and Hypotheses
According to the MM theory, firm investment and financing decisions are independent in a perfect market [15]. However, the real capital market is imperfect, and information asymmetries and transaction costs result in higher external financing costs than internal financing costs, causing firms to prioritize internal financing channels when raising capital for new projects [16,17]. Consequently, financing constraints become a significant factor limiting firm investment [18]. Since ESG information disclosure has become a public demand [19], companies can respond to this demand by proactively disclosing ESG information to reduce the information asymmetry between them and external stakeholders related to corporate sustainability, thereby enhancing the transparency of corporate sustainability strategies and alleviating companies’ financing constraints [20,21]. Due to the preference of socially responsible investors for firms with superior ESG performance, firms can reduce their cost of capital by increasing ESG investments [2,22]. Increasing ESG investments can also improve firms’ credit ratings, which reduces their capital costs even further. In addition, compared with social performance, the cost of the capital reduction effect of environmental performance and governance performance is greater, and the level of investor protection and the quality of information disclosure in the nation will both positively influence the cost of the capital reduction effect of ESG performance [4,5,23,24]. Therefore, firms with superior ESG performance can liberate capital by reducing the degree of information asymmetry with external investors, enhancing their capacity to make investments, and increasing the level of corporate investment.
Companies with superior ESG performance can signal to the outside world that they are highly capable and willing to uphold their implicit contracts [25], which helps them establish a relatively stable relationship of trust with their stakeholders. This trust relationship will serve as “insurance” during a crisis, enabling the organization to attract more investment from its stakeholders [26,27]. Active engagement in ESG activities can also create and maintain a strong social network with stakeholders, which helps to increase trust between businesses and stakeholders and promotes the accumulation of social capital, which can create new investment opportunities for businesses [28]. Therefore, good ESG performance facilitates the establishment of trust and network relationships with stakeholders, thereby increasing investment opportunities and boosting the investment level of companies.
Uncertainty increases the value of waiting for new information, and firms will invest only if the cost of delaying project investment is greater than the value of waiting for new information [29]. Bloom et al., Pàstor, and Veronesi suggested that firms invest more cautiously in the face of political uncertainty and typically respond by reducing investment [30,31]. Similar to developed economies, Wang et al. discovered a negative relationship between economic policy uncertainty and firm investment levels in transitional economies such as China. Specifically, firms with higher asset returns, predominantly internal financing, and that are non-state owned are less susceptible to economic policy uncertainty in terms of investment levels [32]. Czarnitzki and Toole discovered that when market return uncertainty increases, firms invest less in research and development [33]. Uncertainty is strongly and positively correlated with risk. Existing research has demonstrated that ESG investments can reduce systematic and unsystematic risk [2,3,22,27,34,35] and litigation risk [22], and protect firms from downside risk [36]. Therefore, improved ESG performance can increase the investment propensity of management.
Corporate ESG performance increases management’s investment propensity not only by reducing investment uncertainty, but also from the perspective of corporate governance. Investing in ESG enables businesses to actively share the benefits of corporate growth with their stakeholders [37], increase stakeholders’ affiliation with the business [20], increase participation in corporate governance, which ensures management is held accountable by shareholders and stakeholders, and reduce management opportunism and agency costs. Large investments in ESG-related expenditures by companies may have a negative short-term impact because ESG-related investments frequently require more resources and effort, and corporate social responsibility, advertising, and R&D expenditures are characterized by a long investment cycle in which the specific amount of expenditures can be determined at the moment, but it is uncertain whether and when costs will be recovered or benefits achieved [38]. Under the pressure of stakeholder monitoring, management will have a greater propensity to invest in projects with more stable investment returns, and corporate investment levels will rise. Consequently, companies with superior ESG performance can increase management’s willingness to invest by reducing agency costs, thereby increasing corporate investment levels.
In conclusion, companies with a superior ESG performance disclose more information, the information asymmetry between companies and external investors is reduced, and the cost of external financing is reduced. Companies are subject to fewer financing constraints, their investment capacity is enhanced, and the level of investment also rises. Second, companies with a superior ESG performance have a greater ability and willingness to fulfill implicit contracts and can establish solid trust and network relationships with stakeholders, thereby attracting more investment opportunities and increasing the level of corporate investment. Lastly, companies with a better ESG performance are typically less risky, have less investment uncertainty, and have a higher investment propensity among firm management. Meanwhile, companies with a superior ESG performance have a larger stakeholder base, more management oversight, and lower agency costs. Management, which is overseen by shareholders and other stakeholders, has increased its willingness to invest to mitigate the short-term negative impact of ESG investment spending on corporate profitability, resulting in a rise in investment levels. The following hypothesis is proposed based on the preceding analysis:
Hypothesis 1 (H1).
In comparison with firms with poor ESG performance, firms with better ESG performance have a higher investment level.
Companies interact with stakeholders through ESG investments, and the interaction space, that is, the market in which they are located, will have a significant impact on the economic effects of ESG performance. China’s vast geographical region and unbalanced regional development provide a good context for studying the impact of the marketization process on the relationship between ESG performance and investment levels. According to Wang et al., regional marketization encompasses the relationship between the government and the market, the development of the non-state economy, the degree of product market development, the degree of factor market development, and the development of market intermediary organizations and the legal institutional environment [39]. We intend to examine the impact of regional marketization on the relationship between ESG performance and investment levels from the current perspective of these subitems. Initially, the government-market relationship will have a negative impact on the financial constraint relief effect of ESG performance. Bank lending decisions may be affected by government intervention. Yan et al. used the natural experimental opportunity provided by the different responses of Chinese interbank associations in Shanghai and Tianjin during the 1934 “Silver Boom” in the 1930s to test the impact of government intervention on the performance and behavior of financial organizations. The study determined that the Shanghai Interbank Association, which was closer to the Nanjing National Government than the Tianjin Interbank Association, was subject to greater government intervention and greater transparency of bank information, and therefore did not experience a market run during the crisis. In contrast to the Tianjin Interbank Association members, who reduced lending to control risks, the Shanghai Interbank Association members increased lending to the market due to their bailout responsibilities and engaged in vigorous countercyclical operations [40]. In regions with greater government intervention, companies with better ESG performance have reduced information asymmetry with external investors, particularly banks, by enhancing information disclosure. Nonetheless, because banks’ lending decisions are more influenced by the government than by the market, the financial support available to companies with better ESG performance is still less under the condition that the capital stock is determined, and the effect of ESG performance investment level enhancement is severely constrained.
Second, regions with developed non-state-owned economies and higher product and factor market development have a more competitive market, and ESG can be used by businesses to increase their market competitiveness. Researchers discovered that the relationship between socially responsible performance and firm value is influenced by the firm’s market, specifically the consumer goods market. When the market is related to products, society, and the environment, companies have a greater need to differentiate themselves from competitors, the need for companies to make socially responsible investments is greater, and companies benefit more from such investments [41,42]. Using a scenario of massive import tariff reductions in the U.S. manufacturing sector between 1992 and 2005, Flammer investigated the relationship between market competition and CSR in a quasi-natural experiment. The study found that domestic firms responded to the increased competition caused by the entry of foreign firms into the domestic market by maintaining good relationships with local consumers, employees, and other stakeholders [43]. This lends credence to the notion that CSR is a competitive strategy and that trade liberalization is a major factor influencing corporate ESG practices. When the market is more competitive in the region where a company is located, the need for firms to differentiate themselves from other competitors increases, and this increased need amplifies the impact effect of ESG performance, thereby increasing the company’s benefits [41].
Finally, the evolution of market intermediaries and the legal institutional environment may influence the effect of ESG performance on investment levels by influencing the role of signaling. Spence was the first to propose signal theory to explain the adverse selection problem between employers and job applicants on the labor market as a result of information asymmetry [44]. Economics, Management, and Sociology have made extensive use of it. Two important conditions must be met for the signal theory to be effective: first, the information superior party must release the signal on its own volition, which is non-coercive. Second, the signal must be expensive and difficult to imitate by businesses without this information advantage. In a highly competitive environment, businesses are incentivized to release proactive signals that they have made ESG-related investments. The better the ESG performance of a company, the more likely it is to release relevant information proactively, and the more detailed the information released. In regions with more developed market intermediaries and a more favorable legal climate, regulators are more responsive to false information and are more likely to punish it. Therefore, companies with poor ESG performance are expected to bear higher costs for “green washing” by disclosing false ESG information, which will further ESG practices and disclosures for companies with significantly better ESG performance. Investors have a greater degree of recognition of corporate ESG ratings, and ESG performance has a larger influence on investment levels.
In conclusion, the degree of marketization in the region where the company is located will have a substantial impact on the effect of ESG performance on investment level enhancement. Government intervention affects financial institutions’ lending decisions, which weakens the release effect of ESG performance on financing constraints and has a significant effect on companies’ investment decisions. The growth of the non-state economy and the extent to which product and factor markets have evolved have made the competitive environment more difficult for businesses. Consequently, businesses are under increased pressure to enhance their competitiveness by increasing their ESG investment, and this increased pressure amplifies the economic impact of ESG performance. In the meantime, the intense competitive environment and improved legal environment influence the relationship between ESG performance and investment level by affecting the signaling effect. The following hypothesis is proposed based on the preceding analysis:
Hypothesis 2 (H2).
In comparison with firms located in regions with a lower level of marketization, the influence of ESG performance on investment level is more significant in firms located in regions with higher level of marketization.
3. Research Design
We used A-share firms from China’s stock market as a sample, which is the panel data. Therefore, panel regression model is the main analysis method. We used panel regression models step by step: first, we used panel OLS regression model for the analysis; second, we used panel quantile model for robustness tests considering the relatively large sample; third, to further control for individual effects, we used panel fixed effects models for robustness analysis.
3.1. Sample Selection and Data Sources
Since the explanatory variables in this paper are collected from the Sino-Securities Index Information Service (Shanghai, China) Co., Ltd., which can be traced back to 2009, our initial sample included all A-share firms on the Shanghai and Shenzhen Stock Exchanges from 2009–2021. We performed the following selection procedures: (1) excluding financial companies in accordance with the SFC’s 2012 Guidelines on Industry Classification of Listed Companies; (2) excluding listed companies in the ST and *ST categories; and (3) excluding companies with missing data. Additionally, to eliminate the impact of outliers, we winsorized all continuous variables at a level of 1% in each tail. In conclusion, 25,663 firm-year observations were obtained in this study. The ESG ratings data utilized in this study come from the Wind database, the total market capitalization index and its sub-indicators come from the China Market Index Database, and all corporate financial data comes from the CSMAR database. We employed the statistical analysis software STATA16 for data preprocessing and regression analysis.
3.2. Variables
3.2.1. Investment Level
In accordance with Kandilov and Leblebicioglu [45] the explained variable, investment level (INV1), was measured using the ratio of a firm’s net investment to its total assets at the beginning of the period, where net investment is the cash spent on the acquisition of fixed assets, intangible assets, and other long-term assets in year t of company i minus the net cash recovered from the disposal of fixed assets, intangible assets, and other long-term assets.
3.2.2. ESG Performance
Informed by Xie and Lyu [46] and Song et al. [47], we chose the ESG rating index to evaluate the ESG performance of businesses. The ESG index system of Sino-Securities Index Information Service (Shanghai) Co. Ltd. is based on the international mainstream ESG rating framework and combines the national conditions and market characteristics of China, including 14 themes, 26 key indicators, and more than 130 sub-indicators under the three categories of environmental, social, and corporate governance. In addition, it utilizes the industry-weighted average method for ESG evaluation, which has been updated quarterly since the first quarter of 2009. The ESG rating is divided into nine grades, ranging from low to high: C, CC, CCC, B, BB, BBB, A, AA, and AAA, respectively. Referring to Lin et al. [48], the ESG rating of businesses was assigned on a scale from 1 to 9, with higher values indicating higher ESG ratings.
3.2.3. Degree of Marketization
Using the China Market Index Database [32,39], we collected the total marketization index (MKI) and the sub-indicators, such as the government-market relationship (GI), the development of the non-state economy (NSI), the development of product markets (PI), the development of factor markets (FI), and the development of market intermediary organizations and legal institutional environment (LI) to construct dummy variables to measure the level of marketization (MK). When the total marketization index (MKI) is greater than or equal to the median of the same industry in the same year, the value is 1. Otherwise, the value is 0. Similar to the total marketization index, each dummy variable of sub-item indexes was defined in the same manner.
3.2.4. Control Variables
According to Richardson [49], the control variables are firm size (SIZE), financial leverage (LEV), cash flow (OCF), cash holding (CASH), investment opportunities (TOBINQ), growth (GROWTH), listing age (AGE), ownership (SOE), profitability (ROE), and whether the overlapping roles of chairman and general manager (DUALITY) and management shareholding (MH). (See Table A1 in Appendix A for specific details regarding computations for all variables.)
3.3. Regression Model
To test hypothesis H1, Model (1) is constructed in this paper:
To test hypothesis H2, Model (2) is constructed in this paper:
where i denotes listed companies and t denotes the year. INV1 is the explained variable, indicating the level of investment; ESG is the explanatory variable, indicating ESG performance; MK is the moderating variable, indicating marketization of the region in which the firm is located; Controls is the control variable; Year and Ind denote the year and industry dummy variables, respectively.
4. Empirical Results
4.1. Descriptive Statistics
The results of the descriptive statistics for the variables are shown in Table 1. The mean value of investment level is 0.055, indicating that the average net investment in the total assets of enterprises in the previous period was 5.50%. The mean value of ESG performance is 4.106, indicating that the average ESG rating of enterprises is close to B. The standard deviation is 1.130, indicating that there is a large variability among the ESG ratings of enterprises. In addition, the maximum value is 8, indicating that the highest rating of sample enterprises is AA. The standard deviation of investment opportunities is 2.547, which indicates that there is a large variability in the investment opportunities faced by enterprises, and also implies that the research on the investment level as well as investment opportunities in this paper has practical significance.

Table 1.
Description results of included variables.
4.2. Regression Results
The regression results for H1 and H2 are presented in Table 2. As can be seen from column (1), the coefficient of ESG performance is 0.003, which is significant at the 1% level, which verify that the better the ESG performance, the higher the investment level (H1). The results show that companies with a better ESG performance have a higher investment capacity, more investment opportunities, higher investment intentions, and consequently higher investment levels. From column (2), the coefficient of total marketization index×ESG performance is 0.003, which is significant at the 1% level, which verifies that the influence of ESG performance on investment level is more significant in firms located in regions with a higher level of marketization rather than firms located in regions with lower level of marketization (H2). Columns (3)–(7) show that the relationship between government and market, the development of a non-state economy, the degree of development of factor markets, the development of market intermediaries, and the legal institutional environment play a positive moderating role in the relationship between corporate ESG performance and investment level, which further verifies H2. The effect of corporate ESG performance in alleviating financing constraints by reducing information asymmetry is stronger in regions with less government intervention. In addition, the more developed the non-state economy and the more developed the factor market, the higher the degree of competition of enterprises, the stronger the demand of enterprises to enhance their competitive ability by increasing ESG investment, and the stronger the incentive to disclose ESG-related information. Meanwhile, a good legal environment will raise the cost of disclosing inaccurate ESG information, which will help the effective performance of signaling and further form the incentives for enterprises to enhance ESG performance. Therefore, the effect of ESG performance on investment level is more significant in regions with higher marketization. According to the China Market Index Database, the degree of product market development consists of three sub-indicators: (1) the degree of market-determined prices; (2) the reduction of local protection in commodity markets; and (3) fair market competition conditions. The reason for the insignificant moderating effect of the degree of product market development may be that the sub-indicator “fair market competition conditions” is only updated from 2019, and the data of previous years are empty, which makes the data less comparable before and after 2019, and also less comparable across provinces.
Table 2.
Regression analysis results.
5. Further Analyses
We conduct investment efficiency analysis, mediation tests, and heterogeneity analysis in this part (as shown in Figure 1).
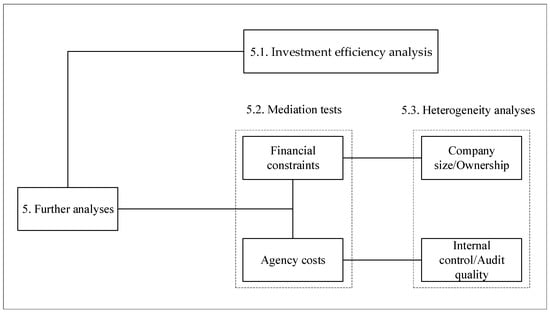
Figure 1.
Further Analyses.
5.1. Investment Efficiency
Is increased investment caused by ESG performance reasonable? We address this question by examining the relationship between the level of overinvestment in firms caused by ESG performance and investment efficiency. If this ESG performance-induced overinvestment level is irrational or excessive, it will lead to a decrease in the firm’s investment efficiency, otherwise, it will not harm the firm’s investment efficiency and will have a positive impact. Drawing on Core et al. and Hwang and Kim [50,51], we estimate the level of overinvestment brought by ESG performance and regress this with the firm’s investment efficiency, as shown in Model (3).
where i denotes listed companies and t denotes the year. INVEFFICIENCY is the explained variable, indicating investment efficiency. Based on Richardson [49], its value is the absolute value of the residuals of Model (4). The larger the value of INVEFFICIENCY, the less efficient the company’s investment. EXCESSINV1 is the explanatory variable, which indicates the level of excess investment induced by ESG performance, and is calculated by multiplying the coefficient of ESG performance in Model (1) with the ESG (α1 × ESG). Controls are control variables with the same variable definitions as Models (1) and (2). Year and Ind denote the year and industry dummy variables, respectively.
where i denotes the listed company and t denotes the year. INV1 is the explained variable and the model includes the previous period INV1, TOBINQ, LEV, SIZE, and AGE. They are defined in the same way as Models (1) and (2). CH is the ratio of money capital to total assets in the previous period. RETURN is the annual stock return. Year and Ind denote the year and industry dummy variables, respectively. We employ the entire sample for regression.
The results are presented in Table 3. Table 3 shows that the coefficient of the level of excess investment caused by ESG performance is significantly negative, indicating that the level of excess investment caused by ESG performance is a reasonable investment in line with the current situation of the company’s development and significantly enhances the efficiency of the company’s investment.
Table 3.
The impact of the level of excess investment induced by ESG performance on investment efficiency.
5.2. Mediation Tests
We conduct a formal mediation test to examine if financial constraint and agency cost are transmission channels for the impact of ESG performance on investment level. The second part of this paper shows that, compared with firms with poor ESG performance, firms with better ESG performance can reduce the degree of information asymmetry with external investors by disclosing more information. Moreover, it can reduce the financing constraint faced by firms, enhance their ability to invest, and thus influence the level of corporate investment. We will test whether financing constraints play a mediating role between corporate ESG performance and investment level. ESG considers stakeholders’ interests and takes the initiative to share the development results of the enterprise with them. As the association between stakeholders and the enterprise grows, the management of the enterprise is supervised by both shareholders and stakeholders. Therefore, the level of corporate governance is improved, management opportunistic behavior decreases, the agency cost faced by enterprises decreases, and management’s willingness to invest in the enterprise increases. We will test whether agency costs play a mediating role between corporate ESG performance and investment levels.
Referring to Kaplan and Zingales and Lei et al., we construct a KZ index to measure the degree of financing constraints [52,53]. A larger KZ index implies a higher degree of financing constraints faced by listed companies. Based on Tang, we use the corporate overhead rate (AC) to measure agency costs [54]. The greater the corporate overhead rate, the more pronounced the self-interest of management. The regression results of the mediating effect analysis are presented in Table 4. From columns (2) and (3) of Table 4, it can be seen that by increasing the content of information disclosure, ESG performance reduces the degree of information asymmetry between firms and external investors, alleviates the financing constraints, and improves the investment capacity of firms which improves the level of corporate investment. From columns (4) and (5), it can be seen that ESG performance reduces agency costs. Under performance pressure, management’s willingness to invest increases and the level of investment consequently increases.
Table 4.
Mediating effect regression results.
5.3. Heterogeneity Analyses
We set heterogeneity analysis variables based on mediation tests. We use company size and ownership for heterogeneity analysis from the perspective of alleviating financing constraints and use internal control and audit quality for heterogeneity analysis from the perspective of reducing agency costs.
5.3.1. Company Size
Larger companies are typically founded earlier, have more developed corporate governance, and possess greater risk-resistance. They may have established a more intricate social network, have more funding channels, and be more profitable. Large firms face fewer financing constraints than small and medium-sized enterprises (SMEs), and the effect of ESG performance in reducing financing constraints to increase investment levels is not significant in large firms [55]. In this paper, we introduce the size dummy variable (SIZE_Big), which takes the value 1 if the firm’s size is greater than or equal to the industry median for the same year, and 0 otherwise. The results of the regression are displayed in column (1) and (2) of Table 5. As can be seen, the estimated coefficient of ESG is bigger when SIZE_Big = 0 (empirical p-value = 0.060), confirming that the effect of ESG performance on investment level enhancement is more pronounced in smaller firms.
Table 5.
Heterogeneity analyses.
5.3.2. Ownership
Compared with non-SOEs, SOEs have stronger political attributes and bear the responsibility of maintaining social stability, thus the government may continuously import funds to SOEs through banks without considering their performance [40]. Therefore, compared with private firms, SOEs face fewer financing constraints [18,55], and the effect of ESG performance in reducing financing constraints to enhance investment levels in state-owned enterprises is not significant. The regression results are shown in column (3) and (4) of Table 5. The result shows that the estimated coefficient of ESG is bigger when SOE = 0 (empirical p-value = 0.020), verifying that the investment level enhancement effect of ESG performance is more significant in non-SOEs.
5.3.3. Internal Control
A well-designed and effectively implemented internal control system can promote effective communication of information, improve the transparency of accounting information and the quality of financial statements, reduce opportunistic management behavior, reduce agency problems, and thereby enhance corporate performance [56]. Therefore, the effect of ESG performance on reducing agency costs to increase investment levels is not significant for firms with better internal control and higher corporate governance. In this paper, we introduce a dummy variable for internal control level (IC_High) that takes the value 1 if the firm’s internal control index score is greater than or equal to the industry median for the same year, and 0 otherwise. Shenzhen Dibo Risk Management Technology Co., Ltd. provides us the “DIB Internal Control Index of China-Listed Companies”. The results of the regression are displayed in column (5) and (6) of Table 5. It is demonstrated that the estimated coefficient of ESG is bigger when IC_High = 0 (empirical p-value = 0.060), confirming that the effect of ESG performance on investment levels is more pronounced in firms with lower internal control levels.
5.3.4. Audit Quality
Compared with companies audited by non-big4 accounting firms, companies audited by big4 accounting firms have better accounting information quality, a greater likelihood of exposure due to management opportunistic activities, and thus fewer agency issues. Consequently, compared with companies audited by non-big4 accounting firms, the effect of ESG performance on reducing agency costs to increase investment levels is not statistically significant for companies audited by big4 accounting firms. This paper introduces a dummy variable for audit quality (Big4) with the value 1 if the company is audited by a big4 accounting firm and 0 otherwise. The regression results are presented in columns (7) and (8) of Table 5. The result demonstrates that the estimated coefficient of ESG is bigger when Big4 = 0 (empirical p-value = 0.040), confirming that the effect of ESG performance on investment level is more pronounced in firms audited by non-big4 accounting firms.
6. Robustness Checks
6.1. Replacing the Explanatory and Explained Variables
In the robustness test, based on Lu et al. and Xu and Chen [57,58], we replace the firm investment level variable (INV1) with the natural logarithm of firm net investment (INV2). We also consider the possible effects of the different methods of defining the explanatory variables on the results: (1) defining the explanatory variables as dummy variables A (inclusive) and above as 1, otherwise as 0; (2) assigning the explanatory variables to be averaged quarterly. The results are presented, respectively, in columns (1)–(3) of Table 6. It can be seen that the results of this paper are robust.
Table 6.
Robustness test: replacing explanatory and explained variables.
6.2. Quantile Regression
To investigate whether the relationship between ESG performance and corporate investment level is affected by the level of investment, we conduct quantile regression at the 50th percentile of investment level. The results are shown in Table 7. The coefficient of ESG performance is significantly positive in the quantile regression, which indicates that ESG performance is conducive to promoting investment level for both higher and lower investment level companies.
Table 7.
Robustness test: quantile regression.
6.3. Instrumental Variables
To overcome the endogeneity caused by omitted variables, we use the instrumental variables approach for a robustness test. Enlightened by Xie and Lyu, we use the number of “Pan-ESG” funds investing in a particular company (FQ) as an instrumental variable for corporate ESG performance [46]. Public funds are important institutional investors that can influence corporate ESG-related policies through active communication with the management of listed companies, “voting with their feet”, and shareholder proposals, which has a positive relationship with corporate ESG performance. At the same time, since the establishment and size of a “Pan-ESG” fund are determined by the fund company, and the portfolio of holdings and changes are determined by the fund manager, being held by a “Pan-ESG” fund does not have a direct impact on the level of corporate investment. The number of “Pan-ESG” funds investing in a particular company (FQ) satisfies the hypothesis of correlation and exogeneity, so this can be considered an effective instrumental variable for explanatory variable in this paper. Considering that the impact of public funds has a certain lag, the number of funds is taken as a one-period lag in the regression process. The regression results of the instrumental variables are presented in Table 8. Columns (1) and (2) show the results of the first stage and second stage regressions of the instrumental variables method, respectively. Column (1) shows that the coefficient estimates of the instrumental variable lagged one-period FQ are significantly positive at the 1% level, indicating that the instrumental variable is significantly positively related to the endogenous variable ESG performance. Column (2) shows that the coefficient estimates of ESG performance are significantly positive at the 10% level, indicating that there is a positive relationship between ESG performance and investment level, further verifying H1 of this paper. Meanwhile, the Cragg–Donald Wald F statistic and Kleibergen–Paap rk Wald F statistic have large values, indicating that there is no weak instrumental variable. Thus, the regression results are more reliable.
Table 8.
Robustness test: instrumental variables.
6.4. One-Period Lag and Fixed Effects
To further control for unobservable firm characteristics factors, we use a fixed effects model for the regressions (column (1) in Table 9). In this paper, the explained variables are lagged by one period to reduce the two-way causality problem, and the results are reported in column (2) of Table 9. Both fixed effects regression results and the lagged one-period investment level show that the coefficient of ESG performance is significantly positive at the 1% level, thus indicating the robustness of the results in this paper.
Table 9.
Robustness test: one-period lags and fixed effects.
7. Conclusions
We investigate the relationship between corporate ESG performance and investment level in light of the rapid growth of ESG. By disclosing more information, companies with better ESG performance can reduce information asymmetry with external investors, alleviate financing constraints, and improve investment capability. They can increase investment opportunities by establishing stronger relationships of trust and networking with stakeholders. In addition, they may increase management’s willingness to invest by reducing risks and agency cost. When companies are located in regions with a higher degree of marketization, the investment enhancement effect of ESG performance is more significant. Further analysis reveals that the level of investment caused by ESG performance is consistent with the company’s current development, resulting in an increase in investment efficiency. The mediation test demonstrates that ESG performance increases the level of corporate investment by easing financing constraints and decreasing agency costs. An analysis of heterogeneity reveals that ESG performance is more likely to alleviate financing constraints, reduce agency costs, and ultimately increase investment levels in firms that are a smaller size, are not state-owned, have lower internal control standards, and are audited by non-big4 accounting firms. After a series of robustness tests, the conclusions of this paper are still reliable.
Firms should enhance their ESG strategies and processes. As high ESG performance could relax financing constraints and reduce agency costs, thereby improving investment expenditure and investment efficiency, firms should integrate ESG deeply into all operation processes, improve ESG to build a differentiated competitive advantage, and ultimately achieve long-term sustainable growth and shared value creation. In addition, under the circumstances of less government intervention, greater competitive pressure, and better legal environments, ESG may play a better role in mitigating financing constraints and improving investment efficiency, and firms are more willing to use ESG performance as a competitive tool; therefore the government should reduce intervention in the enterprise, let the market play the role of resource allocation, improve the legal system, strengthen ESG information disclosure, such as making the requirement that companies should disclose ESG reports on time in the Securities Law or Measures for the Administration of Information Disclosure by Listed Companies, and gradually promote the implementation of ESG relevant policies.
Our study is limited because we use listed companies from China as a sample, and it is not clear whether the results are applicable to firms from other countries. Further research may extend our analysis by using a sample of firms from countries that have different characteristics compared with China. In addition, further research may also include the use of continuous ESG proxy variables for analysis.
Author Contributions
Conceptualization, N.K.; Software, Y.B.; Investigation, Y.B. and Y.S.; Data curation, Y.S.; Writing—original draft, Y.B. and Y.S.; Writing—review & editing, N.K. and Y.W. All authors have read and agreed to the published version of the manuscript.
Funding
This research was funded by Liberal Arts and Social Sciences Foundation of Ministry of Education in China (no. 17YJA630039), co-funded by National Natural Science Foundation of China (no. 71802047).
Institutional Review Board Statement
Not applicable.
Informed Consent Statement
Not applicable.
Data Availability Statement
The study will not report the data.
Acknowledgments
We are grateful to the editors and the anonymous reviewers for valuable comments and suggestions.
Conflicts of Interest
The authors declare no conflict of interest.
Appendix A
Table A1.
Definition and measurement of study variables.
Table A1.
Definition and measurement of study variables.
| Variable | Observations |
|---|---|
| INV1 | The ratio of a firm’s net investment to its total assets at the beginning of the period, where net investment is the cash spent on the acquisition of fixed assets, intangible assets, and other long-term assets in year t of company i minus the net cash recovered from the disposal of fixed assets, intangible assets, and other long-term assets. |
| ESG | ESG rating from low to high is denoted from 1 to 9 |
| MKI | Total marketization index greater than or equal to the median of the same industry in the same year takes the value of 1, otherwise, it is 0 |
| GI/NSI/PI/FI/LI | The definitions of the sub-indexes are similar to the total marketization index |
| SIZE | |
| LEV | Gearing ratio |
| OCF | Net cash flow from operating activities divided by total assets |
| CASH | Total monetary funds divided by total assets |
| TOBINQ | Tobin’s Q is equal to the market value divided by the book value of total assets |
| GROWTH | Increase rate of main business revenue |
| AGE | |
| SOE | State-owned enterprises take the value of 1, otherwise 0 |
| ROE | Return on Net Assets |
| DUALITY | If a person is both the general manager and the chairman of the board, we take the value of 1, otherwise it is 0 |
| MH | Number of shares held by management divided by the total number of shares |
| Year | Dummy variable of year |
| Ind | Dummy variable of industry |
References
- Friede, G.; Busch, T.; Bassen, A. ESG and financial performance: Aggregated evidence from more than 2000 empirical studies. J. Sustain. Financ. Invest. 2015, 5, 210–233. [Google Scholar] [CrossRef]
- EL Ghoul, S.; Guedhami, O.; Kwok, C.C.; Mishra, D.R. Does corporate social responsibility affect the cost of capital? J. Bank. Financ. 2011, 35, 2388–2406. [Google Scholar] [CrossRef]
- Sassen, R.; Hinze, A.K.; Hardeck, I. Impact of ESG factors on firm risk in Europe. J. Bus. Econ. 2016, 86, 867–904. [Google Scholar] [CrossRef]
- Ng, A.C.; Rezaee, Z. Business sustainability performance and cost of equity capital. J. Corp. Financ. 2015, 34, 128–149. [Google Scholar] [CrossRef]
- Breuer, W.; Müller, T.; Rosenbach, D.; Salzmann, A. Corporate social responsibility, investor protection, and cost of equity: A cross-country comparison. J. Bank. Financ. 2018, 96, 34–55. [Google Scholar] [CrossRef]
- Tarmuji, I.; Maelah, R.; Tarmuji, N.H. The Impact of Environmental, Social and Governance Practices (ESG) on Economic Performance: Evidence from ESG Score. Int. J. Trade Econ. Financ. 2016, 7, 67–74. [Google Scholar] [CrossRef]
- Zhao, C.; Guo, Y.; Yuan, J.; Wu, M.; Li, D.; Zhou, Y.; Kang, J. ESG and corporate financial performance: Empirical evidence from China’s listed power generation companies. Sustainability 2018, 10, 2607. [Google Scholar] [CrossRef]
- Sen, S.; Bhattacharya, C. Does doing good always lead to doing better? Consumer reactions to CSR. J. Mark. Res. 2001, 38, 225–243. [Google Scholar] [CrossRef]
- Hsu, K.T. The Advertising Effects of Corporate Social Responsibility on Corporate Reputation and Brand Equity: Evidence from the Life Insurance Industry in Taiwan. J. Bus. Ethics 2012, 109, 189–201. [Google Scholar] [CrossRef]
- Flammer, C. Does corporate social responsibility lead to superior financial performance? A regression discontinuity approach. Manag. Sci. 2015, 61, 2549–2568. [Google Scholar] [CrossRef]
- Fatemi, A.; Fooladi, I.; Tehranian, H. Valuation effects of corporate social responsibility. J. Bank. Financ. 2015, 59, 182–192. [Google Scholar] [CrossRef]
- Li, Y.; Gong, M.; Zhang, X.Y.; Koh, L. The impact of environmental, social, and governance disclosure on firm value: The role of CEO power. Brit. Account. Rev. 2018, 50, 60–75. [Google Scholar] [CrossRef]
- Shehzad, W. Outlining purposes, stating the nature of the present research, and listing research questions or hypotheses in academic papers. J. Tech. Writ. Commun. 2011, 41, 139–160. [Google Scholar] [CrossRef]
- Hristov, I.; Appolloni, A.; Cheng, W.; Venditti, M. Enhancing the strategic alignment between environmental drivers of sustainability and the performance management system in Italian manufacturing firms. Int. J. Product. Perfor. 2022. ahead-of-print. [Google Scholar] [CrossRef]
- Modigliani, F.; Miller, M.H. The cost of capital, corporation finance, and the theory of investment. Am. Econ. Rev. 1958, 48, 261–297. [Google Scholar]
- Greenwald, B.; Stiglitz, J.E.; Weiss, A. Informational imperfections in the capital market and macroeconomic fluctuations. Am. Econ. Rev. 1984, 74, 194–199. [Google Scholar]
- Myers, S.C.; Majluf, N.S. Corporate financing and investment decisions when firms have information that investors do not have. J. Financ. Econ. 1984, 13, 187–221. [Google Scholar] [CrossRef]
- Fee, C.E.; Hadlock, C.J.; Pierce, J.R. Investment, Financing Constraints, and Internal Capital Markets: Evidence from the Advertising Expenditures of Multinational Firms. Rev. Financ. Stud. 2009, 22, 2361–2392. [Google Scholar] [CrossRef]
- Hammami, A.; Zadeh, M.H. Audit quality, media coverage, environmental, social, and governance disclosure and firm investment efficiency: Evidence from Canada. Int. J. Account. Inf. Ma. 2020, 28, 45–72. [Google Scholar] [CrossRef]
- Cheng, B.; Ioannou, I.; Serafeim, G. Corporate social responsibility and access to finance. Strategic. Manag. J. 2014, 35, 1–23. [Google Scholar] [CrossRef]
- Reber, B.; Gold, A.; Gold, S. ESG disclosure and idiosyncratic risk in initial public offerings. J. Bus. Ethics 2022, 179, 867–886. [Google Scholar] [CrossRef]
- Hong, H.; Kacperczyk, M. The price of sin: The effects of social norms on markets. J. Financ. Econ. 2009, 93, 15–36. [Google Scholar] [CrossRef]
- Qiu, M.; Yin, H. ESG performance and financing cost of enterprises under the background of ecological civilization construction. Quant. Tech. Econ. Res. 2019, 36, 108–123. [Google Scholar]
- Attig, N.; El Ghoul, S.; Guedhami, O.; Suh, J. Corporate social responsibility and credit ratings. J. Bus. Ethics 2013, 117, 679–694. [Google Scholar] [CrossRef]
- Deng, X.; Kang, J.; Low, B.S. Corporate social responsibility and stakeholder value maximization: Evidence from mergers. J. Financ. Econ. 2013, 110, 87–109. [Google Scholar] [CrossRef]
- Lins, K.V.; Servaes, H.; Tamayo, A. Social Capital, Trust, and Firm Performance: The Value of Corporate Social Responsibility during the Financial Crisis. J. Financ. 2017, 72, 1785–1824. [Google Scholar] [CrossRef]
- Godfrey, P.C. The relationship between corporate philanthropy and shareholder wealth: A risk management perspective. Acad. Manag. Rev. 2005, 30, 777–798. [Google Scholar] [CrossRef]
- Zhao, T. Board network, investment efficiency, and the mediating role of CSR: Evidence from China. Int. Rev. Econ. Financ. 2021, 76, 897–919. [Google Scholar] [CrossRef]
- Bernanke, B.S. Irreversibility, uncertainty, and cyclical investment. Q. J. Econ. 1983, 98, 85–106. [Google Scholar] [CrossRef]
- Bloom, N.; Bond, S.; Reenen, V.J. Uncertainty and Investment Dynamics. Rev. Econ. Stud. 2007, 74, 391–415. [Google Scholar] [CrossRef]
- Pàstor, L.; Veronesi, P. Uncertainty about Government Policy and Stock Prices. J. Financ. 2012, 67, 1219–1264. [Google Scholar] [CrossRef]
- Wang, Y.; Chen, C.R.; Huang, Y.S. Economic policy uncertainty and corporate investment: Evidence from China. Pac-Basin Financ. J. 2014, 26, 227–243. [Google Scholar] [CrossRef]
- Czarnitzki, D.; Toole, A.A. The R&D Investment–Uncertainty Relationship: Do Strategic Rivalry and Firm Size Matter? Manag. Decis. Econ. 2013, 34, 15–28. [Google Scholar]
- Goss, A.; Roberts, G.S. The impact of corporate social responsibility on the cost of bank loans. J. Bank. Financ. 2011, 35, 1794–1810. [Google Scholar] [CrossRef]
- Oikonomou, I.; Brooks, C.; Pavelin, S. The impact of corporate social performance on financial risk and utility: A longitudinal analysis. Financ. Manag. 2012, 41, 483–515. [Google Scholar] [CrossRef]
- Jagannathan, R.; Ravikumar, A.; Sammon, M. Environmental, Social, and Governance Criteria: Why Investors Should Care. J. Investig. Manag. 2018, 16, 18–31. [Google Scholar]
- Huang, S. Three changes in value creation from the perspective of ESG. Financ. Res. 2021, 3–14. [Google Scholar] [CrossRef]
- Peterson, R.A.; Jeong, J. Exploring the impact of advertising and R&D expenditures on corporate brand value and firm-level financial performance. J. Acad. Market. Sci. 2010, 38, 677–690. [Google Scholar]
- Wang, X.; Hu, L.; Fan, G. Marketization Index of China’s Provinces: NERI REPORT 2021; Social Sciences Academic Press: Beijing, China, 2021. [Google Scholar]
- Yan, S.; Xin, X.; Teng, F. Banking Crisis and Government Intervention: A Study of Chinese Financial History. J. Financ. Res. 2020, 484, 113–130. [Google Scholar]
- Baron, D.P.; Harjoto, M.A.; Jo, H. The economics and politics of corporate social performance. Bus. Polit. 2011, 13, 1–46. [Google Scholar] [CrossRef]
- Harjoto, M.; Laksmana, I.; Lee, R. Board diversity and corporate social responsibility. J. Bus. Ethics 2015, 132, 641–660. [Google Scholar] [CrossRef]
- Flammer, C. Does product market competition foster corporate social responsibility? Evidence from trade liberalization. Strategic Manag. J. 2015, 36, 1469–1485. [Google Scholar] [CrossRef]
- Spence, M. Job Market Signaling. Q. J. Econ. 1973, 87, 355–374. [Google Scholar] [CrossRef]
- Kandilov, I.T.; Leblebicioglu, A. Trade Liberalization and Investment: Firm-level Evidence from Mexico. World Bank Econ. Rev. 2012, 26, 320–349. [Google Scholar] [CrossRef]
- Xie, H.; Lyu, X. Responsible multinational Investment: ESG and Chinese OFDI. J. Econ. Res. 2022, 57, 83–99. [Google Scholar]
- Song, K.; Xu, L.; Li, Z.; Wang, F. Can ESG investments encourage banks to create liquidity? Also on the moderating effect of economic policy uncertainty. Financ. Res. 2022, 2, 61–79. [Google Scholar]
- Lin, Y.; Fu, X.; Fu, X. Varieties in state capitalism and corporate innovation: Evidence from an emerging economy. J. Corp. Financ. 2021, 67, 101919. [Google Scholar] [CrossRef]
- Richardson, S. Over-investment of free cash flow. Rev. Account. Stud. 2006, 11, 159–189. [Google Scholar] [CrossRef]
- Core, J.E.; Holthausen, R.W.; Larcker, D.F. Corporate governance, chief executive officer compensation, and firm performance. J. Financ. Econ. 1999, 51, 371–406. [Google Scholar] [CrossRef]
- Hwang, B.H.; Kim, S. It pays to have friends. J. Financ. Econ. 2009, 93, 138–158. [Google Scholar] [CrossRef]
- Kaplan, S.N.; Zingales, L. Do investment-cash flow sensitivities provide useful measures of financing constraints? Q. J. Econ. 1997, 112, 169–215. [Google Scholar] [CrossRef]
- Lei, G.; Wang, W.; Yu, J.; Chan, K.C. Cultural Diversity and Corporate Tax Avoidance: Evidence from Chinese Private Enterprises. J. Bus. Ethics 2021, 176, 357–379. [Google Scholar] [CrossRef]
- Tang, H. The Effect of ESG Performance on Corporate Innovation in China: The Mediating Role of Financial Constraints and Agency Cost. Sustainability 2022, 14, 3769. [Google Scholar] [CrossRef]
- Scellato, G. Patents, firm size and financial constraints: An empirical analysis for a panel of Italian manufacturing firms. Camb. J. Econ. 2006, 31, 55–76. [Google Scholar] [CrossRef]
- Li, X. The Mediating Effect of Internal Control for the Impact of Institutional Shareholding on Corporate Financial Performance. Asia Pac. J. Financ. Stud. 2022, 51, 194–222. [Google Scholar] [CrossRef]
- Lu, C.; Sun, J.; Zhang, X.; Xiang, J. Equity Incentives and Investment Behavior of Listed Companies: An Analysis Based on Propensity Score Matching. China Soft Sci. 2015, 5, 110–118. [Google Scholar]
- Xu, W.; Chen, B. Tax Incentives and corporate Investment: A natural experiment based on the VAT transition from 2004 to 2009. J. Manag. World 2016, 5, 9–17. [Google Scholar]
Disclaimer/Publisher’s Note: The statements, opinions and data contained in all publications are solely those of the individual author(s) and contributor(s) and not of MDPI and/or the editor(s). MDPI and/or the editor(s) disclaim responsibility for any injury to people or property resulting from any ideas, methods, instructions or products referred to in the content. |
© 2023 by the authors. Licensee MDPI, Basel, Switzerland. This article is an open access article distributed under the terms and conditions of the Creative Commons Attribution (CC BY) license (https://creativecommons.org/licenses/by/4.0/).