
Sustainable Coupling Coordination and Influencing Factors of Sports Facilities Construction and Social Economy Development in China
 ,
,
Abstract
1. Introduction
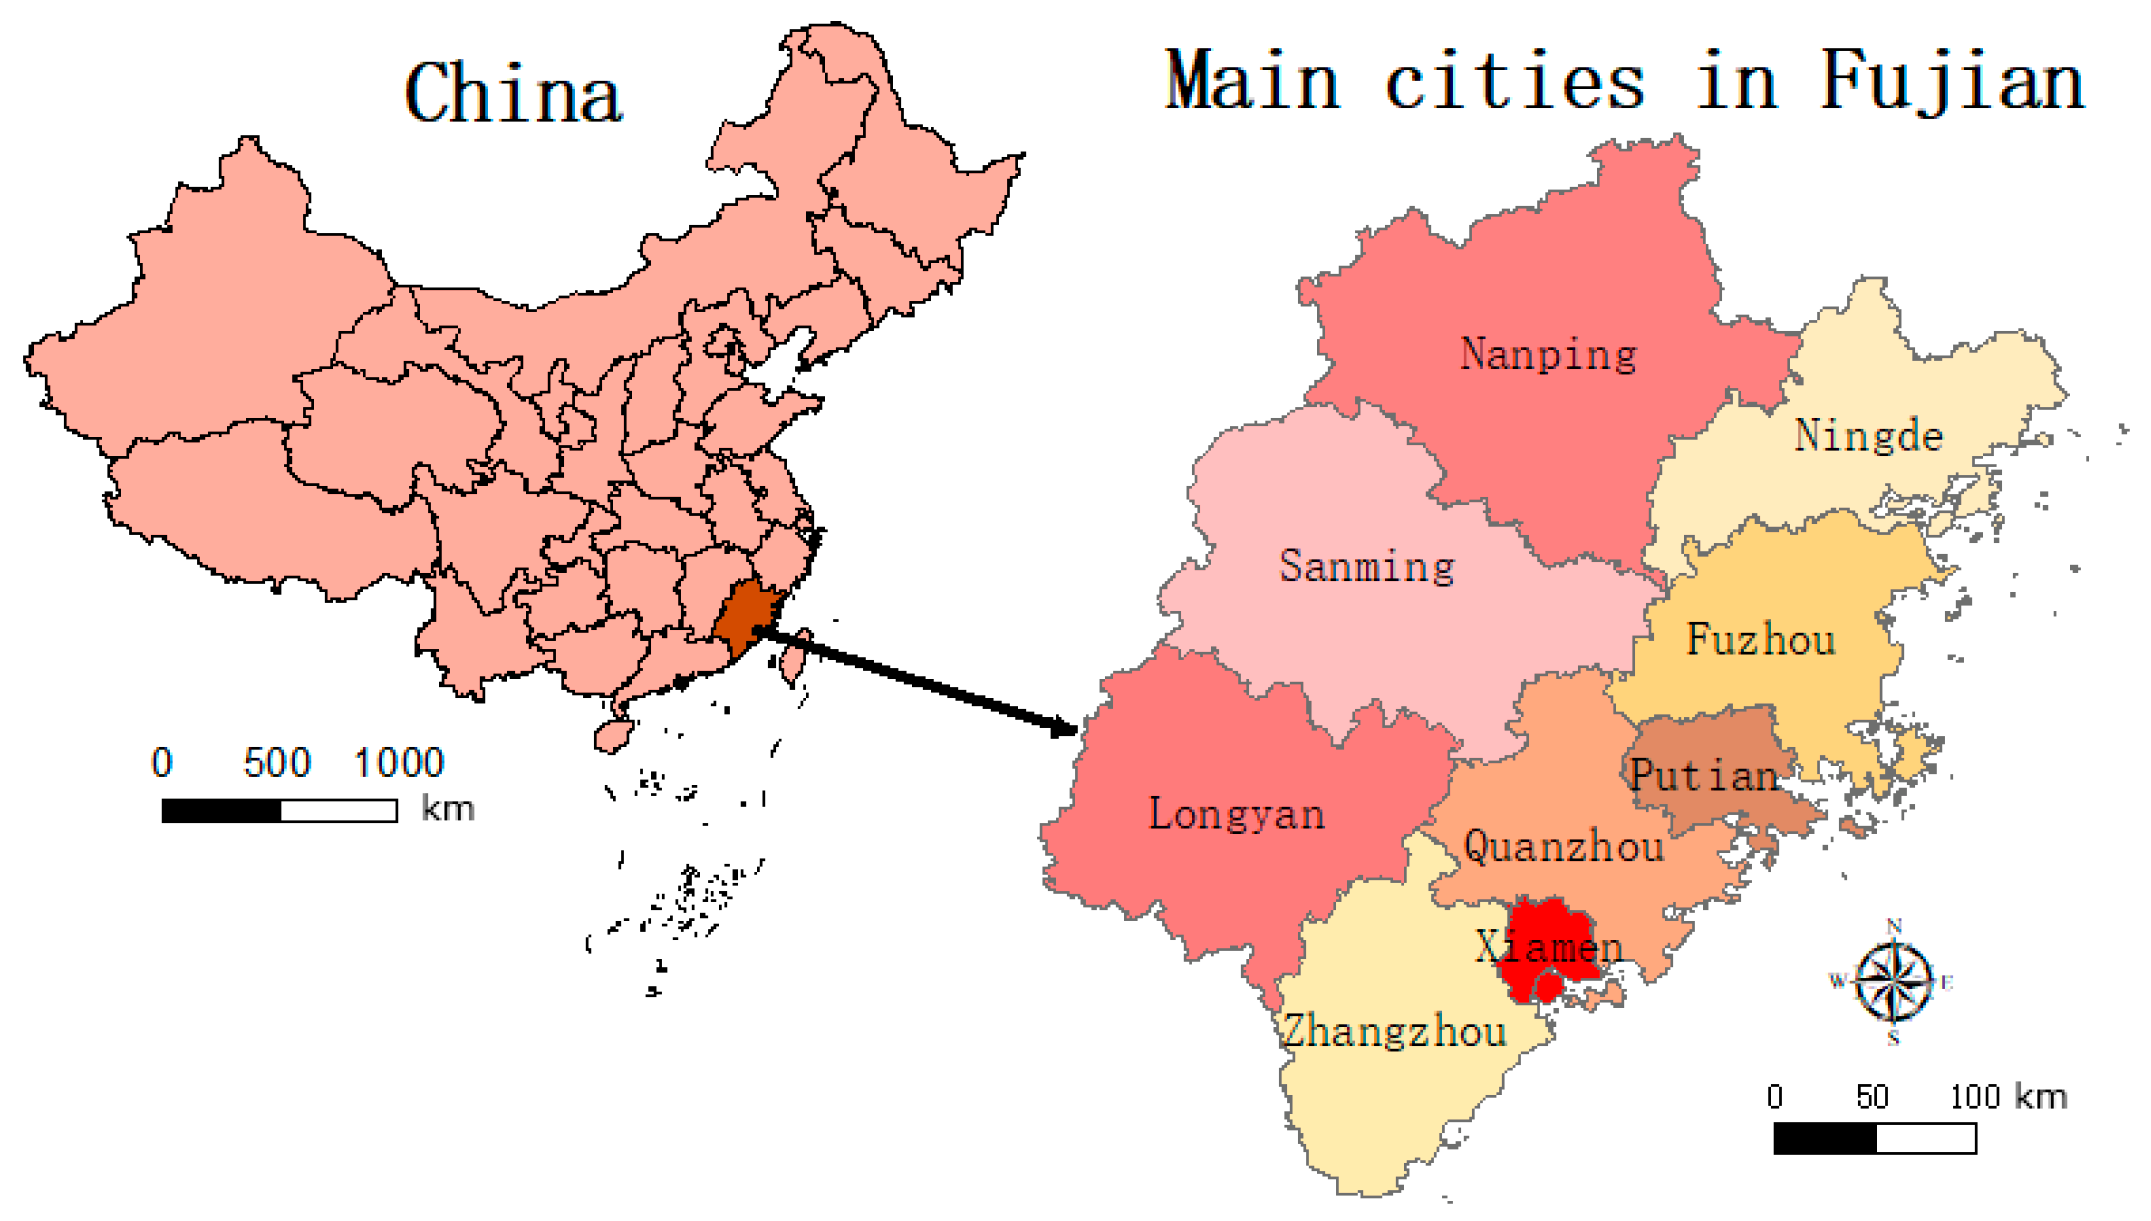
2. Study Region
3. Research Methods
3.1. Entropy Method
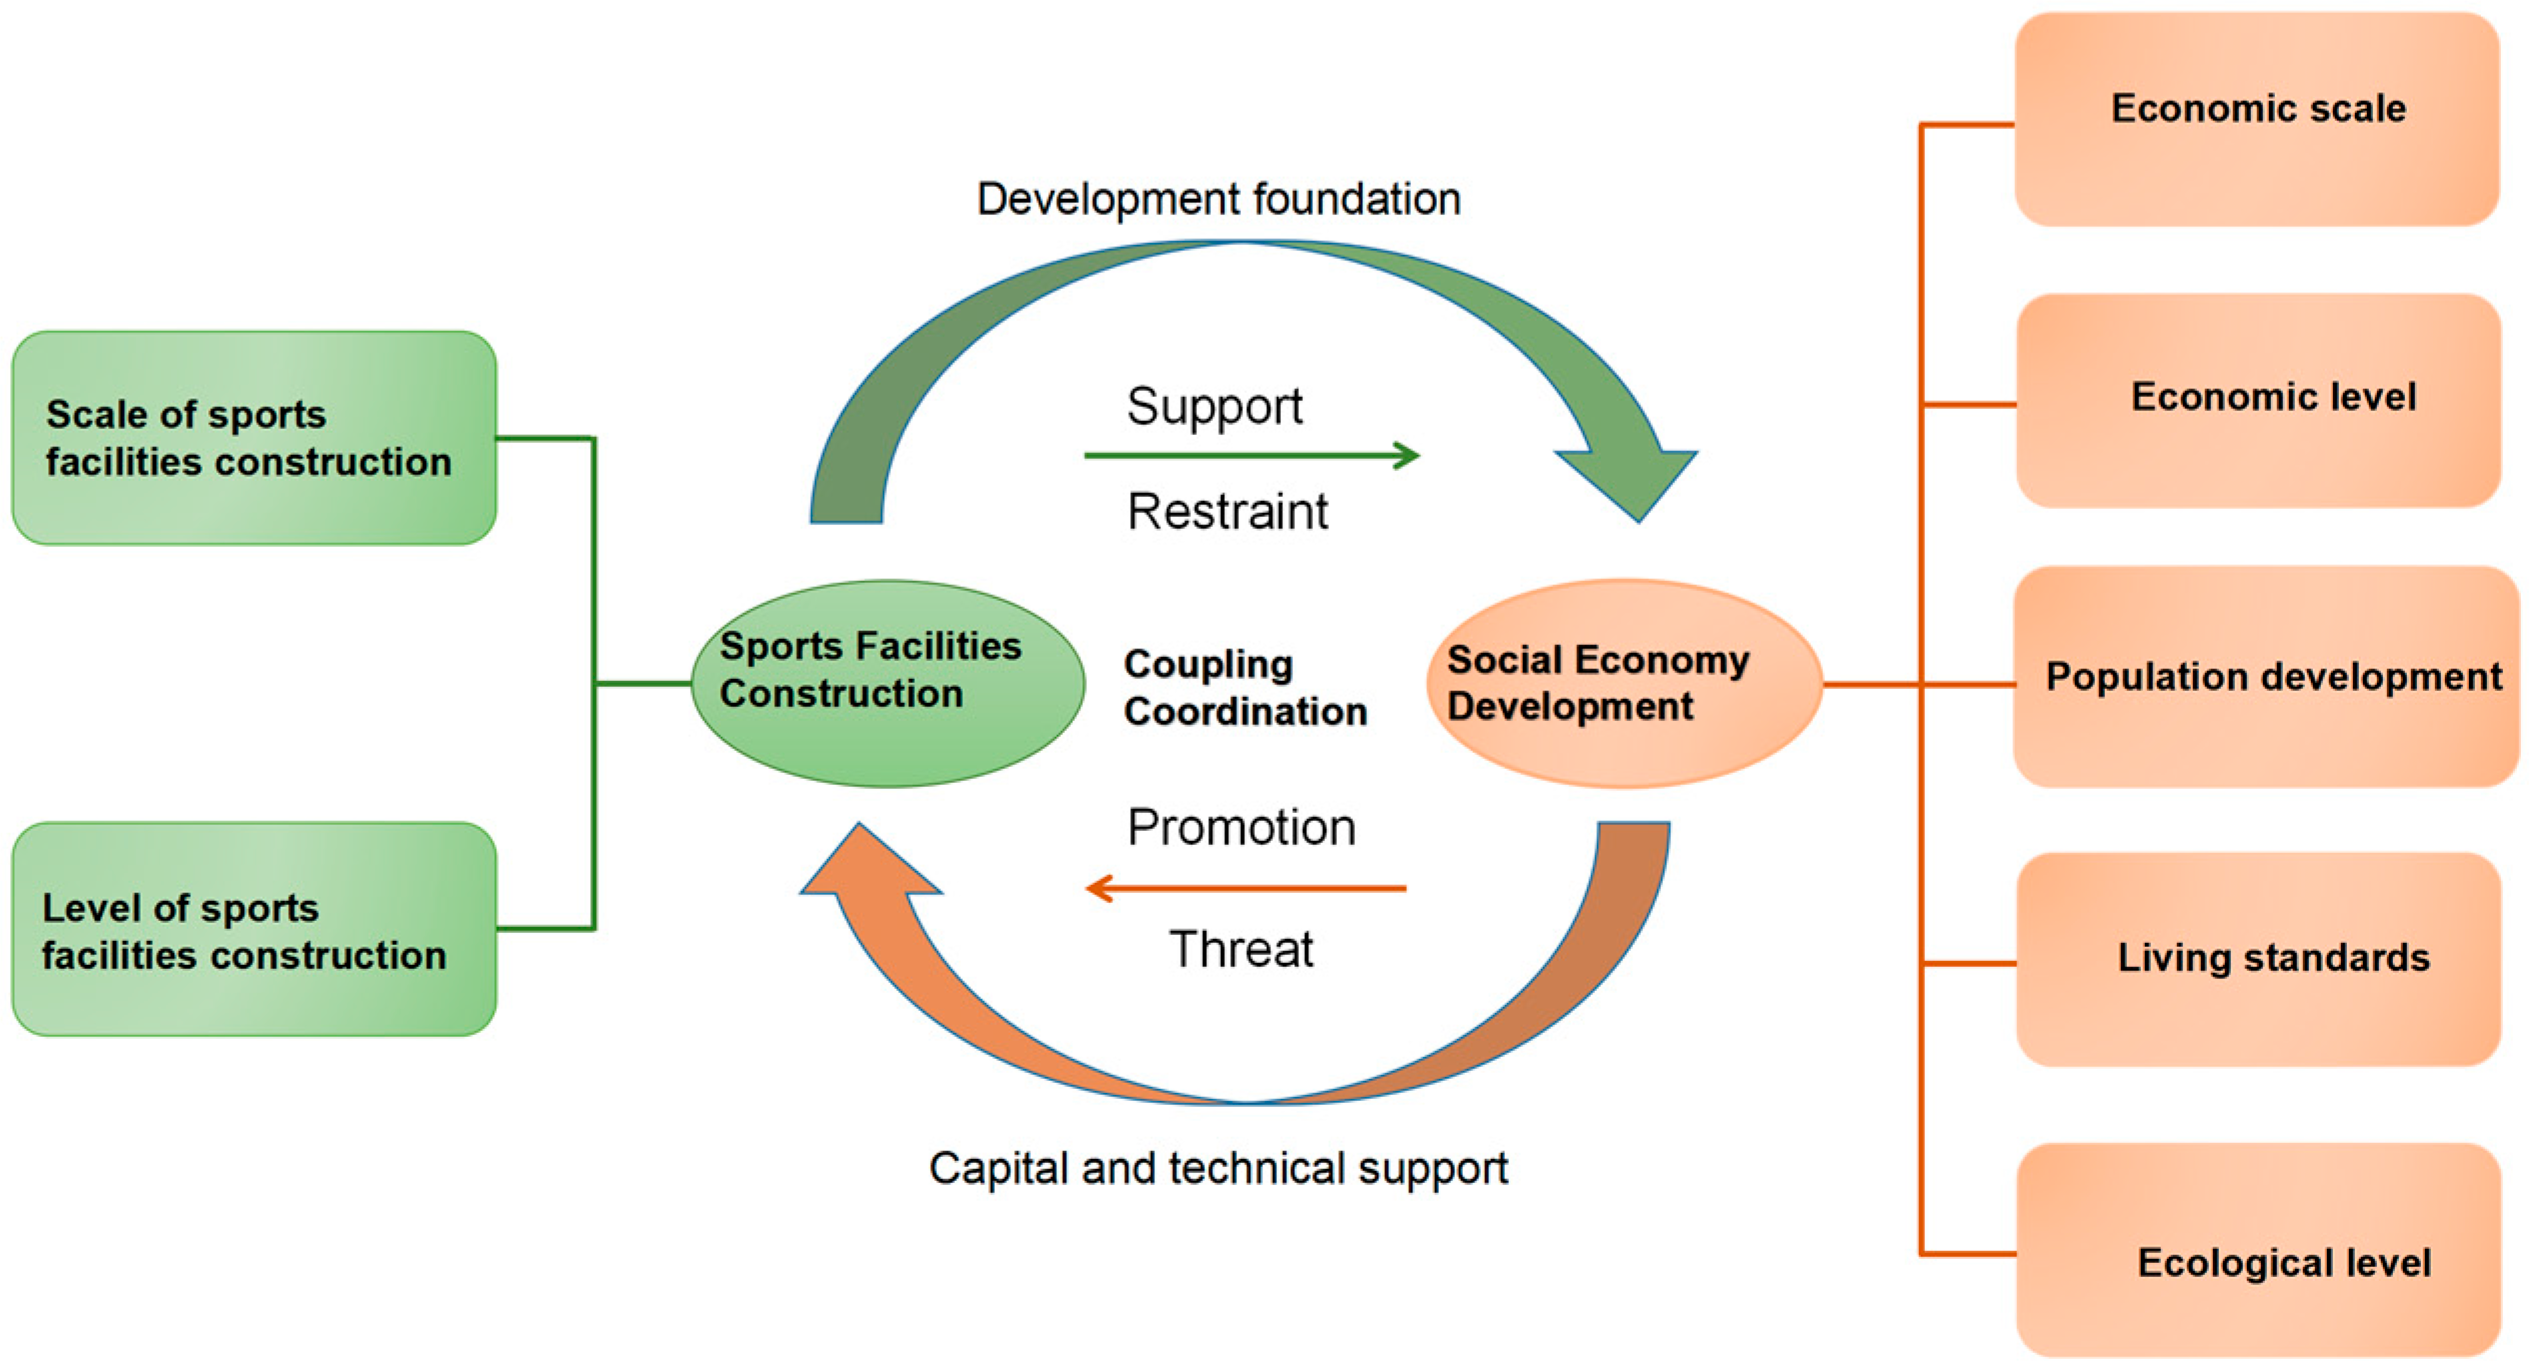
3.2. Coupling Coordination Model
4. Index System Construction
5. Empirical Analysis of the Coupling Coordination of Sports Facilities Construction and Social Economy Development in Fujian Province
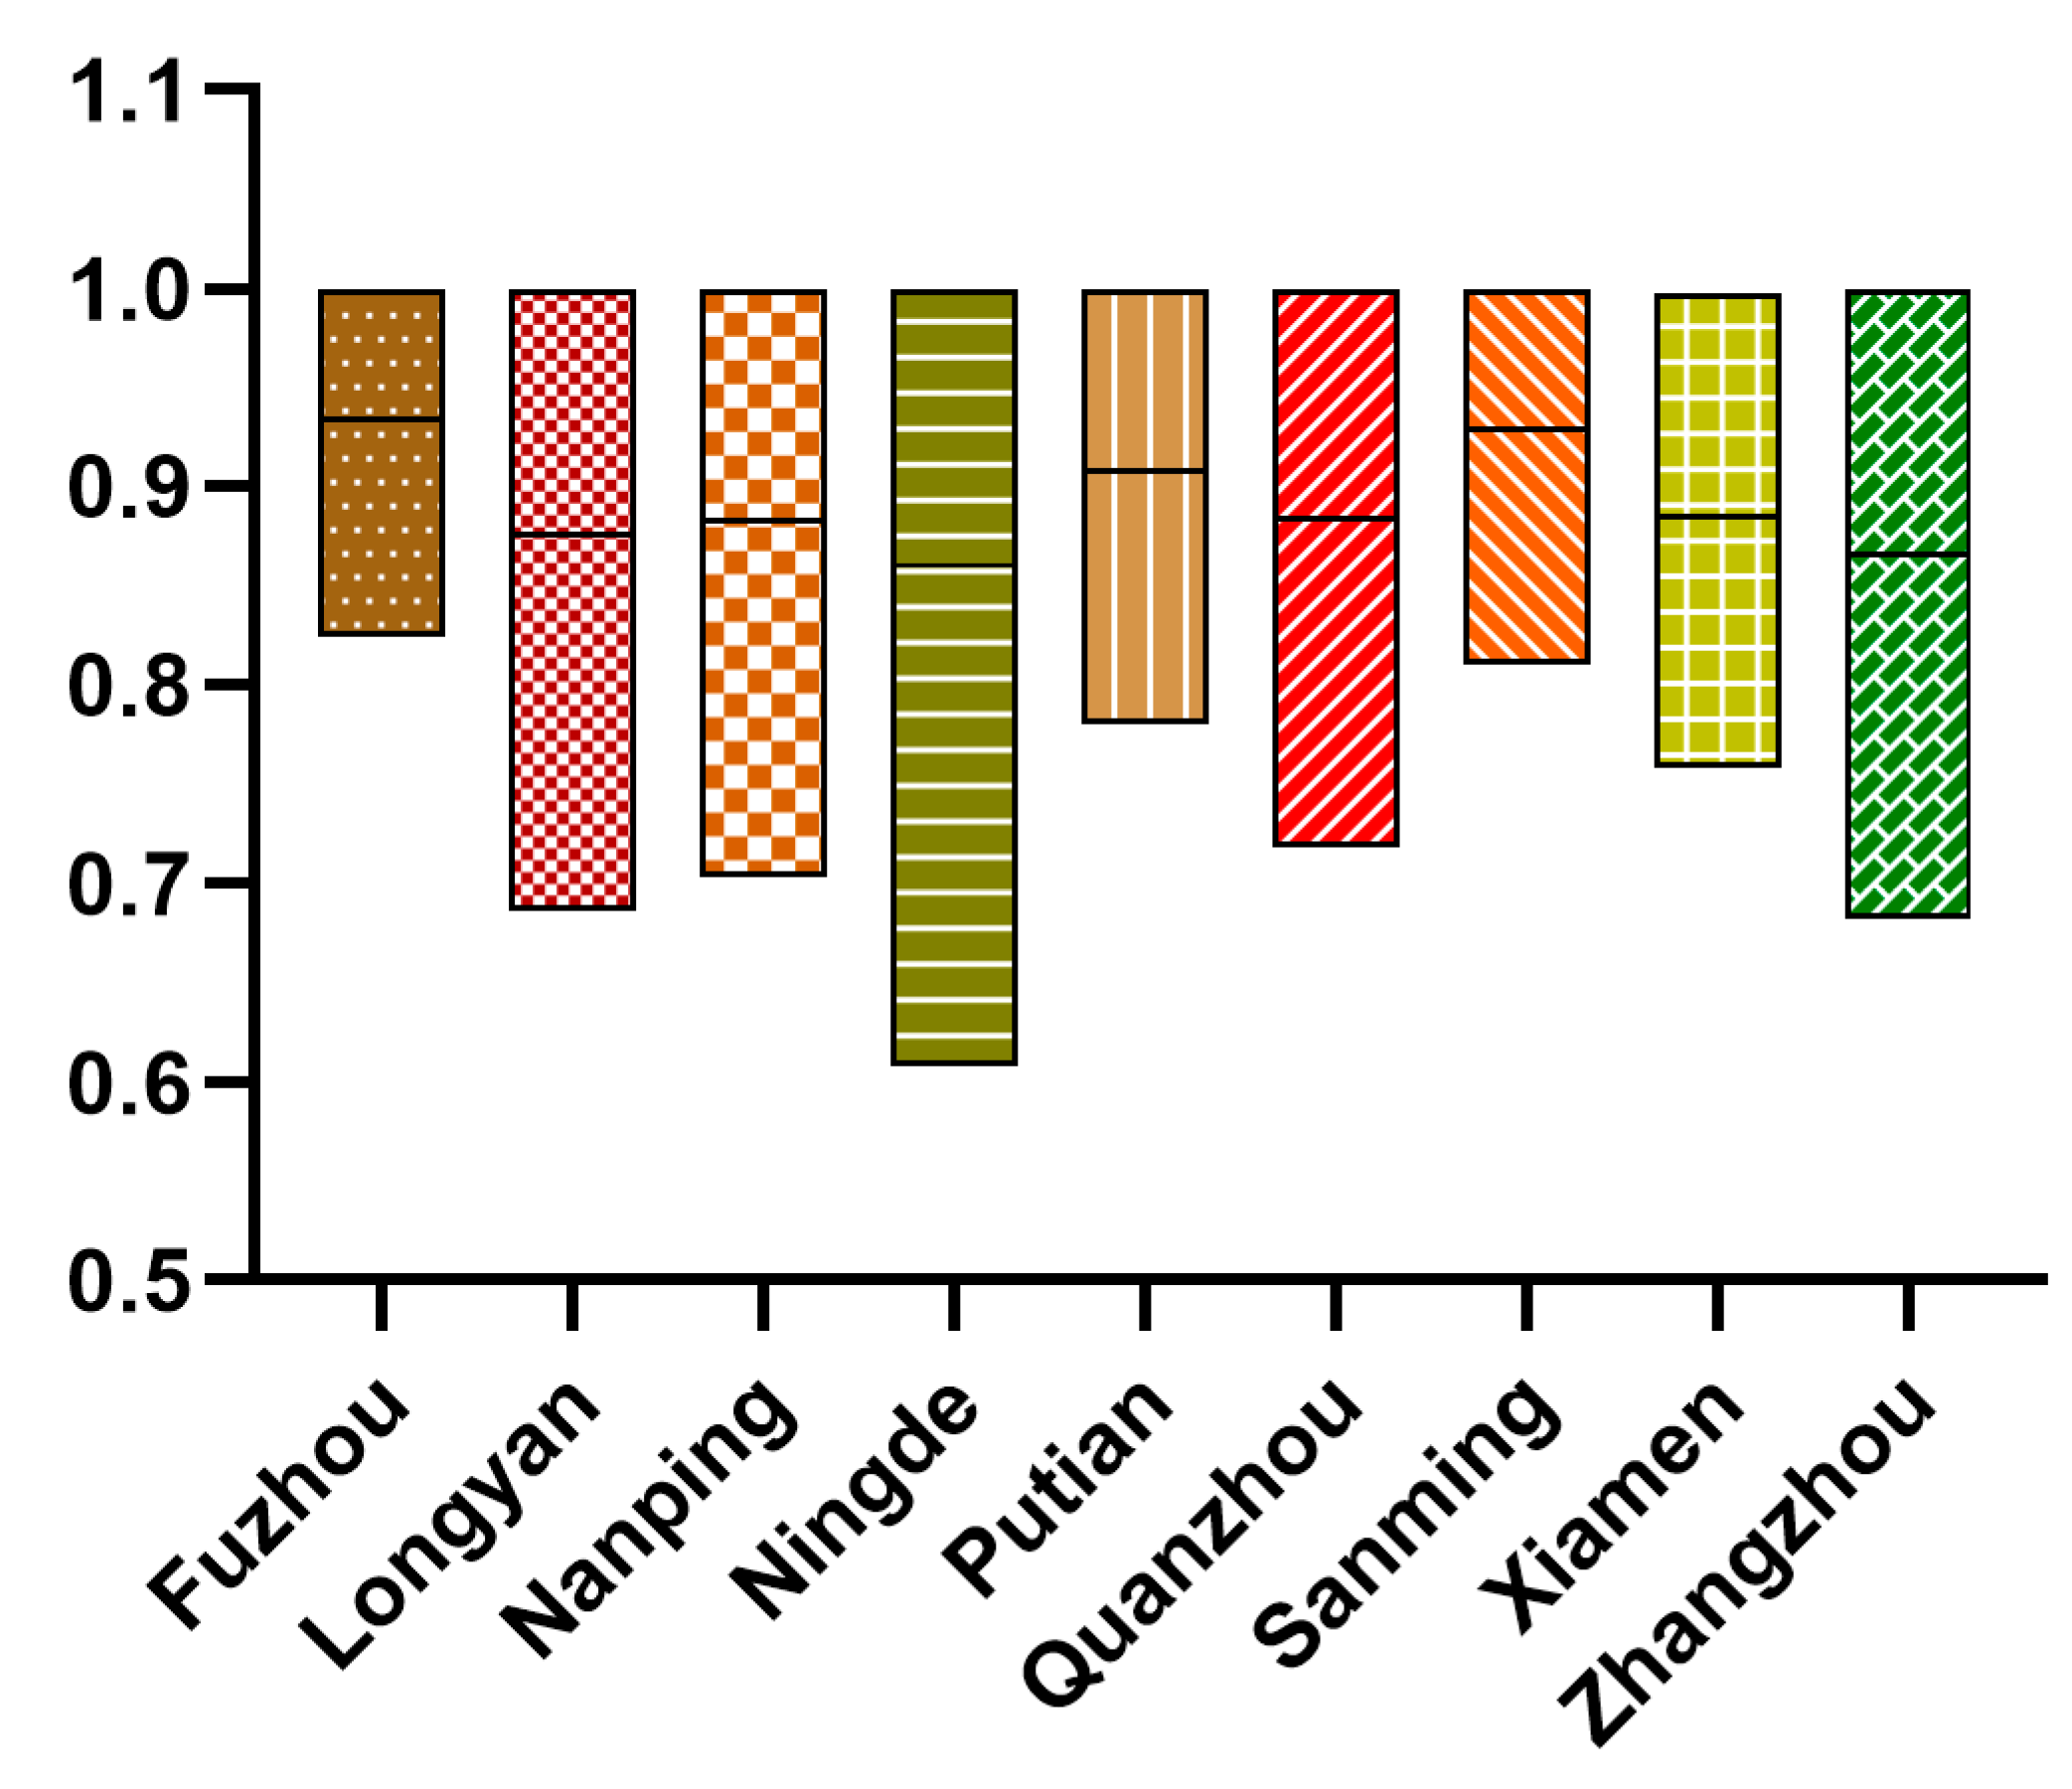
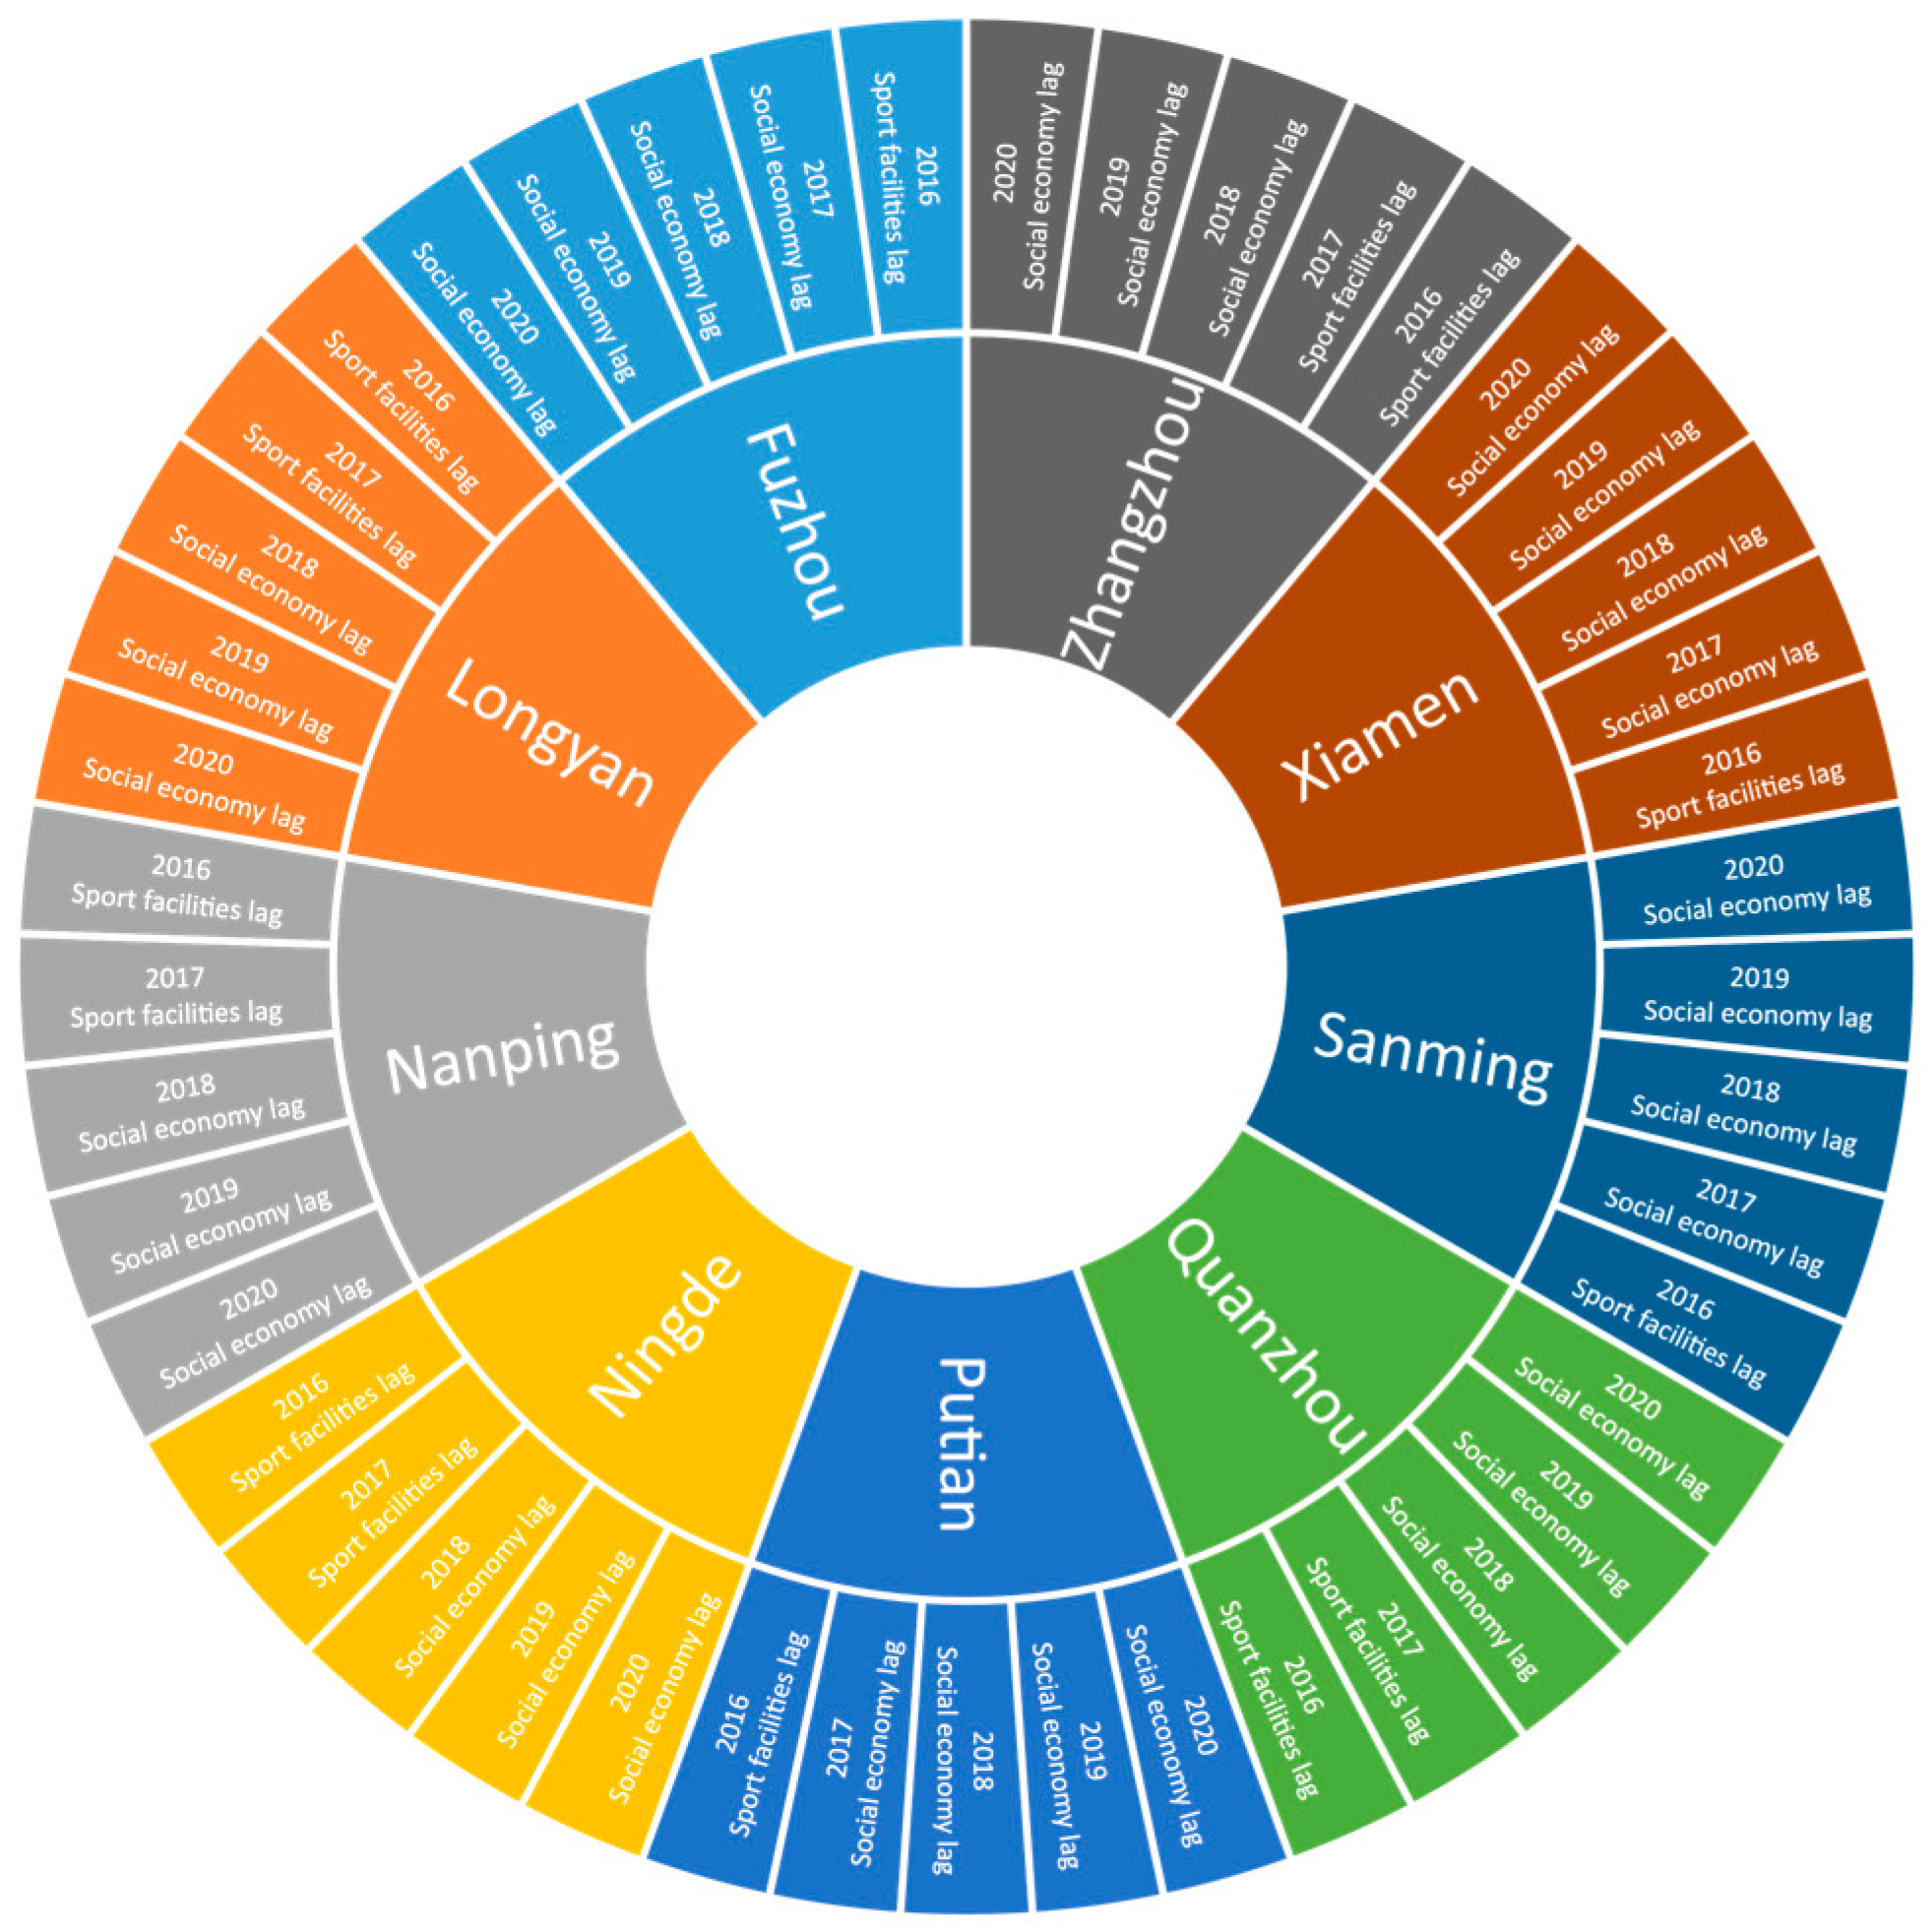
5.1. Comprehensive Development Level of Sports Facilities Construction in Fujian Province
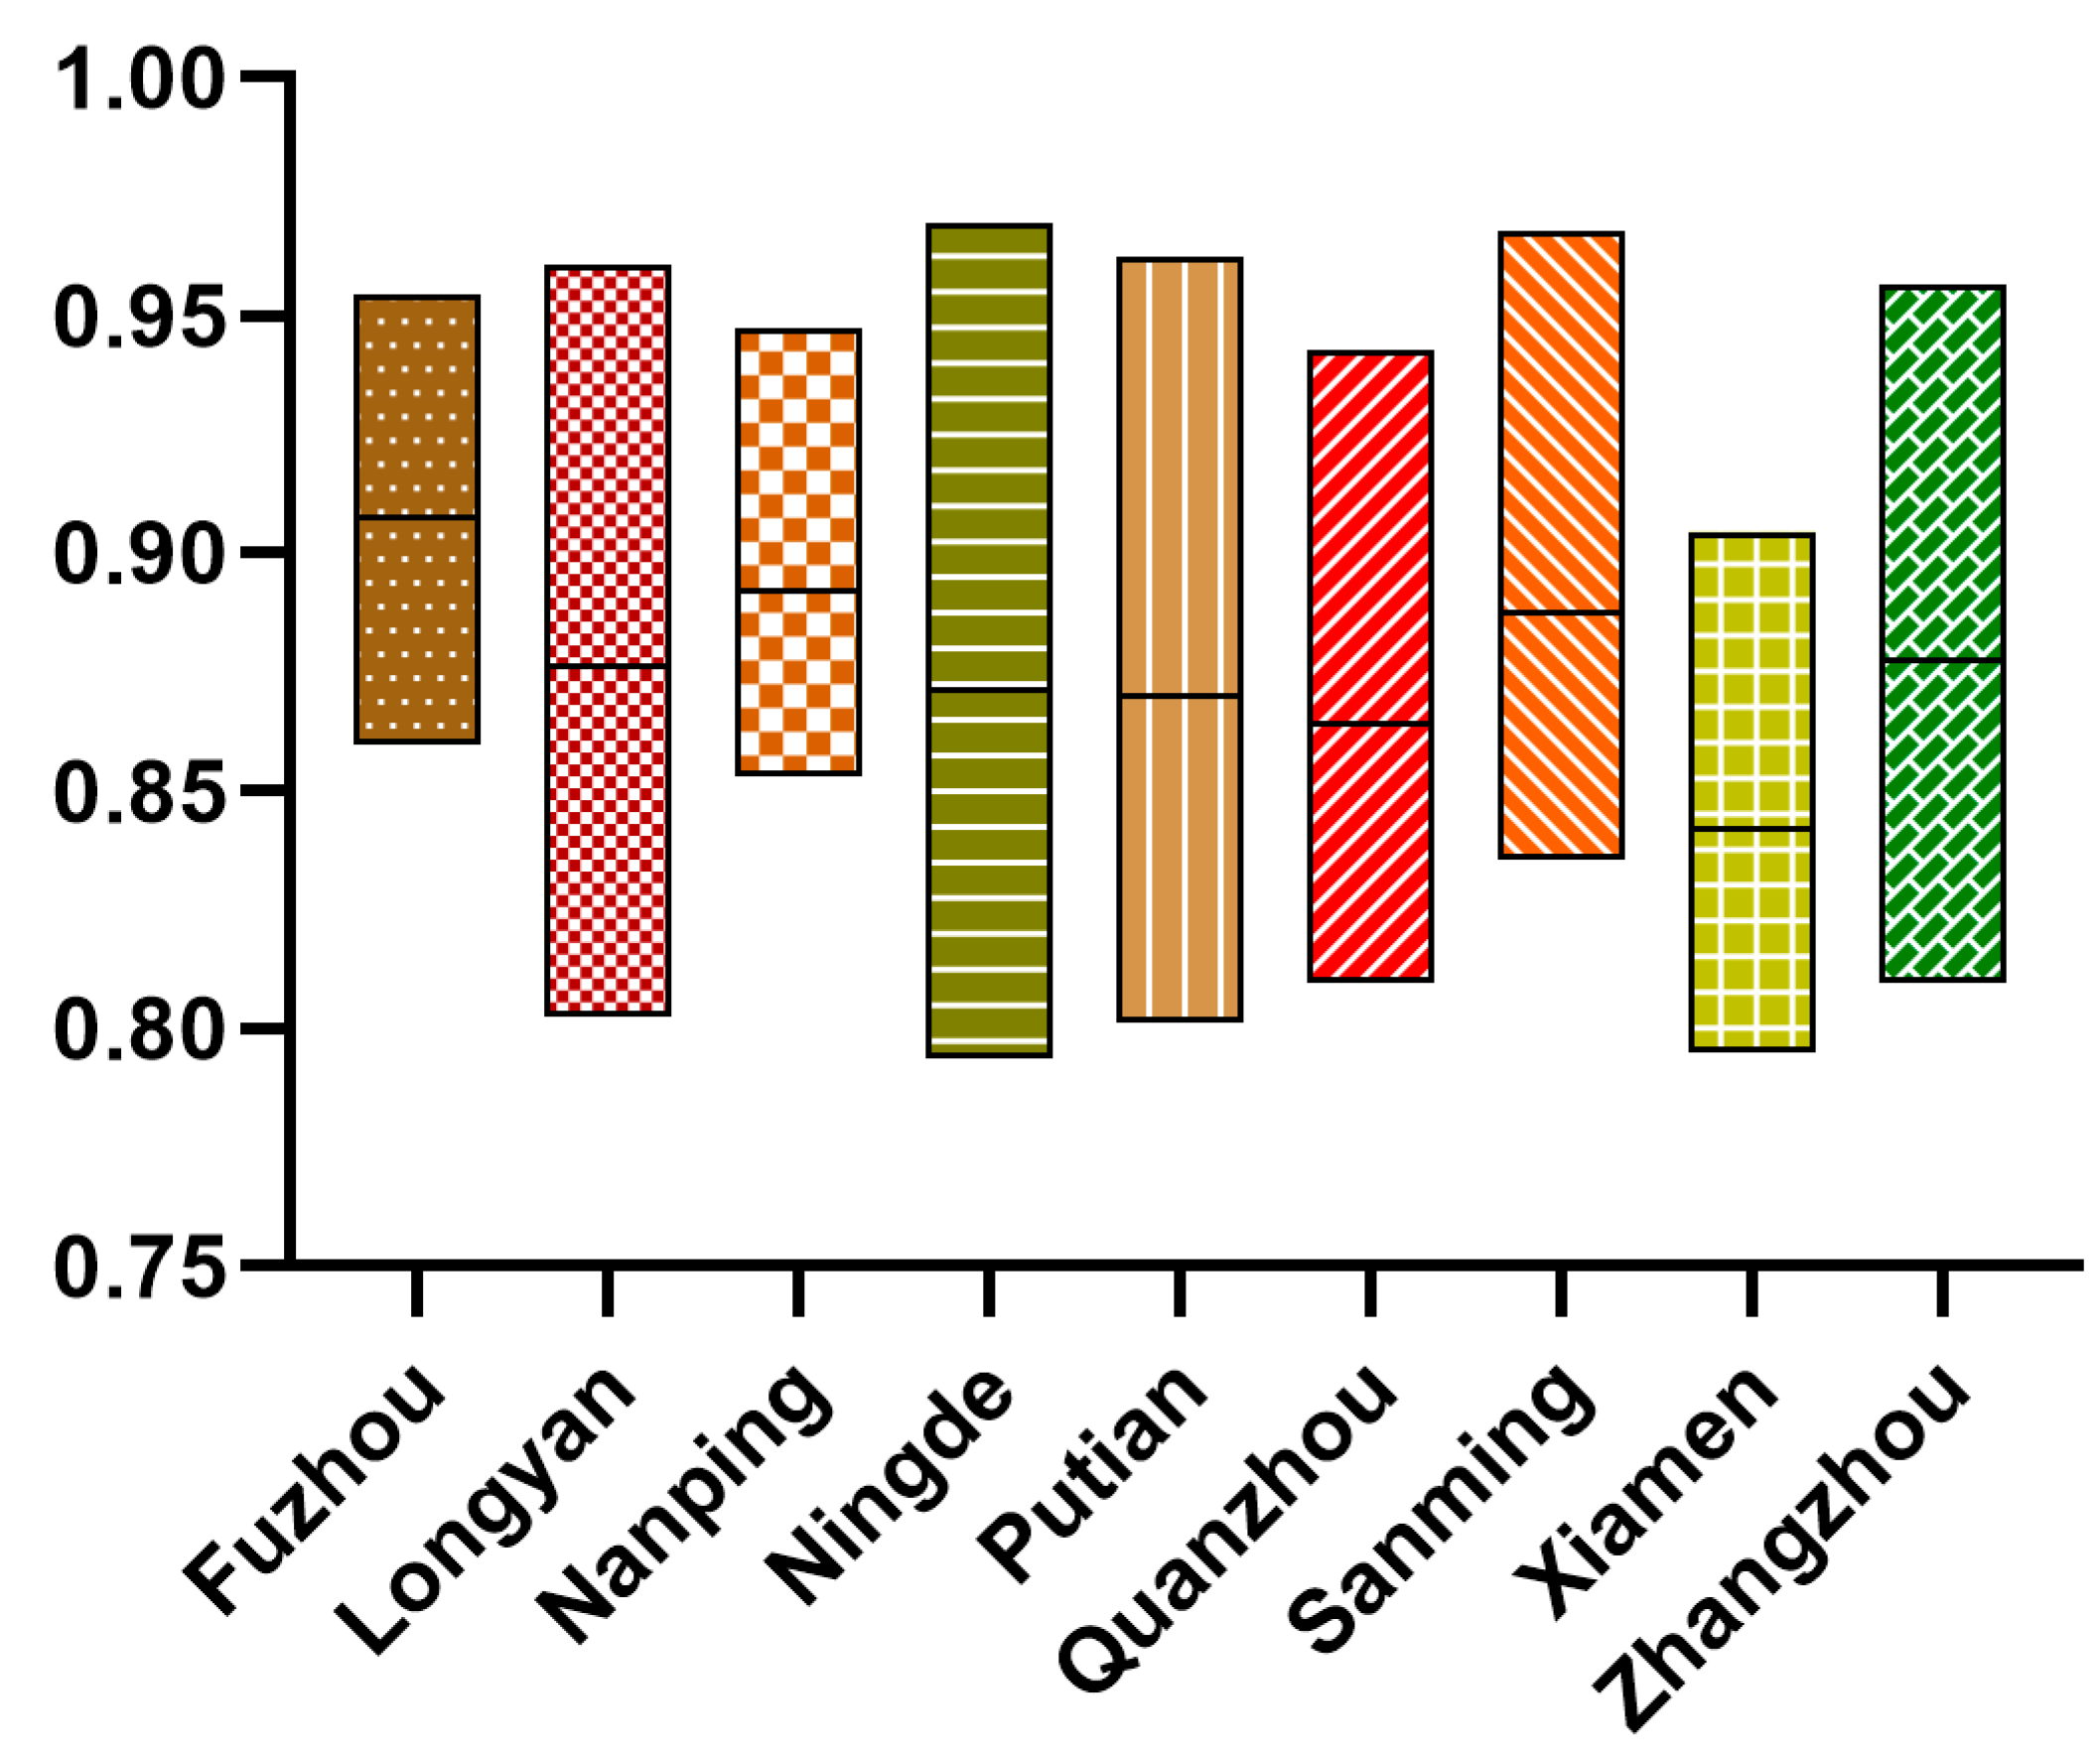
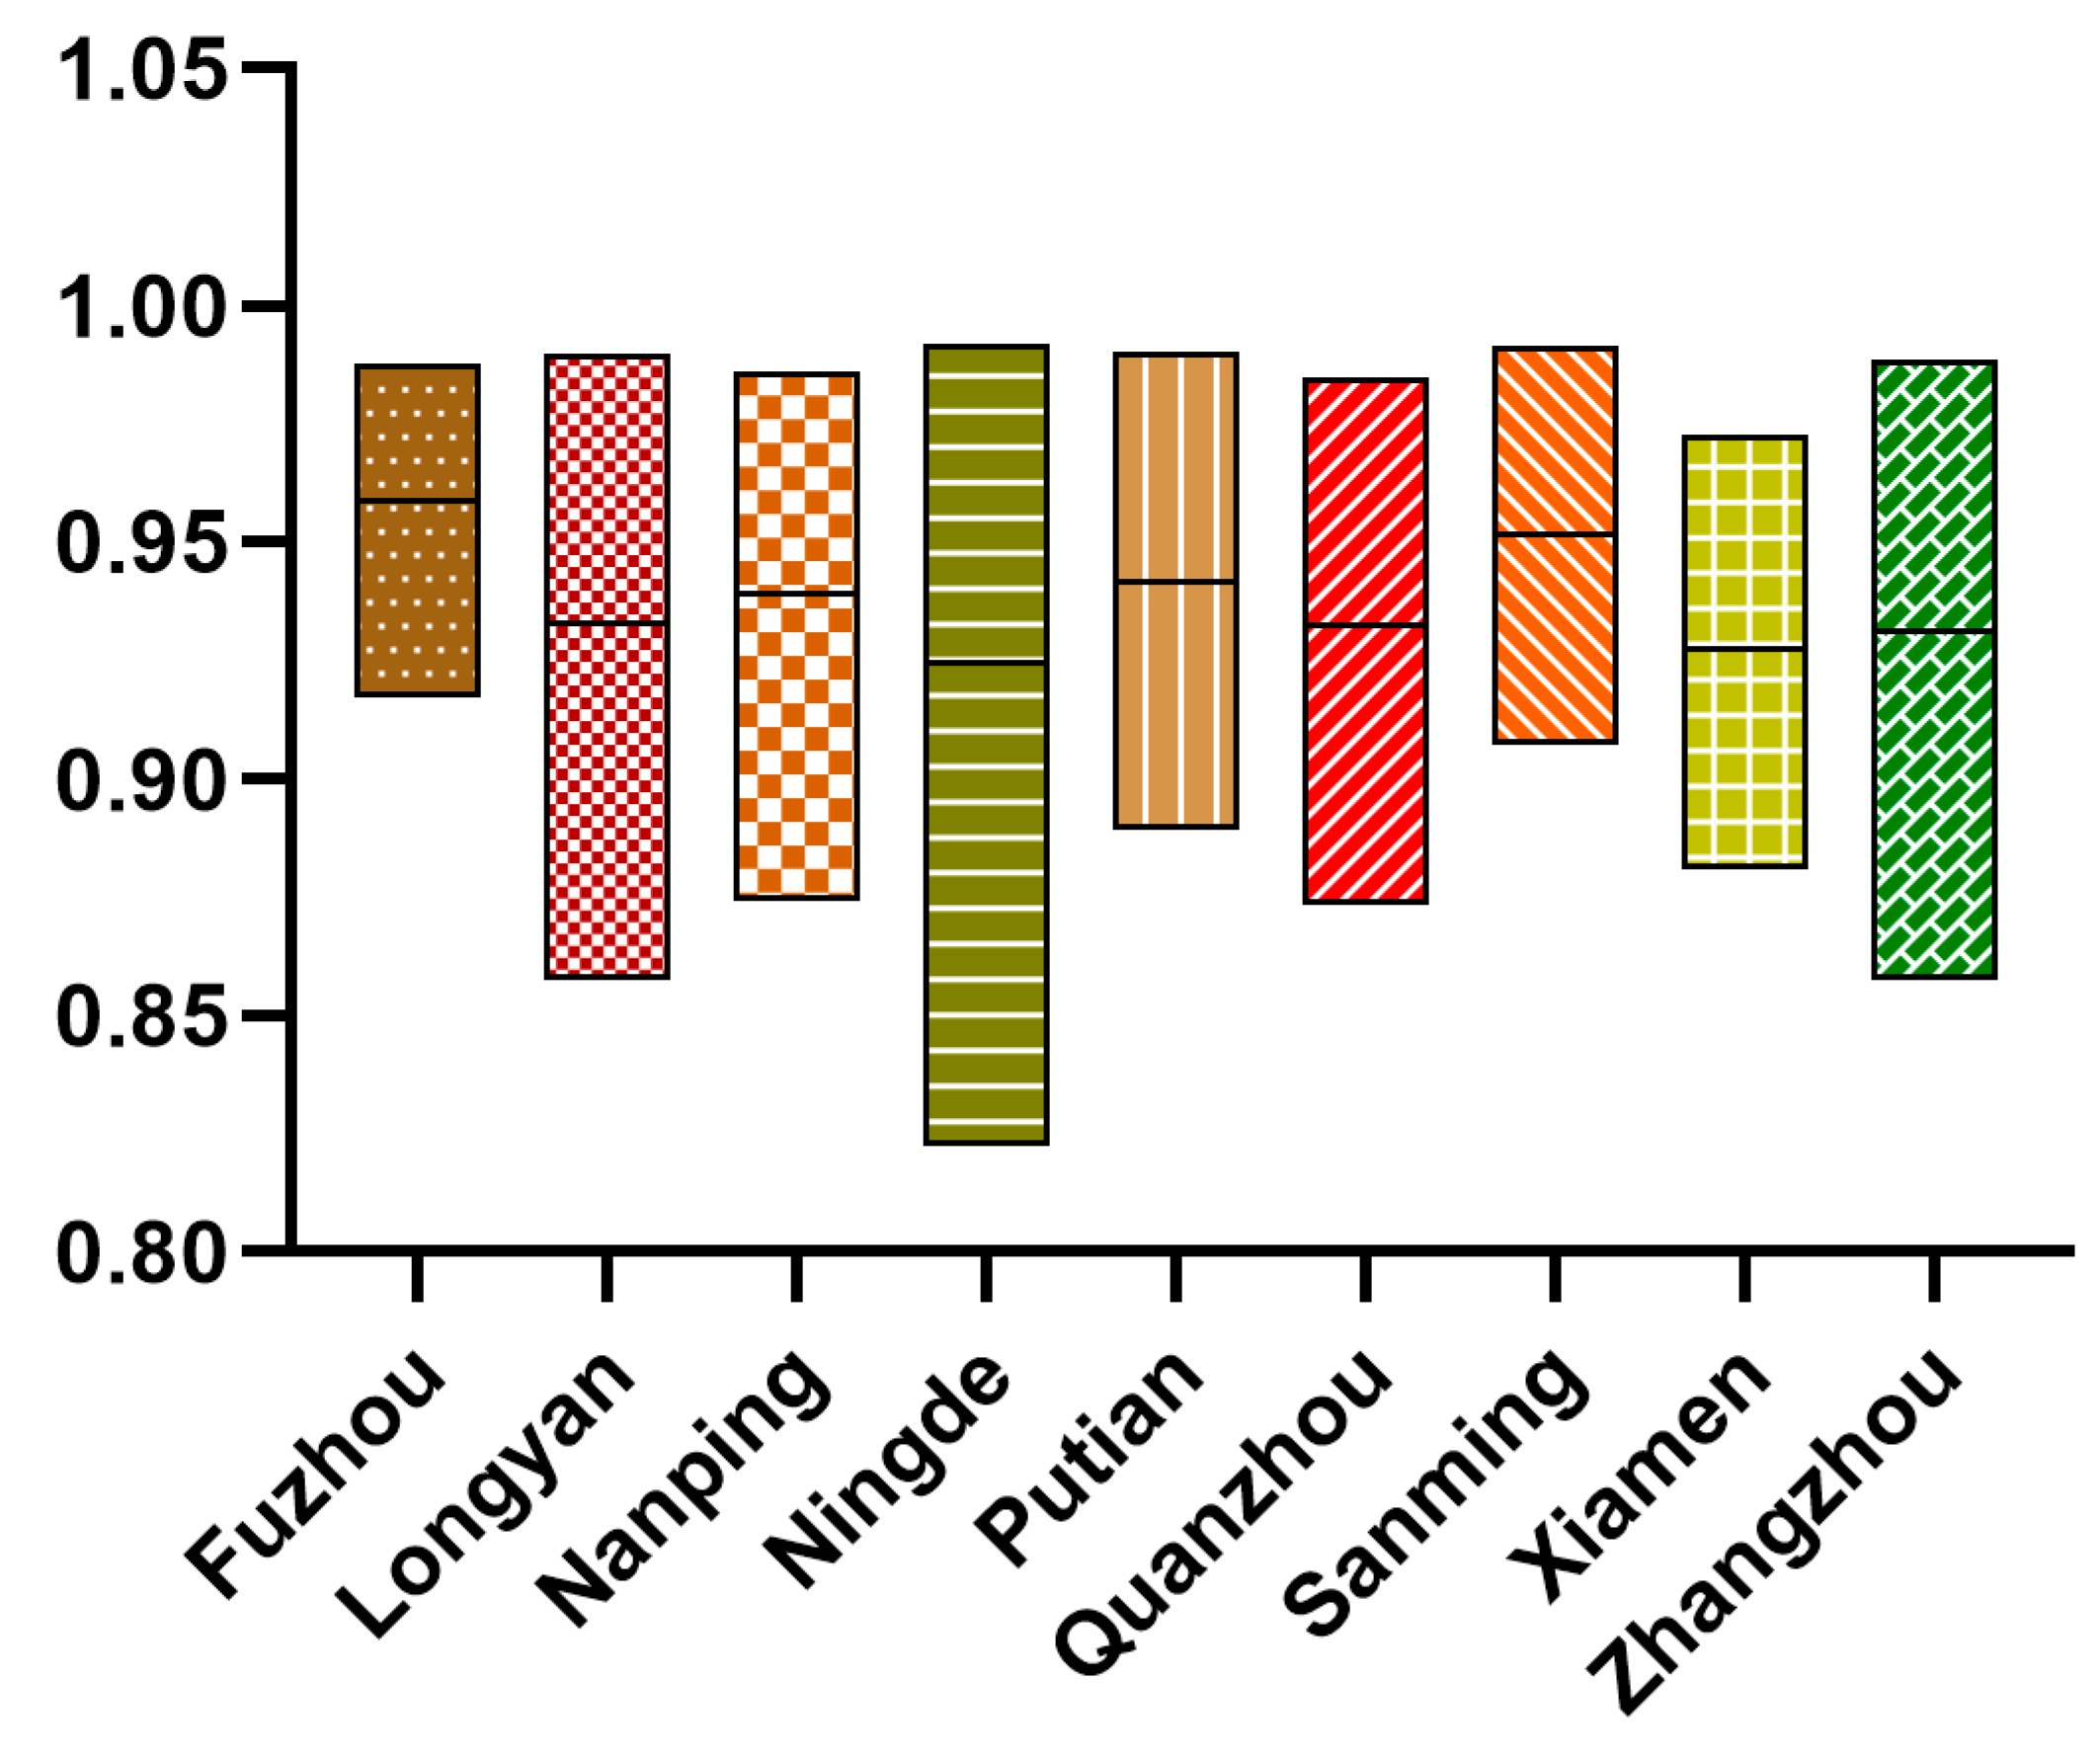
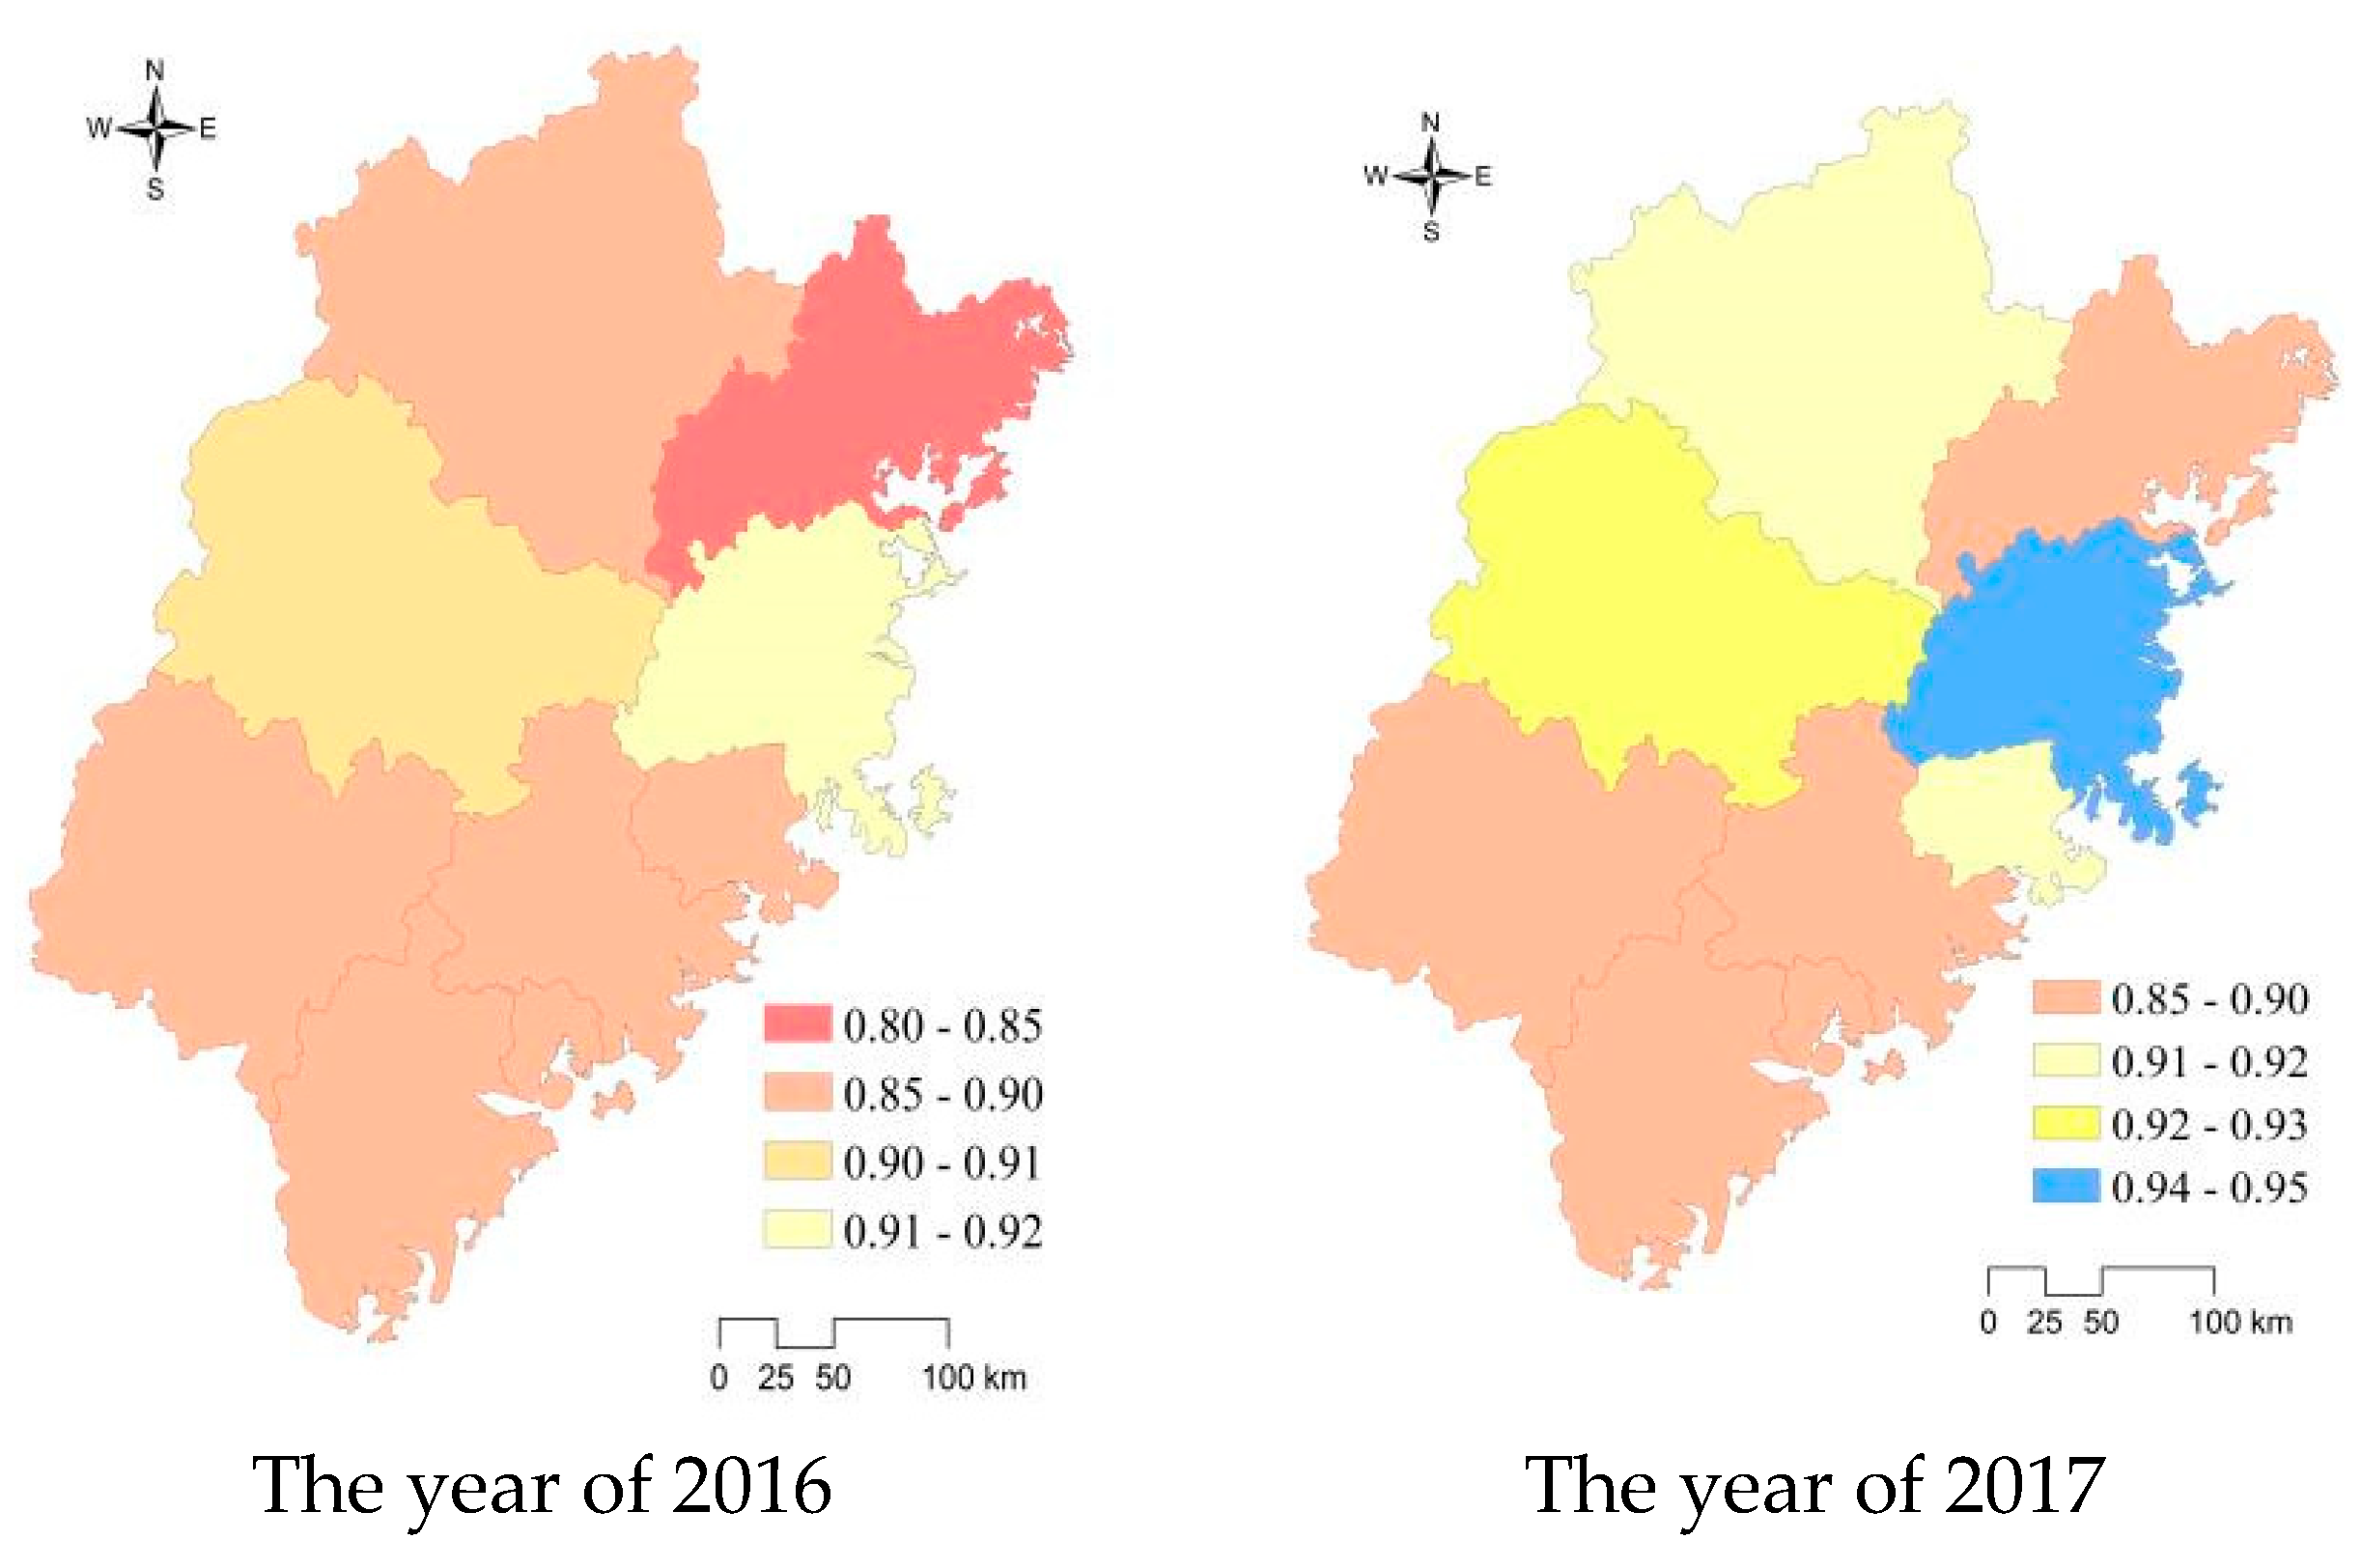
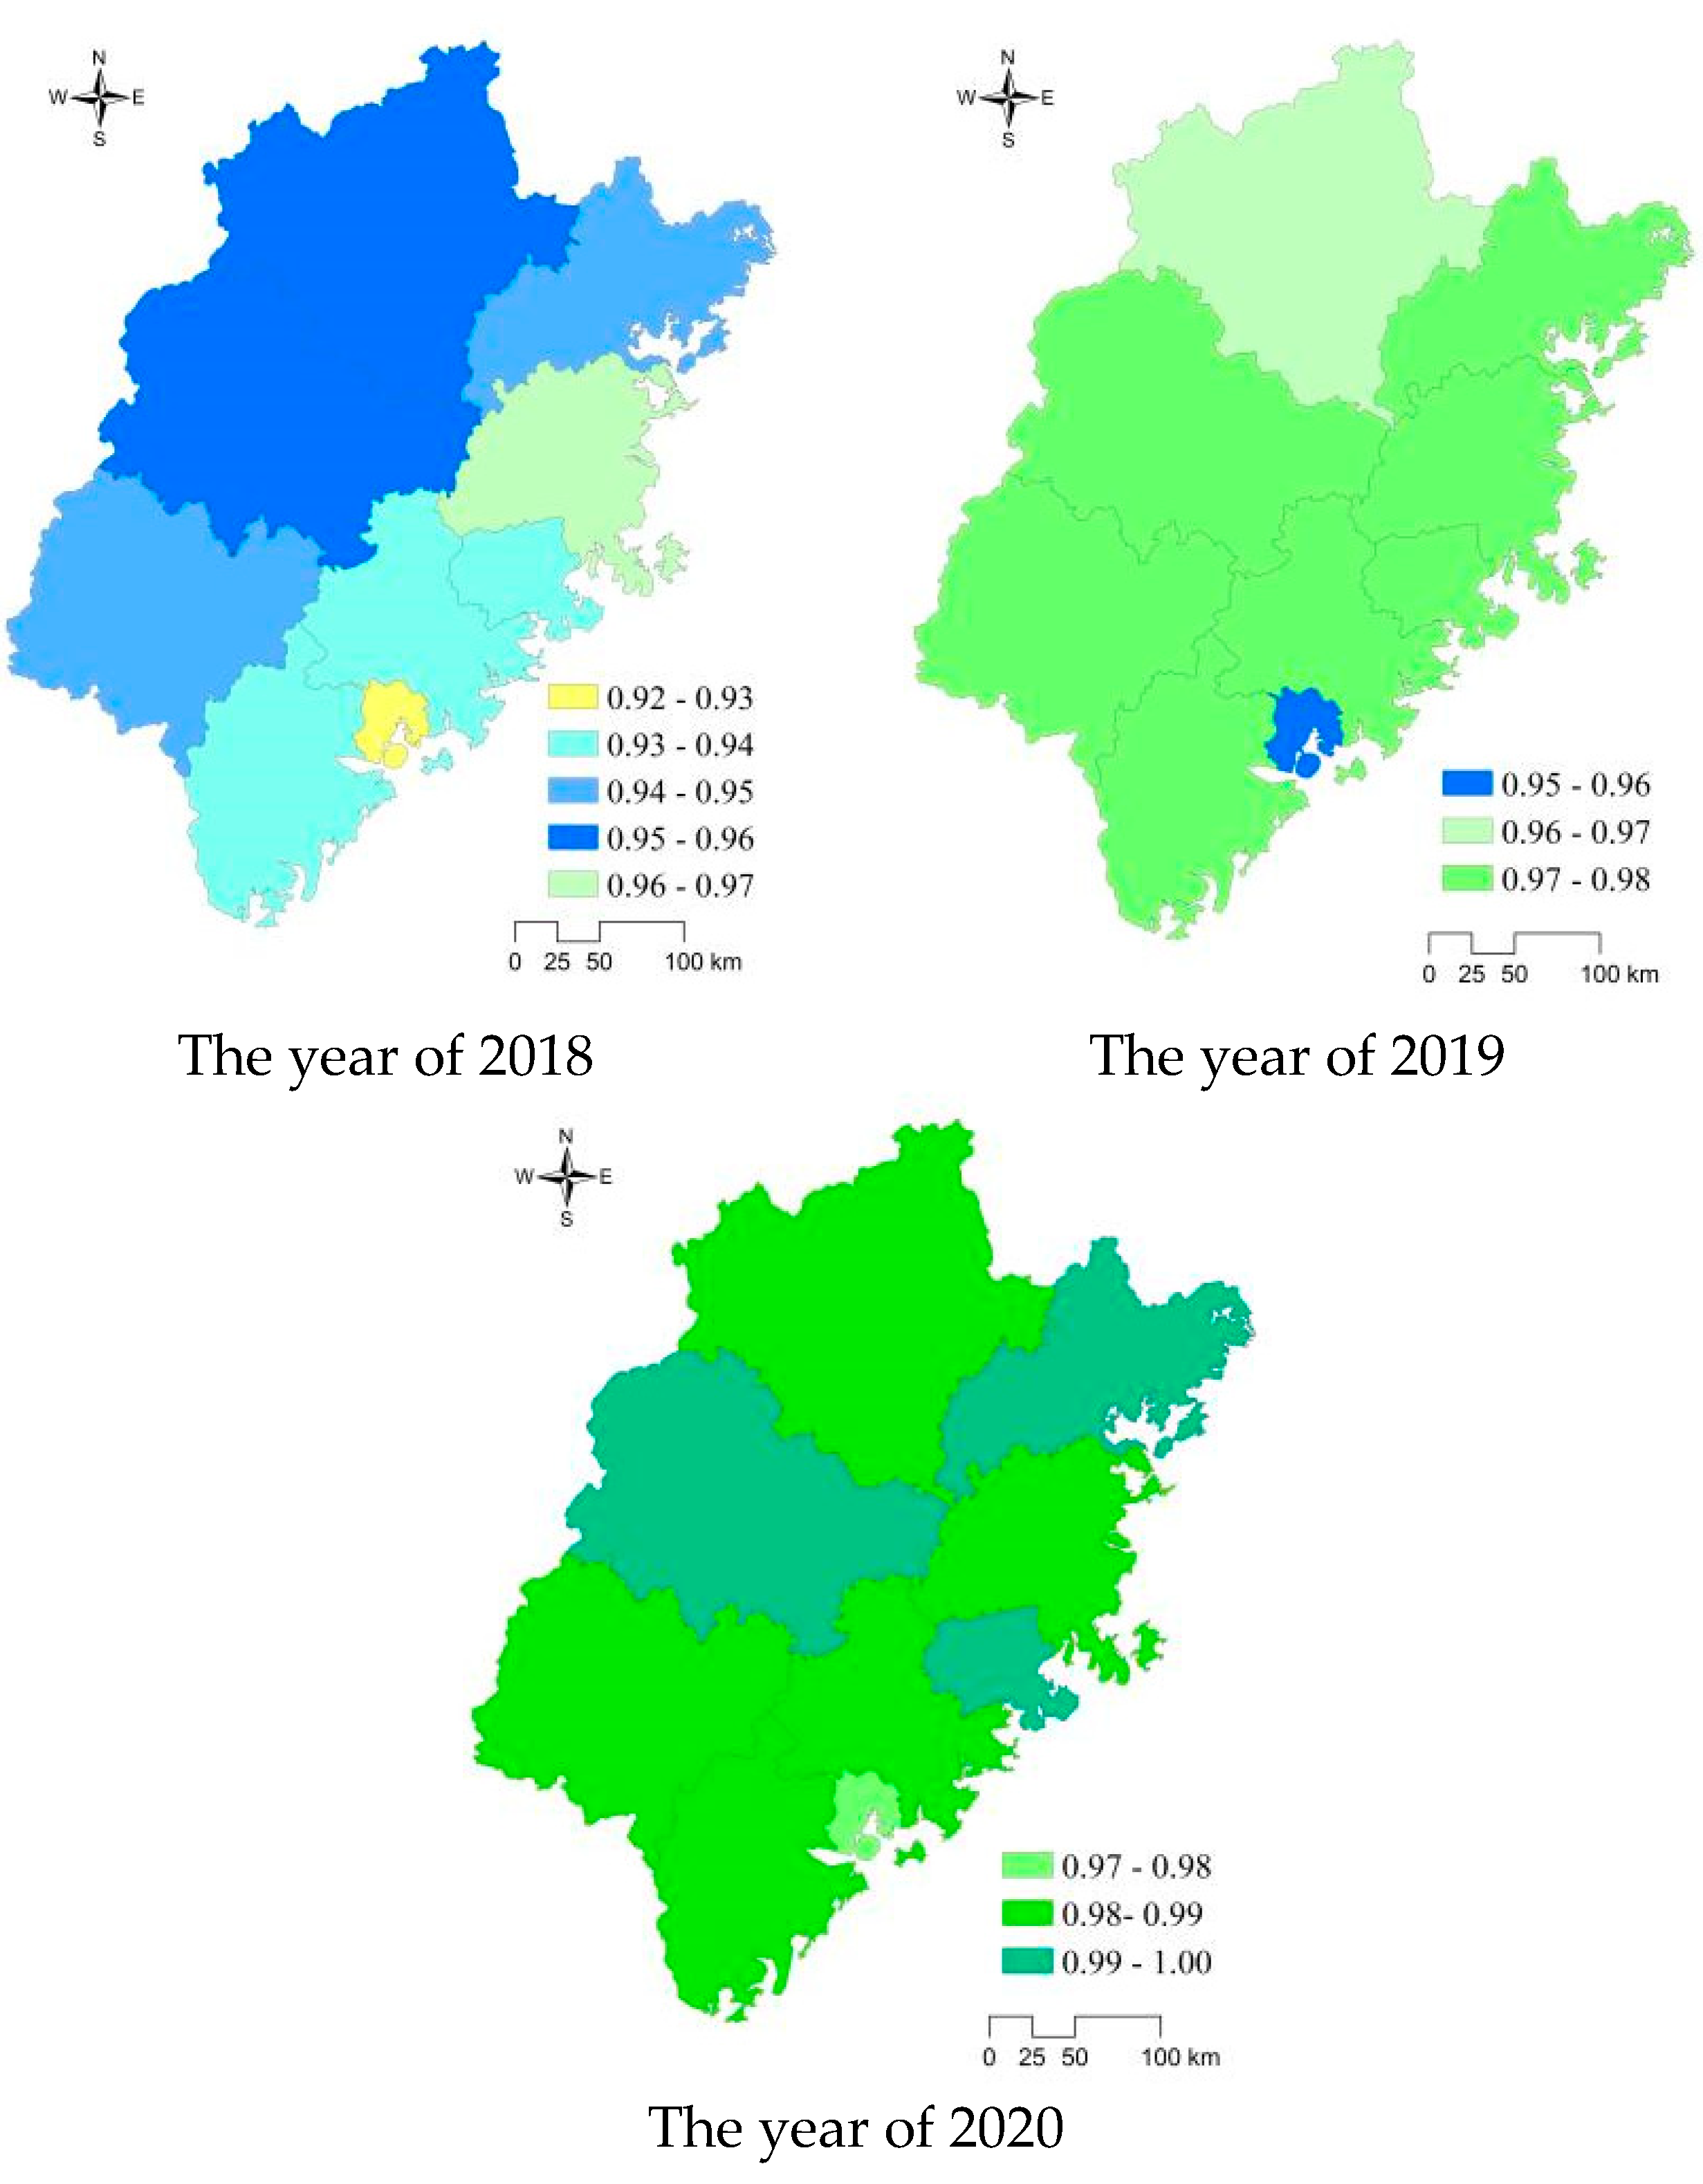
5.2. Analysis of the Coupling Coordination Degree between Sports Facilities Construction and Social Economy Development in Fujian Province
6. Analysis of the Influence Factors of Coupling Coordination between Sports Facilities Construction and Social Economy Development—Based on the Panel Data Model
6.1. Stationary Test and Cointegration Unit Root Test
6.2. Panel Regression Analysis
7. Results
- (1)
- The level of coupling coordination between sports facilities construction and social economy development in Fujian Province has gradually changed from good coordination to quality coordination, and the degree of coupling coordination between the two systems has increased significantly, indicating that the interaction between the two systems has been strengthened and the coupling coordination relationship is developing in a benign manner.
- (2)
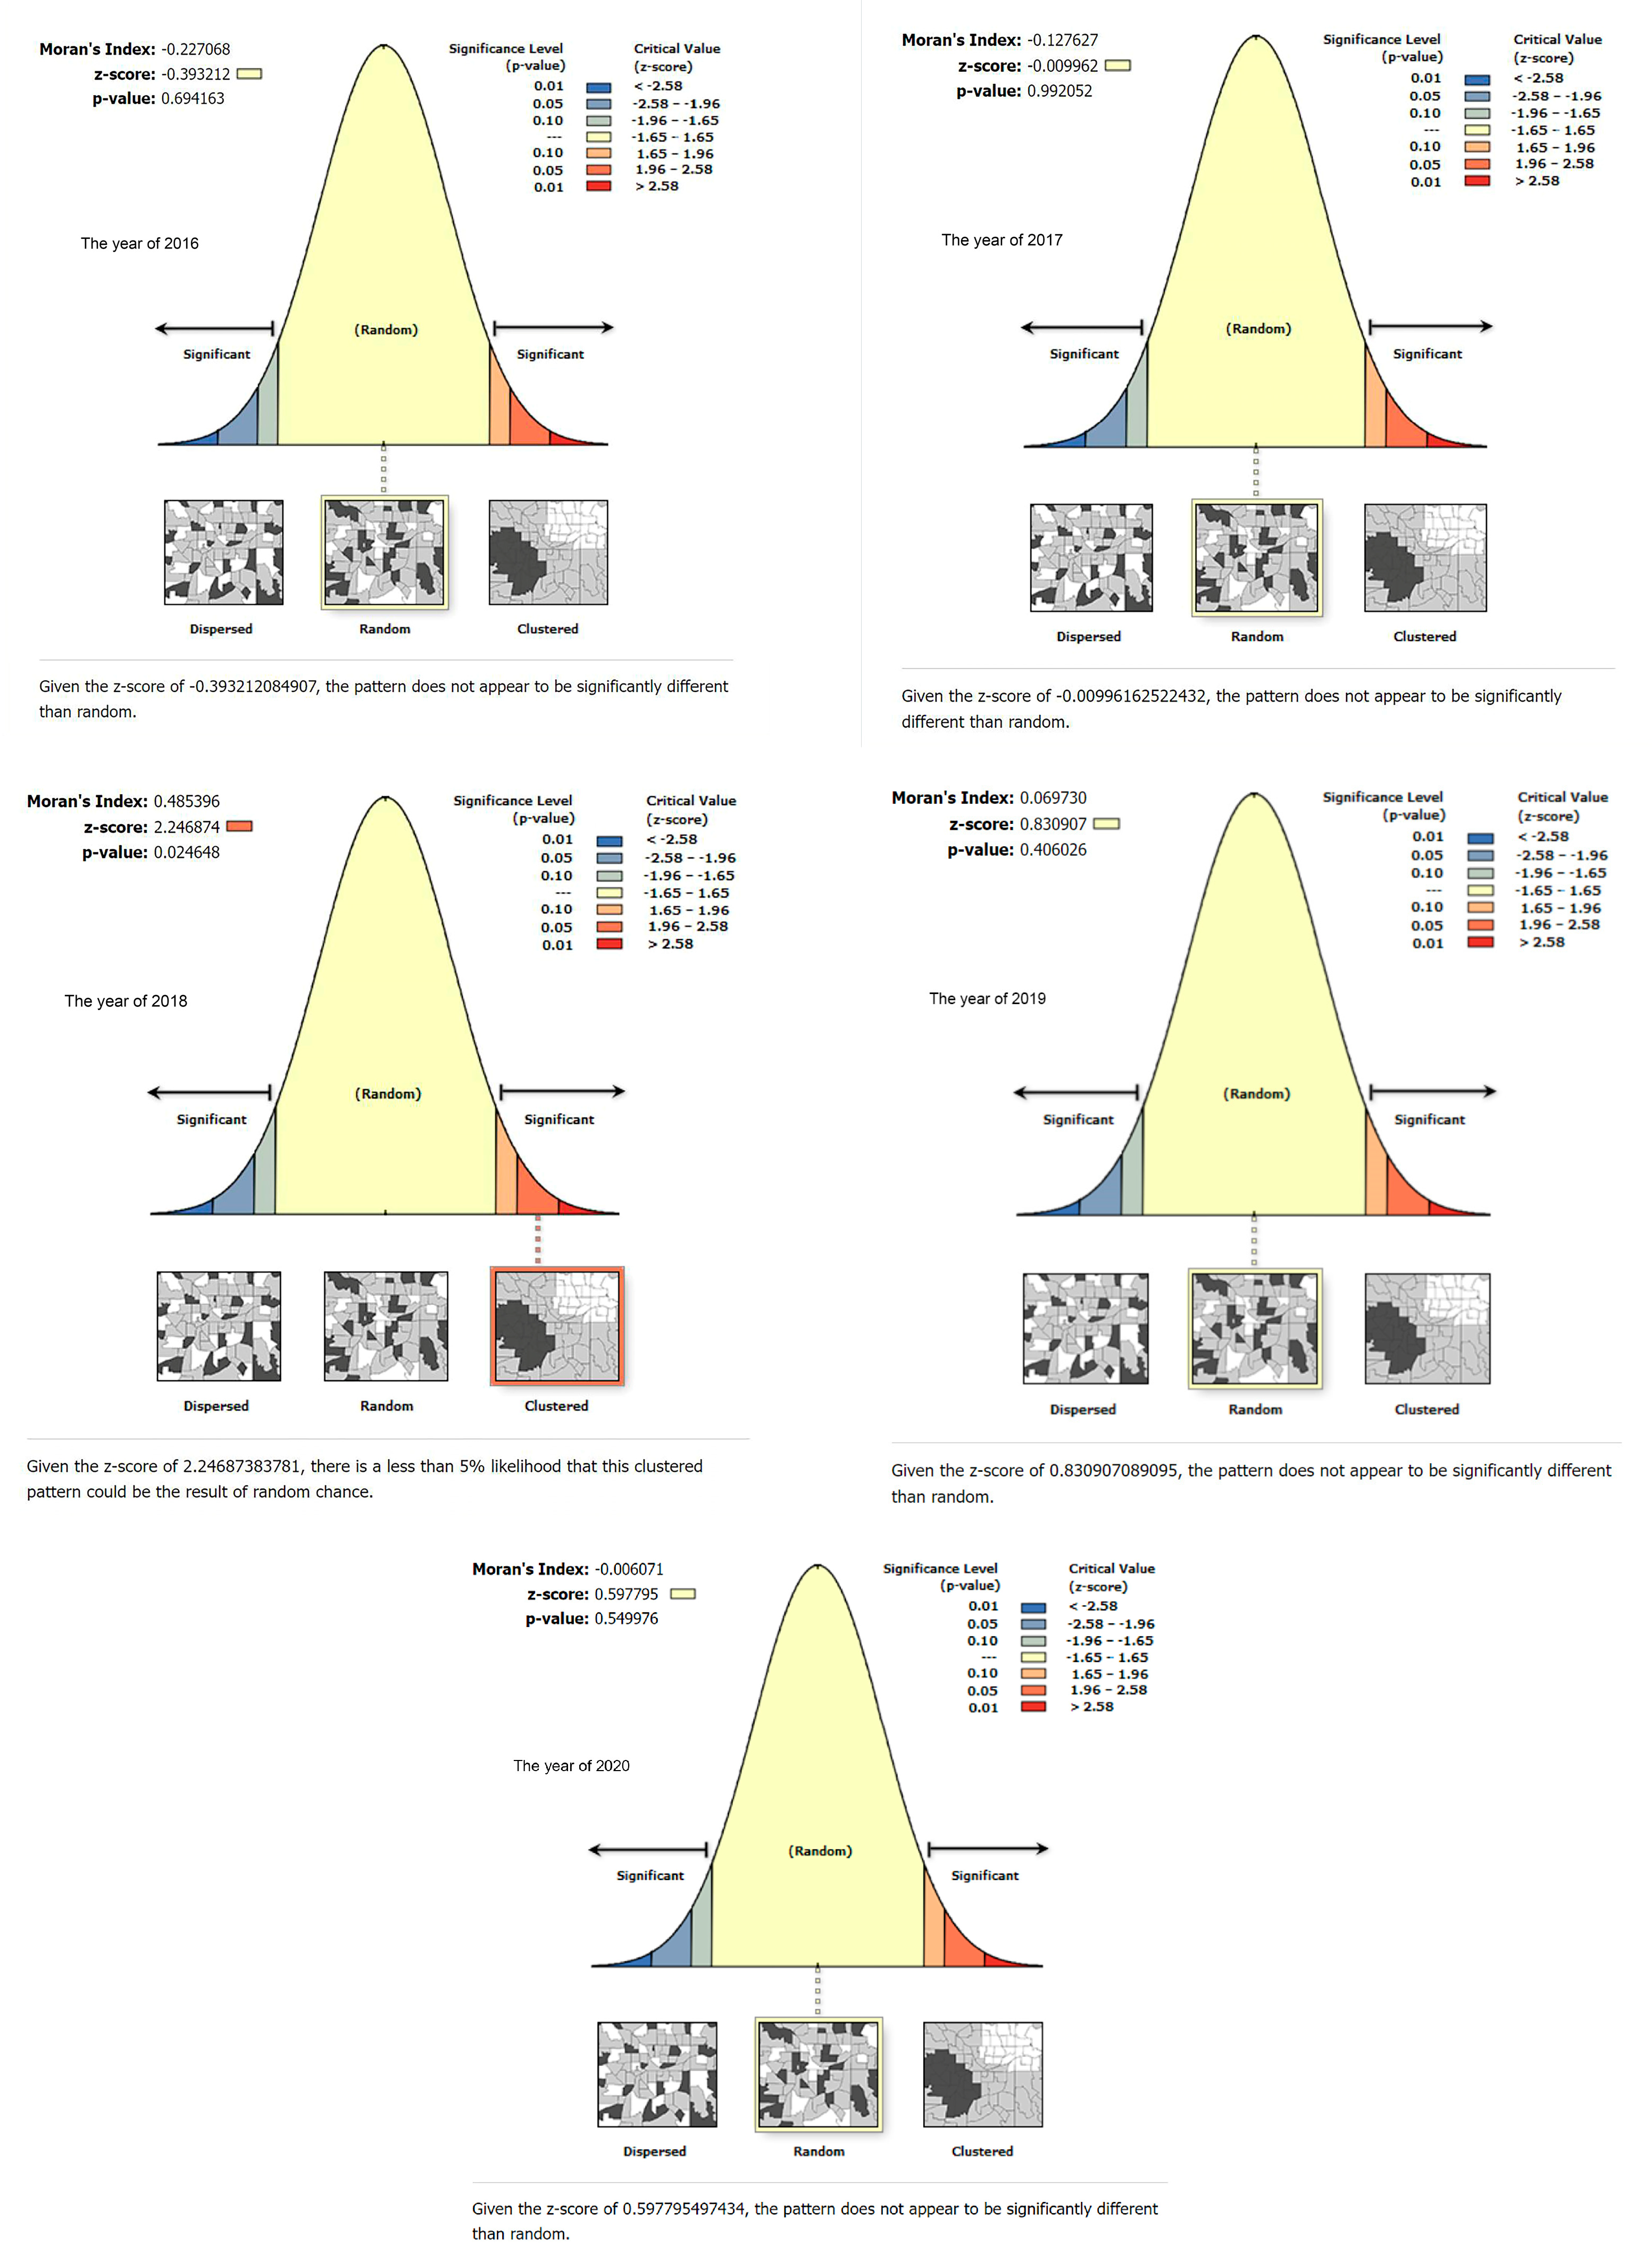
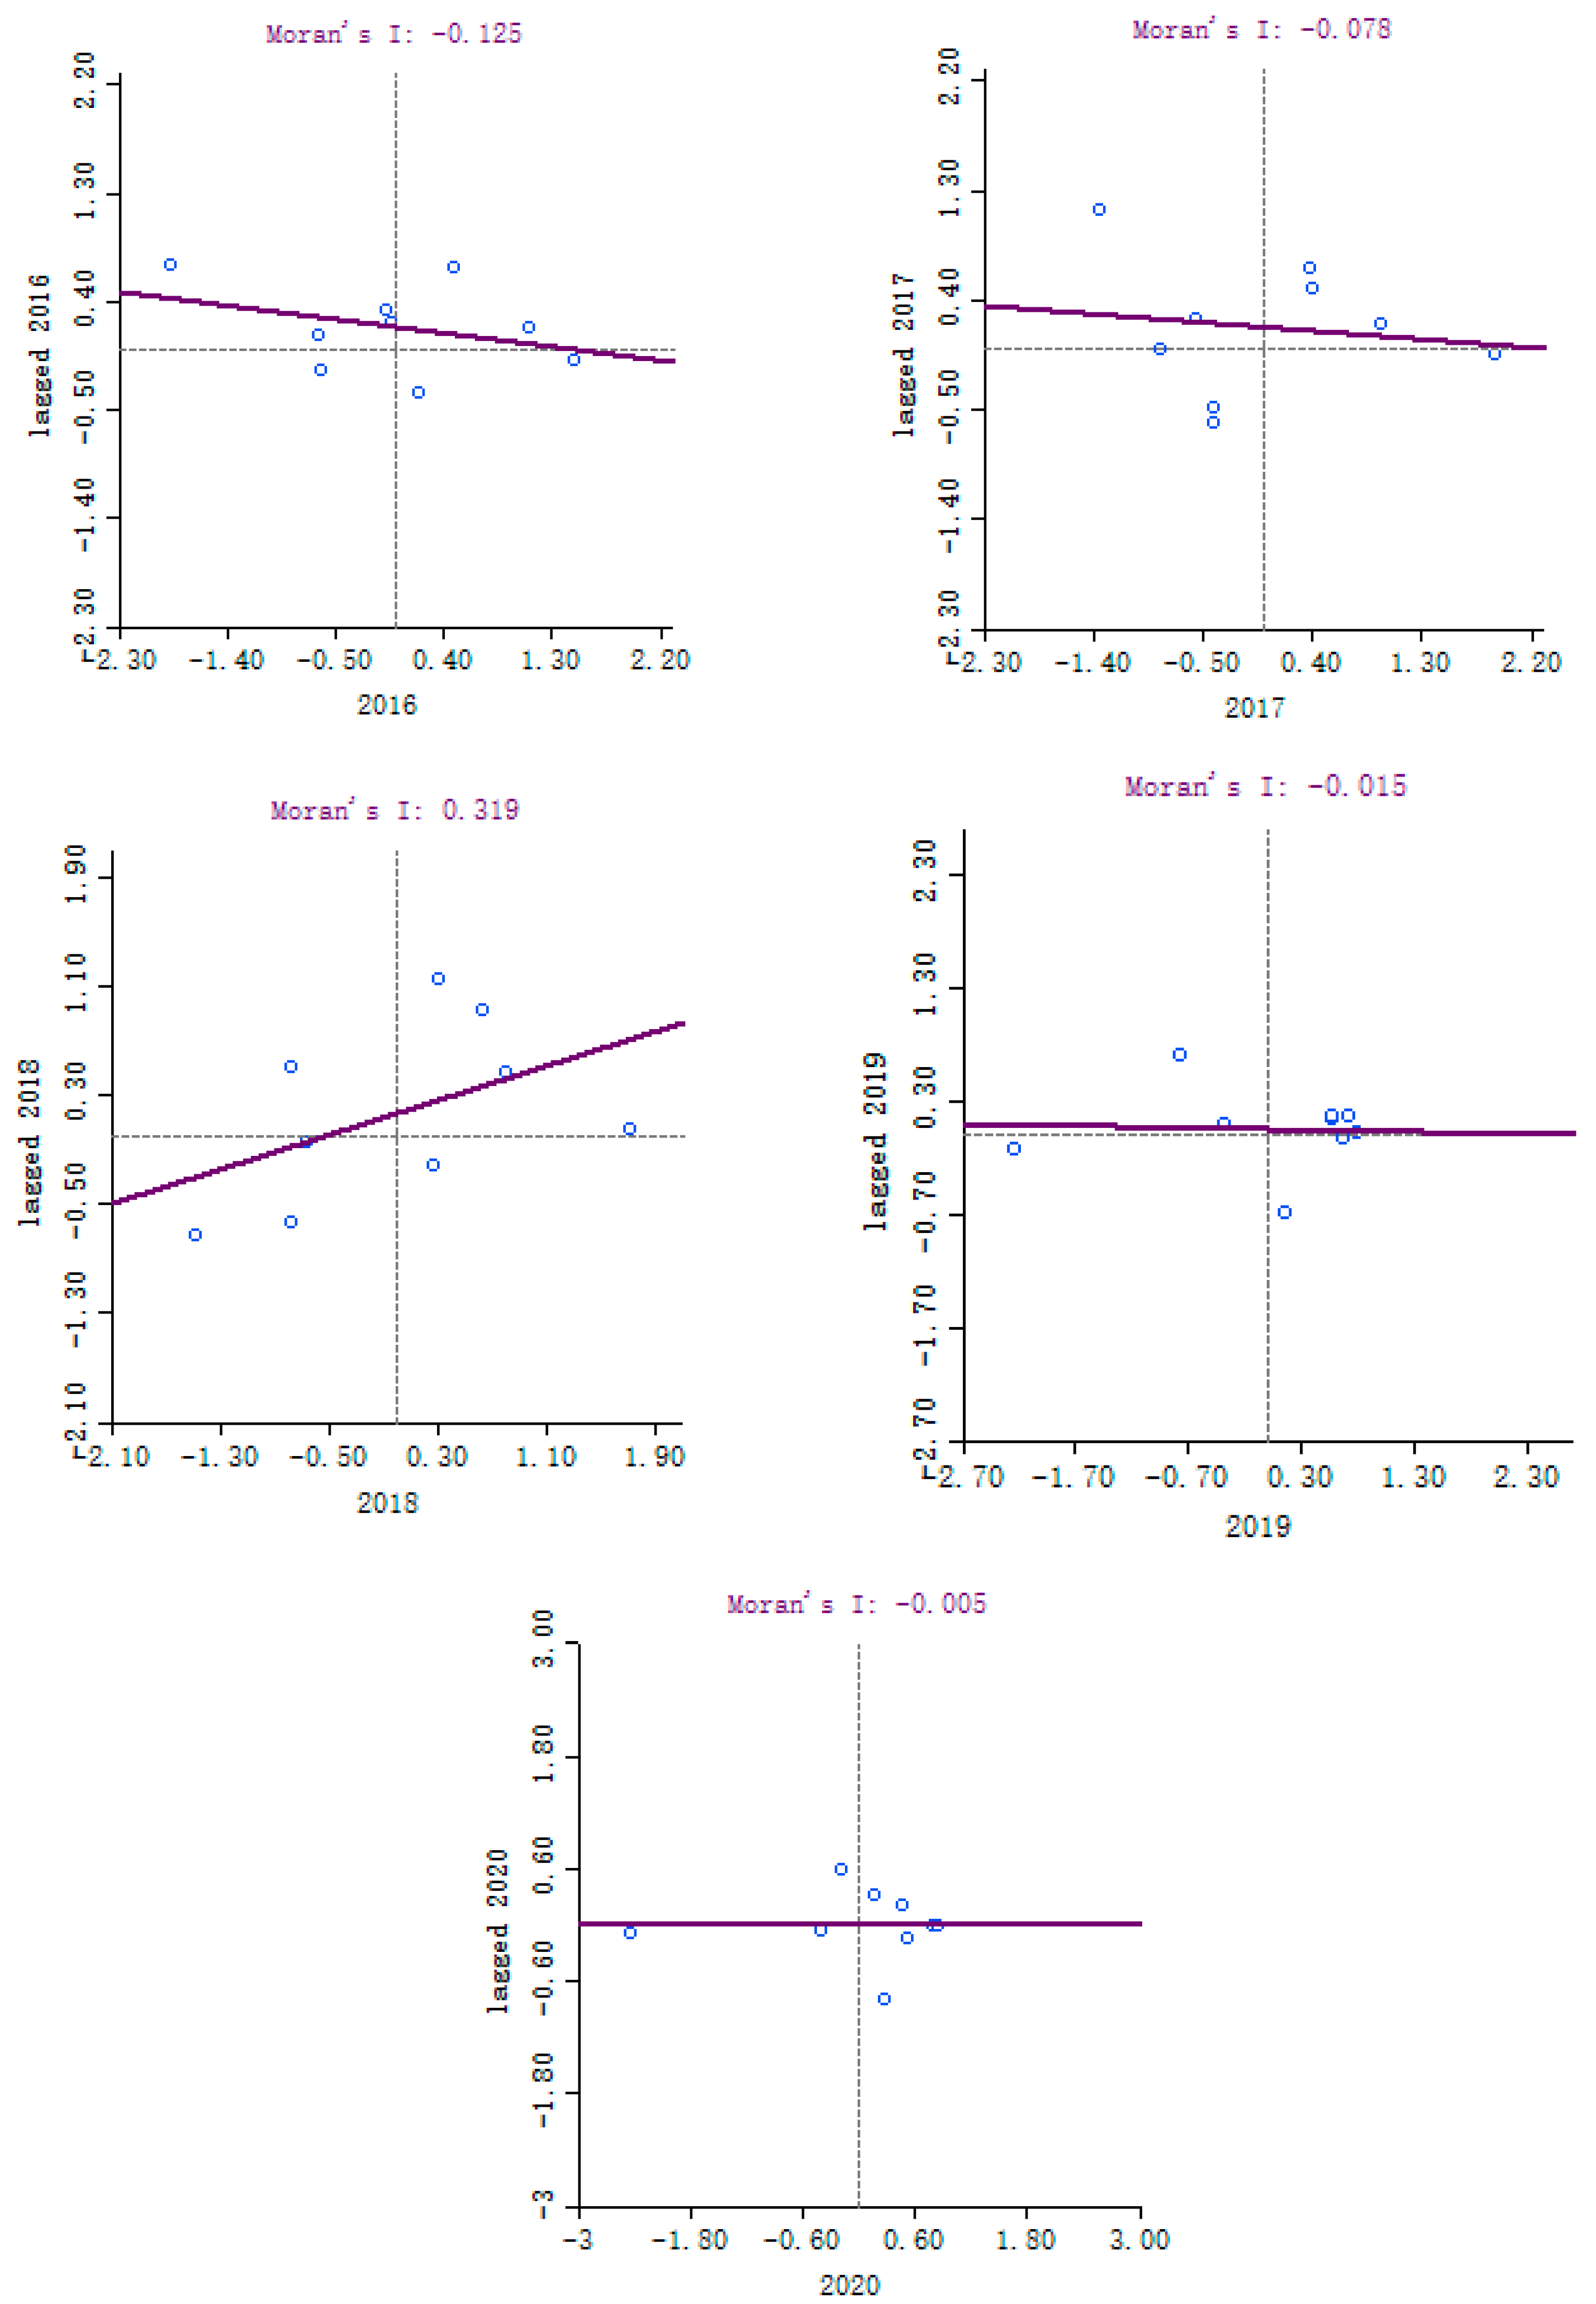
- From the perspective of the spatial correlation effect, there was spatial aggregation in the coupling coordination of sports venue construction and social economy development in 2018, and there was no spatial agglomeration among cities in other years. The spatial spillover effect is insufficient, and there is a lack of mutual promotion between neighboring cities. At the same time, the degree of coupling coordination of the two systems of sports venue construction and social economy development in each city developed relatively steadily.
- (3)
- In terms of influencing factors, industrial development, the level of urban development, and environmental development have a clear positive effect on the degree of coupling coordination.
8. Discussion
9. Limitations and Future Research
Author Contributions
Funding
Institutional Review Board Statement
Informed Consent Statement
Data Availability Statement
Acknowledgments
Conflicts of Interest
References
- Aman, M.S.; Ponnusamy, V.; Elumalai, G.; Mamat, S.; Mohamed, M.N.A.; Kamalden, T.F.T.; Yahya, S. Trends and usage of sports facilities among Malaysians. Int. J. Physiother. 2020, 7, 252–255. [Google Scholar]
- Dong, B.; Zou, Z.; Song, Y.; Hu, P.; Luo, D.; Wen, B.; Gao, D.; Wang, X.; Yang, Z.; Ma, Y.; et al. Adolescent health and healthy China 2030: A review. J. Adolesc. Health 2020, 67, S24–S31. [Google Scholar] [CrossRef] [PubMed]
- World Environment and Development Commission. Our Common Future; Jilin People’s Publishing House: Jilin, China, 1997. [Google Scholar]
- Cui, R.; Su, L. Research Status on Equalization of Public Sports Service for Nationwide Fitness in Hebei. Phys. Procedia 2012, 25, 2298–2303. [Google Scholar] [CrossRef]
- Kozma, G. The spatial development of sports facilities within the cities: A Central European case study. Geosport Soc. 2014, 1, 19–28. [Google Scholar]
- Ren, P.; Liu, Z. Planning and construction of sports facilities in urban residential areas in China. Open House Int. 2017, 3, 120–124. [Google Scholar]
- Zhou, R.; Cui, J. Analysis on Dynamic Relationship and Optimization Path between Public Sports Service and New Urbanization Development in Mainland China. Preprints 2022, 1, 2022060087. [Google Scholar]
- Wei, D.; Huang, C.; Lei, F.; Lei, W. The Spatial Patters and Evolution of the Stadiums and Sports Fields in Fujian Province. China Sport Sci. 2016, 1, 38–48. [Google Scholar]
- Zhu, Y.; Yu, W.; Chen, D. Balance of Resource Allocation of Sports Venues in China Based on GINI Coefficient. J. TUS 2018, 1, 14–19. [Google Scholar]
- Li, F.; Liu, L.; Du, C. Optimization Strategies of China’s Mass Sports Facilities from the Perspective of Supply-Side Reform. Sport. Cult. Guide 2021, 1, 49–55. [Google Scholar]
- Chen, Q.; Chen, J.; Ye, Y. Examining the Location Characteristics of Knowledge Industrial Space for Smart Planning and Industry 4.0: A Case Study of Hangzhou, China. Sustainability 2022, 14, 14594. [Google Scholar] [CrossRef]
- Bilgi, S.; Gulnerman, A.G.; Arslanoğlu, B.; Karaman, H.; Öztürk, Ö. Complexity measures of sports facilities allocation in urban area by metric entropy and public demand compatibility. Int. J. Eng. Geosci. 2019, 4, 141–148. [Google Scholar]
- Hemati, M.A.; Taji, A.; Hojabri, K.; Sori, A. The Survey Geographical Location of Sports Facilities by Using GIS (Case Study: Rasht). Sport Manag. Dev. 2019, 8, 41–50. [Google Scholar]
- Kou, J.; Yu, Z. Evaluation of Coordinated Development of Sports Venues Resources and Social Economy. J. Beijing FSport Univ. 2018, 10, 39–45. [Google Scholar]
- Feng, X.; Humphreys, B. Assessing the economic impact of sports facilities on residential property values: A spatial hedonic approach. J. Sport. Econ. 2018, 19, 188–210. [Google Scholar] [CrossRef]
- Li, L.; Fan, Z.; Feng, W.; Yuxin, C.; Keyu, Q. Coupling coordination degree spatial analysis and driving factor between socio-economic and eco-environment in northern China. Ecol. Indic. 2022, 135, 108555. [Google Scholar] [CrossRef]
- Cai, L.; Li, Q.; Du, Y.; Yun, J.; Xie, Y.; DeBerardinis, R.J.; Xiao, G. Genomic regression analysis of coordinated expression. Nat. Commun. 2017, 8, 2187. [Google Scholar] [CrossRef]
- Lee, L.; Yu, J. Some recent developments in spatial panel data models. Reg. Sci. Urban Econ. 2020, 40, 255–271. [Google Scholar] [CrossRef]
- Fujian Statistical Yearbook-2020. Available online: https://tjj.fujian.gov.cn/tongjinianjian/dz2020/index.htm/ (accessed on 27 October 2022).
- Wong, K.K.L. A Geometrical Perspective for the Bargaining Problem. PLoS ONE 2010, 4, e10331. [Google Scholar] [CrossRef]
- Wang, F.; Mao, A.; Li, H.; Jia, M. Quality measurement and regional difference of urbanization in Shandong province based on the entropy method. Sci. Geogr. Sin. 2013, 11, 1323–1329. [Google Scholar]
- Chen, W.; Wong, K.K.L.; Long, S.; Sun, Z. Relative Entropy of Correct Proximal Policy Optimization Algorithms with Modified Penalty Factor in Complex Environment. Entropy 2022, 24, 440. [Google Scholar] [CrossRef]
- Yang, Y.; Bao, W.; Liu, Y. Coupling coordination analysis of rural production-living-ecological space in the Beijing-Tianjin-Hebei region. Ecol. Indic. 2020, 117, 106512. [Google Scholar] [CrossRef]
- Wang, Y.; Xiang, P. Urban Sprawl Sustainability of Mountainous Cities in the Context of Climate Change Adaptability Using a Coupled Coordination Model: A Case Study of Chongqing, China. Sustainability 2019, 11, 20. [Google Scholar] [CrossRef]
- Wang, D.; Jiang, D.; Fu, J.; Lin, G.; Zhang, J. Comprehensive Assessment of Production–Living–Ecological Space Based on the Coupling Coordination Degree Model. Sustainability 2020, 12, 2009. [Google Scholar] [CrossRef]
- Shi, T.; Yang, S.; Zhang, W.; Zhou, Q. Coupling coordination degree measurement and spatiotemporal heterogeneity between economic development and ecological environment—Empirical evidence from tropical and subtropical regions of China. J. Clean. Prod. 2020, 244, 118739. [Google Scholar] [CrossRef]
- Wang, R.; Cheng, J.; Zhu, Y.; Lu, P. Evaluation on the coupling coordination of resources and environment carrying capacity in Chinese mining economic zones. Resour. Policy 2017, 53, 20–25. [Google Scholar] [CrossRef]
- Wong, K.K.L. Bridging game theory and knapsack problem. J. Eng. Math. 2015, 1, 77–192. [Google Scholar]
- Xu, M.; Hu, W. A research on coordination between economy, society and environment in China: A case study of Jiangsu. J. Clean. Prod. 2020, 258, 120641. [Google Scholar] [CrossRef]
- He, J.; Wang, S.; Liu, Y.; Ma, H.; Liu, Q. Examining the relationship between urbanization and the eco-environment using a coupling analysis: Case study of Shanghai, China. Ecol. Indic. 2017, 77, 185–193. [Google Scholar] [CrossRef]
- Liu, H.; Han, B.; Wang, L. Modeling the spatial relationship between urban ecological resources and the economy. J. Clean. Prod. 2018, 173, 207–216. [Google Scholar] [CrossRef]
- Ningde Government Work Report in 2022. Available online: http://www.ningde.gov.cn/zwgk/ghjh/zfgzbg/202201/t20220128_1588985.htm/ (accessed on 27 October 2022).
- Chen, J.; Xu, C.; Song, M.; Xie, Q.; Liu, X. Regional disparities and influencing factors for carbon productivity change in China’s transportation industry. Int. J. Sustain. Transp. 2020, 14, 579–590. [Google Scholar] [CrossRef]
- Yang, D.; Mak, C.M. An assessment model of classroom acoustical environment based on fuzzy comprehensive evaluation method. Appl. Acoust. 2017, 127, 292–296. [Google Scholar] [CrossRef]
- Lockman, J.J.; Fears, N.E.; Jung, W.P. The Development of Object Fitting: The Dynamics of Spatial Coordination. Adv. Child Dev. Behav. 2018, 55, 31–72. [Google Scholar]
- Rahmati, O.; Zeinivand, H.; Besharat, M. Flood hazard zoning in Yasooj region, Iran, using GIS and multi-criteria decision analysis. Geomat. Nat. Hazards Risk 2016, 7, 1000–1017. [Google Scholar] [CrossRef]
- Wong, K.K.L.; Abbott, D. Automatic Target Recognition Based on Cross-Plot. PLoS ONE 2011, 9, e25621. [Google Scholar] [CrossRef]
- Ren, H.; Shang, Y.; Zhang, S. Measuring the spatiotemporal variations of vegetation net primary productivity in Inner Mongolia using spatial autocorrelation. Ecol. Indic. 2020, 112, 106108. [Google Scholar] [CrossRef]
- Zhang, Z.; Zhang, G.; Su, B. The spatial impacts of air pollution and socio-economic status on public health: Empirical evidence from China. Socio-Econ. Plan. Sci. 2022, 83, 101167. [Google Scholar] [CrossRef]
- Elhorst, J.P. Spatial Panel Models. In Handbook of Regional Science; Springer: Berlin/Heidelberg, Germany, 2013. [Google Scholar]
- Zhang, Y.; Liu, Y.; Zhang, Y.; Liu, Y.; Zhang, G.; Chen, Y. On the spatial relationship between ecosystem services and urbanization: A case study in Wuhan, China. Sci. Total Environ. 2018, 637–638, 780–790. [Google Scholar] [CrossRef]
- Yang, S.; Xu, J.; Yang, R. Research on Coordination and Driving Factors of Sports Industry and Regional Sustainable Development—Empirical Research Based on Panel Data of Provinces and Cities in Eastern China. Sustainability 2020, 12, 813. [Google Scholar] [CrossRef]
- Liu, L.; Zhang, Y.; Zhang, J.; Zhang, S. Coupling Coordination Degree of Government Support, Financial Support and Innovation and its Impact on Economic Development. IEEE Access 2020, 8, 104039–104051. [Google Scholar] [CrossRef]
- Tong, S.; Li, X.; Zhang, J.; Bao, Y.; Bao, Y.; Na, L.; Si, A. Spatial and temporal variability in extreme temperature and precipitation events in Inner Mongolia (China) during 1960–2017. Sci. Total Environ. 2019, 649, 75–89. [Google Scholar] [CrossRef]
- Donat, M.; Geistert, J.; Grahmann, K.; Bloch, R.; Bellingrath-Kimura, S.D. Patch cropping- a new methodological approach to determine new field arrangements that increase the multifunctionality of agricultural landscapes. Comput. Electron. Agric. 2022, 197, 106894. [Google Scholar] [CrossRef]
- Yilanci, V.; Kilci, E.N. The Feldstein-Horioka puzzle for the Next Eleven countries: A panel data analysis with Fourier functions. J. Int. Trade Econ. Dev. 2021, 3, 341–364. [Google Scholar] [CrossRef]
- Olayeni, R.O.; Tiwari, A.K.; Wohar, M.E. Fractional frequency flexible Fourier form (FFFFF) for panel cointegration test. Appl. Econ. Lett. 2021, 6, 482–486. [Google Scholar] [CrossRef]
- Zhang, X.; Lu, C.; Ning, Y.; Wang, J. Spatiotemporal Coupling Effect of Regional Economic Development and De-Carbonisation of Energy Use in China: Empirical Analysis Based on Panel and Spatial Durbin Models. Sustainability 2022, 14, 10104. [Google Scholar] [CrossRef]
- Cheng, Y.; Yao, X. Carbon intensity reduction assessment of renewable energy technology innovation in China: A panel data model with cross-section dependence and slope heterogeneity. Renew. Sustain. Energy Rev. 2021, 135, 110157. [Google Scholar] [CrossRef]
- Yang, G.; Yang, Y.; Gong, G.; Gui, Q. The Spatial Network Structure of Tourism Efficiency and Its Influencing Factors in China: A Social Network Analysis. Sustainability 2022, 14, 9921. [Google Scholar] [CrossRef]
- Chelladurai, P.; Kim, A.C.H. Human Resource Management in Sport and Recreation, 4th ed.; Human Kinetics: Windsor, ON, Canada, 2022; pp. 63–74. [Google Scholar]
- Ma, L.; Cheng, W.; Qi, J. Coordinated evaluation and development model of oasis urbanization from the perspective of new urbanization: A case study in Shandan County of Hexi Corridor, China. Sustain. Cities Soc. 2018, 39, 78–92. [Google Scholar] [CrossRef]
- Lim, S. The Impact of Attracting a Mega-Sport Facility on the Development of a Small Town: A Case Study on Taekwondowon in Muju, South Korea. Sustainability 2022, 14, 6694. [Google Scholar] [CrossRef]
- Giango, M.K.; Hintapan, R.; Suson, M.; Batican, I.; Quiño, L.; Capuyan, L.; Anoos, J.M.; Batoon, J.; Aro, J.L.; Maturan, F.; et al. Local Support on Sports Tourism Development: An Integration of Emotional Solidarity and Social Exchange Theory. Sustainability 2022, 14, 12898. [Google Scholar] [CrossRef]


| Coupling Coordination Level | Coupling Coordination Degree (D) | Level Classification |
|---|---|---|
| Coordination Development | 0.90–1.00 | Quality coordinated development |
| 0.80–0.89 | Good coordinated development | |
| 0.70–0.79 | Intermediate Coordinated Development | |
| 0.60–0.69 | Primary coordinated development | |
| Excessive Development | 0.50–0.59 | Barely coordinated development |
| 0.40–0.49 | On the verge of dysfunctional decline | |
| 0.30–0.39 | Mild dysregulation recession | |
| Dysfunctional Decline Development | 0.20–0.29 | Moderate dysregulation recession |
| 0.10–0.19 | Severe dysregulation recession | |
| 0.00–0.19 | Extremely dysfunctional recession |
| System Layer | Dimension Layer | Indicator Layer | Nature of Indicator | Weights |
|---|---|---|---|---|
| Sports facilities construction | Scale of sports facilities construction | The total area of sports facilities | + | 0.10 |
| The total area of sports facilities buildings | + | 0.10 | ||
| Number of sports facilities | + | 0.10 | ||
| Total investment in sports facilities | + | 0.10 | ||
| Financial investment in sports facilities | + | 0.10 | ||
| Social investment in sports facilities | + | 0.10 | ||
| Level of sports facilities construction | Number of sports facilities per 10,000 people | + | 0.10 | |
| Area of sports facilities per capita | + | 0.10 | ||
| Floor space of sports facilities per capita | + | 0.10 | ||
| Investment in sports facilities per capita | + | 0.10 | ||
| Social economy development | Economic scale | GDP | + | 0.05 |
| Total retail sales of social consumer goods | + | 0.05 | ||
| Local fiscal revenue | + | 0.06 | ||
| Local fiscal expenditure | + | 0.06 | ||
| Economic level | GDP per capita | + | 0.06 | |
| Retail sales of consumer goods per capita | + | 0.05 | ||
| Fiscal revenue per capita | + | 0.06 | ||
| Fiscal expenditure per capita | + | 0.06 | ||
| Population development | Resident population | + | 0.06 | |
| Urbanization level | + | 0.06 | ||
| Number of primary and secondary school students per 10,000 population | + | 0.06 | ||
| Living standards | Per capita disposable income of urban residents | + | 0.06 | |
| Per capita net income of rural residents | + | 0.06 | ||
| Urban registered unemployment rate | - | 0.06 | ||
| Ecological level | Forest coverage rate (%) | - | 0.06 | |
| Sulphur dioxide emissions | - | 0.05 | ||
| Nitrogen oxide emissions | + | 0.06 | ||
| Greening coverage of built-up areas | + | 0.06 |
| Variable Name | Variable Symbol | Variable Description | Data Sources | |
|---|---|---|---|---|
| Explained variable | Coupling coordination Degree | D | Calculated by coupling coordination model | Calculated by the author |
| Explanatory variables | Financial Expenditures | X1 | Sports Lottery Benefit Expenditure | Fujian Statistical Yearbook |
| Industrial Development | X2 | Tertiary industry output | Fujian Statistical Yearbook | |
| Level of urban development | X3 | Urbanization rate | Fujian Statistical Yearbook | |
| Environmental Development | X4 | Green space per capita | Fujian Statistical Yearbook |
| Variable | Fisher-ADF | Stationary |
|---|---|---|
| D | −3.227 ** | Stationary |
| X1 | −6.658 *** | Stationary |
| X2 | −0.191 | First-order stationary |
| −61.802 *** | ||
| X3 | 0.835 | First-order stationary |
| −2.832 * | ||
| X4 | −1.996 | Second-order stationary |
| −1.585 | ||
| −8.070 *** |
| Variables | POOL Model | FE Model | RE Model |
|---|---|---|---|
| Constant | 0.799 ** (9.313) | −0.231 (−1.867) | 0.743 ** (7.928) |
| X1 | −0.000 (−0.075) | 0.000 (1.142) | −0.000 (−0.007) |
| X2 | 0.000 (1.711) | 0.000 * (2.063) | 0.000 (1.764) |
| X3 | −0.000 (−0.037) | 0.015 ** (6.654) | 0.000 (0.127) |
| X4 | 0.008 * (2.033) | 0.012 * (2.658) | 0.011 * (2.523) |
| R2 | 0.166 | −12.344 | 0.150 |
| R2 (within) | 0.302 | 0.844 | 0.378 |
| N | 45 | 45 | 45 |
| T | F(4,40) = 1.984, p = 0.116 | F(4,32) = 43.217, p = 0.000 | X2 (4) = 11.207, p = 0.038 |
| Dependent variable: coordination degree (D) | |||
Disclaimer/Publisher’s Note: The statements, opinions and data contained in all publications are solely those of the individual author(s) and contributor(s) and not of MDPI and/or the editor(s). MDPI and/or the editor(s) disclaim responsibility for any injury to people or property resulting from any ideas, methods, instructions or products referred to in the content. |
© 2023 by the authors. Licensee MDPI, Basel, Switzerland. This article is an open access article distributed under the terms and conditions of the Creative Commons Attribution (CC BY) license (https://creativecommons.org/licenses/by/4.0/).
Share and Cite
Zheng, L.-H.; Zainal Abidin, N.E.; Mohd Nor, M.N.; Xu, Y.-Y.; Feng, X.-W. Sustainable Coupling Coordination and Influencing Factors of Sports Facilities Construction and Social Economy Development in China. Sustainability 2023, 15, 2832. https://doi.org/10.3390/su15032832
Zheng L-H, Zainal Abidin NE, Mohd Nor MN, Xu Y-Y, Feng X-W. Sustainable Coupling Coordination and Influencing Factors of Sports Facilities Construction and Social Economy Development in China. Sustainability. 2023; 15(3):2832. https://doi.org/10.3390/su15032832
Chicago/Turabian StyleZheng, Lin-Hong, Nor Eeza Zainal Abidin, Mohammad Nazri Mohd Nor, Yue-Yun Xu, and Xiao-Wei Feng. 2023. "Sustainable Coupling Coordination and Influencing Factors of Sports Facilities Construction and Social Economy Development in China" Sustainability 15, no. 3: 2832. https://doi.org/10.3390/su15032832
APA StyleZheng, L.-H., Zainal Abidin, N. E., Mohd Nor, M. N., Xu, Y.-Y., & Feng, X.-W. (2023). Sustainable Coupling Coordination and Influencing Factors of Sports Facilities Construction and Social Economy Development in China. Sustainability, 15(3), 2832. https://doi.org/10.3390/su15032832