Article

Response of Contrasting Nutrient Management Regimes on Soil Aggregation, Aggregate-Associated Carbon and Macronutrients in a 43-Year Long-Term Experiment

1
ICAR-Central Arid Zone Research Institute, Jodhpur 342003, India
2
ICAR-Indian Institute of Soil Science, Nabibagh, Berasia Road, Bhopal 462038, India
3
School of Life Science, Faculty of Science, University of Technology Sydney, Sydney, NSW 2007, Australia
4
ICAR-Central Institute of Agricultural Engineering, Nabibagh, Berasia Road, Bhopal 462038, India
5
ICAR-National Bureau of Soil Survey & Land Use Planning, Nagpur 440033, India
6
ICAR-Vivekanand Parvatiya Krishi Anusandhan Sansthan, Almora 263601, India
*
Authors to whom correspondence should be addressed.
Sustainability 2023, 15(3), 2679; https://doi.org/10.3390/su15032679
Submission received: 18 December 2022 / Revised: 22 January 2023 / Accepted: 28 January 2023 / Published: 2 February 2023

Abstract

:
The present investigation evaluated the effect of continuous application (>43 years) of organic and inorganic fertilisers on soil aggregate stability, aggregate size distribution, aggregate-associated carbon and its fractions, and total macro-nutrient content under the soybean–wheat cropping system in vertisols of the semi-arid region. Seven contrasting treatments consisted of T1 (50% NPK), T2 (100% NPK), T3 (150% NPK), T4 (100% NP), T5 (100% N), T6 (100% NPK + FYM) and T7 Control (crop raised without addition of any nutrient). The highest and lowest percentage of large macroaggregates (11.3%) was found in T6 and T7 treatments. The NPK + FYM (T6) treatments substantially increased the proportion of the macroaggregate fractions (>2 mm and 2–0.25 mm) than other treatments. However, different manure and fertilisation treatments did not affect the proportion of silt + clay aggregates. Long-term application of 100% NPK + FYM increased mean weight diameter (MWD) and stable water aggregates (WSA) by 35.7 and 6.01% over control. The aggregate-associated SOC followed the trend of large macroaggregates > microaggregates > small macroaggregates > silt + clay fractions. Application of long-term manure plus inorganic fertiliser (T6) has also increased Walkley Black soil organic carbon (WBSC), permanganate oxidisable carbon (KMnO4-C), soil microbial biomass carbon (SMBC), carbon mineralisation (CM), total soil carbon (TSC), total soil N (TSN), total soil phosphorus (TSP) and total soil potassium (STK) by 82.1, 71.6, 182, 42.4, 23.9, 41.6, 117 and 18.4%, respectively, over control (T7). The lowest metabolic quotient (MetQ) value of 5.13 mg CO2–C mg−1 MBC h−1 was obtained in the control treatment (T7). The lowest MetQ was recorded in the integrated application of manure + inorganic fertiliser, i.e., 100% NPK + FYM (T6). Similarly, microbial quotient (MiQ) was also higher in treatment T6 (100% NPK + FYM) and lower in T7 (control). It is concluded that the application of inorganic fertiliser alone is insufficient to maintain soil health and sustainability so, combined application of manure plus inorganic fertilisation is the most important nutrient management practice for long-term soil sustainability because it maintains SOC levels in soils for long periods and ultimately ensures the soil health of soybean–wheat cropping systems in the vertisols of semi-arid regions.

1. Introduction

The carbon within soil aggregates is protected through physical, chemical, or biological stabilisation and has a longer turnover time than unprotected forms [1,2]. In other words, sequestration in a particular agricultural system is controlled by the distribution of soil organic carbon (SOC) in soil aggregates, which directly affects environmental quality [3,4]. Recalcitrance, accessibility, and interactions between SOC and soil constituents all have an impact on the carbon dynamics in the aggregates [5]. The proportion of water-stable macroaggregates declines under methods that include considerable soil disturbance because of how land use impacts aggregation [6]. In addition to fertilisation, crop rotation, tillage intensity, and climate are significant factors that affect the accumulation or depletion of SOC in arable agriculture. To increase soil fertility and lessen erosion, soil aggregate formation is a key mechanism for carbon cycling, storage, and enrichment in soils [7]. Clay and organic matter form microscopic bridges between sand and silt particles to produce microaggregates [8]. Fungal hyphae, plant roots, and other stabilising agents join the soil microaggregates to form macroaggregates [9,10]. However, microaggregates appear to be less affected by such changes and as a result, they provide more protection for the carbon that has been deposited [11]. By linking clay, polycations, organic matter, and polycations with clay, organic matter stabilises aggregates of various sizes [12]. The soil organic carbon has a positive relationship with aggregate stability. To increase soil health and SOC sequestration, favourable soil aggregation is crucial [13,14].
In Central India, aggregates are formed due to the rearrangement of the soil constituent particles SOC, biota, ionic bridges, clay, carbonate content, and oxide content all contribute to its formation; however, not all soil constituents are involved in aggregation. A variety of organic matter types stabilise aggregates of various sizes, and organic matter encourages aggregation by linking clay, polycations, organic matter, and clay with polycations [12]. The soil organic carbon and aggregate stability have a considerable link that is favourably correlated [15]. To increase soil health, with a focus on the sequestration of soil organic carbon, favourable soil aggregation is essential. Indicators of soil structural stability include the stability of soil aggregates [16].
Vertisols are the dominant cultivated soil, covering about 70 million ha (Mha). Additionally, vertisols are found in Australia (70.5 Mha), Sudan (40 Mha), Chad (16.5 Mha), and Ethiopia (10 Mha). More than 80% of the 250 Mha of vertisols’ global area is found in these five nations [17]. In general, the vertisols of India have little organic matter and nutritional reserves. One of the main factors contributing to the low carbon and nutritional status of these soils is likely the rapid decomposition of organic matter brought on by the high temperatures in these areas [18]. However, the productivity and fertility of the vertisols have been declining over the last several decades due to extensive farming and long-term poor management practices, with unbalanced fertilisation being one of the major issues threatening the region’s sustainable agricultural development [19]. Recently, these regions have assumed particular interest to researchers concerning the percentage of global SOC stocks. Therefore, the availability of SOC and its dynamics in vertisols has been the subject of an investigation under the present context of climate change [20].
The aggregate dynamics are affected differently depending on the crops, crop rotations, and cover crops that are used. The volume, nature, and composition of the litter as well as plant root turnover, root exudates, and rhizodeposition are all factors that contribute to the contribution of organic matter that vegetation cover provides [21]. This organic matter can have an effect on soil aggregate stability. The biochemical composition of plant residues, such as phenols, lignin, proteins, carbohydrates, and alkaline extractable humic acids in the soil, as well as phenolic acids, such as vanillin-vanillic acid in the residue, is connected with soil aggregation [22]. Clays play an important role in the creation of aggregates, and as a result, the production of aggregates can reflect the effect of the parent material in the form of the formation of microaggregates. On the other hand, macroaggregate mostly reflects the effect that plants (organic matter) have on the development of aggregates [23]. As opposed to using aggregate stability as a physical indicator of soil quality, the term “soil structural indicator” is used significantly more frequently [24]. It is absolutely necessary to have a healthy soil structure as well as a greater level of structural stability in order to increase soil fertility, quality, productivity, and sustainability [11]. Celik et al. (2004) [25] discovered that after five years of application of 25 t ha−1 yr−1 of manure or compost incorporated inmouldboard ploughing resulted in 65% higher mean weighted diameter (MWD) of water-stable aggregates (WSA) than when there was no manure or compost application. This was compared to a control group that did not receive any manure or compost application.
The loss of soil structure brought on by prolonged intensive farming lowers soil quality and production [26,27]. Manure amendments enhance the amount of organic matter in the soil, which spurs the growth of microorganisms that produce polysaccharides that improve aggregate stability [28], as well as more binding agents and microbial activity. The state of soil moisture, nutrient dynamics, soil maintenance, and soil porosity are all positively impacted by stable soil aggregates [2]. The application of manure is frequently credited with enhancing the physical characteristics of soil, with advantages such as decreased runoff and erosion, and these effects can last for several years [29]. Labile fractions of SOC such as permanganate oxidisable carbon (KMnO4-C), soil microbial biomass carbon (SMBC), and carbon mineralisation (CM) are the crucial indicators of soil quality which showed a rapid response with changes in management practices [30]. The distribution of stable aggregates and their formation depends greatly on the number of nutrients in the soil. For subtropical nations such as India, knowledge of soil aggregate dynamics and related factors is, nevertheless, scarce. The purpose of this study was to determine the long-term effects of various nutrient management techniques on soil aggregation, aggregate-associated carbon, SOC fractions, and macronutrients. Consequently, the current study’s goals were to (i) assess the effects of long-term manuring and inorganic fertilisation on soil aggregation, (ii) observe the carbon accumulation in particle fractions in intensively managed 43-year-old long-term manuring trials in a vertisols of central India, and (iii) evaluate the SOC fractions and total macronutrient content in the soybean–wheat cropping system.

2. Material and Methods

2.1. Site Description, Field Treatments and Crop Management

The experimental plots under the Long-Term Fertiliser Experiment (LTFE) are located at 23.9° N latitude and 79.6° E longitudes with an altitude of 411.8 m above mean sea level at the research field of the Department of Soil Science and Agricultural Chemistry, JNKVV, Jabalpur (Figure 1). The climate represents semi-arid, sub-tropical conditions with dry, hot summer and cold winter. The mean annual rainfall is around 1350 mm, which is mainly distributed from mid-June to October. The maximum and minimum temperature ranges between 35.1 °C and 5.3 °C. The average annual relative humidity is 62–70%. The location experiences the lowest temperature ~5 °C during winter (December–January) and the highest temperature ~35 °C during summer (May–June).
The experiment was established in 1972 with a soybean-wheat-maize fodder cropping system and continued until 1994. Maize crop was discontinued after 1994; since then, soybean in kharif and wheat in the rabi seasons have been followed. The soil of the experimental field is medium black soil belonging to the Kheriseries of the fine montmorillonitic hyperthermic family of Typic Haplusterts. The soil sample was collected after the harvest of rabi crops in 2015. The initial soil characteristics of the experimental site were as follows: pH of the soil was 7.6, the electrical conductivity of 0.18 dS m−1, 5.7 g organic C kg−1, 193 kg available nitrogen ha−1, 7.60 kg available phosphorus ha−1, and 370 kg available potassium ha−1. The experimental design was randomised blocks, with seven treatments and four replicates. The gross plot size was 17 × 10.8 m with 1 m spacing between plots and 2 m spacing between the replications. The seven treatments selected for the present investigation were T1 (50% NPK), T2 (100% NPK), T3 (150% NPK), T4 (100% NP), T5 (100% N), T6 (100% NPK + FYM), and T7 (Control) (i.e., crop raised without the addition of nutrients).
All the plots were ploughed (∼15 cm deep) after each harvest in the kharif and rabi seasons. Inorganic N, P and K were applied through urea, single superphosphate (SSP) and the muriate of potash (MOP), respectively. The farm yard manure (FYM; 5 Mg ha−1 on a fresh weight basis) and inorganic fertiliser (NPK) were applied as per treatments and incorporated into the soil with a hand hoe after first ploughing during field preparation. Wheat (cultivars: GW 366) was sown in rows that were 20 cm apart and 5–6 cm deep during the second fortnight of November each year, and the wheat was harvested in April at ∼5 cm above the soil surface. Soybean seeds were sown in the second fortnight of June each year in rows that were 45 cm apart and had a depth of 3 to 4 cm. Soybeans were harvested manually at physiological maturity during mid-October and grain yield was reported at 12% moisture content.

2.2. Fractionation of Particle Size Aggregates

A 100 g dry weight sub-sample of soil was applied to a 2-mm sieve with a 20 cm diameter, submerged for 5 min in around 3 cm of water. Following immersion, samples were wet sieved by dipping sieves into water 50 times over the course of two minutes, starting with a 2-mm sieve and moving on to 0.250-mm and 0.053-mm sieves in turn. Each sieve’s residual material was rinsed individually into a 150 mL beaker and given 20 min to settle. Classes of water-stable aggregates were large (>2.0 mm), small macroaggregates (0.250–2.0 mm), micro-aggregates (0.053–0.250 mm), and silt + clay sized (<0.053 mm). The mean weight diameter was computed by multiplying the mean diameter of a particular size range of aggregate (Xi) with the weight of the aggregates in that size range as a fraction of the total dry weight of the sample analysed (Wi) in Equation (1):
Mean weight diameter (MWD) = ∑ Xi × Wi

2.3. Chemical and Biological Analysis of Soil

The Walkley and Black dichromate oxidation method was used to determine the SOC content in the bulk soil and the aggregate size fractions [31]. Furthermore, a technique described by Islam and Weil [32] was used to determine labile carbon or KMnO4-oxidizable carbon (2000). C-mineralisation is the term for the accumulation of CO2-C that developed over the course of the 49-day incubation period. The alkali trap approach was used to determine how CO2-C evolved [33]. In a nutshell, a vial holding 10 mL of 1 M NaOH was inserted into a flask that was suspended on a thread, and wax was used to seal the flasks (making them airtight). Following the addition of 1–2 mL of saturated BaCl2, the vials were removed at three, five, seven, fourteen, twenty-one, thirty-five, and fifty-day intervals from the day of incubation and titrated with standardised 0.5 M HCl using phenolphthalein as a visual indicator. The following formula was used in Equation (2) to determine how much CO2-C evolved:
C O 2 - C e v o l v e d m g / 100   g   s o i l = B - S × N × 22
where B and S represent the amounts of HCl used to titrate 10 mL of 1 M NaOH in the fertilised and control soils, respectively, and N represents the normality of HCl.
The chloroform fumigation-extraction method described by [34] Vance et al. was used to calculate the soil microbial biomass carbon (SMBC) (1987). Briefly, 10 mL of chloroform was used to fumigate the soil sample (CHCl3). Both types of samples (fumigated and non-fumigated) were extracted with a 0.5 M K2SO4 solution, and the microbial biomass carbon endpoint was determined by ferroin indicator titration against 0.005 N ferrous ammonium sulphate. Equation (3) was used to compute the amount of SMBC in the soil:
SMBC = (OCf − OCuf)/KEC
where KEC is the extraction efficiency, and OCf and OCuf are the amounts of carbon extracted from fumigated and non-fumigated samples, respectively (stated on a dry weight basis) (0.25).
Metabolic quotient (MetQ), which is calculated as the ratio of total CO2-C evolved per unit soil microbial biomass carbon (SMBC), and microbiological quotient (MiQ), which is the ratio of SMBC to soil organic carbon (SOC), are two examples of microbial indices [35]. The dry combustion method [36] was used to measure the total soil organic carbon (TSC) and total soil nitrogen (TSN) using the CHNS analyser. Using a spectrophotometer, the amount of total soil phosphorus (TSP) was calculated following the H2SO4–HCIO4–HF digestion method. In order to determine the total soil potassium, a flame photometer has been used (TSK).

2.4. Statistical Analysis

Variance analysis (ANOVA), i.e., One Way ANOVA was used to analyse the data and was evaluated using Duncan’s multiple range test. Further, the Multivariate correlation matrix (Pearson) was carried out between Walkley Black soil carbon (WBSC); Soil microbial biomass carbon (SMBC); Total soil carbon (TSC); Metabolic quotient (MetQ); Microbial quotient (MiQ); Total soil nitrogen (TSN); Total soil phosphorus (TSP); Total soil potassium (TSK); Mean weight diameter (MWD) and Water-stable aggregates (WSA) to show their degrees of association. Using the IBM SPSS statistical package 20, the treatment means were compared at a 5% level of significance (SPSS, Inc., Chicago, IL, USA).

3. Results

3.1. Effects of Long-Term Manure and Inorganic Fertiliser Application on Aggregates Distribution

Manure and inorganic fertiliser application significantly affected aggregate distribution in the soybean–wheat cropping system. The highest percentage of large macroaggregates (11.3%) was found under T6 (100% NPK + FYM) treatment. The lowest percentage of large macroaggregates (4.28%) was associated with T7 (control), which was at par with T4 (100% NP) (Figure 2). The differences between the treatment T2 (100% NPK) and T3 (150% NPK) were also nonsignificant. The distribution of small macroaggregates was found to be highest (78.2%), when 100% NPK + FYM (T6) was applied and lowest when T7 was applied (control). In comparison to soils that received only NPK, long-term application of 100% NPK + FYM significantly enhanced the proportion of the macroaggregate fractions (>2 mm and 2–0.25 mm), whereas control treatment (T7) recorded the highest micro-aggregates fraction (20.6%), followed by (T5) 100% N (18.02%). The lowest micro-aggregates were under T6 (100% NPK + FYM) treatment. The silt + clay fractions (<53 µm) were highest (4.03%) in T1 (50% NPK) and the lowest (2.88%) in T6 (100% NPK +FYM) treatment. The distribution of macroaggregates was more prominent than micro-aggregates and silt + clay fractions across the treatments. Among the macroaggregates fractions, the distribution of small macroaggregates was significantly greater than large macroaggregates across the treatments. Overall, T6 (100% NPK + FYM) had the highest percentage of macroaggregates (large + small), whereas T7 (control) had the lowest percentage of macroaggregates (large + small), which was considerably lower than all other treatments. Among the various soils aggregate size fractions, the proportional distribution of aggregates follows an order: small macroaggregates > micro-aggregates > large macroaggregates > silt + clay fractions.

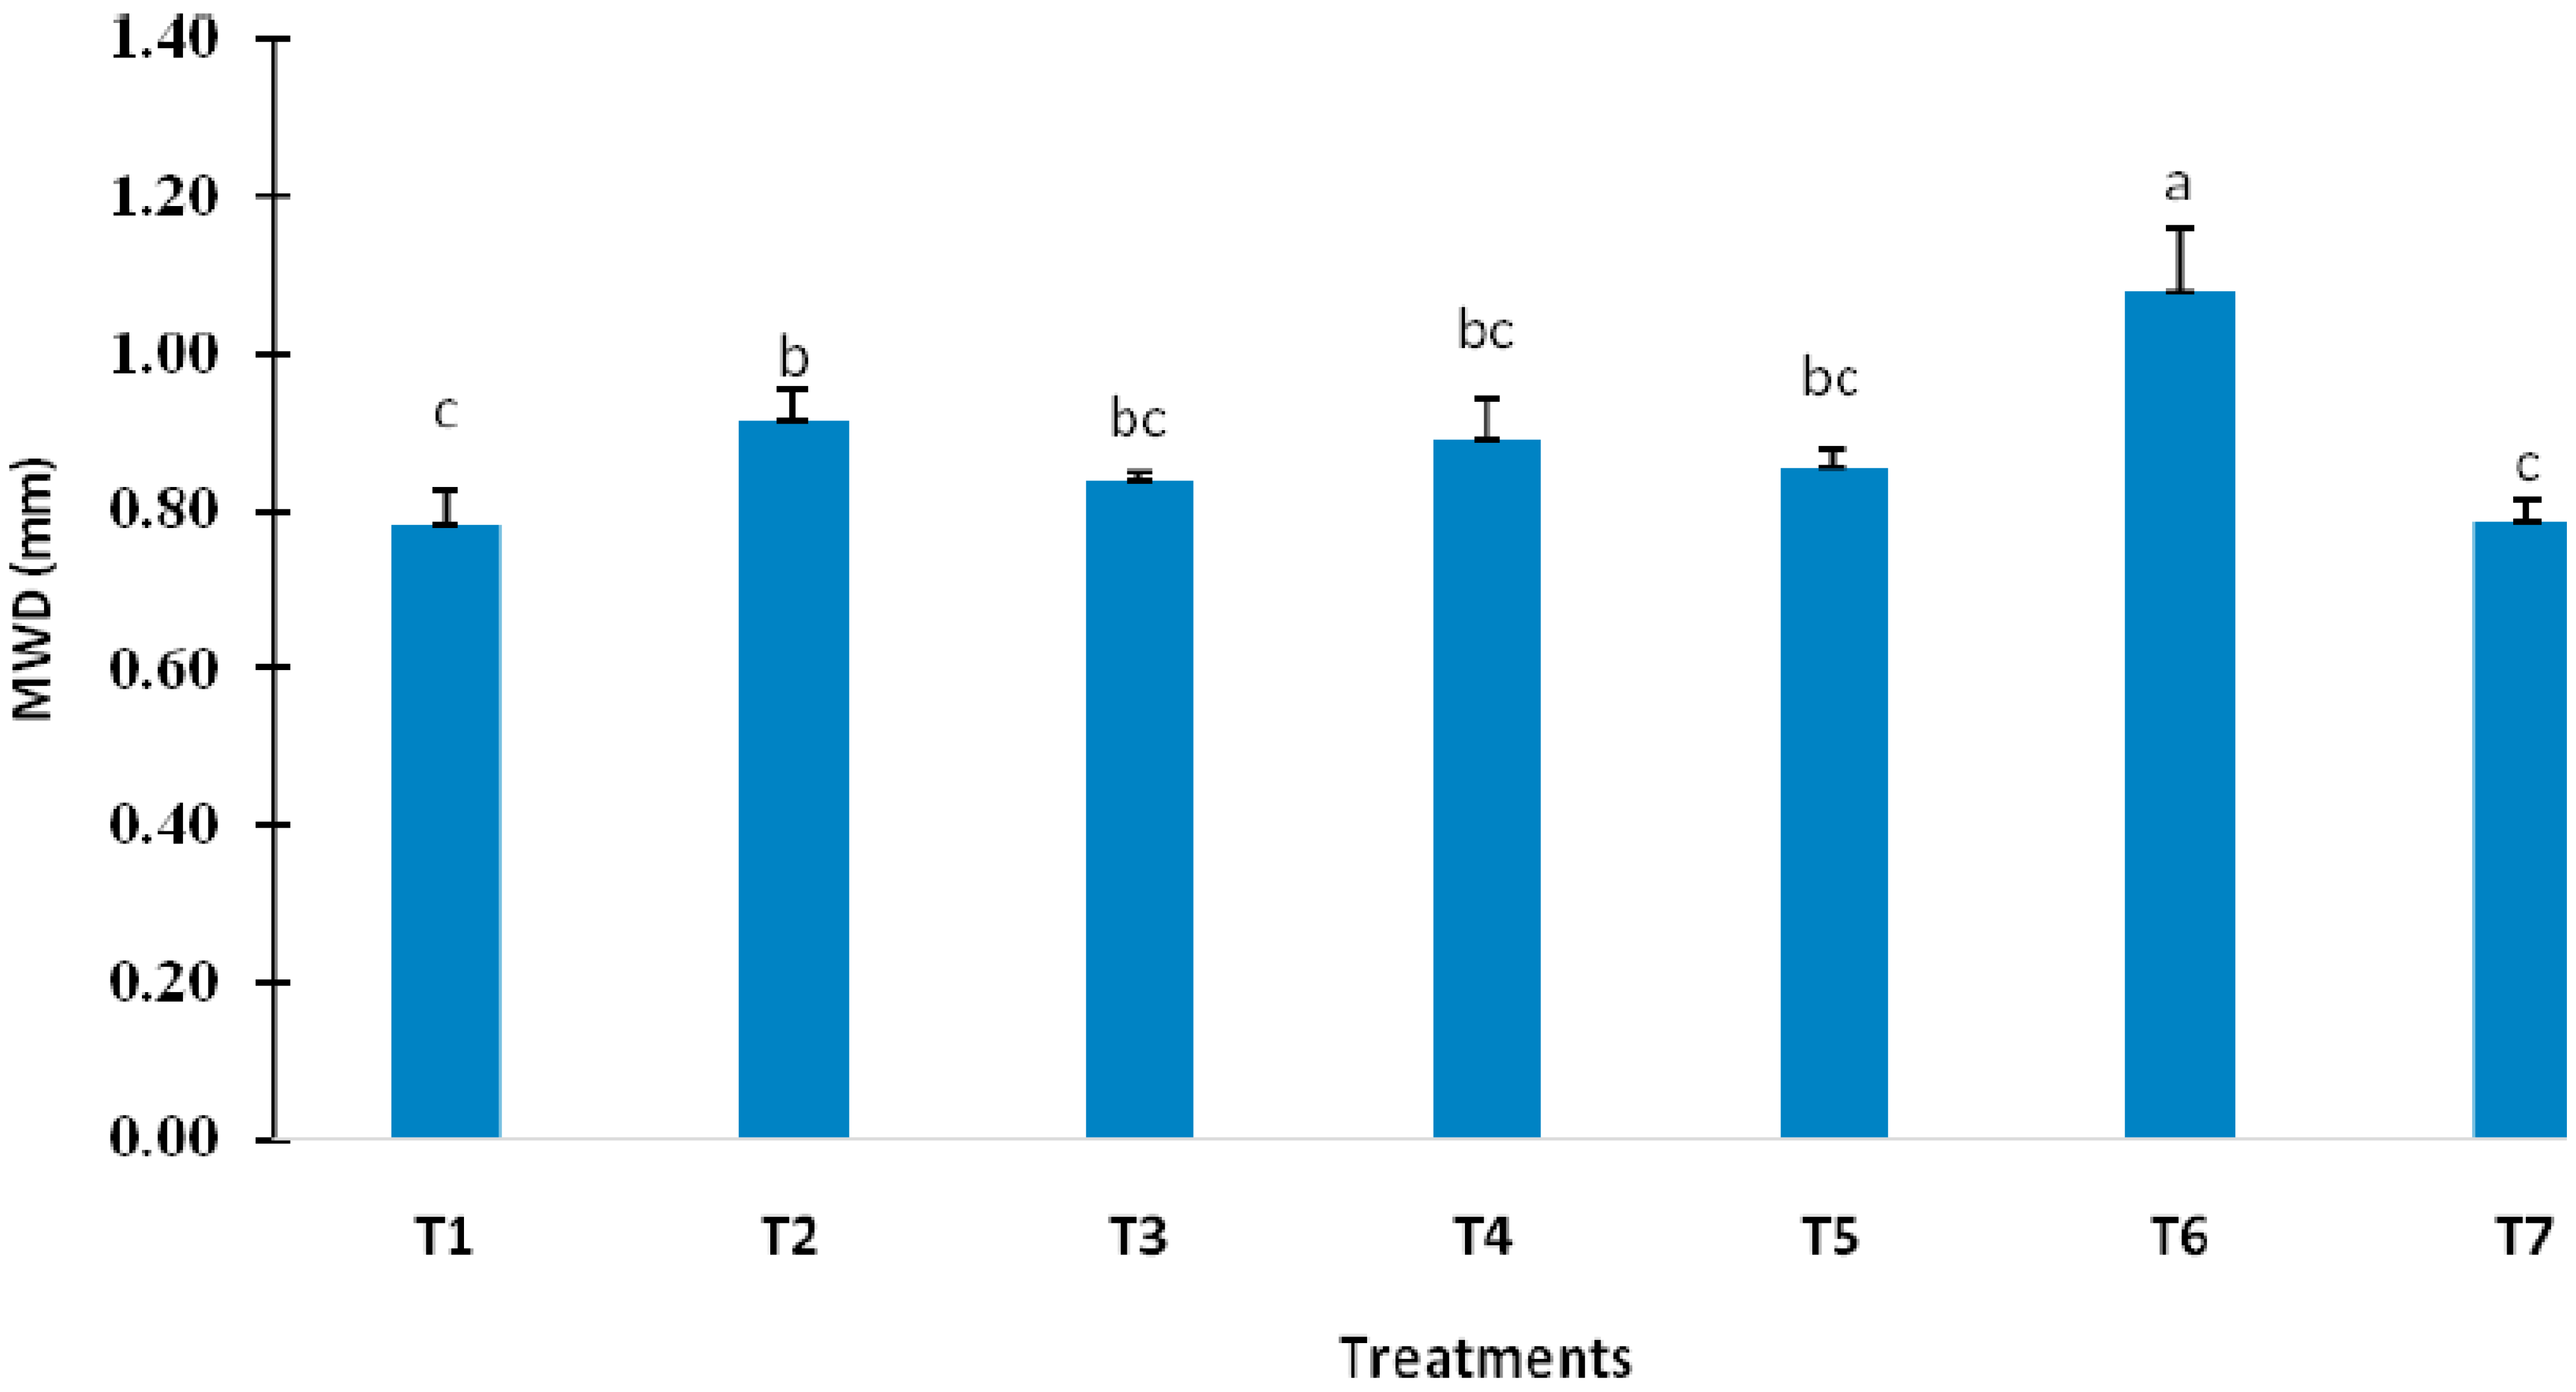
3.2. Effects of Long-Term Manure and Inorganic Fertilisers on Mean Weight Diameter (MWD) and Water-Stable Aggregates (WSA)

Application of 100% NPK + FYM (T6) significantly increased MWD by 35.7, 17.9 and 14.1% as compared to control (T7), 100% NPK (T2), and 100% NP (T4) treatment, respectively (Figure 3). The highest MWD (1.08 mm) was found in 100% NPK + FYM (T6), and the lowest MWD was recorded under control treatment (0.78 mm) (T7). A significant correlation between MWD and soil organic carbon concentration (WBSC) was recorded. Moreover, the increasing SWBC concentration resulted in a strong correlation (r= 0.85, p< 0.05) (Table 1). Long-term application of manure and inorganic fertiliser in vertisol has a considerable impact on water-stable aggregates compared to control. The highest aggregate stability was associated with the application of 100% NPK + FYM (T6), and the lowest was under control (T7) (Figure 4). A significant strong correlation was obtained between stable water aggregates (WSA) and mean weight diameter (MWD), with a coefficient of determination of 0.51 (p< 0.01) (Table 1).

3.3. Effects of Long-Term Manure and Inorganic Fertiliser on Aggregate-Associated-C

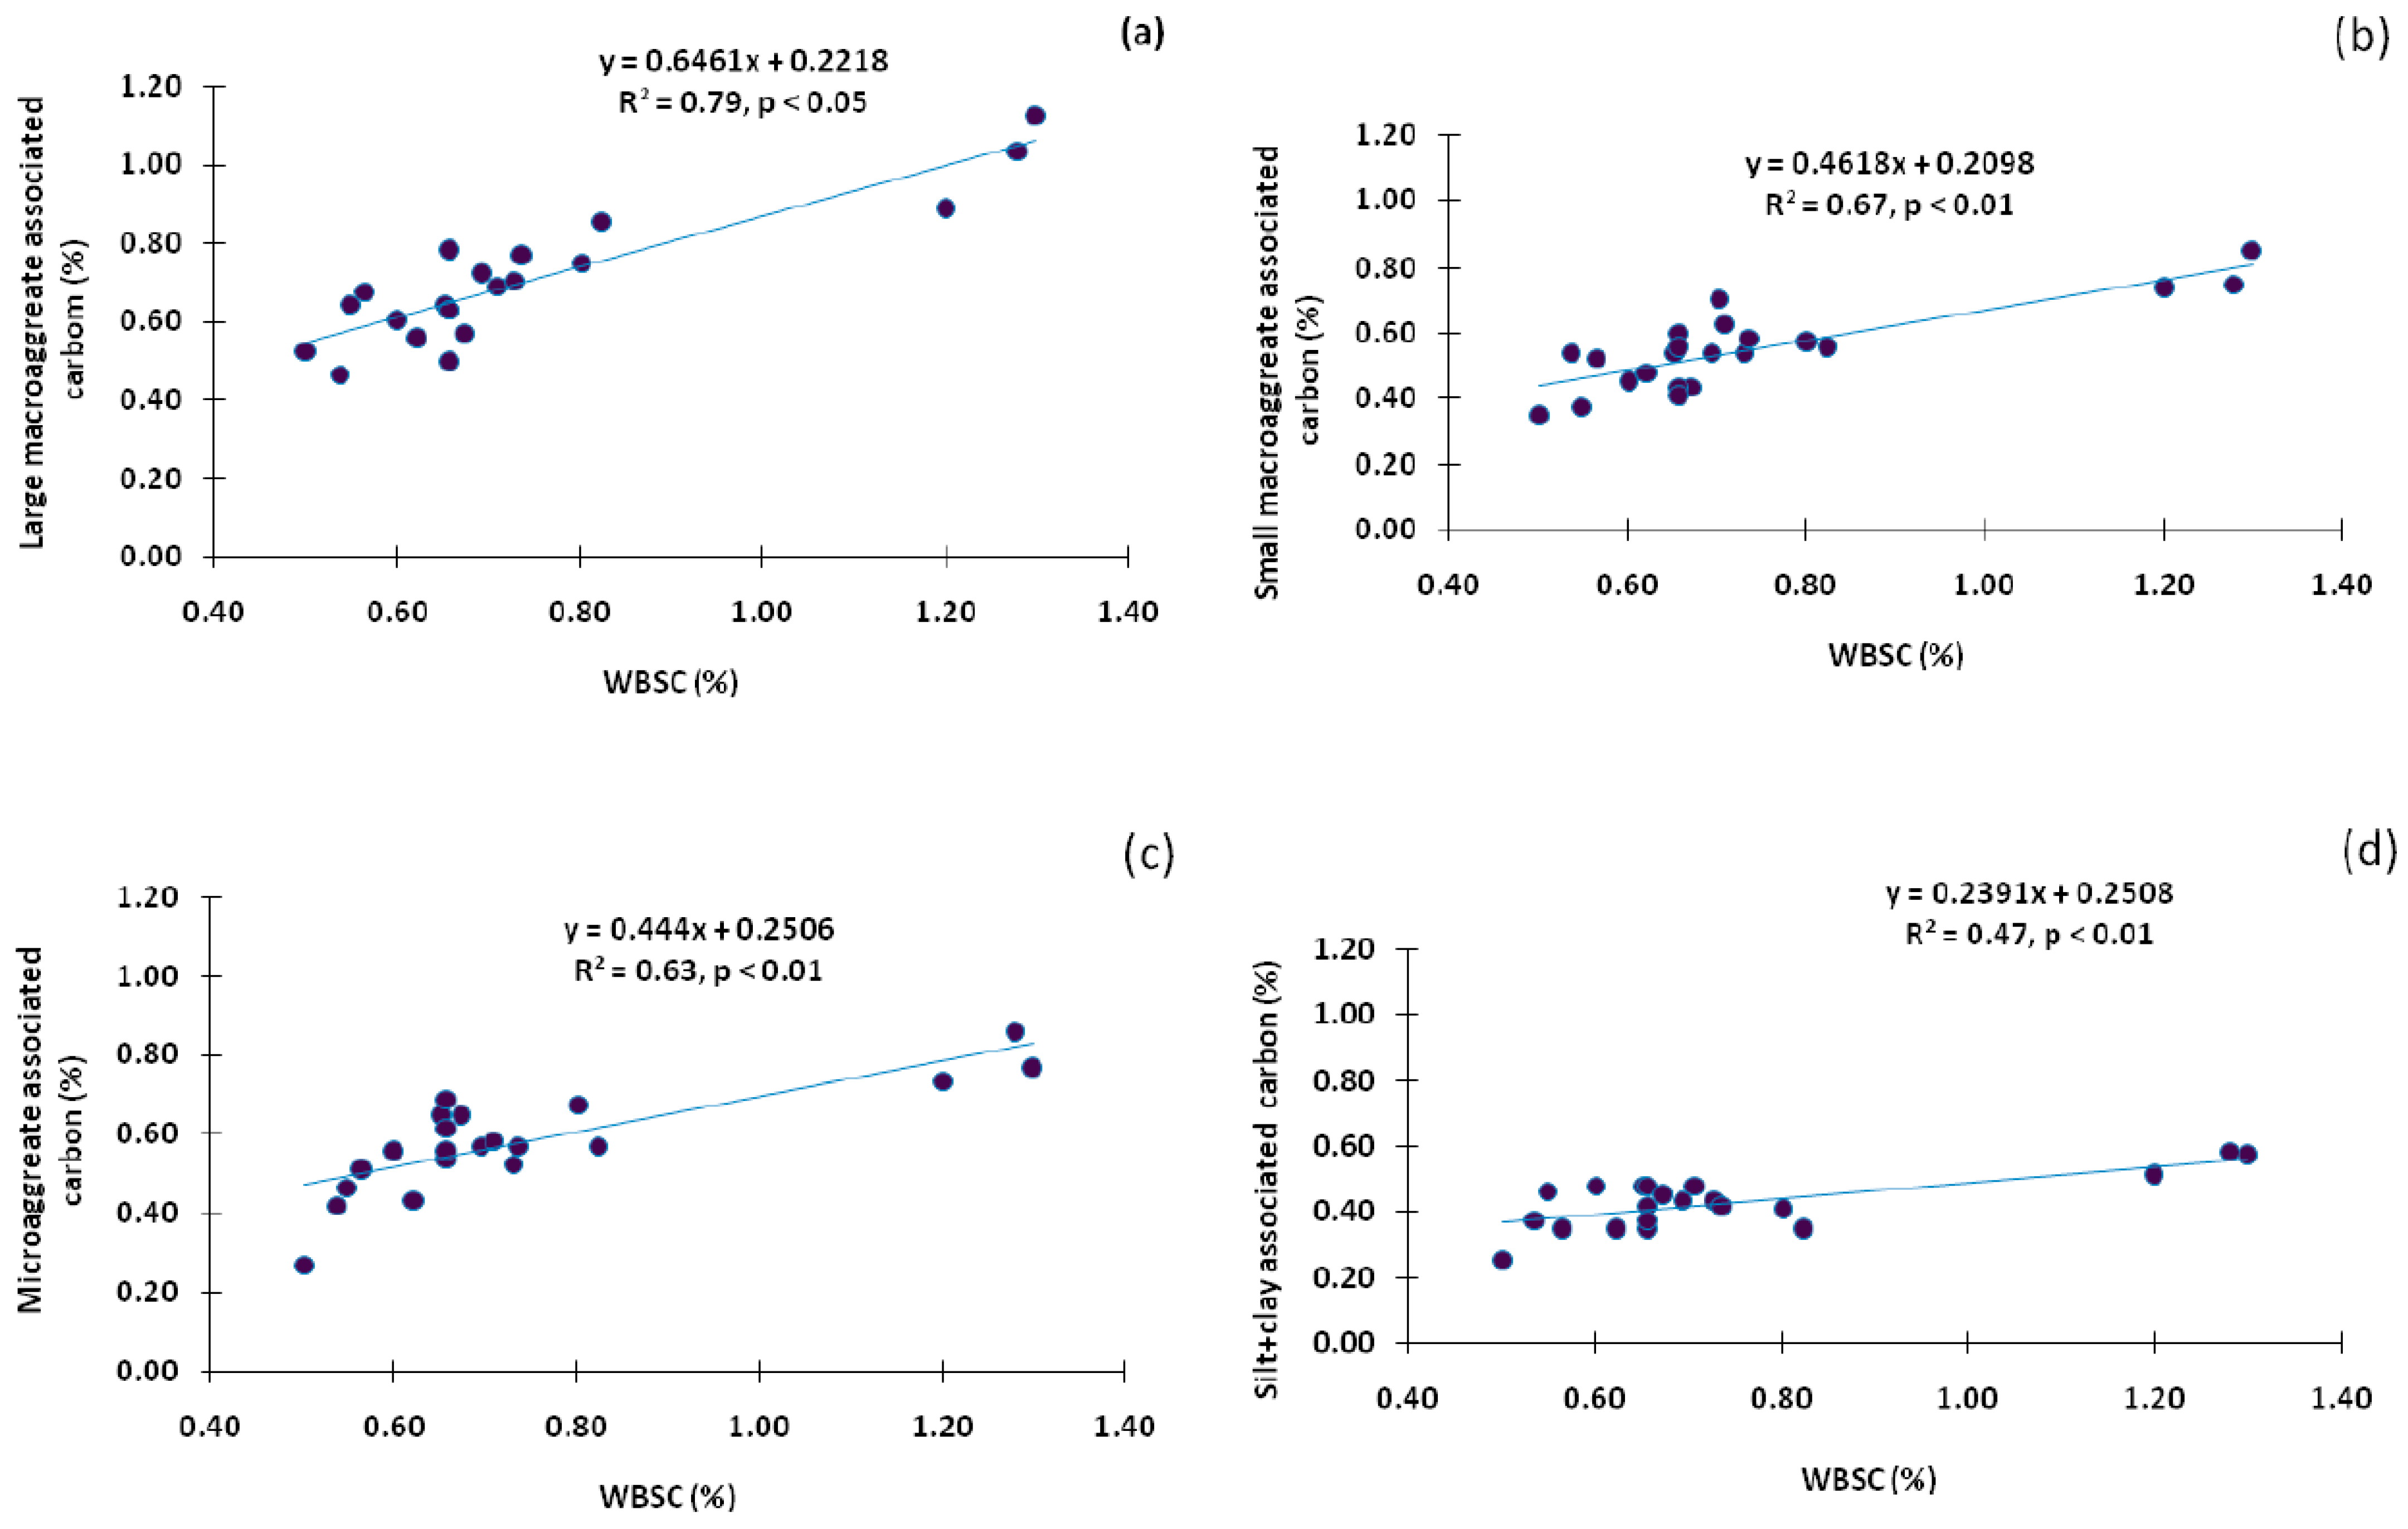
3.3.1. Large Macroaggregate-Associated Carbon

Different manure and inorganic fertiliser management practices significantly affected the aggregate-associatedC. The SOC in large macroaggregates ranged from 0.53 to 1.02% (Figure 5a) with the highest value (p <0.05; 1.02%) in T6 (100% NPK + FYM) followed by T3 (150% NPK) and the lowest SOC was recorded in T5 (0.53%). It indicates that FYM, along with chemical fertiliser, enhances soil organic carbon in large macroaggregates. The difference in large macroaggregates was insignificant in the treatments which did not receive FYM. It was found that an increased SOC concentration increased macroaggregate size. With a coefficient of determination of 0.79 (p <0.05), there was a strong correlation between the SOC concentration and the percentage of carbon associated with macroaggregates (Figure 6a).

3.3.2. Small Macroaggregate-Associated Carbon

Small macroaggregates associated carbon were found to be the highest in T6 (100% NPK + FYM), and the lowest was in T7 (control). There were no significant differences among different inorganic fertiliser treatments, i.e., T1, T2 and T3 treatments (Figure 5b). A significant correlation was recorded between small macroaggregates associated with carbon with the concentration of SOC with a coefficient of determination 0.67 (p< 0.01) (Figure 6b).

3.3.3. Microaggregate-Associated Carbon

Among different treatments, microaggregates associated soil carbon was reported significantly higher in 100% NPK + FYM (0.79%), followed by 100% NPK (T2) with SOC (0.67%), and the lowest was in control (0.39%) (Figure 5c). The other treatments did not show significant differences among each other. Further, microaggregates associated with carbon had a significant correlation with SOC (R2 = 0.63, p < 0.01) (Figure 6c).

3.3.4. Silt + Clay Fraction Associated Carbon

Imposition of the treatments significantly affected the relationship between soil organic carbon and mineral size fraction (Figure 5d). A positive correlation between the concentration of SOC and silt + clay-associated carbon was found with a coefficient of determination 0.47 (p < 0.01) (Figure 6d). In general, the size of the aggregates had a significant impact on the SOC. The aggregate-associated carbon content was found to be highest in macroaggregates, followed by microaggregates, and found to be at its lowest in silt +clay.

3.4. Effects of Long-Term Manure and Inorganic Fertiliser on Soil Carbon Fractions and Microbial Indices

3.4.1. Walkley and Black Bulk Soil Organic Carbon and Total Soil Carbon

Among the treatments, Walkley and Black soil organic carbon (WBSC) was found to be the highest under 100% NPK + FYM (T6), followed by the application of 150% NPK (T3) and the lowest under control (T7) (0.40%) (Table 1). The content of WBSC followed the descending order of T6 (1.02%) > T3 (0.75%) > T2 (0.71%) > T4 (0.67%) > T1 (0.64%) > T5 (0.62%) > T7 (0.56%). There were no significant differences among inorganic fertiliser treatments, i.e., T1, T2, T3, and T4 (Table 2).
The total soil carbon showed significant differences (p < 0.05) among the treatments. The use of fertilisers substantially (p <0.05) enhanced TSC by 12.0% in T2 (100% NPK), 13.3% in T3 (150% NPK), and 23.9% in T6 (100% NPK + FYM) plots compared to unfertilised control (T7) (Table 2). However, no significant changes were observed among T2, T3, T4and T5 treatments.

3.4.2. Permanganate Oxidisable Carbon

In soybean–wheat cropping system, the long-term use of manure and inorganic fertiliser caused considerable variations in permanganate oxidisable carbon (KMnO4-C) (Table 2). Results revealed that treatment receiving 100% NPK + FYM (T6) (757 mg kg−1) had the highest content of KMnO4-C, and the lowest KMnO4-C content was found in control (T7) (441 mg kg−1). However, treatment T6 was at par with inorganic fertiliser treatments, i.e., T1, T2, T3 and T4.

3.4.3. Soil Microbial Biomass Carbon

The treatment with 100% NPK + FYM (506 mg kg−1) had the highest soil microbial biomass carbon (SMBC), which was 43.7 and 57.1% higher than treatments with 150% NPK (T3) and 100% NPK (T2), respectively (Table 2). No difference was observed among treatments receiving imbalanced inorganic fertiliser or 50% of the recommended dose of fertiliser, i.e., T1, T4 and T5. The lowest SMBC content was obtained in the control plot. The SMBC and soil carbon had a significant and strong positive correlation (r = 0.96; p < 0.01) (Table 1).

3.4.4. Carbon Mineralisation

Cumulative CO2-C evolved varied significantly (p < 0.05) across the treatments from 0.92 to 1.31 mg CO2−C kg−1 hr−1 after 49 days of incubation (Figure 7; Table 2). The highest cumulative CO2-C evolved under 100% NPK + FYM (T6), and the lowest in control (no nutrient with the crop; T7). From 0 to 14 days of incubation, cumulative values of evolved CO2−C increased rapidly at first; after that, the increase slowed down for the rest of the incubation period. Compared to the control (T7) and 100% N treatments, the addition of 100% NPK + FYM (T6) reported increased cumulative C-mineralisation throughout the incubation period (T5). Lower C-mineralisation was observed with the imbalanced application of nitrogen fertiliser (N alone) compared to the balanced application (NPK). T1, T2 and T3 did not significantly differ from one another, while T1 was 50% NPK, T2 was 100% NPK, and T3 was 150% NPK. C-mineralisation and WBSC had a significant positive connection (R2 = 0.63 and p < 0.01) (Figure S1).

3.4.5. Metabolic Quotient

The control treatment (T7) had the highest metabolic quotient (MetQ), which was 5.13 mg CO2–C mg−1 MBC h−1, while the integrated application of manure + inorganic fertiliser had the lowest MetQ, 100% NPK + FYM (T6); however, MetQ value was at par with T2 (100% NPK) and T3 (150% NPK) treatments (Table 3). MetQ and WBSC were shown to be significantly inversely correlated (r = −0.90; p < 0.01) (Table 1).

3.4.6. Microbial Quotient

Microbial quotient (MiQ) significantly varied from 1.95 to 4.11% under different manure and inorganic fertiliser treatments (Table 3). The MiQ value was highest in treatment T6 (100% NPK + FYM) and lowest in treatment T7 (control). Treatments 150% NPK (T3) had a higher value of MiQ than 100% NPK (T2) fertiliser treatment. The remaining inorganic fertiliser treatments (T1, T4 and T5) were at par with the control (T7). The WBSC had a high correlation with MiQ (r = 0.93, p < 0.01) (Table 1).

3.5. Effects of Long-Term Manure and Inorganic Fertiliser on Total Macronutrients

After the harvest of wheat crops, total soil nitrogen (TSN), total soil phosphorus (TSP), and total soil potassium (TSK) were measured (Table 4). The TSN is significantly varied among the treatments, and the value of TSN was lowest (0.11%) in control (T7) and highest (0.17%) in 100% NPK + FYM treatment (T6). The TSN significantly correlated positively with WBSC (r = 0.66, p < 0.05) (Table 1). Further, it is reported that applying organic manure + inorganic fertiliser (100% NPK + FYM) together significantly enhanced TSP more than inorganic fertiliser alone. The highest TSP (0.37%) was recorded in theT6 treatment, followed by T3 and T4 treatments, and the lowest TSP was in T7 (control). A significant and positive correlation was obtained between TSP and WBSC with a Pearson correlation; r = 80 (p < 0.05) (Table 1). Similarly, the highest TSK content was observed in 150% NPK (T3) treatment, while the lowest value was in 100% N (T5). However, T3 treatment was at par with T6, T2 and T1. A significant correlation was observed between the TSK and WBSC (r = 0.70, p < 0.05) (Table 1).

3.6. Correlation among Soil Carbon, Nutrients, Biological and Physical Properties of Soil

The Pearson correlation analysis for soil carbon, aggregate stability, nutrient content, and soil biological health revealed a significant positive correlation of WBSC with KMnO4-C (r = 0.70), SMBC (r = 0.96), TSC (r = 0.95), MiQ (r = 0.93), TSN (r = 0.66), TSP (r = 0.80), TSK (r = 0.70) and MWD (r = 0.90); while the negative correlation was recordedwith Met Q (r = −0.90). KMnO4-C was positively correlated with SMBC, TSC, MiQ, TSP, TSK, MWD, and WSA (Table 4), while MetQ was negatively correlated with WBSC, SMBC, TSC, MiQ, TSP, TSK, MWD, and WSA. TSN had a significant positive correlation with WBSC (r = 0.66) and TSC (r = 0.76), and TSP had a positive correlation with WBSC (r = 0.80), TSC (r = 0.85), KMnO4-C (r = 0.82), SMBC (r = 0.85), MiQ (r = 0.88). TSK showed a significant positive correlation with all the soil parameters studied except MetQ (r = −0.88) (Table 1). The MWD was positively correlated with WBSC (r =0.99), SMBC (r = 0.85), TSC (r = 0.92), MiQ (r = 0.79), TSN (r = 0.78), TSP (r = 0.73) and WSA (r = 0.61) while the negative correlation recorded with MetQ (r = −0.78). WSA had a positive correlation with KMnO4-C (r = 0.70), TSP (r = 0.64), and MWD (r = 0.61) (Table 1).

4. Discussion

4.1. Aggregation and Associated Indices

Both biotic and abiotic variables affect the aggregation of soil [9,37]. Significant long-term input of organic and inorganic fertiliser compared to the control treatment increased the proportion of large macroaggregates at the expense of microaggregates and the silt + clay fraction(T7) [4,38] (Figure 2). It is suggested that microaggregates were bonded into macroaggregates in integrated nutrient management (100% NPK + FYM) treatment. Application of 100% NPK + FYM (T6) had the highest oxidisable organic carbon (WBSC), as shown in Table 2 (1.02% vs. 0.57% for T6 vs. T7). It contributed toward the highest >2 mm and 2–0.25 mm aggregate distribution proportion. Organic manure increases macroaggregates stability by producing organic acid and polysaccharides, cementing soil mineral particles. An increased SOC on adding manure also resulted in slaking-resistant macroaggregates [39]. According to the principle of aggregate hierarchy, macroaggregates produced by microaggregates are stuck together by comparatively biodegradable compounds [40,41]. Additionally assisting in the formation of microaggregates include root exudates, fungus hyphae or polysaccharides, and other by-products of the decomposition of organic matter [42]. The results support the findings of [2,43] Ghosh et al. (2019), which found that larger aggregates increased and smaller aggregates decreased as a result of manure application, likely as a result of increased micro-aggregate consolidation into macroaggregates. As a result, macroaggregates play a dominant role in carbon sequestration [44] and soil structural stability [45].
Crop productivity is directly correlated with soil structure, which is determined by mean weight diameter (MWD). Due to the prolonged application of manure and inorganic fertilisers (100% NPK + FYM), the MWD increased by 38.4% in comparison to the control (Figure 3). Higher aggregate stability is demonstrated by higher MWD. According to Shiran et al. (2002) [46], a significant rise in MWD was observed in FYM received treatment. This was mostly related to the use of manure and inorganic fertilisers, which increased the percentage of soil macroaggregates and increased MWD and aggregate stability. The significant correlation between SOC and MWD (Table 1) suggests that the annual contribution of microbial secretions and root exudates is essential for aggregation [47,48]. According to Somasundaram et al. (2018) [14], the amount of SOM is what determines how stable an aggregate is in water, and SOC is directly related to aggregate sizes. The major binding force in the formation of aggregates is likely SOC [49]. Long-term application of FYM can significantly improve soil structure, MWD, and aggregate stability [50]. Yet the opposite outcome was also noted by [37] Xie et al. (2015) and [51] Guo et al. (2018), who demonstrated a drop in MWD and subsequently lower aggregate stability over control with the application of organic manure for more than 3-decades.

4.2. Aggregate-Associated Carbon

Aggregation is a process of conserving and preserving soil organic carbon and performing as a storehouse of plant nutrients and energy [1]. The long-term application of manure and inorganic fertilisation (T6) increased SOC content in all size fractions than other treatments, suggesting that manure-derived C is more protected and accumulated in such fractions than the rest of the treatments. Worldwide, researchers have reported similar findings in various cropping systems [2,21]. The continuous application of inorganic fertilisation (NPK) significantly (p < 0.05) enhanced aggregates associated SOC in all fractions over control except silt + clay fractions. It is attributed to higher yield, and biomass returns to the soil that led to higher microbial activity and root exudates, which reasonably conserve and sequester SOC pool compared to imbalanced fertilisation and controls [2,52]. Regardless of the type of fertilisation used, the largest macroaggregates had the highest aggregated associated SOC, and the silt + clay fraction had the lowest. Through their effects on the formation of macroaggregates, the analysis revealed that manure treatment alone or in conjunction with inorganic fertiliser improved SOC. An earlier study’s findings that long-term fertilisation increased SOC and the development of macroaggregates [51,53] support this conclusion.

4.3. Soil Carbon Fractions and Microbial Indices

Soil carbon fractions, e.g., WBSC, KMnO4-C, SMBC, C-mineralisation, and TSC, were higher in manure and inorganic fertiliser treatment over control (Table 2). The additional high carbon input added through aboveground residues and manure, which led to higher organic matter accumulation compared to the other treatments, is primarily responsible for the high WBSC and TSC content due to the long-term addition of manure plus inorganic fertilisation as compared to inorganic fertilisation [54]. Manjaiah and Singh (2001) [55] stated that 100% NPK + FYM and 100% NPK treatments annually added 8190 and 2780 kg ha−1 carbon, respectively, in the maize-wheat-cowpea cropping sequence. The TSC enhancement under long-term fertilisation is explicitly documented [51,56,57].
SMBC is considered a significant early predictor of change or degradation of soil quality [49]. It is a relatively labile fraction of SOM and accounts for 2% to 3% of the soil’s overall organic carbon [58]. In comparison to the control and inorganic fertiliser treatments, the combined application of manure and inorganic fertiliser raised SMBC considerably (p < 0.05) (Table 2). It is due to stimulating soil microorganisms through inputs containing high organic matter such as FYM. Fresh carbon derived from manure, which serves as the main food source for the microbial population, is primarily responsible for the increase in SMBC [49]. Therefore, SMBC is closely associated with SOC, which is in line with the finding of [59]. Permanganate oxidisable carbon (KMnO4-C) is another important fraction of SOC, which gives a quick indicator of whether the soil is degrading or improving in response to management practices [60]. The KMnO4-C constituted a comparatively larger pool of SOC after WBSC, which was about 4.82–7.32% of TSC. It was increased by 71.8% due to the long-term addition of manure plus inorganic fertilisers than control [61]. Benbi et al. (2015) [62] reported an increase in KMnO4-C by 26.0% after 8-year continuous addition of manure (10 t ha−1) compared with no fertilisation. The amount of organic matter in the soil is indicated by the soil’s mineralisation of carbon, which is also a sign of microbial activity. The higher microbial population and biomass in the soil promote biological activity, which is positively correlated with the annual addition of fresh C sources [49]. The carbon mineralisation changes indicate the variable quantities of readily available carbon accumulated in various fertiliser treatments [63]. Applying only mineral fertiliser or imbalanced fertiliser contributes to lower carbon mineralisation than manure plus inorganic fertiliser treatment. The highest carbon mineralisation was recorded in T6 (100% NPK + FYM) treatment, mainly attributed to newly added manure providing a source of carbon and other nutrients for microbial proliferation, leading to higher carbon mineralisation [64,65]. Kaur et al. (2019) [57] reported that the combined addition of chemical fertilisers and FYM (100% NPK + FYM) resulted in 34.2% higher carbon mineralisation as compared to the control (142.9 mg CO2-C kg−1). The CO2–C evolution per unit soil microbial biomass carbon (SBMC)—known as the metabolic quotient (MetQ)—is a metric for evaluating the eco-physiological state of soil microorganisms. Lower MetQ value under T2 (100% NPK) and T3 (150% NPK) than T1 (50% NPK), T4 (100% NP), T5 (100% N), and T7 (control) is due to an imbalance application of nitrogenous fertiliser that has a negative impact on the microorganism, therefore decreasing microbial activities, growth of soil microbes and microbial respiration. A negative correlation (r = −90; p ≤ 0.05) between MetQ and SOC, indicating higher microbial biomass with a lower value of MetQ(Table 1). The lowest MetQ associated with the integrated application of 100% NPK + FYM compared to inorganic treatments concurred with earlier findings [49,66,67]. Microbial quotient (MiQ) assessment is important for microbial quality and dynamics [67]. The highest value of MiQ reported under the application of 100% NPK + FYM plot could be due to higher microbial activity induced by continuously adding fresh organic manure in the soil [49,65].

4.4. Total Nutrient Content

The increase in TSN content under integrated and balanced fertilisation is related to the long-term addition of manure and chemical fertilisers and the higher return of crop residue into the soil [68,69]. A significant increase in TSP content in soil was attributed to the long-term addition of P through manure and fertilisers, which often enhances P sorption in soil and decreases availability to plants due to the association of sesquioxides. However, total nutrient content was slightly increased in imbalanced NPK treatments and control. It seems slightly higher TSK may be ascribed to adding K through fertiliser and manure; however, it remains entrapped within the clay structure. Imbalance use of fertilisers may also impede the availability of other nutrients, resulting in the accumulation of unutilised nutrients in the soil.

4.5. Relation among Different Soil Carbon Pools, Nutrients, MWD, WSA and Soil Biological Properties

A stronger correlation between C and N indicates that SOC significantly contributes to TSN content. Higher SOC concentration promotes the development of stable soil aggregates. In turn, stable soil aggregates prevent aggregate breakdown and make the soil less erodible. Therefore, a higher SOC is a prerequisite for greater aggregate stability. The MBC had a strong linear relationship with the KMnO4-C pools. Increased sensitivity of C fractions with varied oxidizability and MBC was found to be directly associated with net primary production via diverse soil management approaches [70]. Several other investigations have found a highly significant linear association between TOC, HWC, KMnO4-C and soil enzymes under diverse cropping systems [71,72]. A positive correlation between SOC and phosphorus indicates its availability rises with the addition of organic carbon owing to the chelation of polyvalent cations by organic acids and other degradation products. The addition of organic amendments primarily enhances the organic portions of P [73]. The positive correlation of TSK with soil carbon may be due to the supplementation of potassium by adding organic amendments containing humus material that contains a significant proportion of potassium. Studies also linked higher soil biological activity to increased potassium availability [74] due to solubilisation and the release of clay mineral-bound potassium in the soil. Thus, applying organic amendments to the soil is one of the ways to increase potassium availability by promoting biological activity.

5. Conclusions

Forty-three years of continuously balanced fertilisation significantly improved percentage aggregate distribution and soil aggregate stability (MWD) in the soybean–wheat cropping system. The increase in aggregate stability was attributed to the increase in the proportion of macroaggregate (>2 mm). The size of the aggregates had a major impact on the SOC associated with them. Macroaggregates had the highest aggregate-associated carbon levels, followed by microaggregates, while silt + clay had the lowest levels. In comparison to the control, the combined application of 100% NPK + FYM improved the overall nutrient content, carbon mineralisation, soil microbial biomass carbon (SMBC), permanganate oxidisablecarbon (KMnO4-C), and Walkley and Black soil organic carbon (WBSC). The findings of this long-term manure and inorganic fertiliser application experiment shows that in traditional management situations when no aboveground crop residues are returned to the soil, the application of inorganic fertiliser alone is insufficient to maintain levels of SOC and nutrients. Our study has significant application to vertisols, where soil degradation is ongoing due to massive imbalanced fertiliser application. It may be necessary to do additional studies to re-evaluate the viability of applying manure along with inorganic fertiliser in sustainable crop production.

Supplementary Materials

The following supporting information can be downloaded at: https://www.mdpi.com/article/10.3390/su15032679/s1.

Author Contributions

Conceptualization, M.C. and R.M.; methodology, M.C., N.K.S., M.M., R.S.C. and K.M.H.; software, N.K.S.; validation, M.C., S.J., N.K. (Nikul Kumari) and D.K.; formal analysis, J.K.T., J.K., R.H.W., K.M.H. and A.P.; investigation, M.M., B.J. and J.K.B.; resources, S.J., B.J., A.S. and N.K. (Nirmal Kumar); data curation, N.K. (Nikul Kumari) and P.J.; writing—review & editing, A.S. All authors have read and agreed to the published version of the manuscript.

Funding

This research received no external funding.

Institutional Review Board Statement

Not applicable.

Informed Consent Statement

Not applicable.

Data Availability Statement

Not applicable.

Conflicts of Interest

The authors declare no conflict of interest.

References

  1. Bandyopadhyay, P.K.; Saha, S.; Mani, P.K.; Mandal, B. Effect of Organic Inputs on Aggregate Associated Organic Carbon Concentration under Long-Term Rice–Wheat Cropping System. Geoderma 2010, 154, 379–386. [Google Scholar] [CrossRef]
  2. Ghosh, A.; Bhattacharyya, R.; Agarwal, B.K.; Mahapatra, P.; Shahi, D.K.; Singh, G.; Agnihorti, R.; Sawlani, R.; Sharma, C. Long-Term Fertilization Effects on 13C Natural Abundance, Soil Aggregation, and Deep Soil Organic Carbon Sequestration in an Alfisol. Land Degrad. Dev. 2019, 30, 391–405. [Google Scholar] [CrossRef]
  3. Du, Z.; Han, X.; Wang, Y.; Gu, R.; Li, Y.; Wang, D.; Yun, A.; Guo, L. Changes in Soil Organic Carbon Concentration, Chemical Composition, and Aggregate Stability as Influenced by Tillage Systems in the Semi-Arid and Semi-Humid Area of North China. Can. J. Soil. Sci. 2018, 98, 91–102. [Google Scholar] [CrossRef]
  4. Yu, H.; Ding, W.; Luo, J.; Geng, R.; Cai, Z. Long-Term Application of Organic Manure and Mineral Fertilizers on Aggregation and Aggregate-Associated Carbon in a Sandy Loam Soil. Soil Tillage Res. 2012, 124, 170–177. [Google Scholar] [CrossRef]
  5. Qaswar, M.; Li, D.; Huang, J.; Han, T.; Ahmed, W.; Ali, S.; Khan, M.N.; Khan, Z.H.; Xu, Y.; Li, Q.; et al. Dynamics of Organic Carbon and Nitrogen in Deep Soil Profile and Crop Yields under Long-Term Fertilization in Wheat-Maize Cropping System. J. Integr. Agric. 2022, 21, 826–839. [Google Scholar] [CrossRef]
  6. Meena, V.S.; Mondal, T.; Pandey, B.M.; Mukherjee, A.; Yadav, R.P.; Choudhary, M.; Singh, S.; Bisht, J.K.; Pattanayak, A. Land Use Changes: Strategies to Improve Soil Carbon and Nitrogen Storage Pattern in the Mid-Himalaya Ecosystem, India. Geoderma 2018, 321, 69–78. [Google Scholar] [CrossRef]
  7. Tanner, S.; Ben-Hur, M.; Argaman, E.; Katra, I. The Effects of Soil Properties and Aggregation on Sensitivity to Erosion by Water and Wind in Two Mediterranean Soils. Catena 2023, 221, 106787. [Google Scholar] [CrossRef]
  8. Schweizer, S.A.; Bucka, F.B.; Graf-Rosenfellner, M.; Kögel-Knabner, I. Soil Microaggregate Size Composition and Organic Matter Distribution as Affected by Clay Content. Geoderma 2019, 355, 113901. [Google Scholar] [CrossRef]
  9. Six, J.; Bossuyt, H.; Degryze, S.; Denef, K. A History of Research on the Link between (Micro)Aggregates, Soil Biota, and Soil Organic Matter Dynamics. Soil Tillage Res. 2004, 79, 7–31. [Google Scholar] [CrossRef]
  10. Bossuyt, H.; Denef, K.; Six, J.; Frey, S.D.; Merckx, R.; Paustian, K. Influence of Microbial Populations and Residue Quality on Aggregate Stability. Appl. Soil Ecol. 2001, 16, 195–208. [Google Scholar] [CrossRef]
  11. Zhang, S.; Wang, R.; Yang, X.; Sun, B.; Li, Q. Soil Aggregation and Aggregating Agents as Affected by Long Term Contrasting Management of an Anthrosol. Sci.Rep. 2016, 6, 39107. [Google Scholar] [CrossRef] [PubMed]
  12. Xue, B.; Huang, L.; Li, X.; Lu, J.; Gao, R.; Kamran, M.; Fahad, S. Effect of Clay Mineralogy and Soil Organic Carbon in Aggregates under Straw Incorporation. Agronomy 2022, 12, 534. [Google Scholar] [CrossRef]
  13. Hati, K.M.; Chaudhary, R.S.; Mandal, K.G.; Bandyopadhyay, K.K.; Singh, R.K.; Sinha, N.K.; Mohanty, M.; Somasundaram, J.; Saha, R. Effects of Tillage, Residue and Fertilizer Nitrogen on Crop Yields, and Soil Physical Properties Under Soybean–Wheat Rotation in Vertisols of Central India. Agric. Res. 2015, 4, 48–56. [Google Scholar] [CrossRef]
  14. Somasundaram, J.; Chaudhary, R.S.; AwanishKumar, D.; Biswas, A.K.; Sinha, N.K.; Mohanty, M.; Hati, K.M.; Jha, P.; Sankar, M.; Patra, A.K.; et al. Effect of Contrasting Tillage and Cropping Systems on Soil Aggregation, Carbon Pools and Aggregate-Associated Carbon in Rainfed Vertisols. Eur. J. Soil Sci. 2018, 69, 879–891. [Google Scholar] [CrossRef]
  15. Somasundaram, J.; Salikram, M.; Sinha, N.K.; Mohanty, M.; Chaudhary, R.S.; Dalal, R.C.; Mitra, N.G.; Blaise, D.; Coumar, M.V.; Hati, K.M.; et al. Corrigendum to: Conservation Agriculture Effects on Soil Properties and Crop Productivity in a Semiarid Region of India. Soil Res. 2019, 57, 200. [Google Scholar] [CrossRef]
  16. Six, J.; Elliott, E.T.; Paustian, K. Soil Macroaggregate Turnover and Microaggregate Formation: A Mechanism for C Sequestration under No-Tillage Agriculture. Soil Biol. Biochem. 2000, 32, 2099–2103. [Google Scholar] [CrossRef]
  17. Painuli, D.K.; Mohanty, M.; Sinha, N.K.; Misra, A.K. Crack Formation in a Swell–Shrink Soil Under Various Managements. Agric. Res. 2017, 6, 66–72. [Google Scholar] [CrossRef]
  18. Garten, C.T., Jr.; Iversen, C.M.; Norby, R.J. Litterfall 15N Abundance Indicates Declining Soil Nitrogen Availability in a Free-Air CO2 Enrichment Experiment. Ecology 2011, 92, 133–139. [Google Scholar] [CrossRef]
  19. Hu, X.; Liu, J.; Wei, D.; Zhu, P.; Cui, X.; Zhou, B.; Chen, X.; Jin, J.; Liu, X.; Wang, G. Effects of over 30-Year of Different Fertilization Regimes on Fungal Community Compositions in the Black Soils of Northeast China. Agric. Ecosyst. Environ. 2017, 248, 113–122. [Google Scholar] [CrossRef]
  20. Mohanty, M.; Sinha, N.K.; Somasundaram, J.; McDermid, S.S.; Patra, A.K.; Singh, M.; Dwivedi, A.K.; Reddy, K.S.; Rao, C.S.; Prabhakar, M.; et al. Soil Carbon Sequestration Potential in a Vertisol in Central India- Results from a 43-Year Long-Term Experiment and APSIM Modeling. Agric. Syst. 2020, 184, 102906. [Google Scholar] [CrossRef]
  21. He, Y.; Xu, C.; Gu, F.; Wang, Y.; Chen, J. Soil Aggregate Stability Improves Greatly in Response to Soil Water Dynamics under Natural Rains in Long-Term Organic Fertilization. Soil Tillage Res. 2018, 184, 281–290. [Google Scholar] [CrossRef]
  22. Anandakumar, S.; Bakhoum, N.; Chinnadurai, C.; Malarkodi, M.; Arulmozhiselvan, K.; Karthikeyan, S.; Balachandar, D. Impact of Long-Term Nutrient Management on Sequestration and Dynamics of Soil Organic Carbon in a Semi-Arid Tropical Alfisol of India. Appl. Soil Ecol. 2022, 177, 104549. [Google Scholar] [CrossRef]
  23. Mustafa, A.; Frouz, J.; Naveed, M.; Ping, Z.; Nan, S.; Minggang, X.; Núñez-Delgado, A. Stability of Soil Organic Carbon under Long-Term Fertilization: Results from 13C NMR Analysis and Laboratory Incubation. Environ. Res. 2022, 205, 112476. [Google Scholar] [CrossRef] [PubMed]
  24. Obalum, S.E.; Chibuike, G.U.; Peth, S.; Ouyang, Y. Soil Organic Matter as Sole Indicator of Soil Degradation. Environ.Monit. Assess. 2017, 189, 176. [Google Scholar] [CrossRef] [PubMed]
  25. Celik, I.; Ortas, I.; Kilic, S. Effects of Compost, Mycorrhiza, Manure and Fertilizer on Some Physical Properties of a Chromoxerert Soil. Soil Tillage Res. 2004, 78, 59–67. [Google Scholar] [CrossRef]
  26. Kopittke, P.M.; Menzies, N.W.; Wang, P.; McKenna, B.A.; Lombi, E. Soil and the Intensification of Agriculture for Global Food Security. Environ. Int. 2019, 132, 105078. [Google Scholar] [CrossRef]
  27. Zhang, J.; Wei, D.; Zhou, B.; Zhang, L.; Hao, X.; Zhao, S.; Xu, X.; He, P.; Zhao, Y.; Qiu, S.; et al. Responses of Soil Aggregation and Aggregate-Associated Carbon and Nitrogen in Black Soil to Different Long-Term Fertilization Regimes. Soil Tillage Res. 2021, 213, 105157. [Google Scholar] [CrossRef]
  28. Wang, Y.; Hu, N.; Ge, T.; Kuzyakov, Y.; Wang, Z.-L.; Li, Z.; Tang, Z.; Chen, Y.; Wu, C.; Lou, Y. Soil Aggregation Regulates Distributions of Carbon, Microbial Community and Enzyme Activities after 23-Year Manure Amendment. Appl. Soil Ecol. 2017, 111, 65–72. [Google Scholar] [CrossRef]
  29. Choudhary, M.; Panday, S.C.; Meena, V.S.; Singh, S.; Yadav, R.P.; Pattanayak, A.; Mahanta, D.; Bisht, J.K.; Stanley, J. Long-Term Tillage and Irrigation Management Practices: Strategies to Enhance Crop and Water Productivity under Rice-Wheat Rotation of Indian Mid-Himalayan Region. Agric. Water Manag. 2020, 232, 106067. [Google Scholar] [CrossRef]
  30. Liu, E.; Yan, C.; Mei, X.; Zhang, Y.; Fan, T. Long-Term Effect of Manure and Fertilizer on Soil Organic Carbon Pools in Dryland Farming in Northwest China. PLoS ONE 2013, 8, e56536. [Google Scholar] [CrossRef] [Green Version]
  31. Walkley, A.; Black, I.A. An examination of the degtjareff method for determining soil organic matter, and a proposed modification of the chromic acid titration method. Soil Sci. 1934, 37, 29. [Google Scholar] [CrossRef]
  32. Islam, K.R.; Weil, R.R. Land Use Effects on Soil Quality in a Tropical Forest Ecosystem of Bangladesh. Agric. Ecosyst. Environ. 2000, 79, 9–16. [Google Scholar] [CrossRef]
  33. Anderson, J.P.E. Soil Respiration. In Methods of Soil Analysis; John Wiley & Sons, Ltd.: Hoboken, NJ, USA, 1983; pp. 831–871. ISBN 978-0-89118-977-0. [Google Scholar]
  34. Vance, E.D.; Brookes, P.C.; Jenkinson, D.S. An Extraction Method for Measuring Soil Microbial Biomass C. Soil Biol. Biochem. 1987, 19, 703–707. [Google Scholar] [CrossRef]
  35. Anderson, T.-H.; Domsch, K.H. Application of Eco-Physiological Quotients (QCO2 and QD) on Microbial Biomasses from Soils of Different Cropping Histories. Soil Biol. Biochem. 1990, 22, 251–255. [Google Scholar] [CrossRef]
  36. Nelson, D.W.; Sommers, L.E. Total Carbon, Organic Carbon, and Organic Matter. In Methods of Soil Analysis; John Wiley & Sons, Ltd.: Hoboken, NJ, USA, 1983; pp. 539–579. ISBN 978-0-89118-977-0. [Google Scholar]
  37. Xie, H.; Li, J.; Zhang, B.; Wang, L.; Wang, J.; He, H.; Zhang, X. Long-Term Manure Amendments Reduced Soil Aggregate Stability via Redistribution of the Glomalin-Related Soil Protein in Macroaggregates. Sci. Rep. 2015, 5, 14687. [Google Scholar] [CrossRef] [PubMed]
  38. Bhattacharyya, R.; Prakash, V.; Kundu, S.; Srivastva, A.K.; Gupta, H.S.; Mitra, S. Long Term Effects of Fertilization on Carbon and Nitrogen Sequestration and Aggregate Associated Carbon and Nitrogen in the Indian Sub-Himalayas. Nutr.Cycl.Agroecosyst. 2010, 86, 1–16. [Google Scholar] [CrossRef]
  39. Kumar, D.; Purakayastha, T.J.; Das, R.; Yadav, R.K.; Shivay, Y.S.; Jha, P.K.; Singh, S.; Aditi, K.; Prasad, P.V.V. Long-Term Effects of Organic Amendments on Carbon Stability in Clay–Organic Complex and Its Role in Soil Aggregation. Agronomy 2023, 13, 39. [Google Scholar] [CrossRef]
  40. Tisdall, J.M.; Oades, J.M. Organic Matter and Water-Stable Aggregates in Soils. J. Soil Sci. 1982, 33, 141–163. [Google Scholar] [CrossRef]
  41. Bhattacharyya, R.; Prakash, V.; Kundu, S.; Srivastva, A.K.; Gupta, H.S. Soil Aggregation and Organic Matter in a Sandy Clay Loam Soil of the Indian Himalayas under Different Tillage and Crop Regimes. Agric. Ecosyst. Environ. 2009, 132, 126–134. [Google Scholar] [CrossRef]
  42. Liao, J.D.; Boutton, T.W.; Jastrow, J.D. Storage and Dynamics of Carbon and Nitrogen in Soil Physical Fractions Following Woody Plant Invasion of Grassland. Soil Biol. Biochem. 2006, 38, 3184–3196. [Google Scholar] [CrossRef]
  43. Sommerfeldt, T.G.; Chang, C. Changes in Soil Properties Under Annual Applications of Feedlot Manure and Different Tillage Practices. Soil Sci. Soc. Am. J. 1985, 49, 983–987. [Google Scholar] [CrossRef]
  44. Six, J.; Conant, R.T.; Paul, E.A.; Paustian, K. Stabilization Mechanisms of Soil Organic Matter: Implications for C-Saturation of Soils. Plant Soil 2002, 241, 155–176. [Google Scholar] [CrossRef]
  45. Annabi, M.; Le Bissonnais, Y.; Le Villio-Poitrenaud, M.; Houot, S. Improvement of Soil Aggregate Stability by Repeated Applications of Organic Amendments to a Cultivated Silty Loam Soil. Agric. Ecosyst. Environ. 2011, 144, 382–389. [Google Scholar] [CrossRef]
  46. Shirani, H.; Hajabbasi, M.A.; Afyuni, M.; Hemmat, A. Effects of Farmyard Manure and Tillage Systems on Soil Physical Properties and Corn Yield in Central Iran. Soil Tillage Res. 2002, 68, 101–108. [Google Scholar] [CrossRef]
  47. Golchin, A.; Clarke, P.; Oades, J.M.; Skjemstad, J.O. The Effects of Cultivation on the Composition of Organic-Matter and Structural Stability of Soils. Soil Res. 1995, 33, 975–993. [Google Scholar] [CrossRef]
  48. Elliott, E.T. Aggregate Structure and Carbon, Nitrogen, and Phosphorus in Native and Cultivated Soils. Soil Sci. Soc. Am. J. 1986, 50, 627–633. [Google Scholar] [CrossRef]
  49. Liu, Y.-R.; Delgado-Baquerizo, M.; Wang, J.-T.; Hu, H.-W.; Yang, Z.; He, J.-Z. New Insights into the Role of Microbial Community Composition in Driving Soil Respiration Rates. Soil Biol. Biochem. 2018, 118, 35–41. [Google Scholar] [CrossRef]
  50. Liu, C.-A.; Zhou, L.-M. Soil Organic Carbon Sequestration and Fertility Response to Newly-Built Terraces with Organic Manure and Mineral Fertilizer in a Semi-Arid Environment. Soil Tillage Res. 2017, 172, 39–47. [Google Scholar] [CrossRef]
  51. Guo, Z.C.; Zhang, Z.B.; Zhou, H.; Rahman, M.T.; Wang, D.Z.; Guo, X.S.; Li, L.J.; Peng, X.H. Long-Term Animal Manure Application Promoted Biological Binding Agents but Not Soil Aggregation in a Vertisol. Soil Tillage Res. 2018, 180, 232–237. [Google Scholar] [CrossRef]
  52. Tripathi, R.; Nayak, A.K.; Bhattacharyya, P.; Shukla, A.K.; Shahid, M.; Raja, R.; Panda, B.B.; Mohanty, S.; Kumar, A.; Thilagam, V.K. Soil Aggregation and Distribution of Carbon and Nitrogen in Different Fractions after 41years Long-Term Fertilizer Experiment in Tropical Rice–Rice System. Geoderma 2014, 213, 280–286. [Google Scholar] [CrossRef]
  53. Mikha, M.M.; Hergert, G.W.; Benjamin, J.G.; Jabro, J.D.; Nielsen, R.A. Long-Term Manure Impacts on Soil Aggregates and Aggregate-Associated Carbon and Nitrogen. Soil Sci. Soc. Am. J. 2015, 79, 626–636. [Google Scholar] [CrossRef]
  54. Manna, M.C.; Swarup, A.; Wanjari, R.H.; Ravankar, H.N.; Mishra, B.; Saha, M.N.; Singh, Y.V.; Sahi, D.K.; Sarap, P.A. Long-Term Effect of Fertilizer and Manure Application on Soil Organic Carbon Storage, Soil Quality and Yield Sustainability under Sub-Humid and Semi-Arid Tropical India. Field Crops Res. 2005, 93, 264–280. [Google Scholar] [CrossRef]
  55. Kanchikerimath, M.; Singh, D. Soil Organic Matter and Biological Properties after 26 Years of Maize–Wheat–Cowpea Cropping as Affected by Manure and Fertilization in a Cambisol in Semiarid Region of India. Agric. Ecosyst. Environ. 2001, 86, 155–162. [Google Scholar] [CrossRef]
  56. Moharana, P.C.; Sharma, B.M.; Biswas, D.R.; Dwivedi, B.S.; Singh, R.V. Long-Term Effect of Nutrient Management on Soil Fertility and Soil Organic Carbon Pools under a 6-Year-Old Pearl Millet–Wheat Cropping System in an Inceptisol of Subtropical India. Field Crops Res. 2012, 136, 32–41. [Google Scholar] [CrossRef]
  57. Kaur, S.; Dheri, G.S.; Benbi, D.K. Effect of Long-Term Fertilization in Maize-Wheat Cropping System on Carbon Mineralization in Soil. Carbon Manag. 2019, 10, 523–532. [Google Scholar] [CrossRef]
  58. Brookes, P.C.; Powlson, D.S.; Jenkinson, D.S. Measurement of Microbial Biomass Phosphorus in Soil. Soil Biol. Biochem. 1982, 14, 319–329. [Google Scholar] [CrossRef]
  59. Chakraborty, A.; Chakrabarti, K.; Chakraborty, A.; Ghosh, S. Effect of Long-Term Fertilizers and Manure Application on Microbial Biomass and Microbial Activity of a Tropical Agricultural Soil. Biol. Fertil. Soils 2011, 47, 227–233. [Google Scholar] [CrossRef]
  60. Weil, R.R.; Islam, K.R.; Stine, M.A.; Gruver, J.B.; Samson-Liebig, S.E. Estimating Active Carbon for Soil Quality Assessment: A Simplified Method for Laboratory and Field Use. Am. J. Altern. Agric. 2003, 18, 3–17. [Google Scholar] [CrossRef]
  61. Blair, N.; Faulkner, R.D.; Till, A.R.; Korschens, M.; Schulz, E. Long-Term Management Impacts on Soil C, N and Physical Fertility: Part II: Bad Lauchstadt Static and Extreme FYM Experiments. Soil Tillage Res. 2006, 91, 39–47. [Google Scholar] [CrossRef]
  62. Benbi, D.K.; Brar, K.; Toor, A.S.; Singh, P. Total and Labile Pools of Soil Organic Carbon in Cultivated and Undisturbed Soils in Northern India. Geoderma 2015, 237–238, 149–158. [Google Scholar] [CrossRef]
  63. Choudhary, M.; Meena, V.S.; Panday, S.C.; Mondal, T.; Yadav, R.P.; Mishra, P.K.; Bisht, J.K.; Pattanayak, A. Long-Term Effects of Organic Manure and Inorganic Fertilization on Biological Soil Quality Indicators of Soybean-Wheat Rotation in the Indian Mid-Himalaya. Appl. Soil Ecol. 2021, 157, 103754. [Google Scholar] [CrossRef]
  64. Mohanty, M.; Sinha, N.K.; Hati, K.M.; Painuli, D.K.; Chaudhary, R.S. Stability of Soil Aggregates under Different Vegetation Covers in a Vertisol of Central India. J. Agric. Phys. 2012, 12, 133–142. [Google Scholar]
  65. Cai, A.; Xu, M.; Wang, B.; Zhang, W.; Liang, G.; Hou, E.; Luo, Y. Manure Acts as a Better Fertilizer for Increasing Crop Yields than Synthetic Fertilizer Does by Improving Soil Fertility. Soil Tillage Res. 2019, 189, 168–175. [Google Scholar] [CrossRef]
  66. Ding, X.; Han, X.; Liang, Y.; Qiao, Y.; Li, L.; Li, N. Changes in Soil Organic Carbon Pools after 10 Years of Continuous Manuring Combined with Chemical Fertilizer in a Mollisol in China. Soil Tillage Res. 2012, 122, 36–41. [Google Scholar] [CrossRef]
  67. Li, L.-J.; Han, X.-Z. Changes of Soil Properties and Carbon Fractions after Long-Term Application of Organic Amendments in Mollisols. Catena 2016, 143, 140–144. [Google Scholar] [CrossRef]
  68. Zou, C.; Li, Y.; Huang, W.; Zhao, G.; Pu, G.; Su, J.; Coyne, M.S.; Chen, Y.; Wang, L.; Hu, X.; et al. Rotation and Manure Amendment Increase Soil Macro-Aggregates and Associated Carbon and Nitrogen Stocks in Flue-Cured Tobacco Production. Geoderma 2018, 325, 49–58. [Google Scholar] [CrossRef]
  69. Zhou, G.; Gao, S.; Lu, Y.; Liao, Y.; Nie, J.; Cao, W. Co-Incorporation of Green Manure and Rice Straw Improves Rice Production, Soil Chemical, Biochemical and Microbiological Properties in a Typical Paddy Field in Southern China. Soil Tillage Res. 2020, 197, 104499. [Google Scholar] [CrossRef]
  70. Tian, G.; Bi, Y.; Sun, Z.; Zhang, L. Phenolic Acids in the Plow Layer Soil of Strawberry Fields and Their Effects on the Occurrence of Strawberry Anthracnose. Eur. J. Plant Pathol. 2015, 143, 581–594. [Google Scholar] [CrossRef]
  71. Wang, R.; Dorodnikov, M.; Yang, S.; Zhang, Y.; Filley, T.R.; Turco, R.F.; Zhang, Y.; Xu, Z.; Li, H.; Jiang, Y. Responses of Enzymatic Activities within Soil Aggregates to 9-Year Nitrogen and Water Addition in a Semi-Arid Grassland. Soil Biol. Biochem. 2015, 81, 159–167. [Google Scholar] [CrossRef]
  72. Yang, X.; Ren, W.; Sun, B.; Zhang, S. Effects of Contrasting Soil Management Regimes on Total and Labile Soil Organic Carbon Fractions in a Loess Soil in China. Geoderma 2012, 177–178, 49–56. [Google Scholar] [CrossRef]
  73. Lehmann, J.; Lan, Z.; Hyland, C.; Sato, S.; Solomon, D.; Ketterings, Q.M. Long-Term Dynamics of Phosphorus Forms and Retention in Manure-Amended Soils. Environ. Sci. Technol. 2005, 39, 6672–6680. [Google Scholar] [CrossRef] [PubMed]
  74. Taiwo, A.A.; Adetunji, M.T.; Azeez, J.O.; Elemo, K.O. Kinetics of Potassium Release and Fixation in Some Soils of Ogun State, Southwestern, Nigeria as Influenced by Organic Manure. Int. J.Recycl. Org. Waste Agricult. 2018, 7, 251–259. [Google Scholar] [CrossRef] [Green Version]
Figure 1. Location of the experiment. (The symbol in red box in last figure denotes experimental site in research farm of JNKVV at Jabalpur).
Sustainability 15 02679 g001
Figure 2. Effects of long-term manure and inorganic fertiliser on aggregate size distribution in soybean–wheat cropping system. Error bar value represented as standard deviation and different lowercase letters indicates significant differences between treatments at p< 0.05. (The blue color in lower side of bar denotes-large macroaggregate, red color denotes small macroaggregate, green color denotes microaggregate and violet color at top of bar denotes silt+clay fraction).
Sustainability 15 02679 g002
Figure 3. Effect of long-term manure and inorganic fertiliser on mean weight diameter (MWD) (Error bar value represented as standard deviation and different lowercase letters indicate significant differences between treatments at p< 0.05).
Sustainability 15 02679 g003
Figure 4. Effect of long-term manure and inorganic fertiliser on water-stable aggregates (WSA).
Sustainability 15 02679 g004
Figure 5. Effect of long-term manure and inorganic fertiliser on (a) large macroaggregates (b) small macroaggregates (c) microaggregates, (d) silt + clay-associated soil carbon (Error bar value represented as standard deviation and different lowercase letters indicate significant differences between treatments at p < 0.05).
Sustainability 15 02679 g005
Figure 6. Relationship between SOC and (a) large macroaggregates associated carbon, (b) small macroaggregates, (c) microaggregates, and (d) silt + clay-associated soil carbon as influenced by long-term manure and inorganic fertiliser.
Sustainability 15 02679 g006
Figure 7. Effects of long-term manure and inorganic fertiliser on cumulative CO2-C evolution under soybean–wheat cropping system.
Sustainability 15 02679 g007
Table 1. Correlation among soil carbon, nutrients, physical and biological properties of soil in long-term fertiliser experiment.
Soil ParametersWBSCKMnO4-CSMBCTSCMetQMiQTSNTSPTSKMWD
KMnO4-C0.72 *1
SMBC0.96 **0.74 *1
TSC0.95 **0.70 *0.96 **1
MetQ−0.90 **−0.82 *−0.96 **−0.93 **1
MiQ0.93 **0.79 *0.99 **0.93 **−0.99 **1
TSN0.66 *0.300.580.76 *−0.490.481
TSP0.80 *0.82 *0.85 *0.85 *−0.89 **0.88 **0.491
TSK0.70 *0.73 *0.82 *0.68 *−0.88 **0.89 **0.070.79 *1
MWD0.90 **0.60 *0.85 *0.92 **−0.78 *0.79 *0.78 *0.73 *0.441
WSA0.410.64 *0.430.51−0.560.470.260.64 *0.330.61 *
** p < 0.01; * p < 0.05; Walkley Black soil carbon (WBSC); soil microbial biomass carbon (SMBC); total soil carbon (TSC); metabolic quotient (MetQ); microbial quotient (MiQ); total soil nitrogen (TSN); total soil phosphorus (TSP); total soil potassium (TSK); mean weight diameter (MWD); water-stable aggregates (WSA).
Table 2. Effect of long-term manure and inorganic fertiliser on Walkley Black soil organic carbon (WBSC), permanganate oxidisable carbon (KMnO4–C), soil microbial biomass carbon (SMBC), cumulative C–mineralisation (CO2–C) and total soil carbon (TSC) in soybean–wheat cropping system.
TreatmentsWBSC (%)KMnO4–C (mg kg−1)SMBC
(mg kg−1)
Cumulative-C-Mineralisation (mg CO2–C kg−1 hr−1)TSC (%)
¥T10.64 ±0.05 bcd680 ± 81.5 a221 ± 20.6 cd0.99 ± 0.04 bc0.93 ± 0.08 c
T20.71 ± 0.06 bc701 ± 13.6 a322 ± 21.2 b1.06 ± 0.07 bc1.03 ± 0.05 b
T30.75± 0.05 b722 ± 46.9 a352 ± 28.6 b1.14 ± 0.19 b1.04 ± 0.09 b
T40.67 ±0.06 bcd686 ± 75.0 a232 ± 10.8 c1.03 ± 0.05 bc0.98 ± 0.10 bc
T50.62 ± 0.06 cd562 ± 177 b196 ± 29.9 cd0.92 ± 0.09 c0.98 ± 0.04 bc
T61.02 ± 0.04 a757 ± 40.6 a506 ± 52.6 a1.31 ± 0.06 a1.14 ± 0.10 a
T70.56 ± 0.05 d441 ± 186 c179 ± 14.8 d0.92 ± 0.15 c0.92 ± 0.07 c
LSD
(p ≤ 0.05)
0.1285.047.00.140.09
¥T1: 50% NPK, T2: 100% NPK, T3: 150% NPK, T4: 100% NP, T5: 100% N, T6: 100% NPK + FYM and T7: Control (no nutrient with crop). Different superscript lowercase letters indicate significant differences between treatments at p< 0.05 according to the Duncan Multiple Range Test (values are mean ± S.D.).
Table 3. Effect of long-term manure and inorganic fertiliser on metabolic (MetQ) and microbial quotient (MiQ) in soybean–wheat cropping system.
TreatmentsMetQ (mg CO2–C mg−1 MBC h−1)MiQ (%)
¥ T14.53 ± 0.56 b2.39 ± 0.01 c
T23.32 ± 0.30 a3.14± 0.01 b
T33.27 ± 0.25 a3.37± 0.02 b
T44.43 ± 0.33 b2.38 ± 0.01 c
T54.78 ± 0.53 b1.99± 0.01 c
T62.60± 0.23 a4.11± 0.01 a
T75.13 ±0.66 b1.95± 0.02 c
LSD (p ≤ 0.05)0.820.47
¥ T1: 50% NPK, T2: 100% NPK, T3: 150% NPK, T4: 100% NP, T5: 100% N, T6: 100% NPK + FYM and T7: Control (no nutrient with crop). Different superscript lowercase letters indicate significant differences between treatments at p < 0.05 according to Duncan Multiple Range Test (values are mean ± S.D.).
Table 4. Effect of long-term manure and inorganic fertiliser on total soil nitrogen (TSN), total soil phosphorus (TSP) and total soil potassium (TSK) in soybean–wheat cropping system.
TreatmentsTSNTSPTSK
(%)
¥ T10.11± 0.01 d0.19 ± 0.08 b1.22 ± 0.12 abc
T20.13± 0.02 cd0.30 ± 0.06 a1.30 ± 0.27 ab
T30.14± 0.01 cd0.35± 0.04 a1.38 ± 0.08 a
T40.14± 0.01 bc0.31 ± 0.04 a1.15 ± 0.05 bc
T50.16± 0.01 ab0.18 ± 0.02 b1.04 ± 0.04 c
T60.17± 0.01 a0.37± 0.05 a1.35 ± 0.07 ab
T70.12± 0.02 d0.17 ± 0.03 b1.14 ± 0.04 bc
LSD (p ≤ 0.05)0.0200.0930.209
¥ T1: 50% NPK, T2: 100% NPK, T3: 150% NPK, T4: 100% NP, T5: 100% N, T6: 100% NPK + FYM and T7: Control (no nutrient with crop). Different superscript lowercase letters indicate significant differences between treatments at p < 0.05 according to Duncan Multiple Range Test (values are mean ± S.D.).
Disclaimer/Publisher’s Note: The statements, opinions and data contained in all publications are solely those of the individual author(s) and contributor(s) and not of MDPI and/or the editor(s). MDPI and/or the editor(s) disclaim responsibility for any injury to people or property resulting from any ideas, methods, instructions or products referred to in the content.

