1. Introduction
One of the United Nations (UN) sustainable development goals is to ensure the openness, safety, resilience and environmental sustainability of cities and towns. Goal 11.2 declares: “By 2030, provide access to safe, affordable, accessible and sustainable transport systems for all, improving road safety, notably by expanding public transport, with special attention to the needs of those in vulnerable situations, women, children, persons with disabilities and elderly persons” [
1].
According to World Bank data, over the past 60 years the proportion of the world population living in cities has increased by 20% [
2]. Today, more than 55% of people live in urban areas. The growth of the urban population is related to the increase in the area of the city and the distance from places of residence to places of work and study. In the absence of reliable and affordable public transport, people increasingly use private cars; as a result, transport systems become unbalanced, traffic jams are formed, and the anthropogenic impact on the environment increases, thus reducing the quality of life and standard of living. To maintain the average trip time at an acceptable level, support transportation of an increasing number of passengers, and reduce harmful human impacts on the environment, faster and more efficient transport systems are required.
The most common kind of public transport is the bus. Its popularity is due to the lowest cost of capital expenditures and the highest mobility [
3,
4]. Different dimension types of this kind of transport vehicles can use practically any road, and route laying options are limited only by the road network.
The combination of the advantages of the wheeled mode of transport, its low cost and mobility, as well as measures for increasing traffic speed, together with more spacious vehicles, has formed a new type of public transport. Bus rapid transit (BRT) is one of the bus transportation varieties. BRT is the main type of public urban passenger transport (hereinafter referred to as ‘PUPT’), the passenger flow of which reaches 18,000 passengers per hour in one direction [
5], and in some cases 43,000 passengers per hour. To achieve such capacity and speed, a BRT line must have the following characteristics:
Isolated lanes in the center of the carriageway or a separate roadway;
Vehicles of especially large capacity (often of an individual design);
Toll collection outside the vehicle;
Priority over other modes of transport at crossroads;
Passenger boarding and deboarding on platforms of the same level with vehicle floor [
6].
In the 1970s, the countries of Latin America faced rapid growth of the urban population. High-performance, high-speed systems were required for transport services, but cities could not afford large infrastructure projects such as the construction of a subway. So, the population of the Brazilian city Curitiba in the early 1970s was about 600 thousand people. In 1974, at the initiative of the mayor of Curitiba, Jaime Lerner, a bus traffic system was opened, which later became the first BRT system—“Rede Integrada de Transporte”.
The most widely developed BRT systems appeared in India and China [
7,
8]. A BRT economic model has proven to be very attractive to countries with developing economies and a rapidly growing population. BRT requires several times less capital expenditure as compared to the tram or subway. At the same time, it allows for the creation of a branched, extensive transport system within a short time, ensuring high-level transport services quality: high transportation speed, high carrying capacity, and high traffic frequency with proper routing.
In BRT technology, stopping points should be provided with roofed heavy-duty pavilions that are usually installed in the middle of the carriageway on traffic flow dividing lines. Often, their installation requires changes in roadway configuration to provide for broadening. Terminal stations and turning rings shall be designed individually. They need more space, larger pavilions, and larger vehicle parking platforms. Proximity to the beginning of a BRT corridor can be a determining factor when choosing a location for bus depot construction in order to reduce the costs of zero (depot) run. In especially complicated areas, it may be necessary to separate traffic flows at different levels, building, e.g., bus crossover junctions. The building of a BRT corridor is associated with large capital investments and construction of a transport infrastructure.
Effects to be provided by the new system, such as increased transport accessibility, reduced transport system load, and harmful emissions, depend on the well-considered BRT corridor routing. The purpose of this article is to develop a method for selecting a BRT corridor, and also to provide a calculation of BRT corridors using the city of Pskov as an example.
The rest of this paper is organized as follows.
Section 2 presents an overview of BRT corridor selection methods and justification for selecting BRT corridors in accordance to the economically viable passenger flow criterion.
Section 3 describes the developed method.
Section 4 presents results of method application.
Section 5 presents conclusions and further directions of the research.
2. Overview of BRT Corridor Selection Methods
The Institute for Transport and Development Policy (ITDP) suggests that at selecting a type of mass rapid transport, one should be guided primarily by financial feasibility and the required capacity. In many cases, there is only one transportation technology in a city. It is more practical to create a mass high-speed mode of transport, if possible, using the existing facilities. The availability of highly-qualified specialists familiar with the technology also reduces the costs of system creation. Another important aspect is self-financing. For poor cities, high-speed mass transport can be unfeasible due to the lack of budgetary funds to subsidize transportations [
9]. Only highly efficient systems operating at full capacity and linking the required points of attraction can enable such self-financing mode.
Therefore, the selection of the type of high-speed mass transport boils down to the conditions of necessary and sufficient capacity, budget-affordable costs, and the technology that best meets the specific needs of a city (self-financing, availability of an existing technical infrastructure in the city for its creation) [
10].
Usually, BRT corridors are defined by expertise [
11,
12,
13]. Routing begins with the definition of the main attraction points of the considered territory. Passenger flows survey data and traffic simulation data can help identify the most constrained areas of the city’s transport network [
14,
15,
16], which will make it possible to create a BRT corridor in the most promising directions in terms of passenger flows. First of all, BRT should be organized for such directions. In terms of technical implementation, BRT is more convenient to plan on main highways of the city; normally such roads connect main points of attraction as well. In some cases, local residents participate in the determination of a BRT corridor through public hearing tools [
12].
The ITDP has developed a BRT standard for the evaluation and ranging of the existing systems. On its basis, they developed a methodology for quality assessment of BRT systems being designed [
17]. The assessment is made on the basis of a 100-point system. The highest number of points (38) can be scored for availability of basic BRT attributes (traffic priority, platforms at the vehicle floor level, toll collection outside the vehicle, availability of dedicated traffic lanes); for routing in the most popular corridor, a maximum of 3 points can be received. In general, this standard provides a possibility for infrastructure quality and service level assessment, but not assessment of the quality of BRT corridor routing.
Multiple works are dedicated to the assessment of BRT corridors using different criteria. Authors compare passenger traffic [
18], speed and safety characteristics [
19], emissions changes [
20], and population effects [
21]. However, most of them assess the effectiveness of existing transportation systems.
The work of Rea J. [
22] used linear programming methods for modeling a public transport network to achieve the minimum travel time, taking into account the throughput of the transport network.
An example of a deterministic approach to the creation of rapid transport systems is the method by M. Ya Snitsar for the routing of rapid transport systems (RTS) lines [
23,
24,
25]. This methodology suggests an automatic search of optimal RTS of different types using a computer. Initially, the need in RTS is established in a transport assessment model itself by calculating the labor commuting specific weight (share) criterion, γ, over time exceeding 40 or 30 min, depending on the population size.
After preliminary selection of a rapid transport type, its network is routed using an iterative algorithm. The initial data for starting the calculation is the street and road network (SRN) graph of the city and, if the considered option of rapid transport can pass outside the SRN (metro, high-speed tram), it should be the network of shortest links between main centers of the transport attraction. The general principle of the calculation is to determine a traffic load by the existing PUPT route networks using conventional transport calculation methods, and then distributing it between the PUPT route networks and the polygon of a potentially suitable high-speed PUPT network according to the minimum travel time criterion.
Thus, in practice, BRT passage corridors are selected based on an expert opinion, existing passenger flow data, and the arrangement of major attraction points. However, quantitative methods for tracing BRT corridors were not identified. On the other hand, M. Ya Snitsar proposes usage of the economically viable passenger flow method and the method described in this article will be built on its basis.
3. Method for Selecting BRT Corridors According to the Economically Viable Passenger Flow Criterion
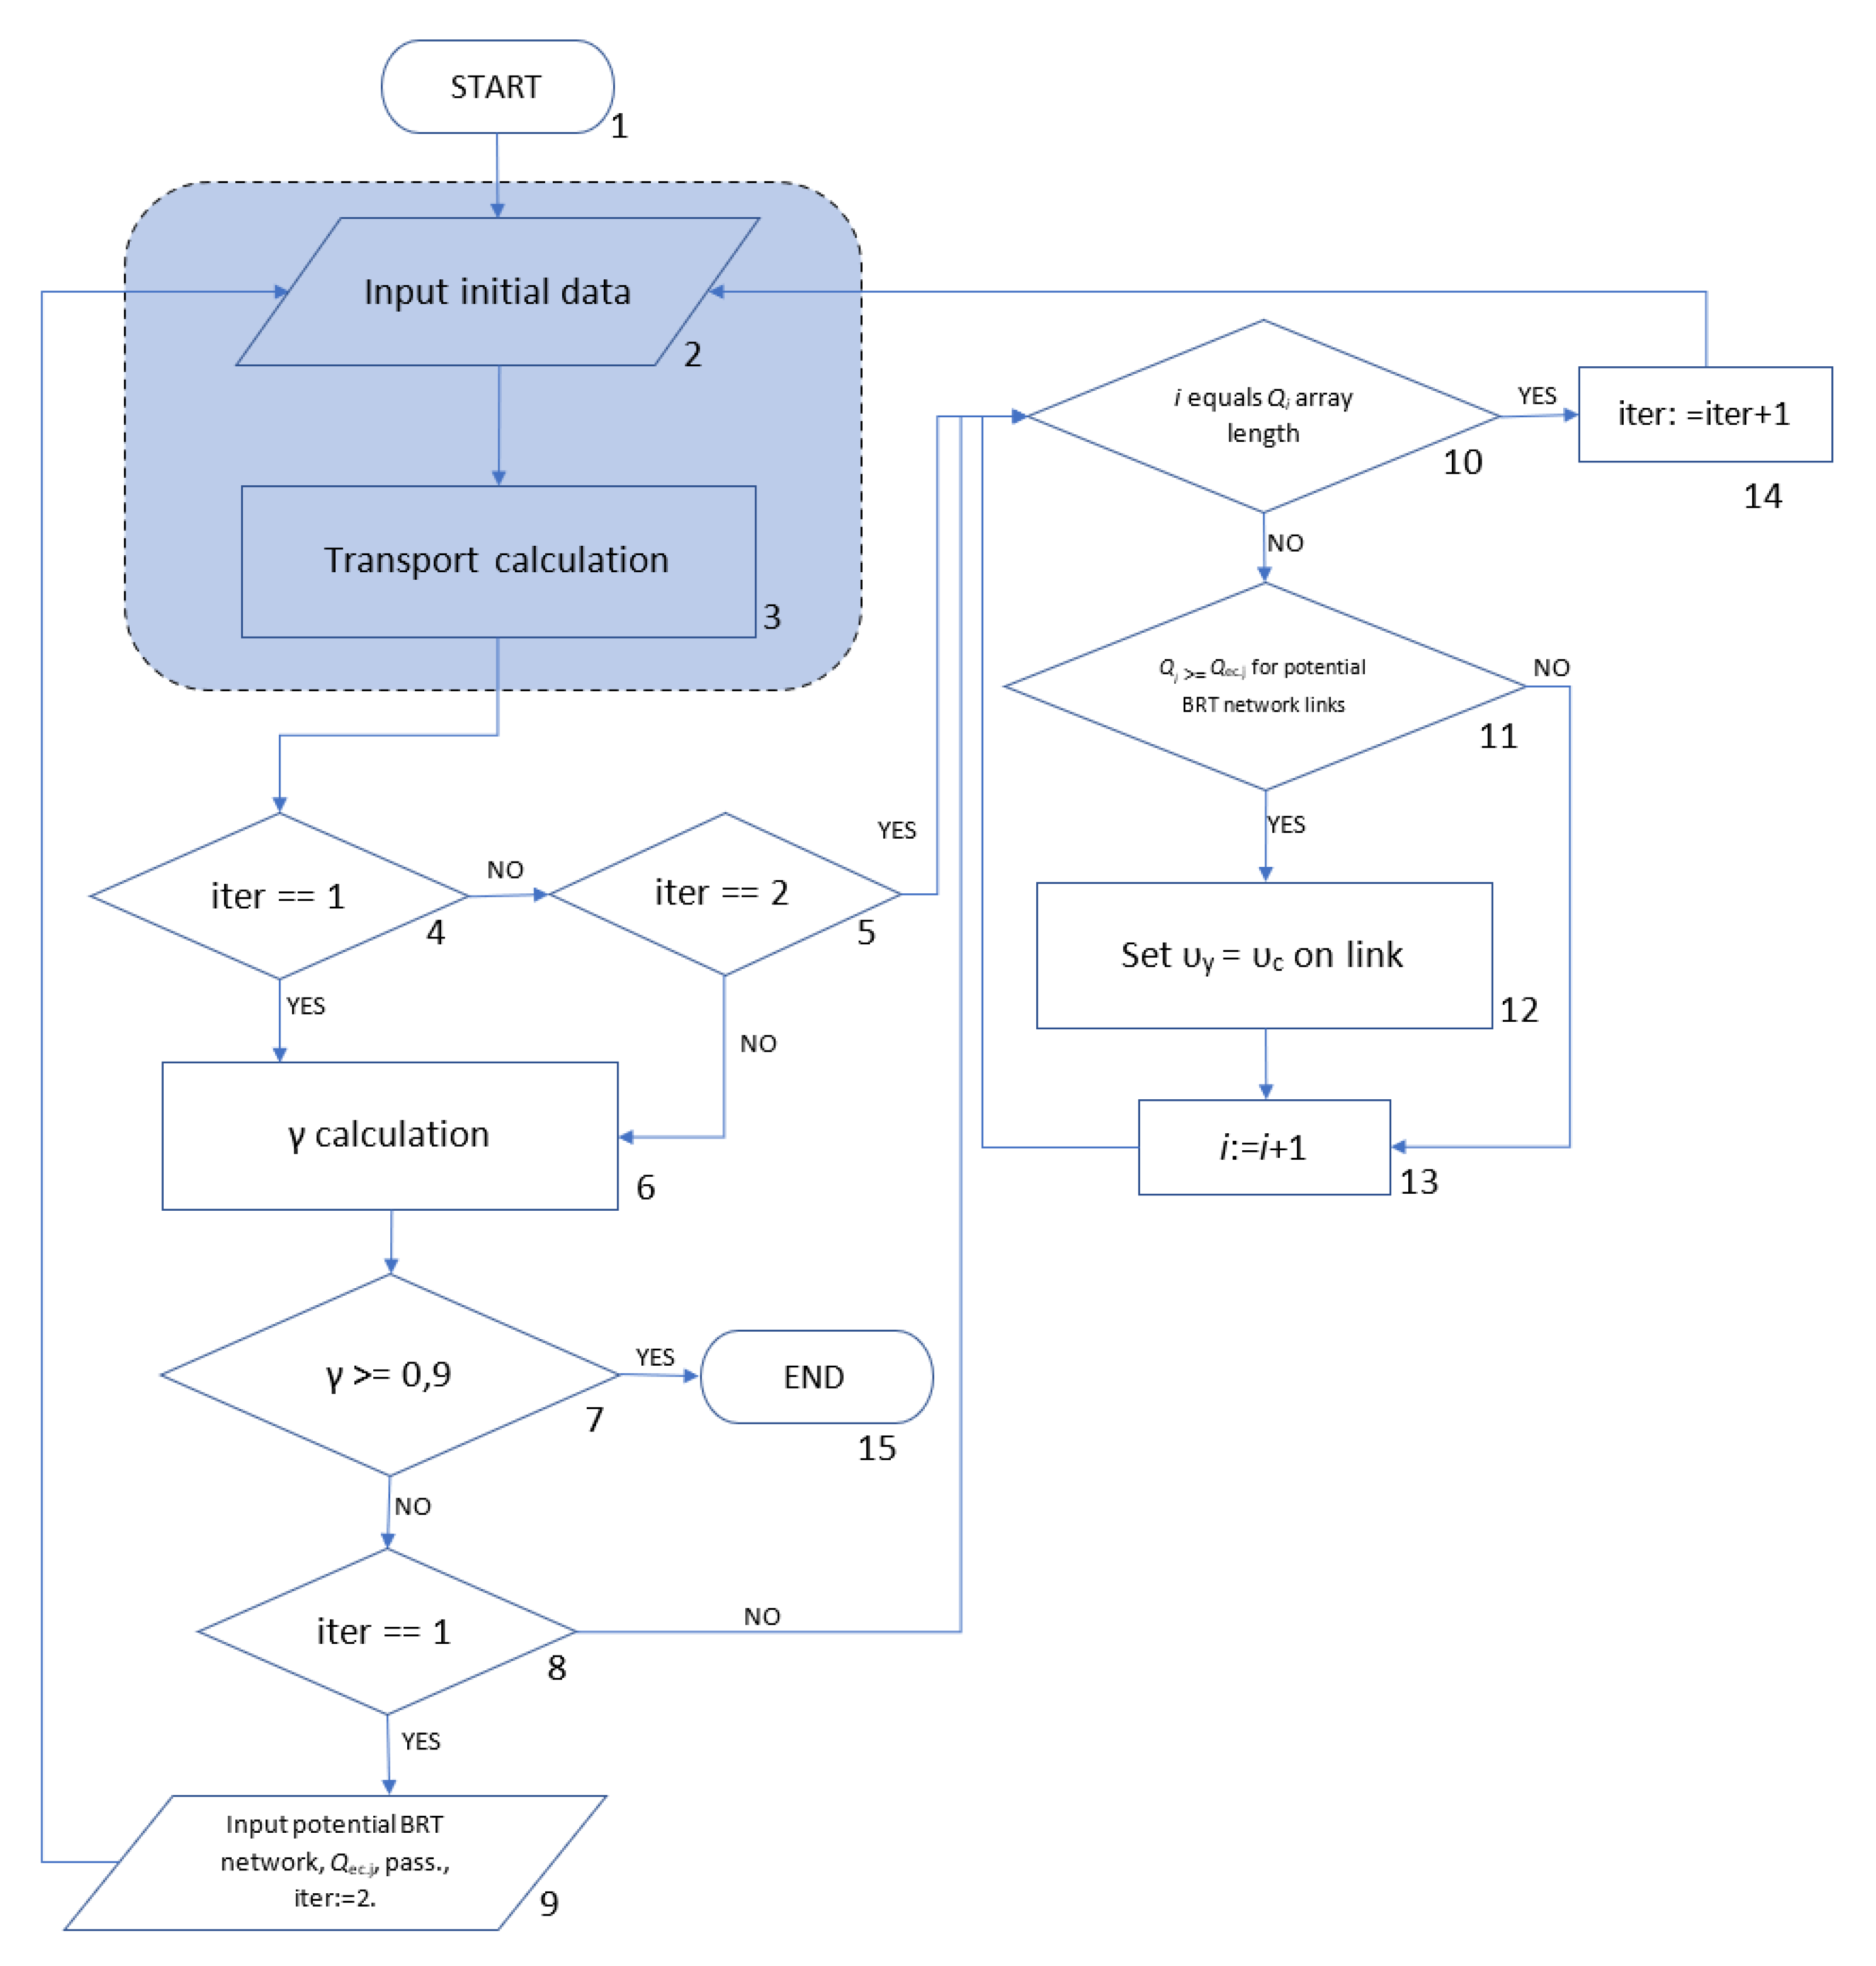
Figure 1 shows a flow chart of the proposed iterative algorithm for BRT corridors determination [
26,
27]. At the first iteration, transport calculations are performed for the existing route networks (blocks 2 and 3). This can be any transport calculation, while the distribution of traffic flows over the network should depend on the duration of the correspondence. For example, a four-step model [
28] or a multi-agent transport model based on chains of activities [
29]. The initial data for the calculation is the transport supply, or the graph of the city’s street and road network, public transport routes, as well as the level of motorization in the territory; next is transport demand, or data on the places of settlement of residents, places of employment, study, leisure and other activities, etc. The result of the transport calculation is a source-destination correspondence matrix, as well as the distribution of transport demand according to the transport graph models.
Then, the base value of labor correspondence share is determined. This value should be less than standard time γ. In accordance to paragraph 11.2 of the Code of Rules “Urban Planning: Planning and Development of Urban and Rural Settlements” 42.13330.2016 (Russian regulatory act in the field of urban planning) [
30], the time spent in cities for moving from places of residence to places of work for 90% of workers (one way) should not exceed the following parameters: 45 min for cities with a population of up to 2000 thousand people; 40 min for a population of up to 1000 thousand people; 37 min for up to 500 thousand people; 35 min for up to 250 thousand people; and 30 min for 100 thousand people and less. Indicated norms for spending time should be interpolated for intermediate estimates of city population. Then, the number of labor correspondence, which duration does not exceed the normative one, is divided by the total number of labor correspondence. If γ is less than 0.9, then the calculation continues (block 7). Since it is first iteration, we move to block 9 (block 8).
Further, in block 9, a potential BRT network is added as an economically viable passenger flow. A potential BRT network is a set of elements of a street and road network (traffic graph) along which the organization of BRT traffic is possible, as well as possible new transport links. When choosing such sections, one can take into account the class of the road or street, the width of the carriageway, the radii of curves, the availability of space for the installation of landing platforms, etc. Economically justified passenger flow Qec.j, pass., is the criterion mentioned earlier, on the basis of which a decision is made to include a section of the potential BRT network into the generated BRT network. These data are needed for further calculations.
At the second iteration, trips are distributed over two networks: the existing PUPT route network and the potential BRT network polygon, including the shortest links network. Therefore, to SRN are added potential links, which can be built or extended. These links are optional for calculations. Next, through blocks 4 and 5 we move to block 10. At this stage the cycle for potential participants of a BRT network, where passenger flow is greater than or equal to the assumed value of the economically viable passenger flow, starts (blocks 10–13). At areas where the passenger flow reaches an economically viable level, the speed of travel is increased to the speed of the BRT access.
After the cycle is completed, the third iteration begins, with newly introduced BRT areas in the network, at which a high traffic rate is assumed. This leads to an increase in passenger flow through these areas which, in turn, leads to an increase in passenger flow in adjacent areas of the network. Passengers try to choose a route that will take the least time. Such change in the attraction scheme leads to the emergence of new areas where BRT mode introduction will be justified. Further iterations of the calculation are based on passenger flows redistribution hypothesis through the increase in traffic speed in certain areas of the network, which leads to a passenger flow increase in these and the nearby areas of such network. Each iteration leads to an increase in γ due to increase in the BRT network and decrease in time of labor correspondence over the network. The calculation ends when γ reaches 0.9 or when no new sections are added to the generated BRT network at the next iteration.
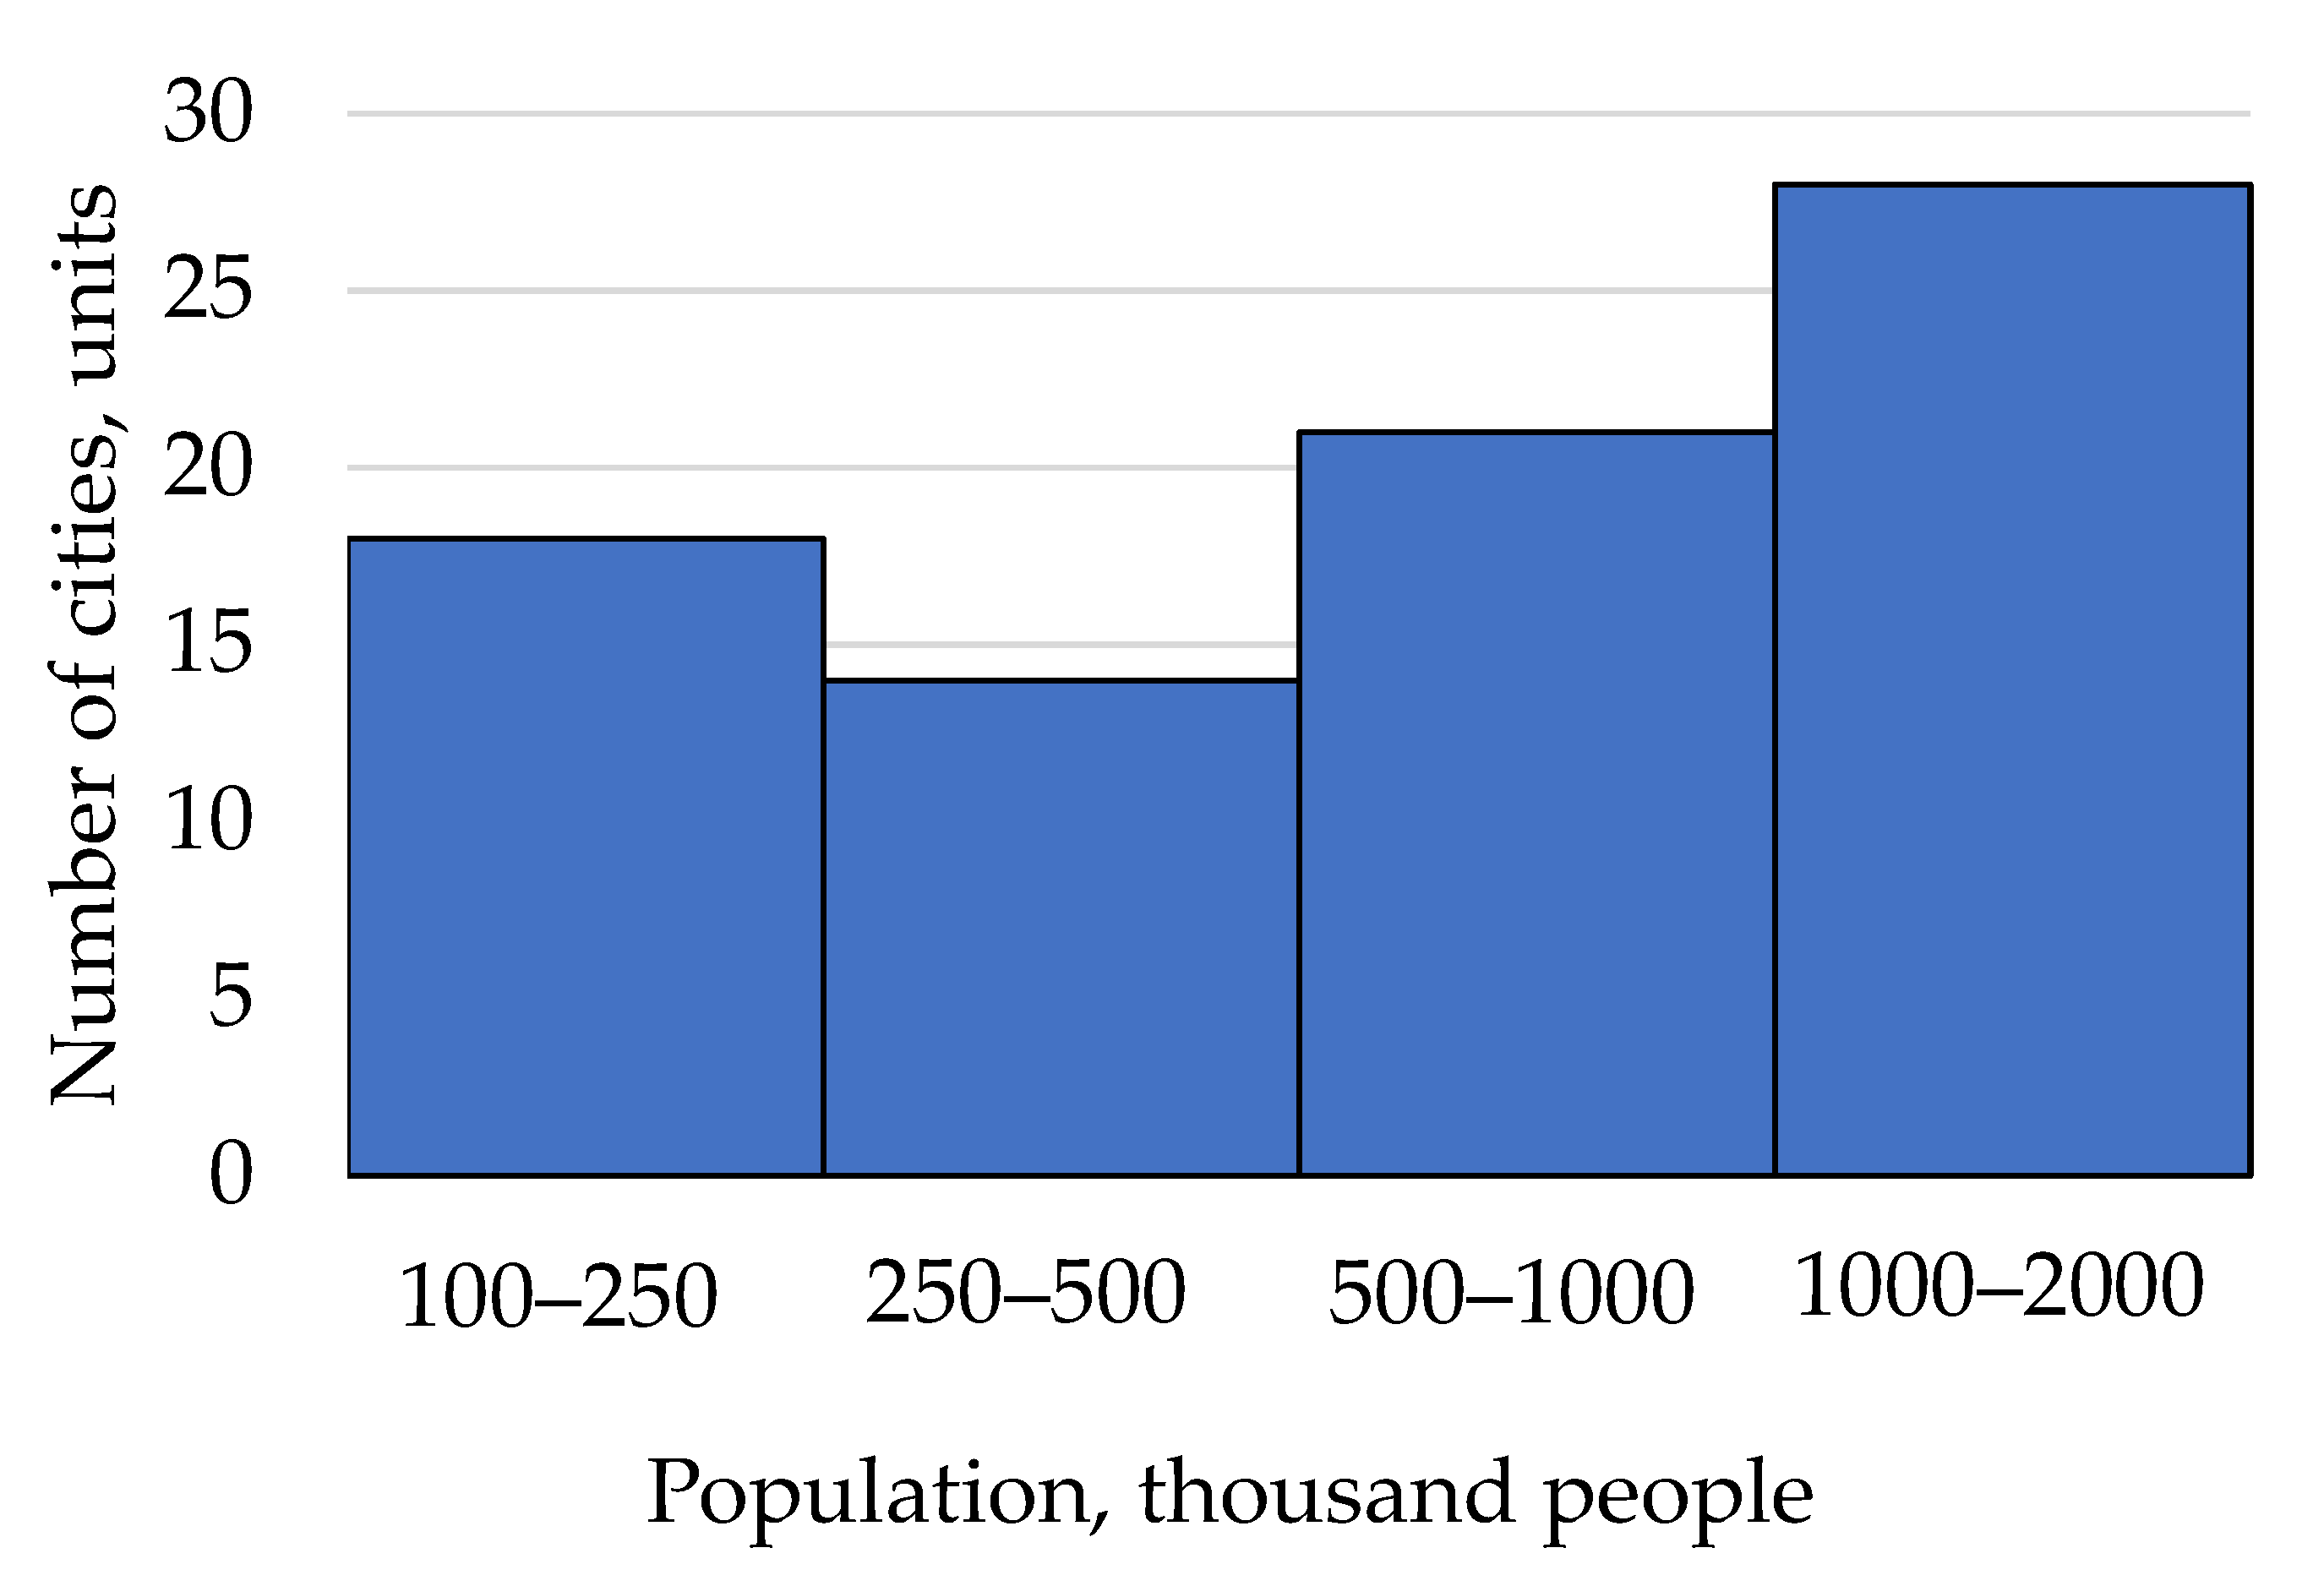
The BRT Data website collects data on BRT systems from around the world [
31]. Data on daily passenger flow in corridors and population size is available for 118 cities and agglomerations. The population size ranges from 100 thousand to 12.2 million people. The average daily passenger flow is from 1250 to 1.2 million passengers/day. The average passenger flow for a group of corridors arranged in cities with similar population size can be considered economically viable. Grouping is carried out in accordance with clause 11.2 of SP 42.13330.2016, starting from cities with a population of 100 thousand people or more. The number of cities in each group is shown in
Figure 2.
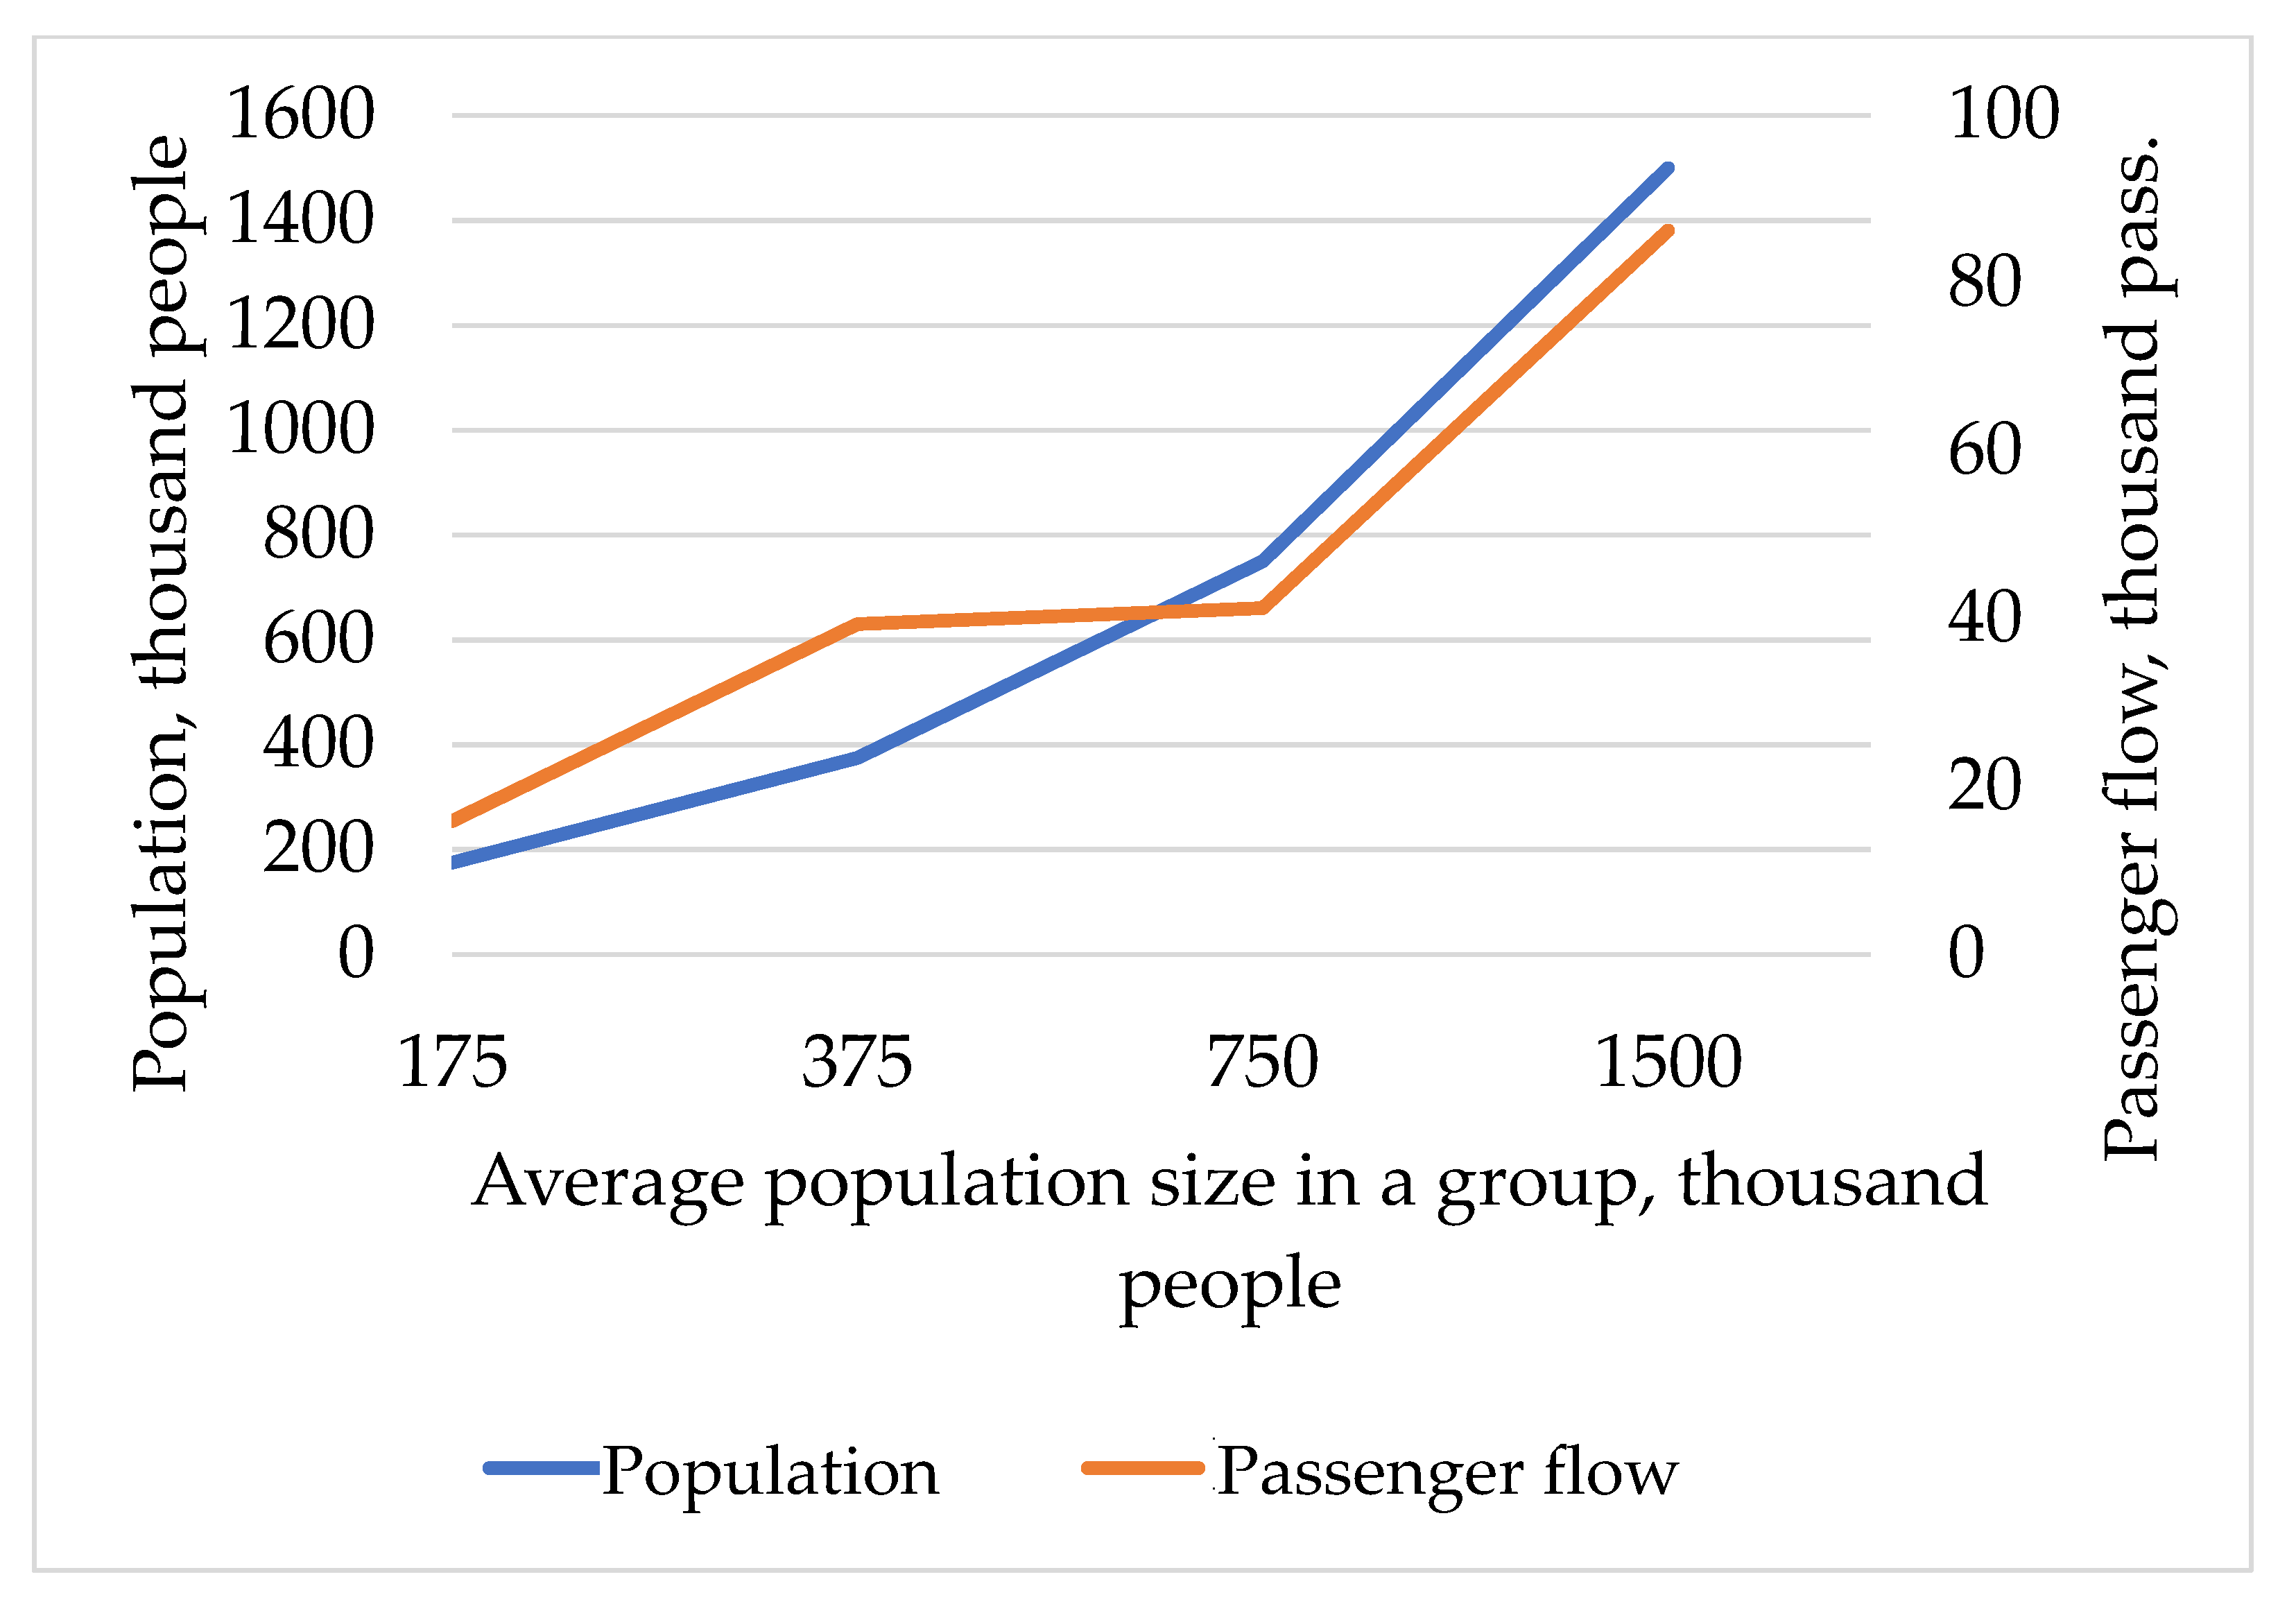
Table 1 presents arithmetic averages of the average daily passenger flows in corridors of the cities by groups. In
Figure 3,
Table 1 is presented in a graphical form.
As it can be seen from
Table 2, passenger flow is growing disproportionately to population growth. However, the growth is close to linear.
Thus, the assumption of a direct relationship between the city’s population and passenger flow can be considered partially correct. In this regard, certain values of passenger flows are used in the calculation according to the method, depending on the city population. The calculated value can be changed based on obtained passenger flow charts at the second iteration of the calculation.
To confirm the correctness of average daily economically viable passenger flow selection, a feasibility study can be used. The justification shall be made on the basis of annual profit, profitability, and capital investments payback period indicators. The cost of a 1 km of vehicles run is determined in accordance with the effective order of the Ministry of Transportation of Russia. If economic indicators of the project show its low efficiency, the calculation according to the iterative algorithm should be re-started using an increased value of economically viable passenger flow.
Thus, for the first time in the practice of creating BRT corridors, a numerical method for choosing the route of passage is proposed. The method can be used to calculate the BRT corridor only in urban areas with a population of 100 to 2000 thousand people. The reliability of the result obtained directly depends on the quality of the initial data used: transport demand and supply in the study area.
4. Results
To check the methodology in practice, a test calculation has been carried out using the city of Pskov as an example. The trip matrix is calculated according to the method proposed by E. A. Merkulov [
32]. The number of trips is calculated for a year. The Pskov population is 210 thousand people [
33], the threshold value of labor commuting time is in the interval from 100 thousand people (30 min) to 250 thousand people (35 min). This means that the share of labor trips up to 34 min should be calculated, γ
34. The only public transport in Pskov is the bus. The route network runs mainly along the main streets network. The length of the network is 88 km. The length of the routes is 204 km, which is more than 2 times the length of the network, which indicates a high level of duplication.
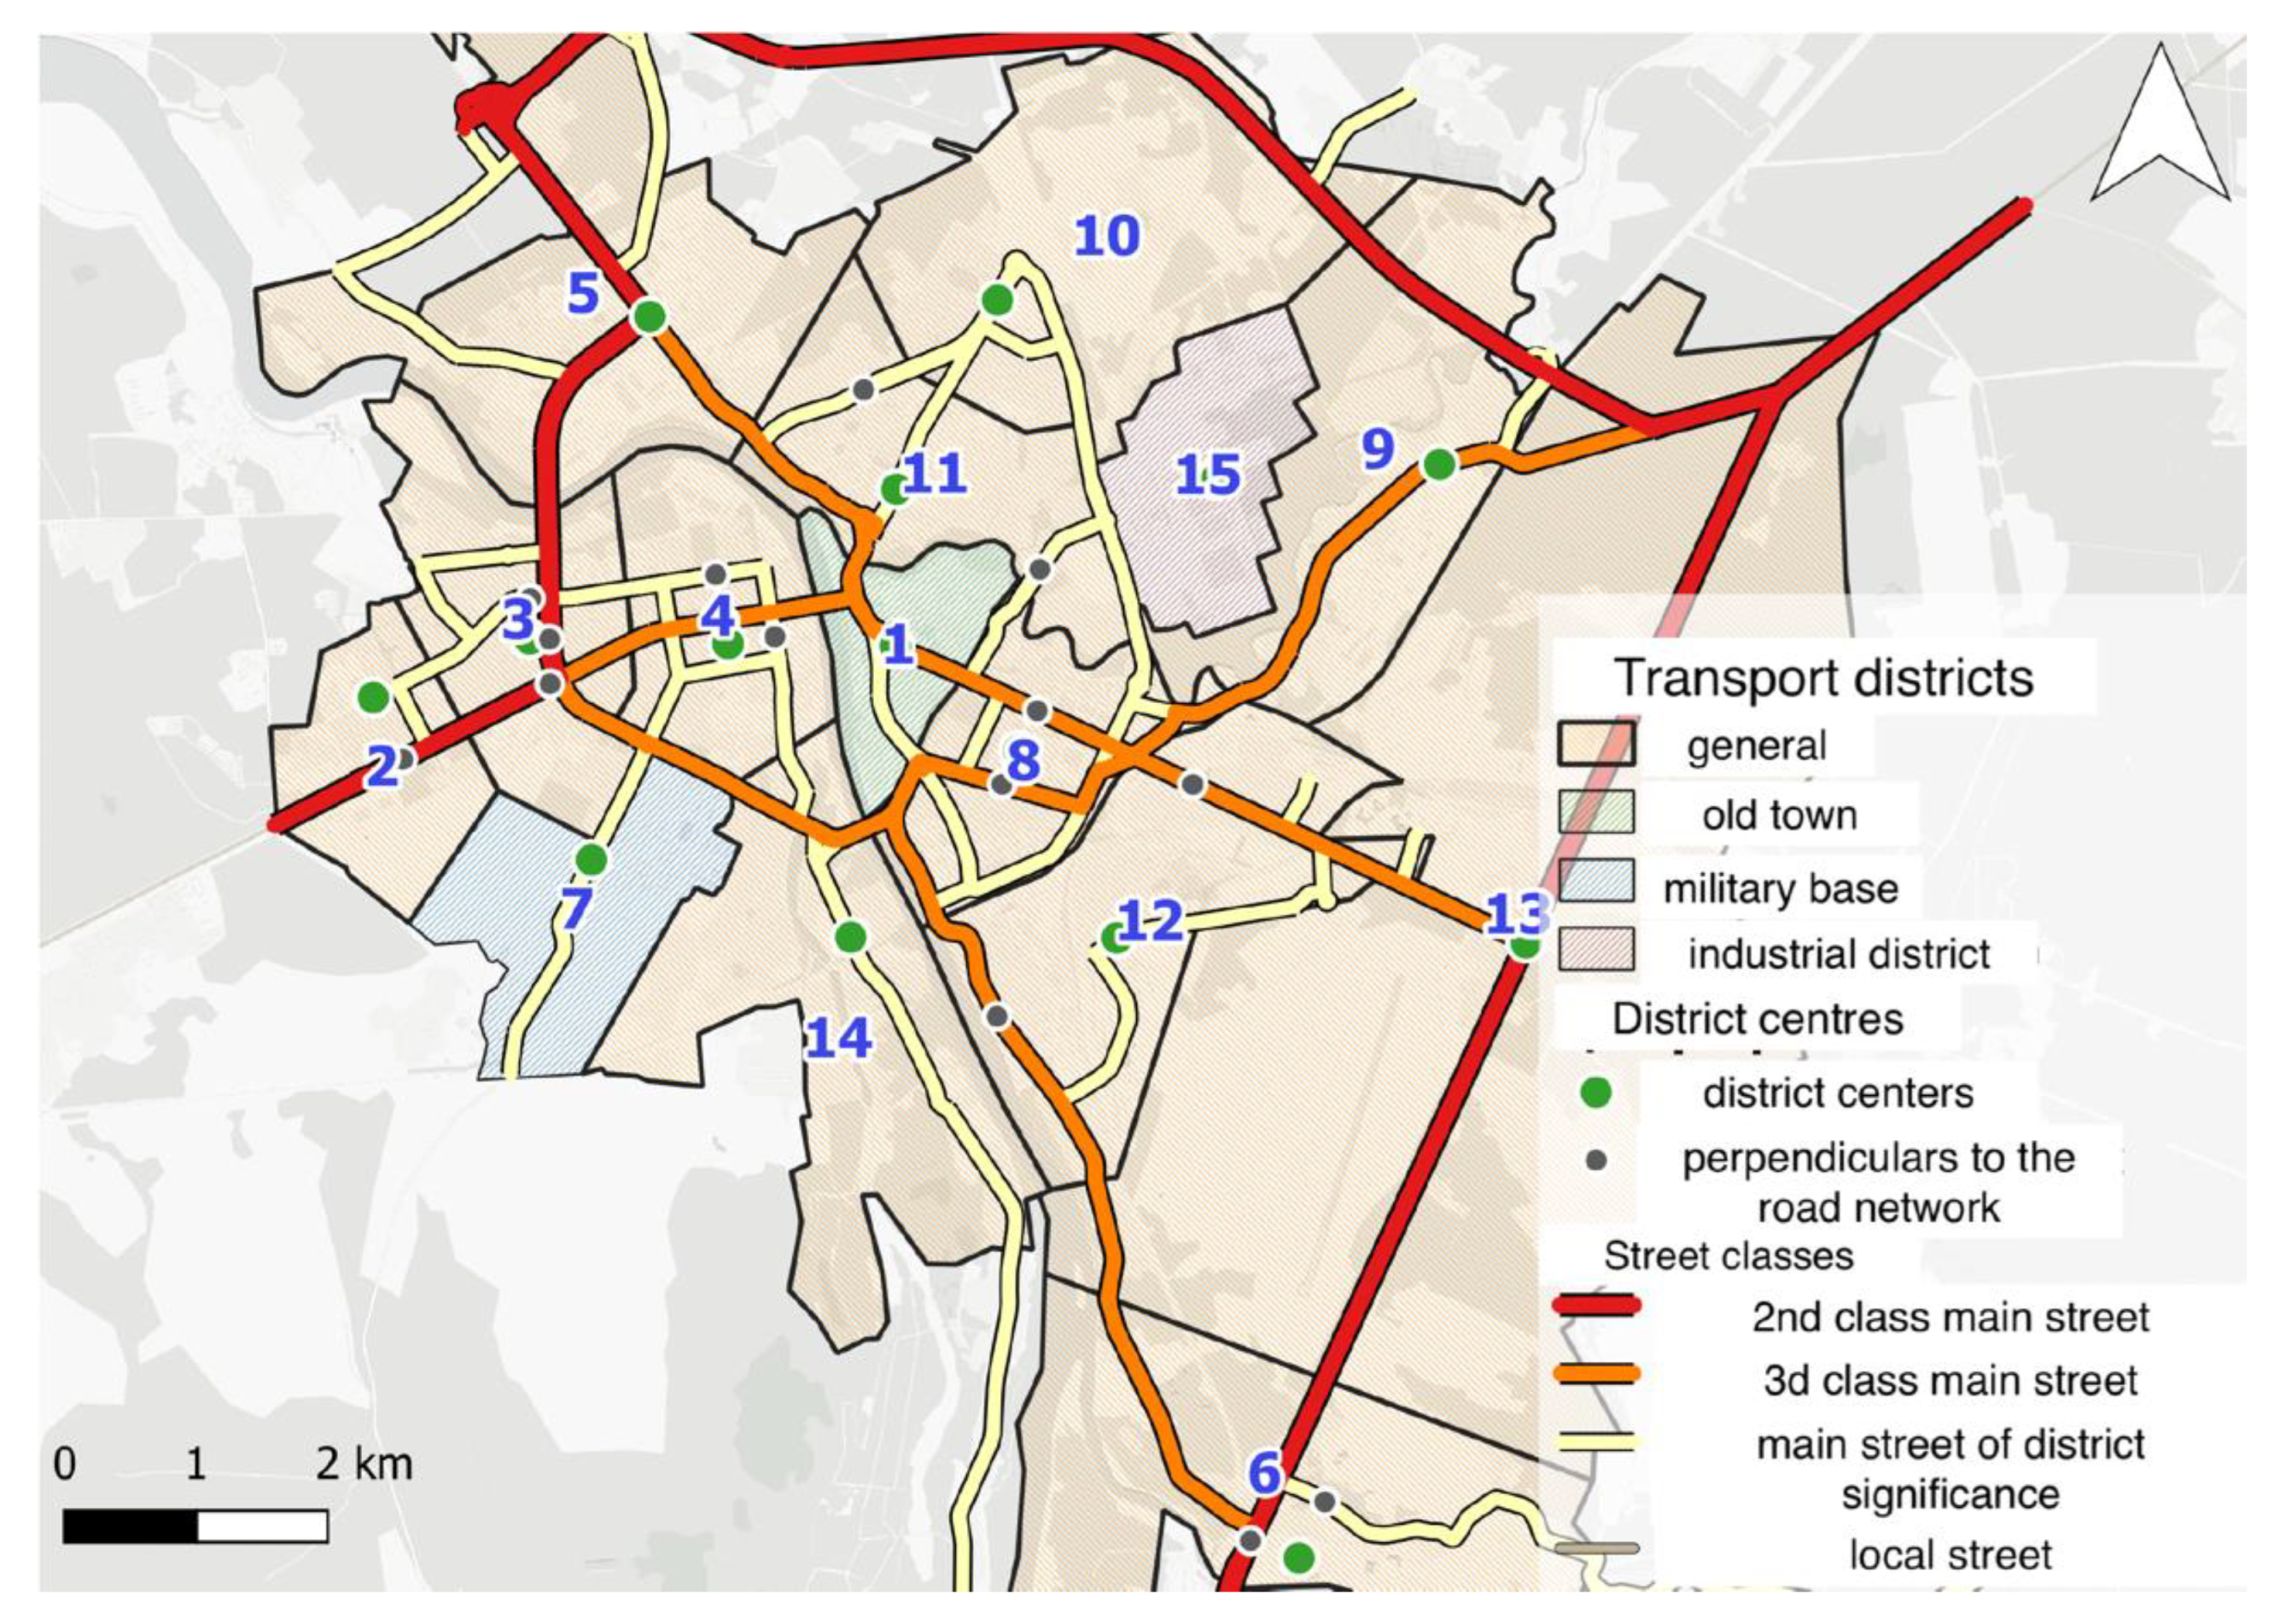
To calculate the trip matrix, it is necessary to define transport districts between which traffic will be calculated. Boundaries of the districts are primarily assumed to be natural geographical barriers of the city—rivers, railways, fortress walls. Districts are defined so that their borders lie on the geographical obstacles and main streets are their axial lines. The transport regions scheme of Pskov is shown in
Figure 4. In each transport region, the center of attraction is determined on the basis of its geometry, and also on concentration of residential buildings and labor areas. From the district centers, perpendiculars are drawn to the street road network (hereinafter referred to as the SRN) of the city.
A graph of the transport network used for calculation is assumed to be SRN areas, along which the PUPT routes pass, as well as areas of main roads and streets. The graph of the transport network is split into areas at the points of potential passenger flow change: at crossings and in the centers of transport areas. With a split according to this principle, 100 areas of the road graph have been obtained.
The hypothesis of the distribution of trips between transport attraction centers along the shortest routes has been assumed. Knowing the length of network graph areas, shortest trip routes between areas can be defined for the existing PUPT.
Trips taken by the city population by transport and on foot are associated with time spending. This “lost” time increases with the size of the urban area. Each resident seeks to spend less time on such trips, so they choose a place of work closer to their place of residence, and travel as little as possible for cultural and domestic purposes. Then, the time of a trip between districts “i” and “j” becomes the problem of transport communication between these districts. Correspondence time at the PUPT consists of the following components: walk time to the stopping point, the waiting time at the stopping point, the travel time by transport, the time for transfer (if necessary), and the time for walking to the destination point. The walking time to and from the stopping point is calculated for each center of the transport area and points to perpendiculars on the road network, taking into account non-linear coefficient of moving between transport areas. The waiting time of the PUPT and transfers are taken into account in the speed of movement along the RSN graph (speed of the PUPT message).
The volume of traffic on the PUPT will be 70% of the total trips volume. The trip matrix along the PUPT in total for labor and cultural/household trips is given in
Table 3.
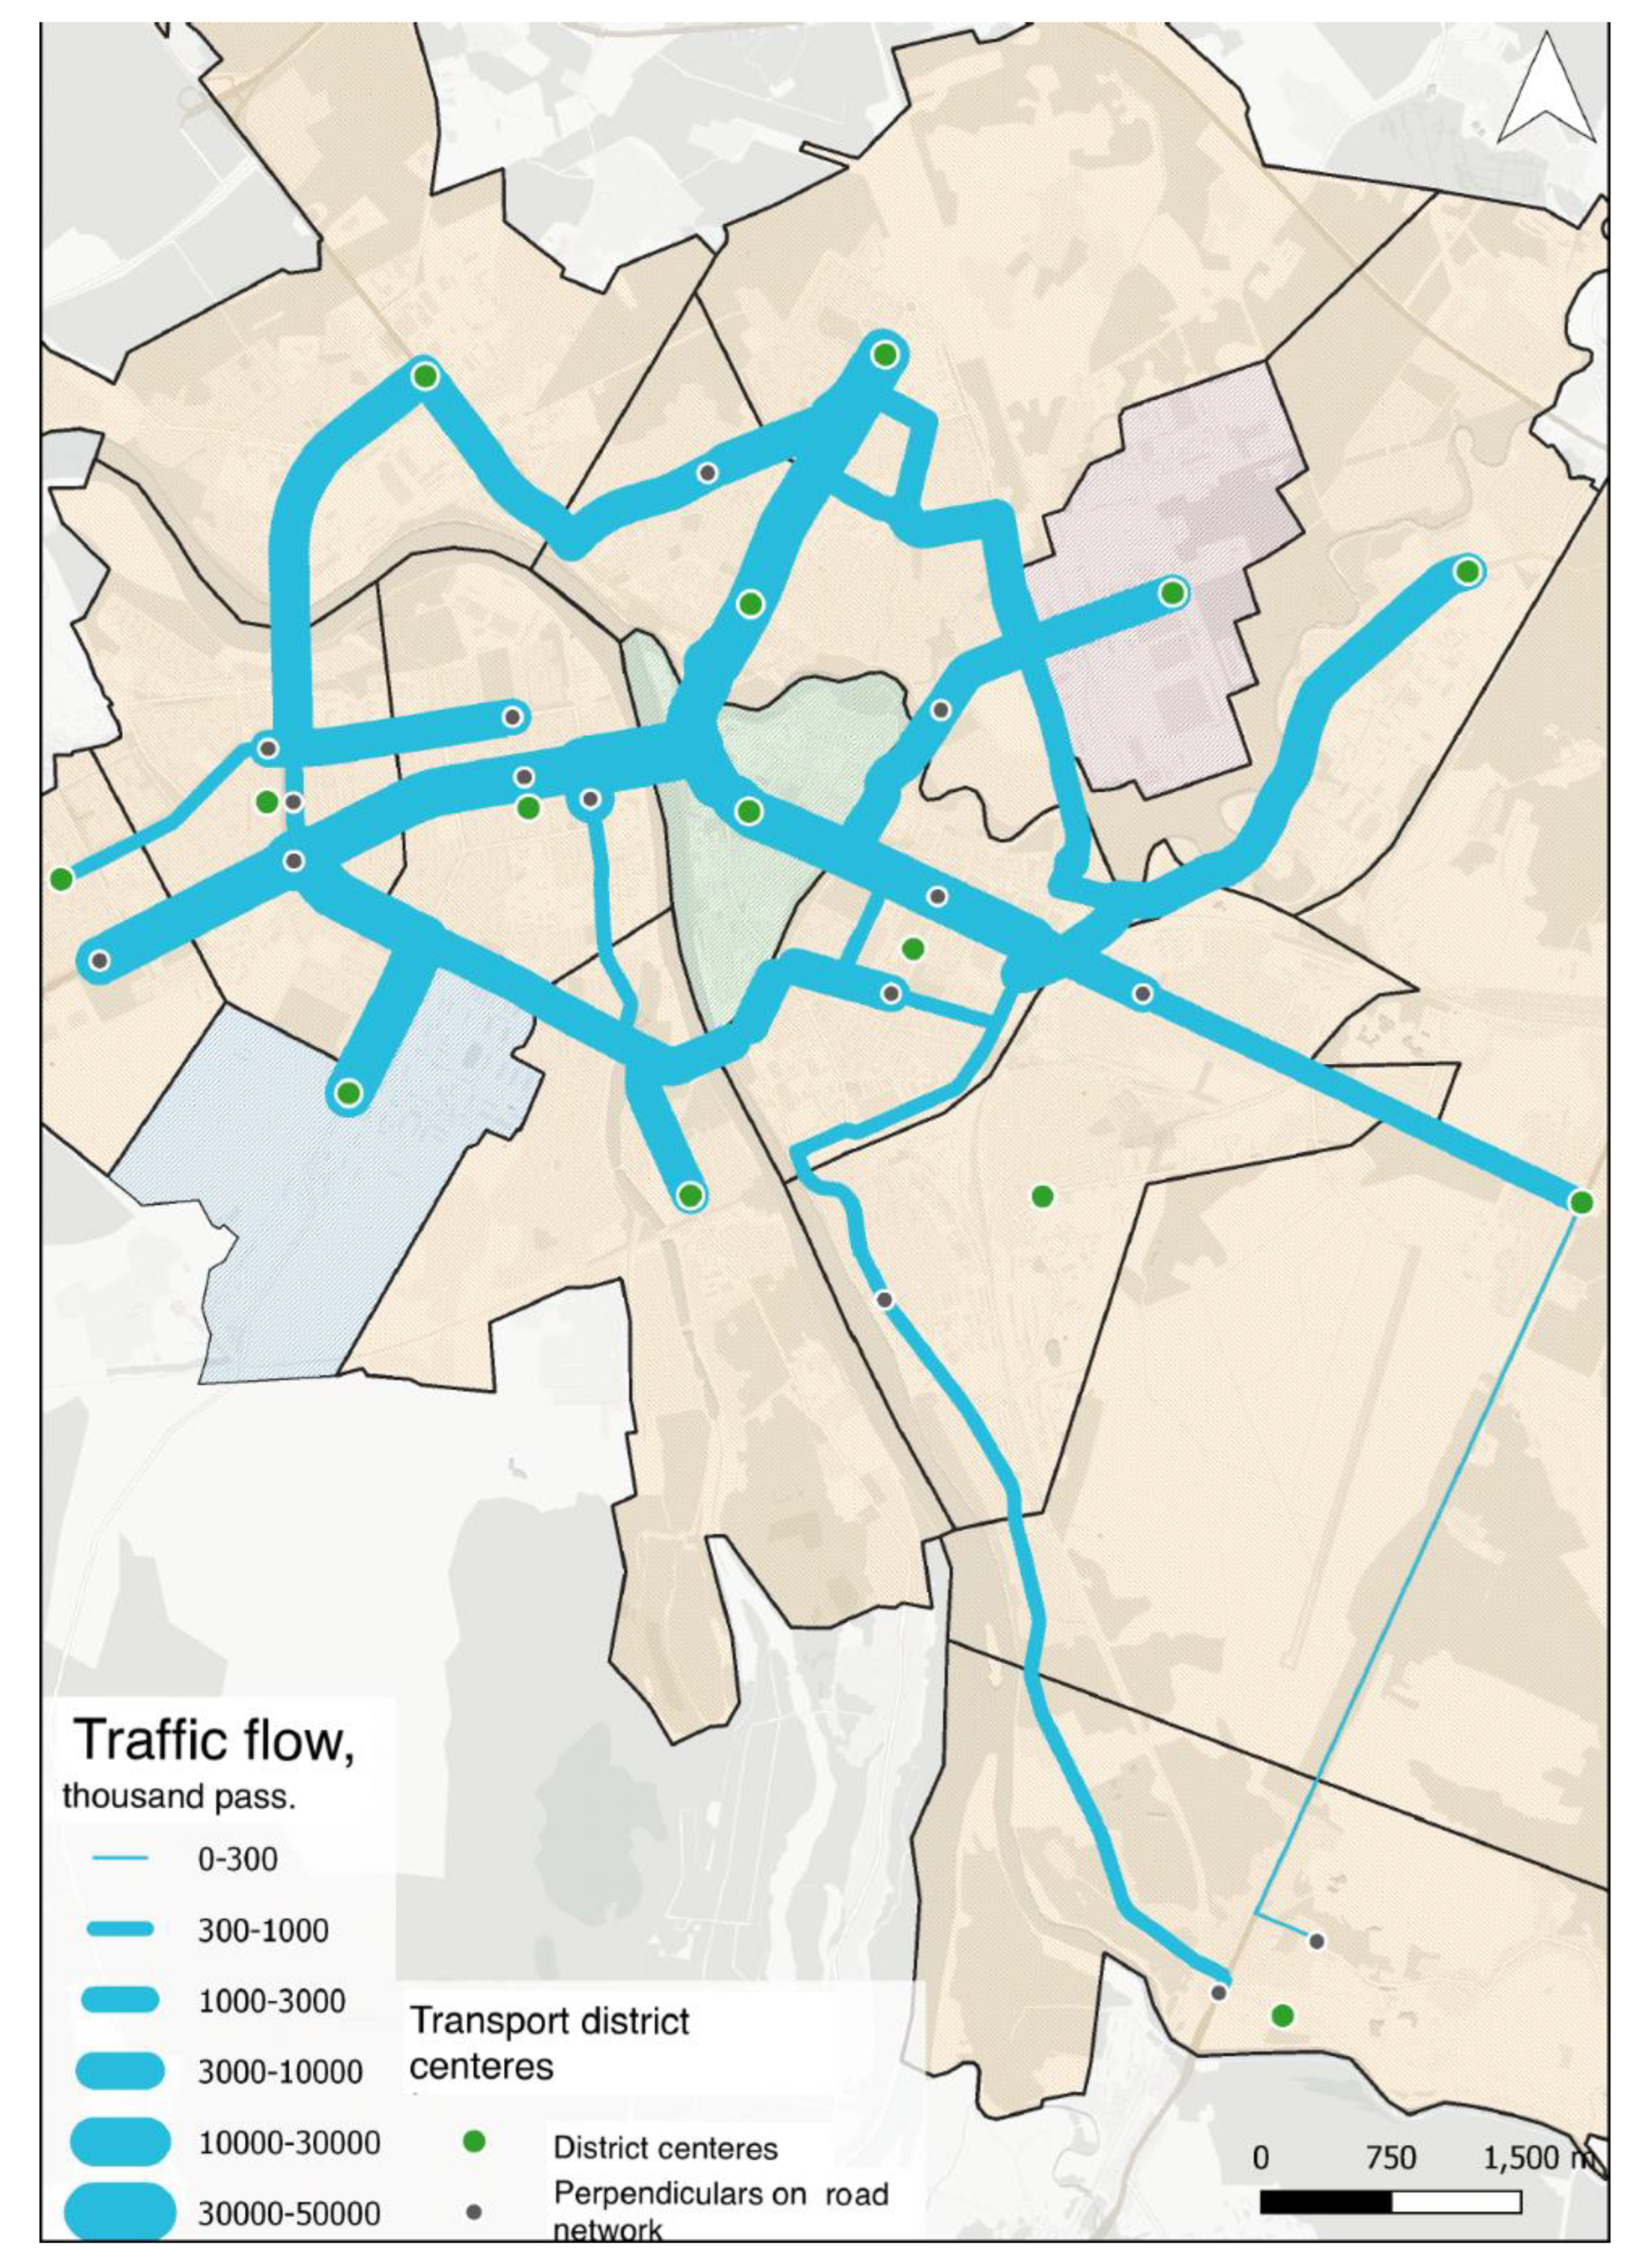
In accordance with trips thus obtained, a chart of the PUPT passenger flow can be built, as shown in
Figure 5. Values of passenger flows by areas are presented in
Table 4. Values gradation is indicated by color: minimum values—red and maximum values—green. Main passenger flows pass through the city center, as this route is the shortest for many trips. It is likely that future BRT routes will run from residential areas to the city center.
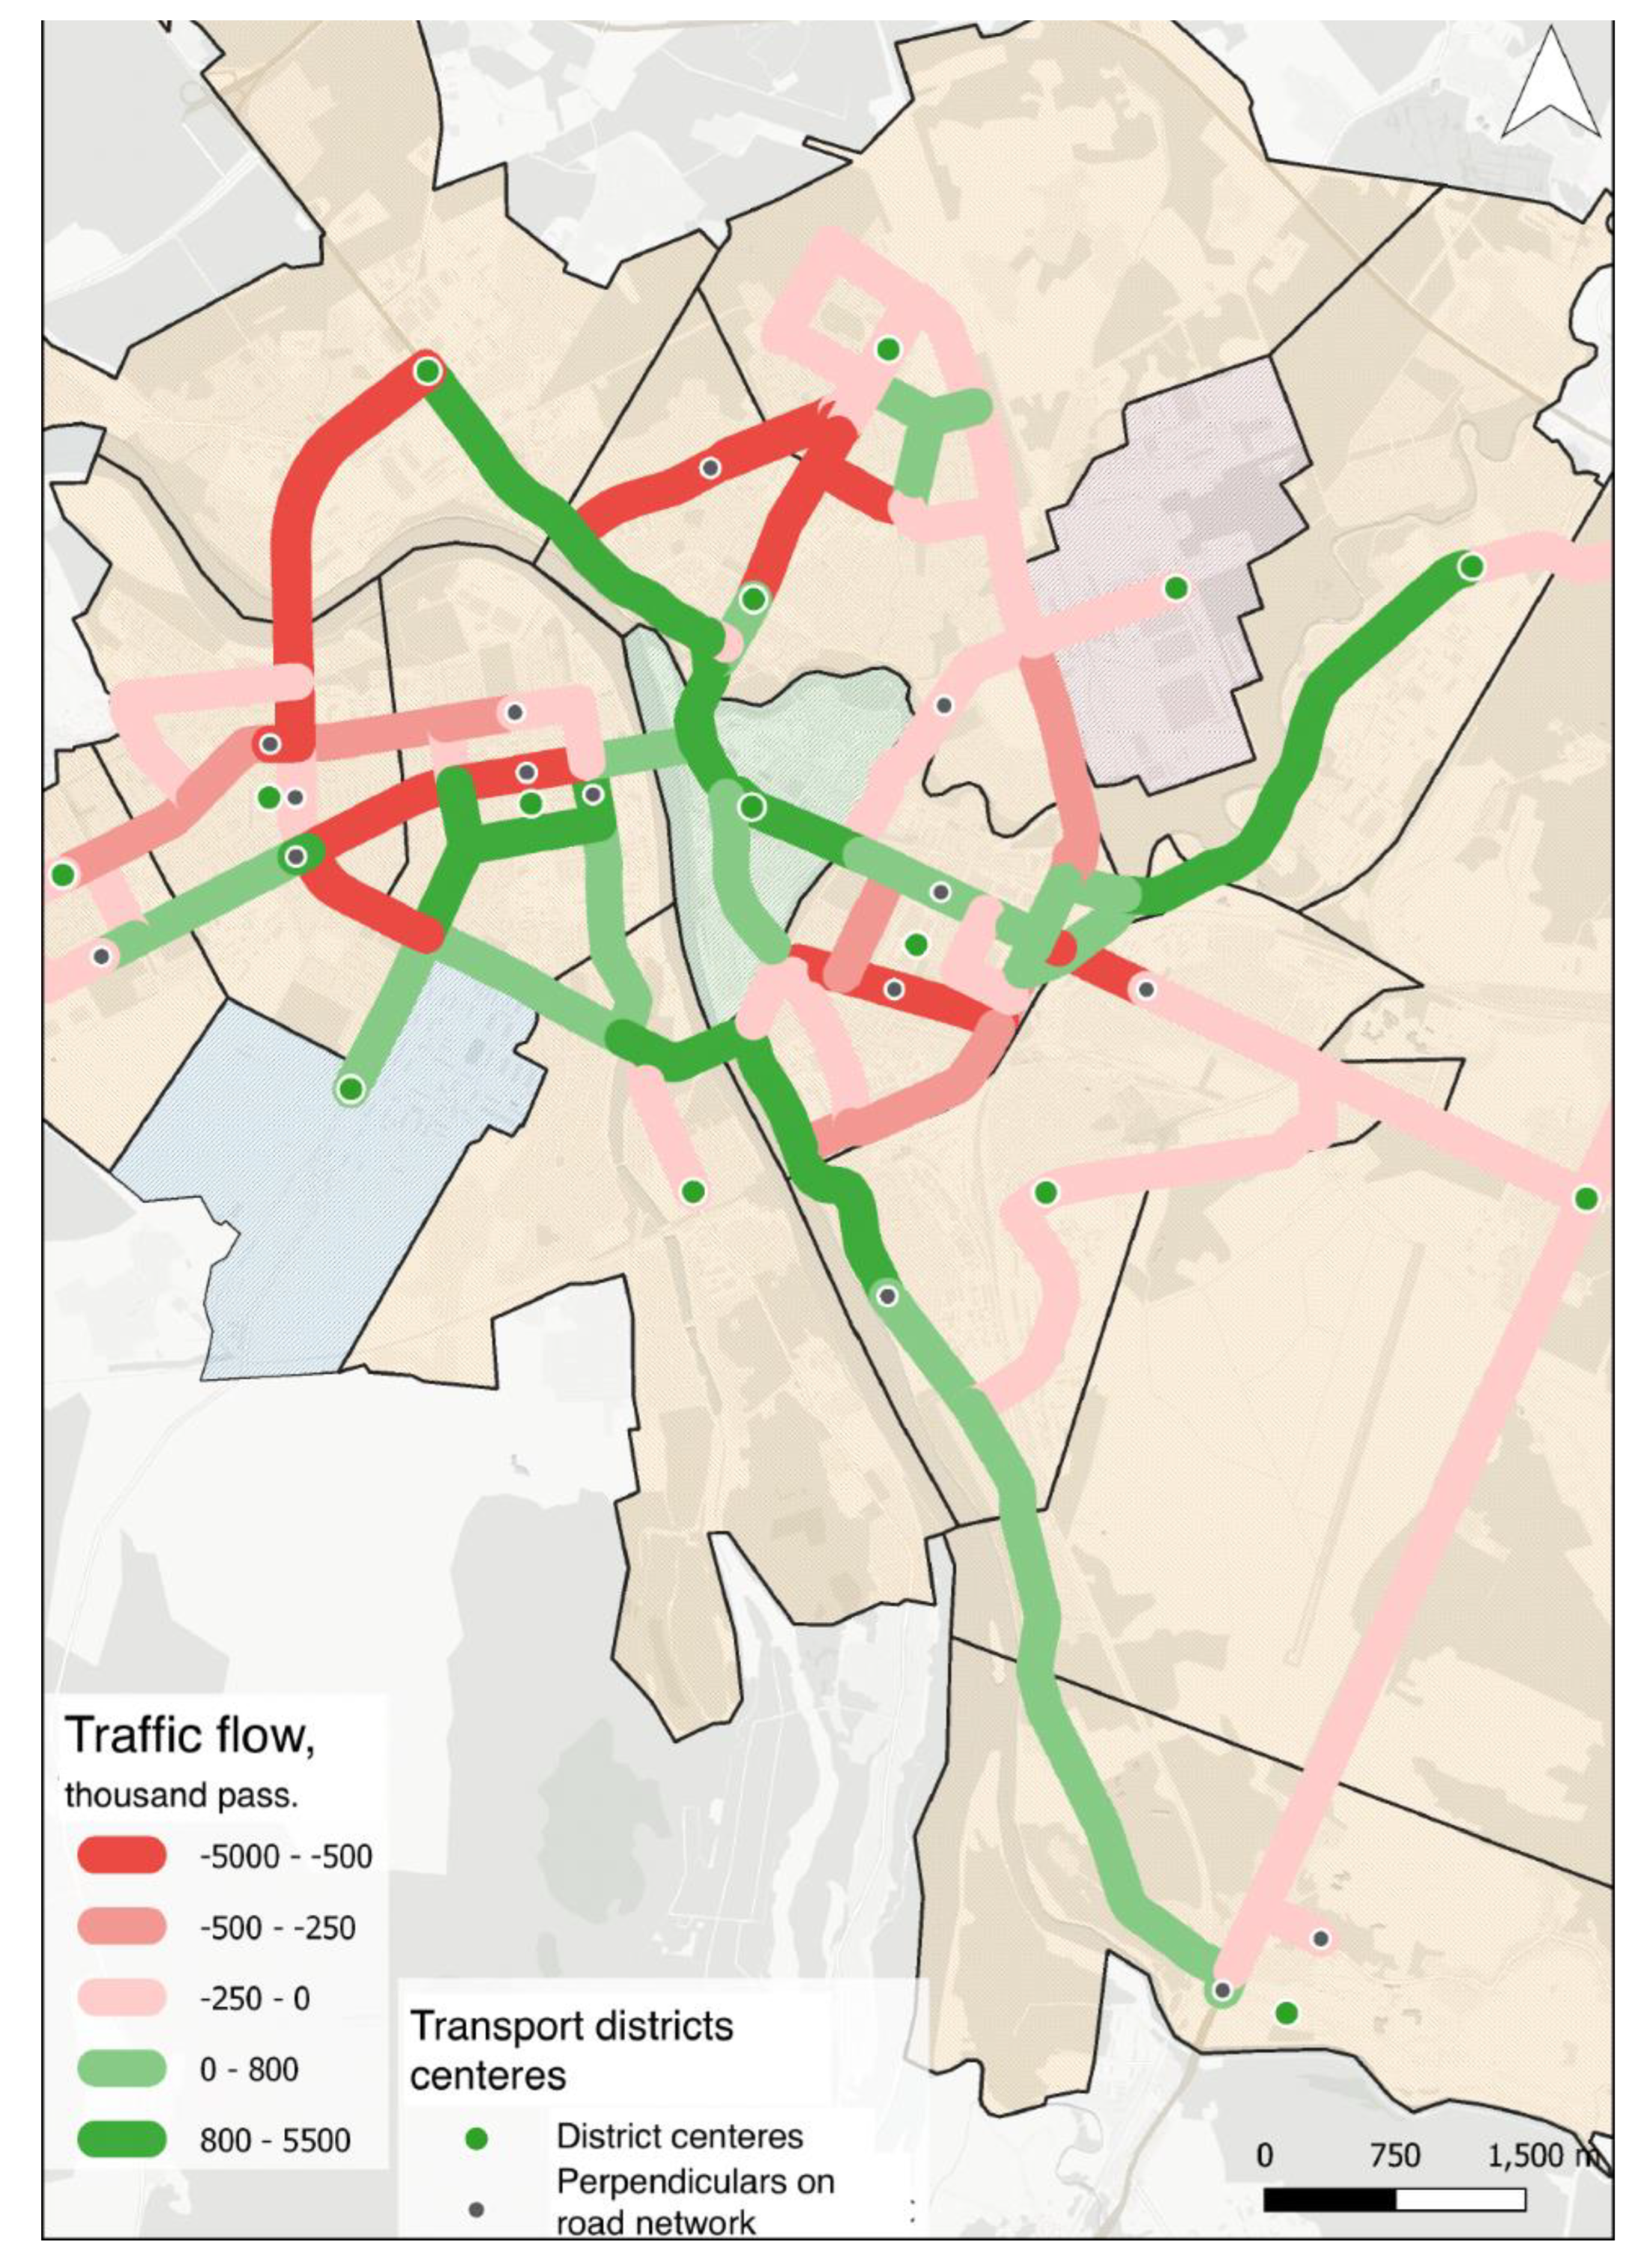
At the second iteration, 14 areas of the potential BRT network graph exceeded the passenger flow threshold value; at the next iteration, the speed of travel in these areas was assumed as 25 km/h. Detailed data presented at
Table 5 and
Table 6. Visualization presented at
Figure 6.
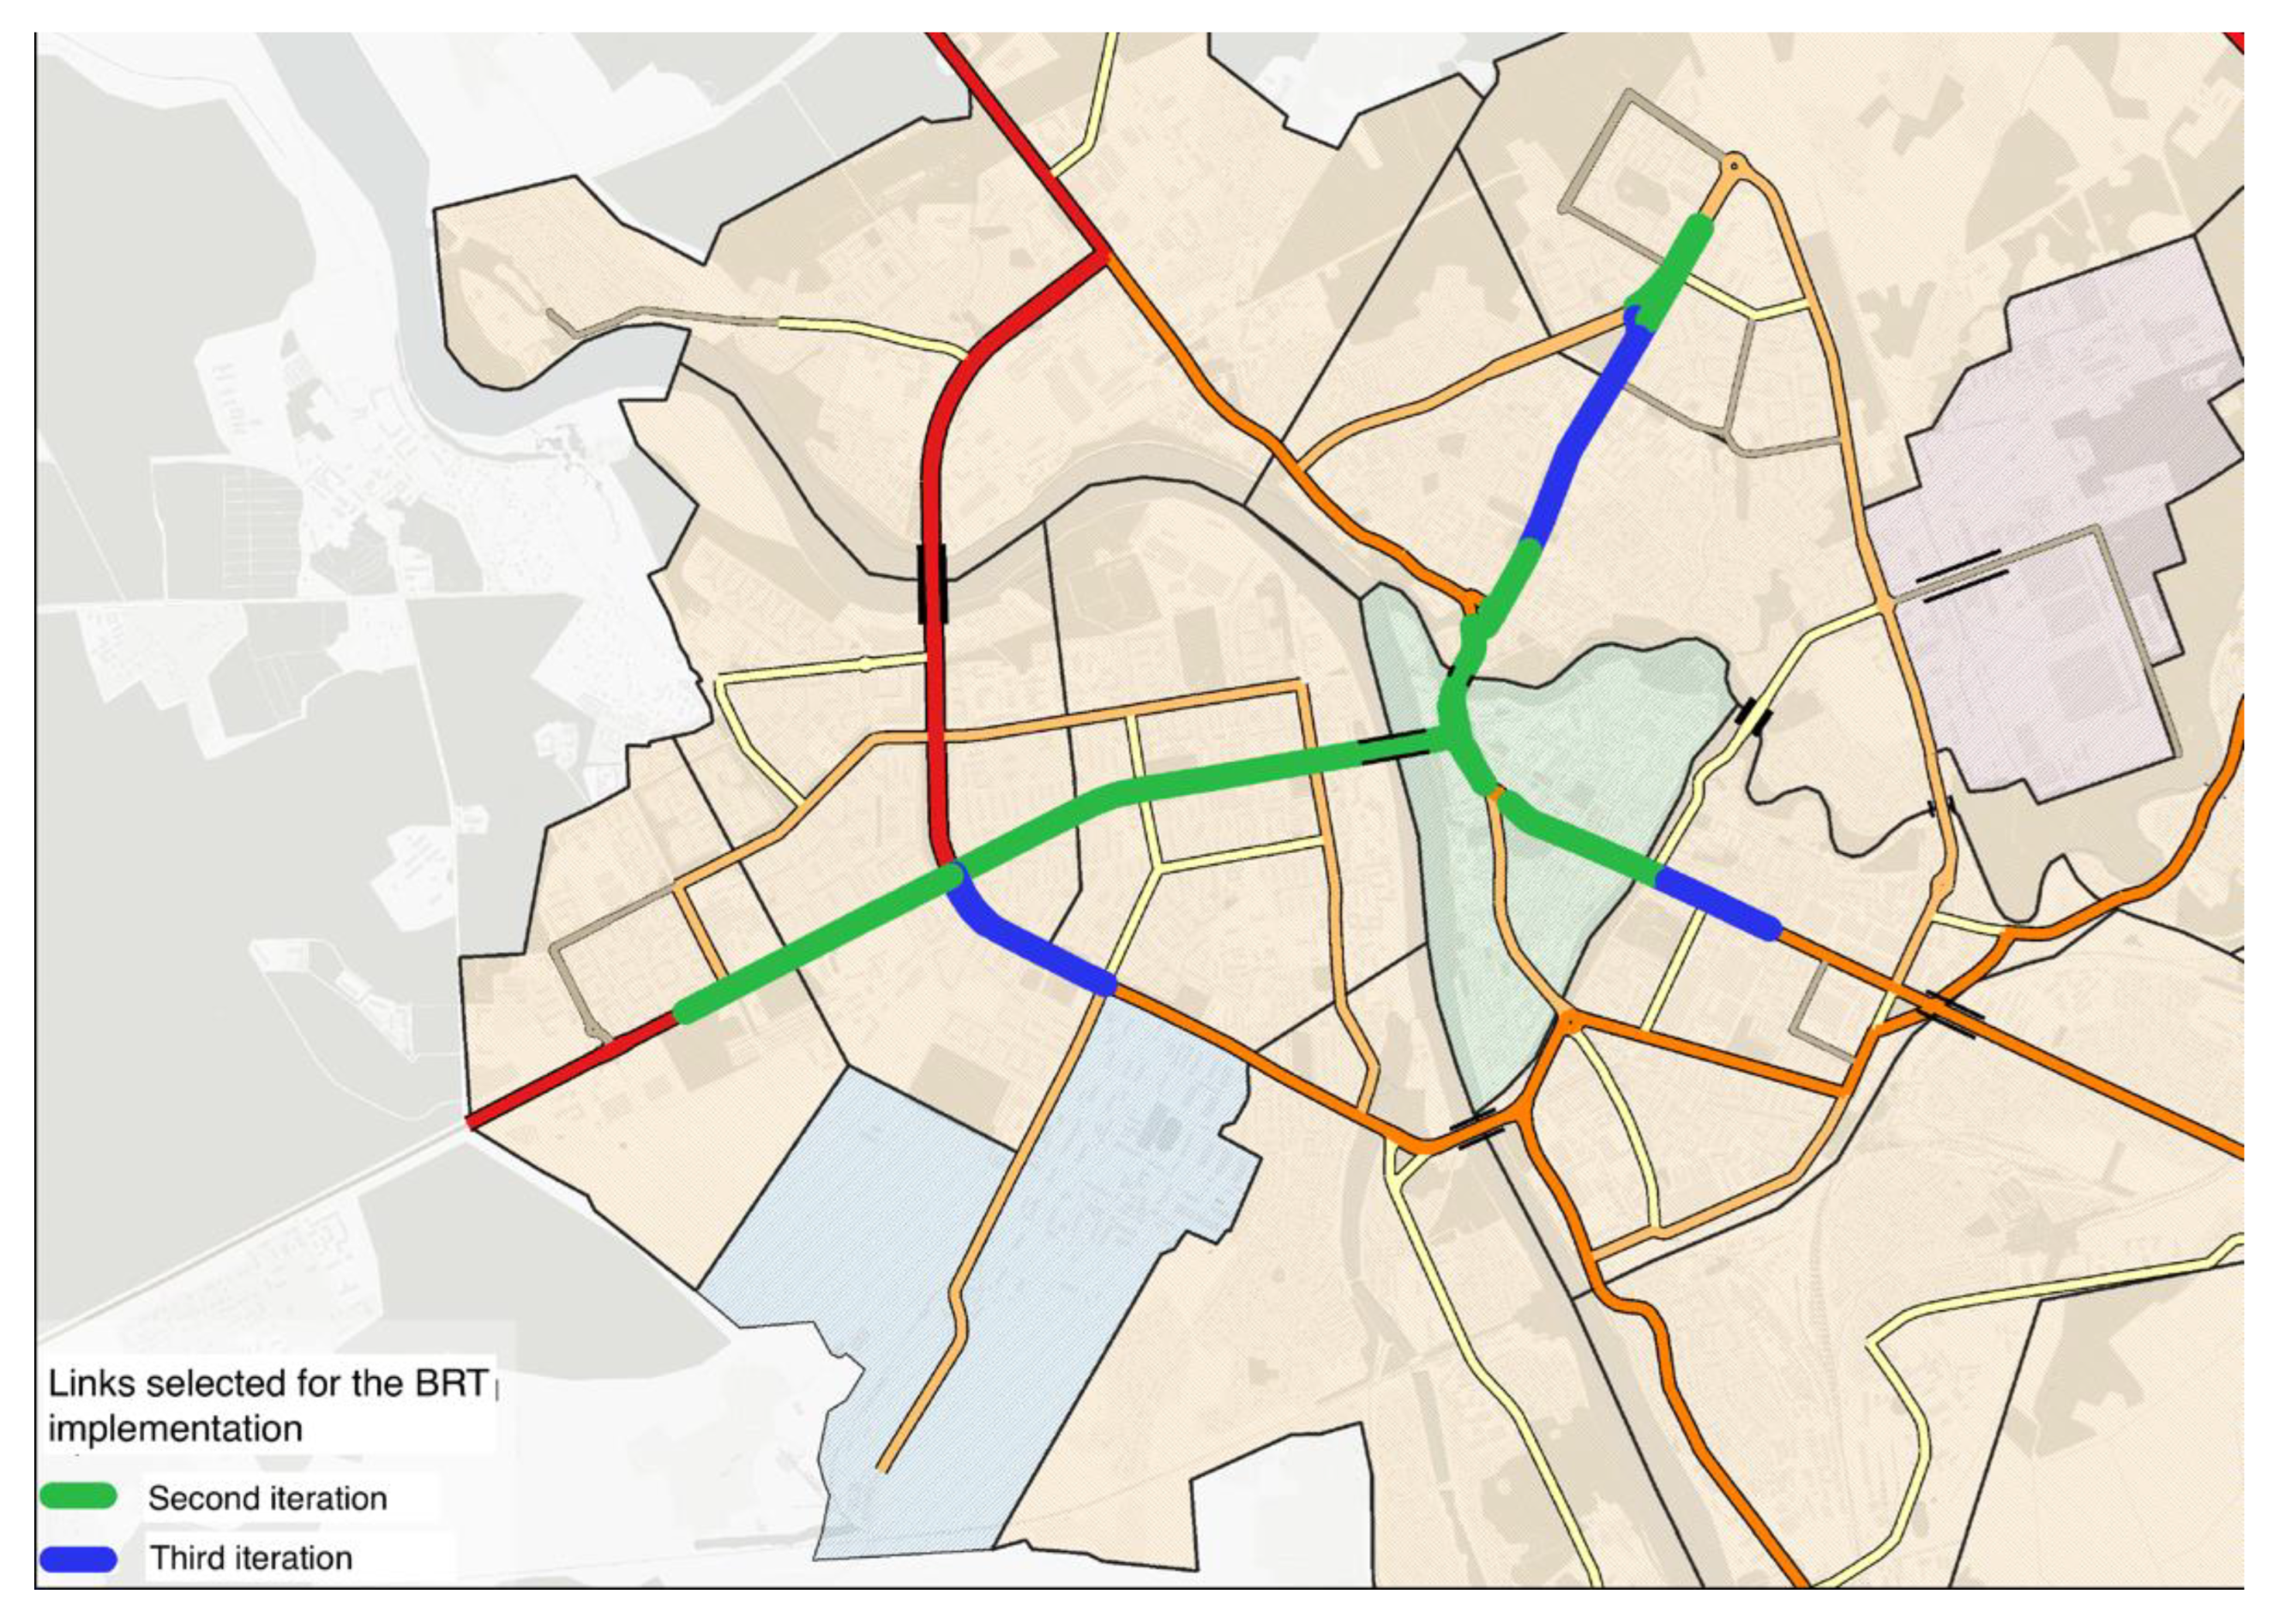
At the third iteration, the calculation of shortest routes was carried out for the same network as at the first iteration, since the areas of the shortest links used at the second iteration have not become effective enough to be included in the BRT network.
Figure 7 shows the areas selected for BRT laying following the results of iterations 2 and 3.
At the fourth iteration, the BRT network has not increased and the algorithm operation was completed.
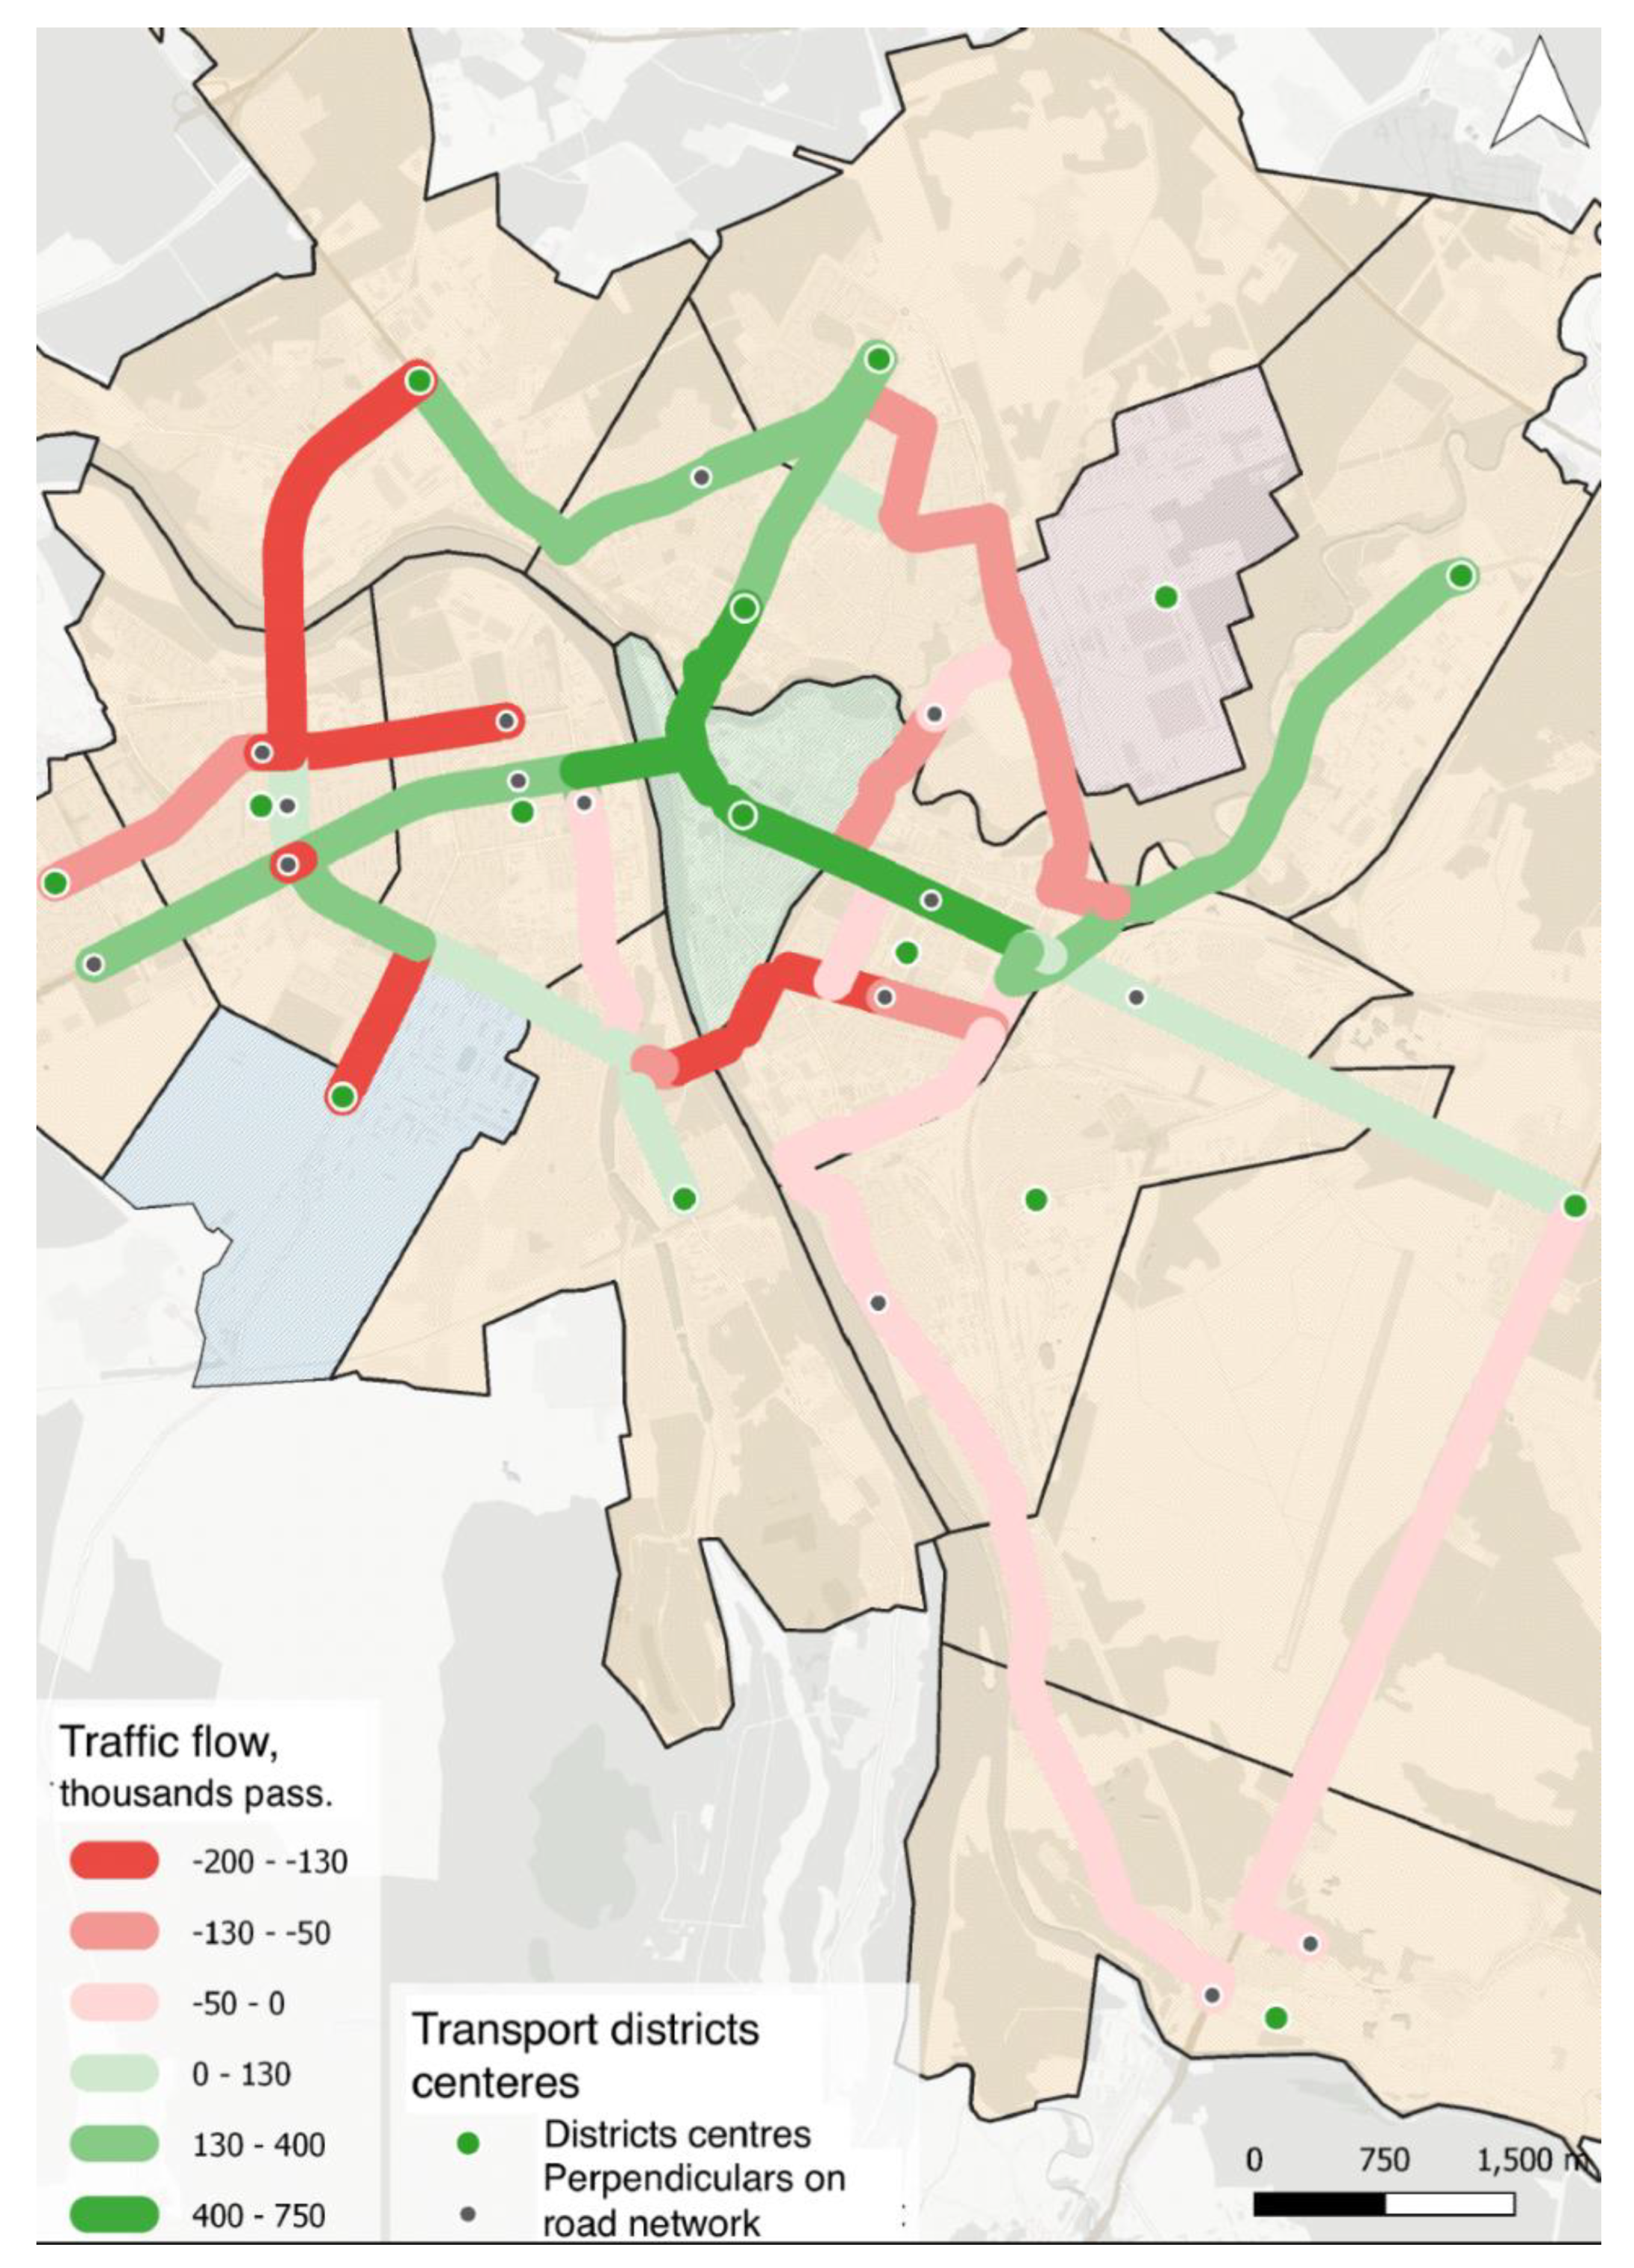
Table 7 and
Table 8 present the passenger flow for network areas at iterations 3 and 4, respectively;
Figure 8 visualizes the change in passenger flow between iterations 4 and 3. By adding new areas to the BRT network at iteration 3, the trip time through these areas reduced, which led to an increase in the probability of travel between the associated areas. In the chart it can be seen that the increase in travel speed in several areas led to significant changes in the attraction system. Passenger flow has increased both in BRT areas and in adjacent areas.
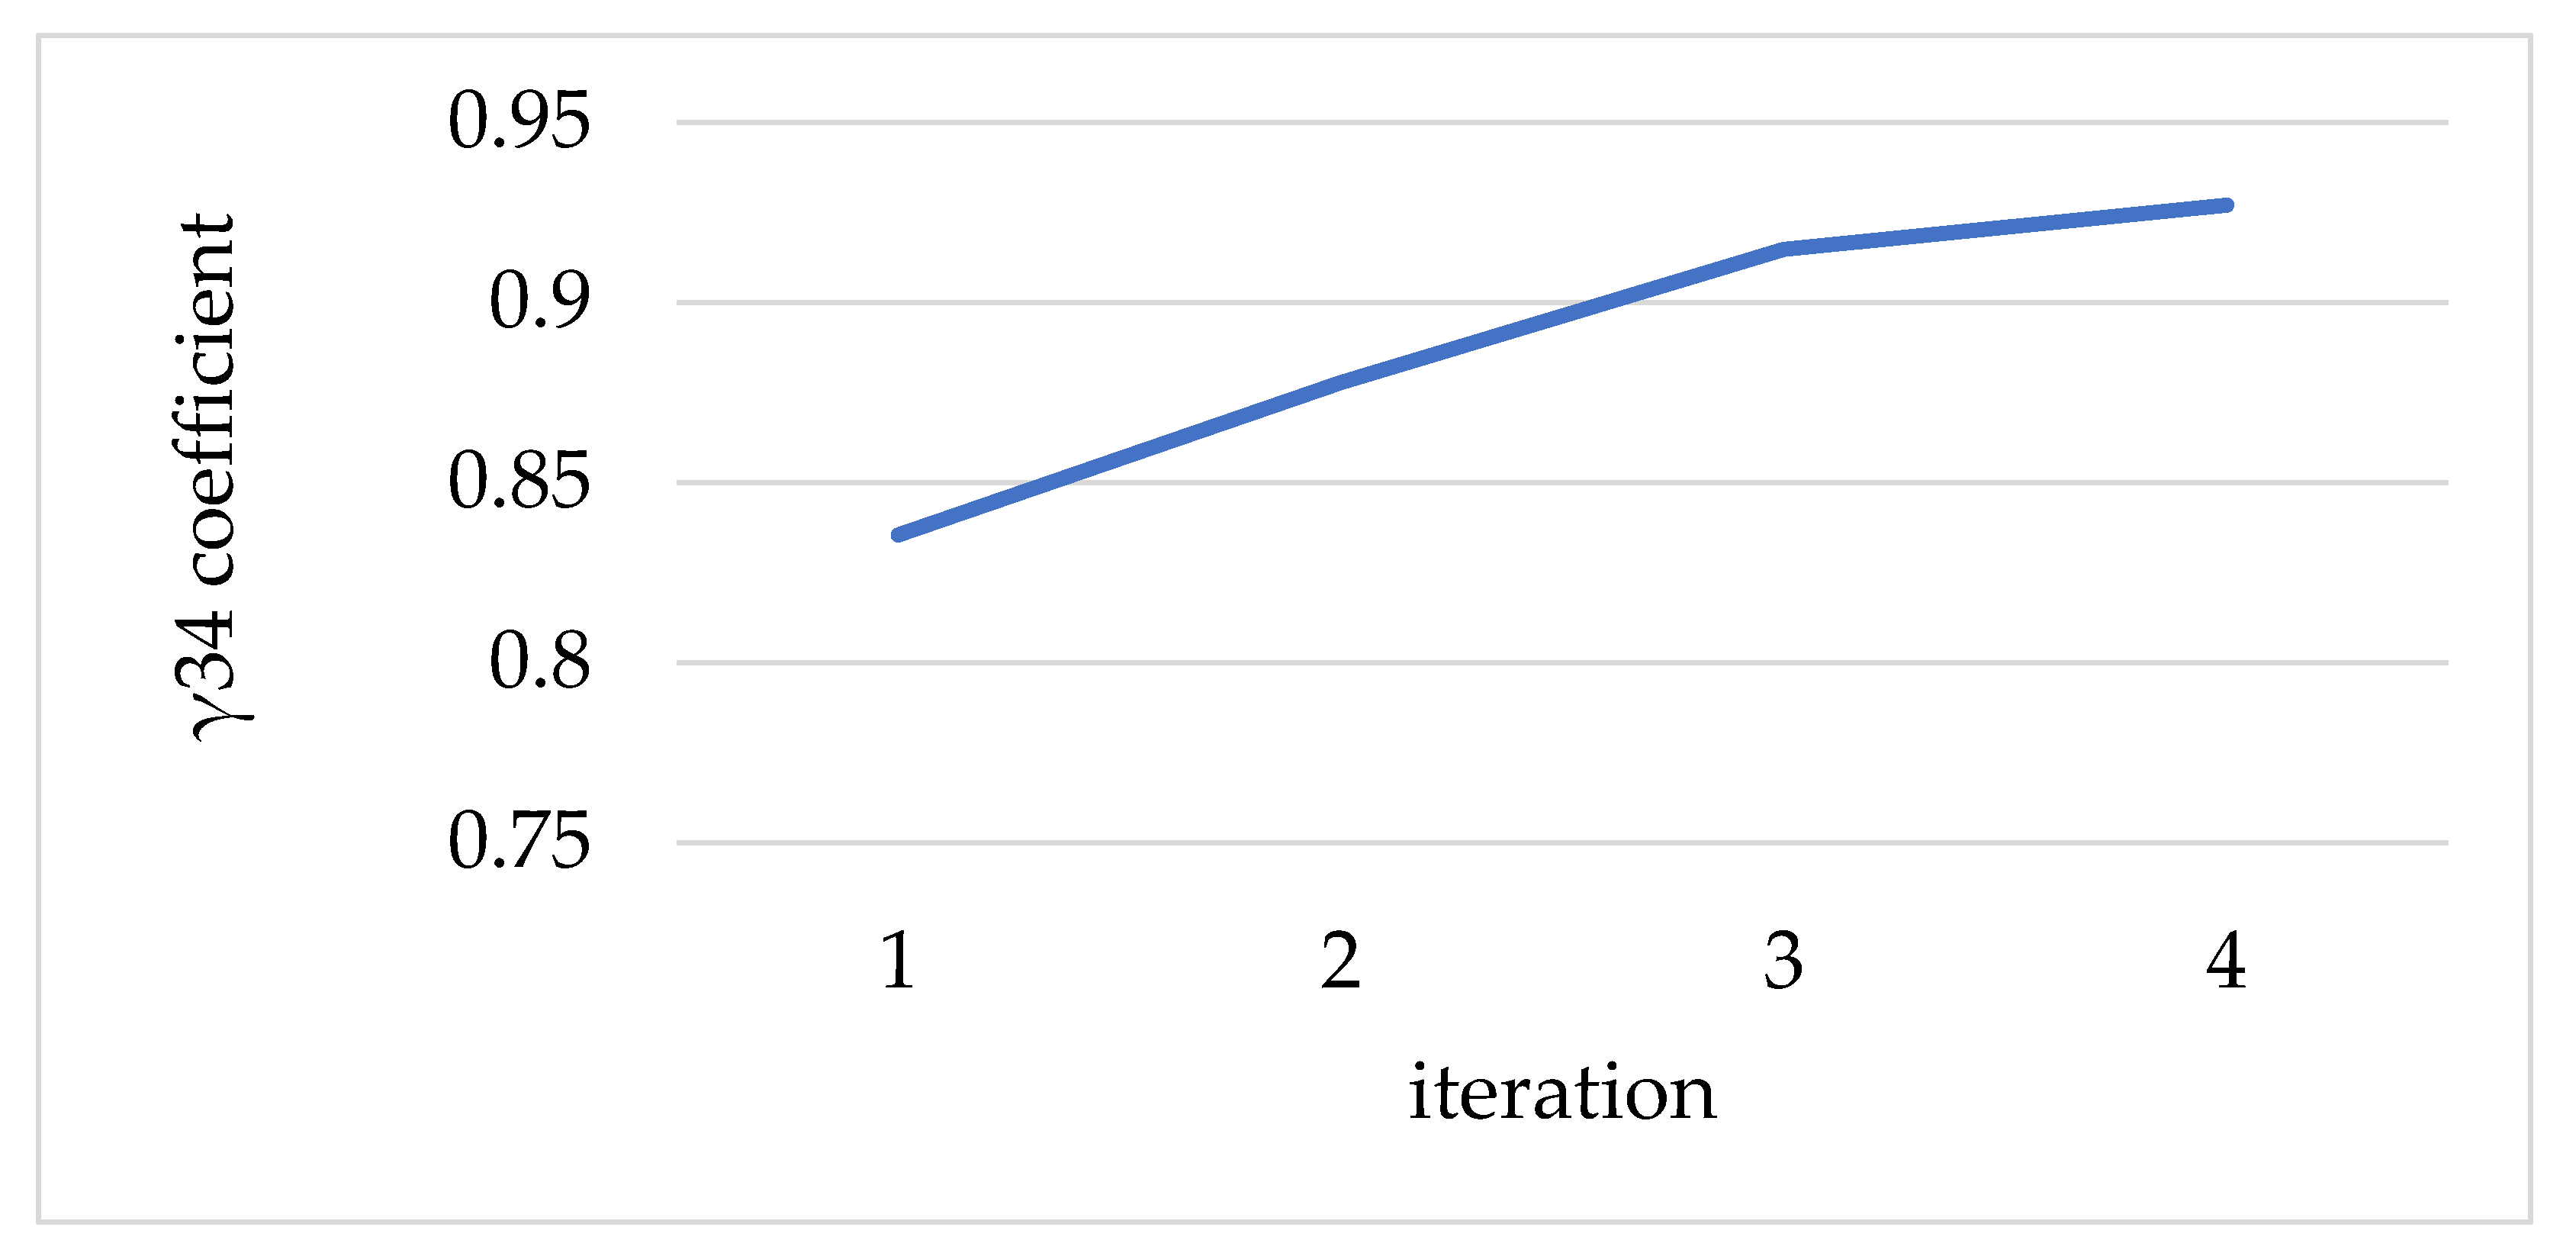
Figure 9 shows a graph of coefficient γ34 changes by iterations. The graph shows how the share of labor commuting trips taking up to 34 min increased at the second iteration. However, at iteration 2 there was no rapid transit network yet. The coefficient increased due to the use of shortest links, which were added to the network as an alternative. Nevertheless, at the 3rd and 4th iterations, these were not included in the SRN reference graph for calculation because of low passenger flow therein. Values at iterations 3 and 4 show the rapid bus introduction effect. Moreover, an increase in the coefficient with an increase in the network length between iterations 3 and 4 is visible. At iteration 3, the coefficient was 0.91, which is 8% higher than 0.84 base value. At iteration 4, the coefficient was 0.93, which is 10% higher than the base value and 2% higher than at iteration 3.
Thus, the hypothesis about the iterative increase in the network is confirmed. Passenger flow in areas that were included in the BRT system at iteration 3 has not reached the economically viable value of 14,000 thousand passengers/year at the second iteration. Due to the increase in travel speed in areas included in the BRT system after iteration 2, passenger flow increased in adjacent areas, which were included in the BRT system at iteration 3.
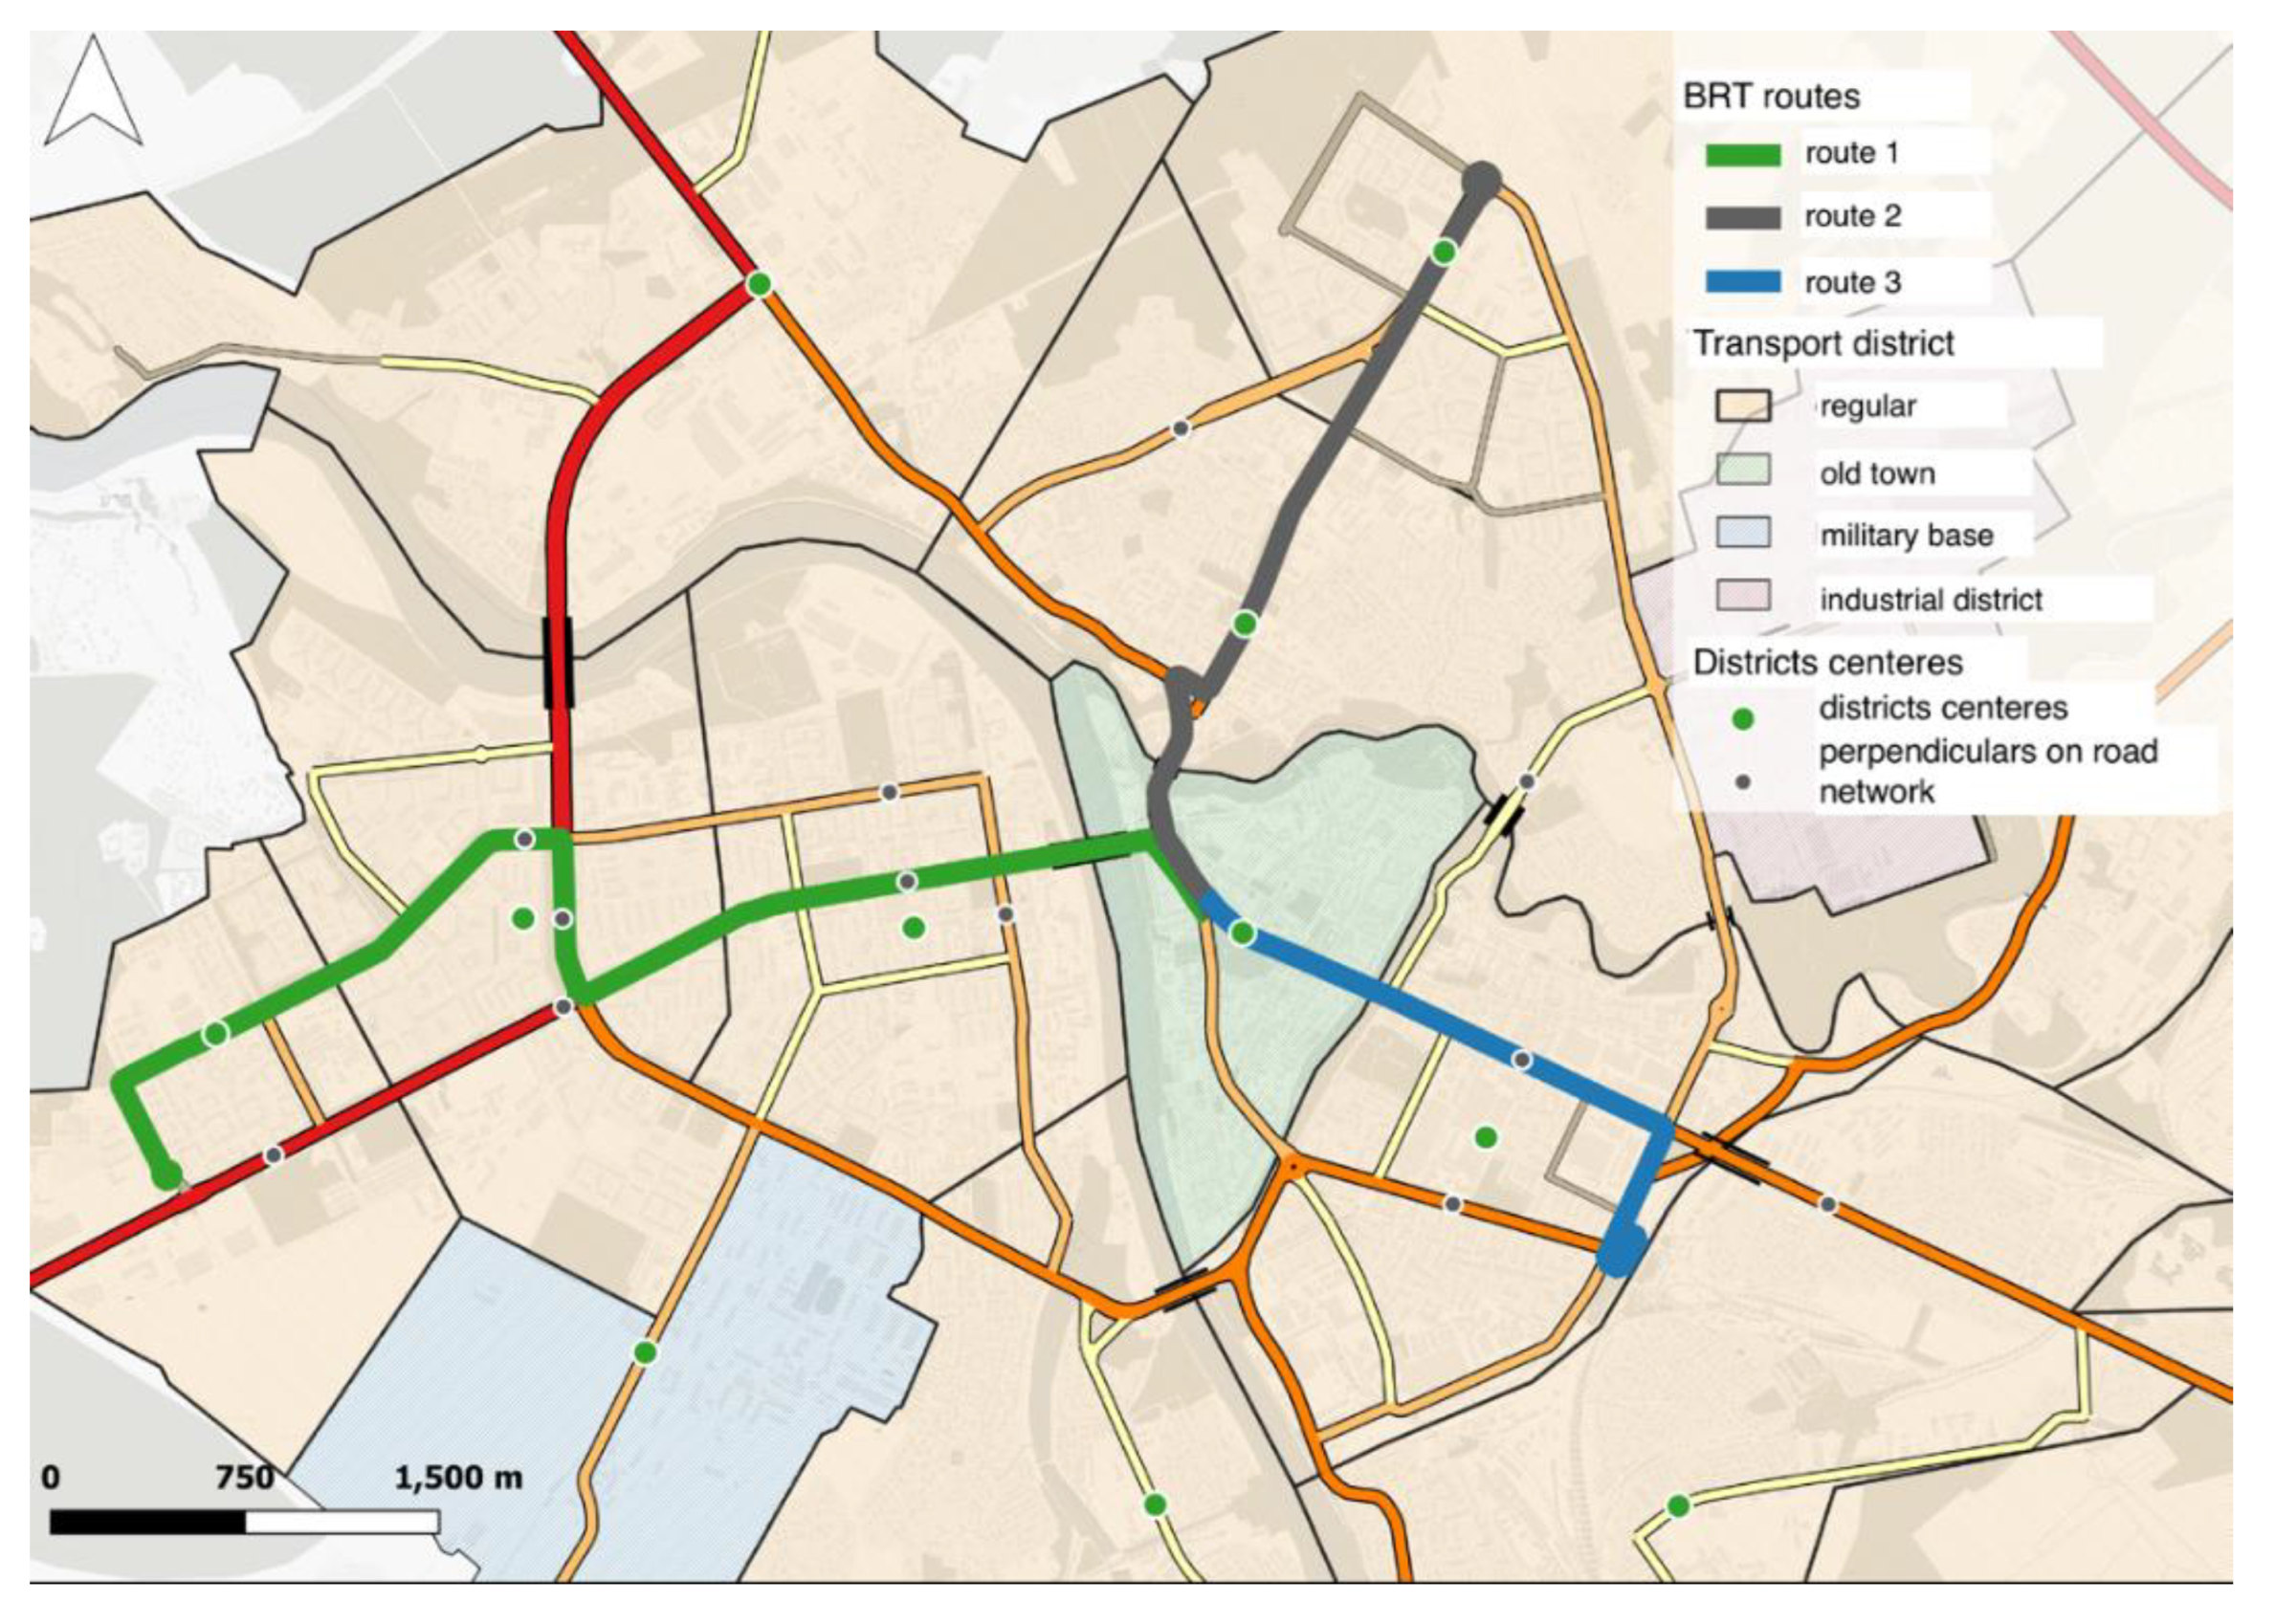
To define the economic viability of the proposed methodology, it is necessary to calculate the BRT network passing along the corridors selected in the previous section. As a result of the calculation, 3 service corridors were outlined. On their basis, 3 routes were formed as shown in
Figure 10.
Operation parameters of the proposed routes are given in
Table 9.
The cost of a 1 km run calculated in accordance with the Order of the RF Ministry of Transportation of 20.10.2021 No. 351 [
34] amounted to RUB 106.86/km. Taking into account lease payments for vehicles, the cost of the first year of operation will be RUB 249.5 million. Capital expenditures include the construction of boarding platforms, a bus depot, control center equipment, terminals, and also measures to ensure PUPT priority passage and the installation of ticket vending machines, and a toll collection system. In total, estimated costs will amount to about RUB 2.1 billion as presented in
Table 10.
Toll for PUPT transportations in Pskov is RUB 27 in cash. The calculation of profit from each passenger has to take into account availability of discount tickets and transport cards, and since the ratio of passengers using different tickets is restricted information, we assume that for 1 passenger, the carrier will receive RUB 14 revenue on average. Based on the annual passenger flow, the profit from passenger transportation will amount to RUB 450 million. The profitability amounted to 1.8. Profitability level is the ratio of the system operation profit to the cost of operation.
High profitability level is not typical of traditionally subsidized PUPT systems and depends on a number of factors. Routes pass along the main streets of the city connecting “bedroom” districts with the center. Within the model, BRT does not compete with other PUPT types, serving all public transport users travelling through BRT areas. Moreover, due to the fact that route 1 crosses the Olginsky Bridge connecting two banks of the Velikaya River and route 2 crosses the Sovetsky Bridge across the Pskova River, as well as due to the accepted hypothesis of commuting between transport areas by shortest links, this route system serves most of PUPT trips in the city. As a whole, this provides high passenger flow on relatively short routes, which in turn ensures high route efficiency.
The organization of BRT on the main highways of the city will reduce the capacity for road transport. On all 3 routes, the width of the carriageway at the narrowest points is 2 lanes in each direction. At the same time, on routes 1 and 2 it is limited by the width of the bridges. In the places where stopping points are located, it is possible to organize the local widening of the carriageway in order to maintain traffic capacity. It is also possible to create widening-accumulators for turning cars in order to separate flows and maintain the traffic capacity of UTS intersections.
At the same time, if we calculate the capacity of the lane not in units of transport, but in the number of passengers carried, then the capacity of the streets where BRT traffic is organized will increase significantly. Thus, one traffic lane in urban conditions passes 600–800 vehicles per hour [
35]. On average, 1 to 2 people travel in one car, so it is 600–1600 passengers per hour. The PUPT can carry up to 8000 passengers per hour on a dedicated lane (80 articulated buses per hour with a capacity of 100 people). At the same time, any resident can use public transport, and only those with a driver’s license can use the lane for cars. In addition to this, it can be said that reducing the intensity of road transport in the city center will improve road safety, reduce pollutant emissions, and reduce noise levels.
With the advent of the mainline public transport mode, the share of PUPT users in Pskov will increase insignificantly, due to the high current rates for using public transport and low motorization levels. However, this will help optimize route networks, schedules, and, as a result, increase the efficiency of using each vehicle, which will reduce specific costs and pollutant emissions per one passenger. When designing such a system, it is necessary to calculate the economic model of transportation, taking into account all the routes of the PUPT, and also compare it with the current model, evaluating the effects of creating BRT.


 ,
, 


