
Continuous Improvement of VIVA-Certified Wines: Analysis and Perspective of Greenhouse Gas Emissions


Abstract
1. Introduction
2. Literature Review
3. Materials and Methods
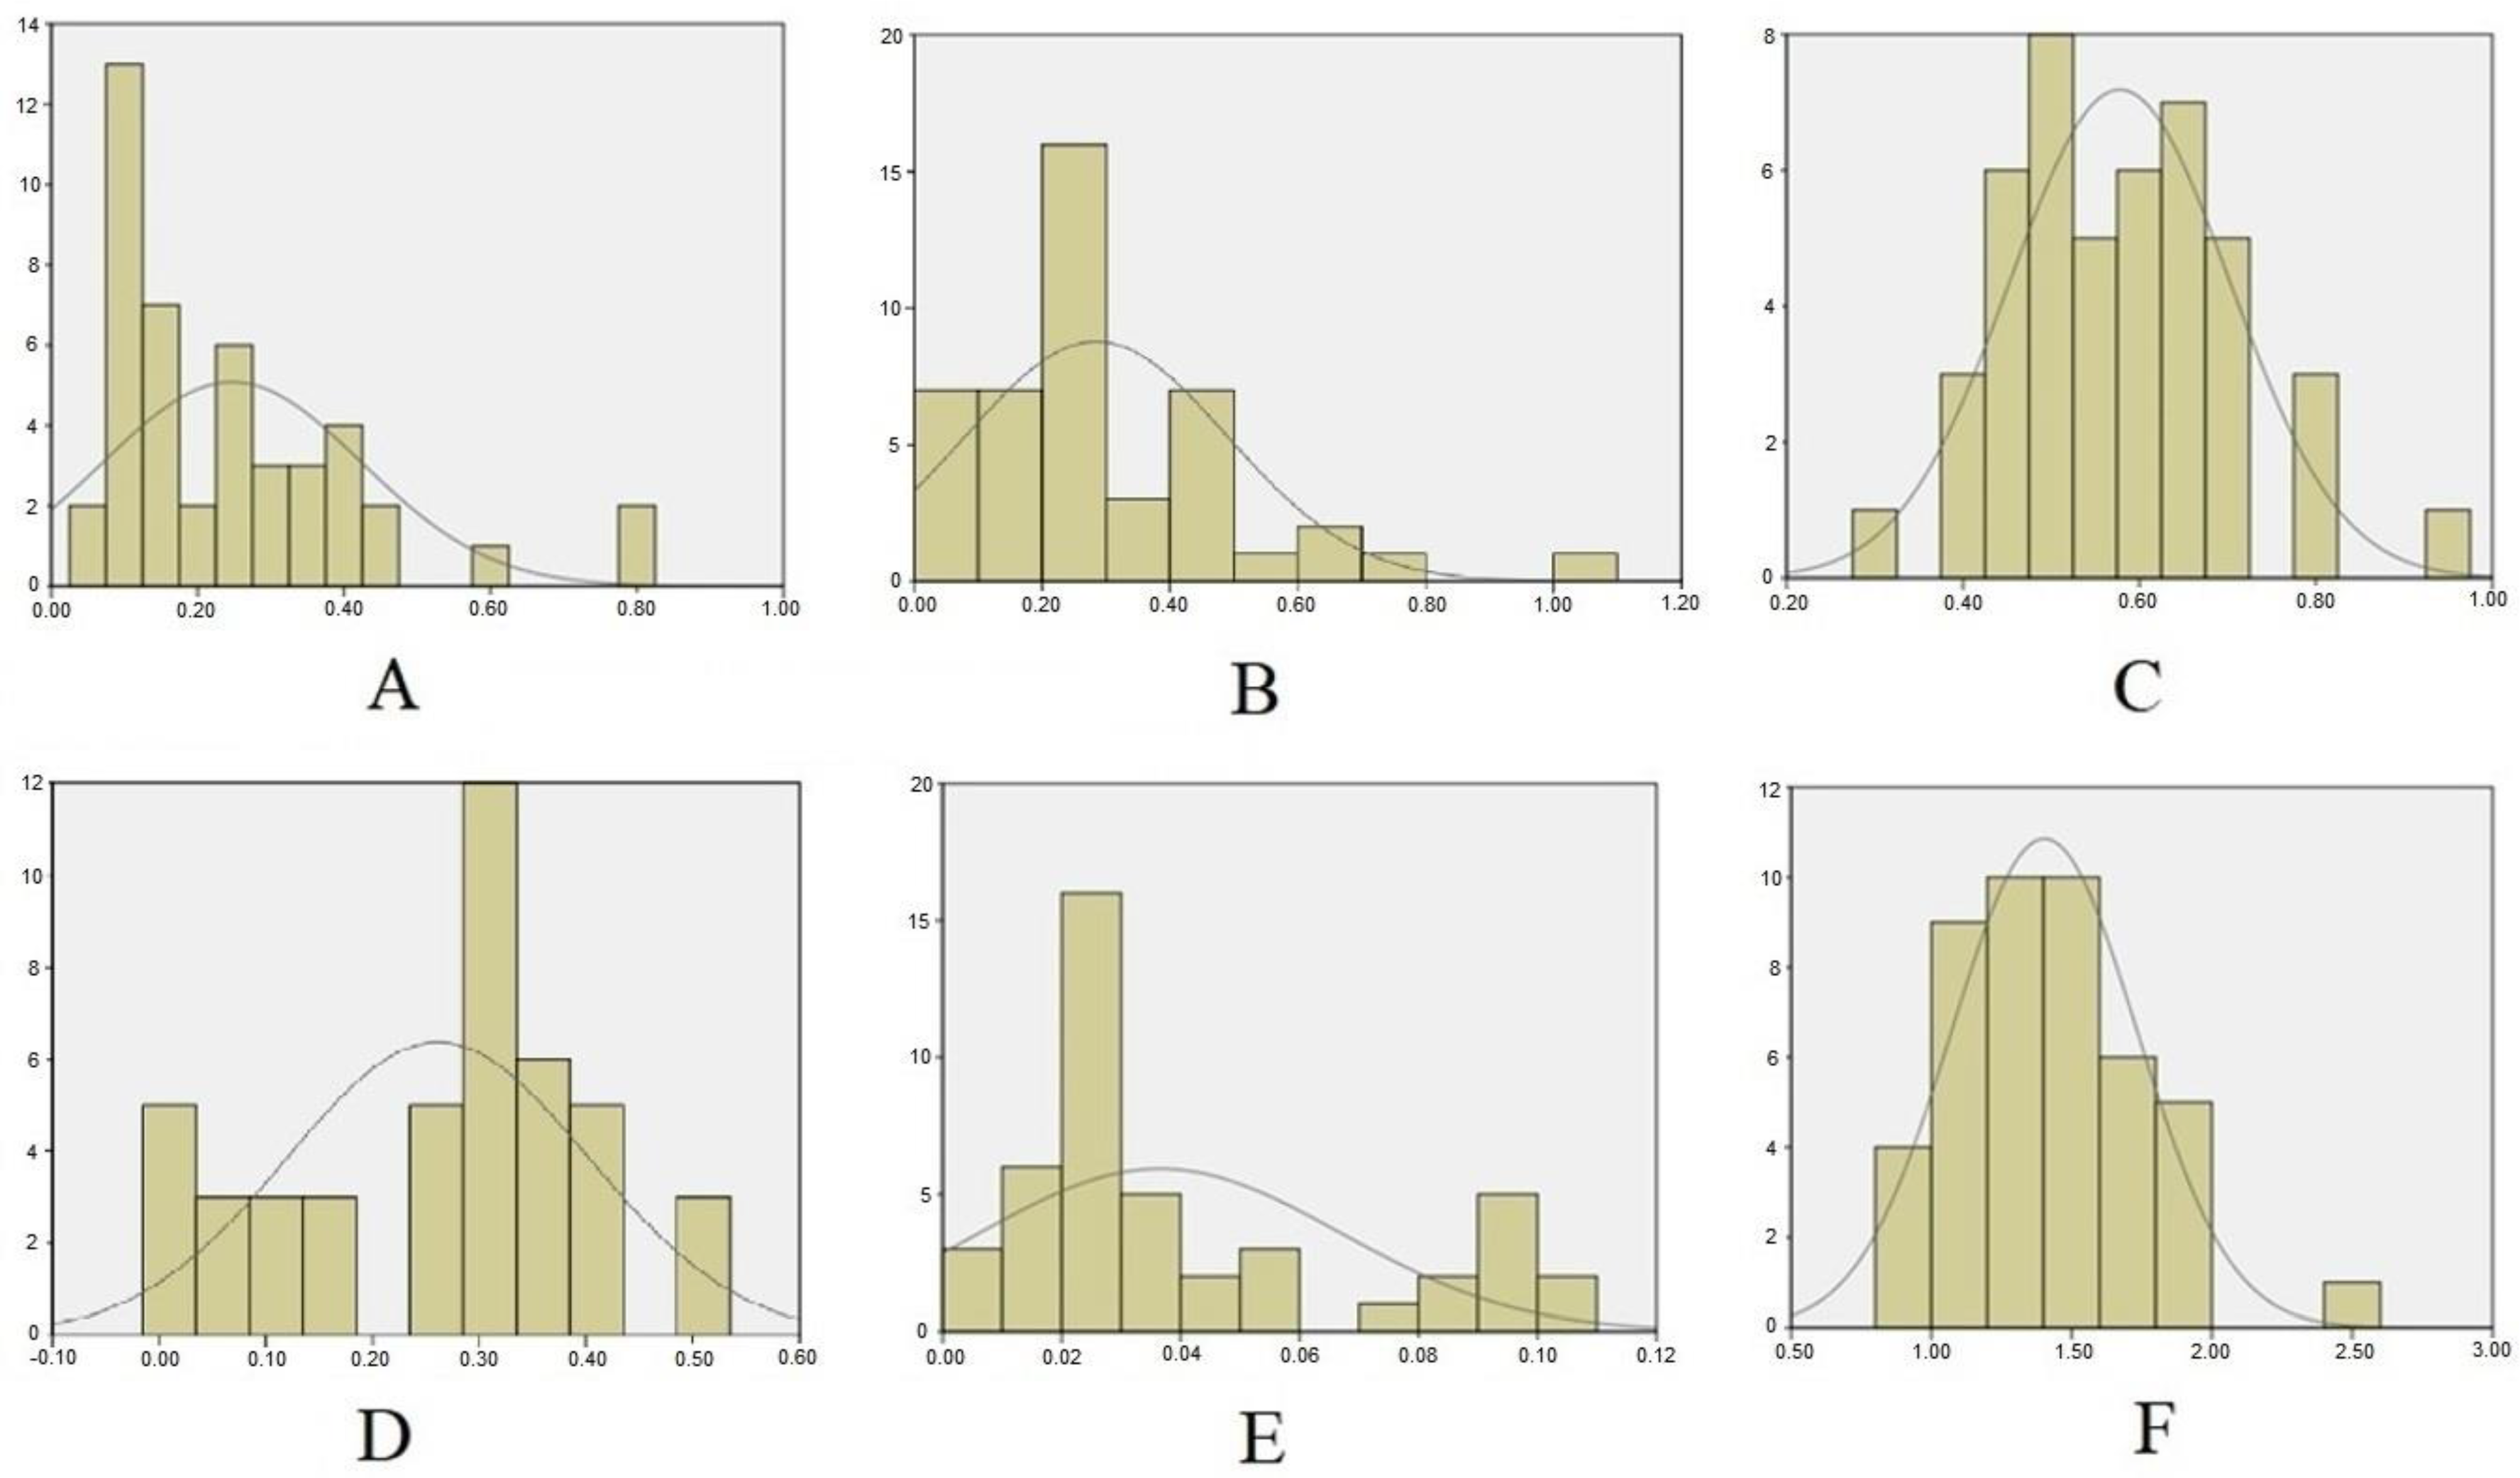
- Agricultural phase, concerning all the work conducted in the field including pruning, harvesting, treatments, irrigation, and fertilization.
- Industrial phase, which includes all operations in industrial phases.
- Bottling phase, which deals with bottling, labeling, corks, pallets, and more (packaging).
- Distribution phase of the products, which includes transport.
- Disposal phase, where the greenhouse gases emitted after consumption were evaluated.
average value of GHG emissions of all wines in phasea
4. Results and Discussion
5. Conclusions
Author Contributions
Funding
Data Availability Statement
Conflicts of Interest
Appendix A

| Wine Profile N° | Type of Wine | Classification * | Region |
|---|---|---|---|
| 1 | RED | DOCG | PIEMONTE |
| 2 | SPARKLING | DOCG | PIEMONTE |
| 3 | RED | DOCG | TOSCANA |
| 4 | RED | DOCG | TOSCANA |
| 5 | RED | DOC | TOSCANA |
| 6 | WHITE | IGT | TOSCANA |
| 7 | SPARKLING | DOC | EMILIA-ROMAGNA |
| 8 | SPARKLING | DOC | EMILIA-ROMAGNA |
| 9 | SPARKLING | DOC | EMILIA-ROMAGNA |
| 10 | WHITE | DOC | FRIULI VENEZIA GIULIA |
| 11 | RED | IGT | TOSCANA |
| 12 | RED | DOCG | TOSCANA |
| 13 | RED | DOCG | TOSCANA |
| 14 | RED | IGT | TOSCANA |
| 15 | WHITE | IGT | TOSCANA |
| 16 | SPARKLING | - | TOSCANA |
| 17 | WHITE | DOC | VENETO |
| 18 | RED | DOCG | TOSCANA |
| 19 | SPARKLING | DOC | EMILIA-ROMAGNA |
| 20 | SPARKLING | DOC | EMILIA-ROMAGNA |
| 21 | SPARKLING | DOC | EMILIA-ROMAGNA |
| 22 | RED | DOCG | VENETO |
| 23 | WHITE | DOC | VENETO |
| 24 | SPARKLING | DOC | VENETO |
| 25 | SPARKLING | DOC | EMILIA-ROMAGNA |
| 26 | SPARKLING | DOC | EMILIA-ROMAGNA |
| 27 | SPARKLING | DOC | EMILIA-ROMAGNA |
| 28 | WHITE | IGT | UMBRIA |
| 29 | RED | DOCG | PIEMONTE |
| 30 | RED | DOCG | PIEMONTE |
| 31 | RED | DOCG | PIEMONTE |
| 32 | RED | DOCG | PIEMONTE |
| 33 | RED | IGT | TOSCANA |
| 34 | RED | IGT | TOSCANA |
| 35 | RED | DOC | MARCHE |
| 36 | WHITE | DOC | MARCHE |
| 37 | RED | DOC | VENETO |
| 38 | RED | DOCG | VENETO |
| 39 | RED | IGT | UMBRIA |
| 40 | RED | DOC | UMBRIA |
| 41 | WHITE | DOC | FRIULI VENEZIA GIULIA |
| 42 | WHITE | DOC | FRIULI VENEZIA GIULIA |
| 43 | RED | DOC | SICILIA |
| 44 | RED | DOCG | VENETO |
| 45 | RED | DOC | VENETO |
References
- Chiriacò, M.V.; Belli, C.; Chiti, T.; Trotta, C.; Sabbatini, S. The potential carbon neutrality of sustainable viticulture showed through a comprehensive assessment of the greenhouse gas (GHG) budget of wine production. J. Clean. Prod. 2019, 225, 435–450. [Google Scholar] [CrossRef]
- Intergovernmental Panel on Climate Change (IPCC). Climate Change 2014: Mitigation of Climate Change. Contribution of Working Group III to the Fifth Assessment Report of the Intergovernmental Panel on Climate Change; Cambridge University Press: Cambridge, UK; New York, NY, USA, 2014; p. 24. [Google Scholar]
- Bonfante, A.; Monaco, E.; Langella, G.; Mercogliano, P.; Bucchignani, E.; Manna, P.; Terribile, F. A dynamic viticultural zoning to explore the resilience of terroir concept under climate change. Sci. Total Environ. 2018, 624, 294–308. [Google Scholar] [CrossRef]
- OIV—International Organisation of Vine and Wine. State of the Vitivinicultural World in 2020; OIV: Dijon, France, 2021; Available online: https://www.oiv.int/public/medias/7909/oiv-state-of-the-world-vitivinicultural-sector-in-2020.pdf (accessed on 21 October 2022).
- Mozell, M.R.; Thach, L. The impact of climate change on the global wine industry: Challenges & solutions. Wine Econ. Policy 2014, 3, 81–89. [Google Scholar]
- Palliotti, A.; Tombesi, S.; Silvestroni, O.; Lanari, V.; Gatti, M.; Poni, S. Changes in vineyard establishment and canopy management urged by earlier climate-related grape ripening: A review. Sci. Hortic. 2014, 178, 43–54. [Google Scholar] [CrossRef]
- Christ, K.L.; Burritt, R.L. Critical environmental concerns in wine production: An integrative review. J. Clean. Prod. 2013, 53, 232–242. [Google Scholar] [CrossRef]
- Merli, R.; Preziosi, M.; Acampora, A. Sustainability experiences in the wine sector: Toward the development of an international indicators system. J. Clean. Prod. 2018, 172, 3791–3805. [Google Scholar] [CrossRef]
- Escribano-Viana, R.; López-Alfaro, I.; López, R.; Santamaría, P.; Gutiérrez, A.R.; González-Arenzana, L. Impact of chemical and biological fungicides applied to grapevine on grape biofilm, must, and wine microbial diversity. Front. Microbiol. 2018, 9, 59. [Google Scholar] [CrossRef]
- Palmieri, N.; Perito, M.A. Consumers’ willingness to consume sustainable and local wine in Italy. Ital. J. Food Sci. 2020, 32, 222–233. [Google Scholar]
- Sogari, G.; Pucci, T.; Aquilani, B.; Zanni, L. Millennial Generation and Environmental Sustainability: The Role of Social Media in the Consumer Purchasing Behavior for Wine. Sustainability 2017, 9, 1911. [Google Scholar] [CrossRef]
- Pomarici, E.; Vecchio, R. Millennial generation attitudes to sustainable wine: An exploratory study on Italian consumers. J. Clean. Prod. 2014, 66, 537–545. [Google Scholar] [CrossRef]
- Rugani, B.; Vázquez-Rowe, I.; Benedetto, G.; Benetto, E. A comprehensive review of carbon footprint analysis as an extended environmental indicator in the wine sector. J. Clean. Prod. 2013, 54, 61–77. [Google Scholar] [CrossRef]
- Schultz, K.; Williamson, P. Gaining Competitive Advantage in a Carbon-constrained World: Strategies for European Business. Eur. Manag. J. 2005, 23, 383–391. [Google Scholar] [CrossRef]
- Gilinsky, A., Jr.; Newton, S.K.; Atkin, T.S.; Santini, C.; Cavicchi, A.; Casas, A.R.; Huertas, R. Perceived efficacy of sustainability strategies in the US, Italian, and Spanish wine industries: A comparative study. Int. J. Wine Bus. Res. 2015, 27, 164–181. [Google Scholar] [CrossRef]
- Flores, S.S. What is sustainability in the wine world? A cross-country analysis of wine sustainability frameworks. J. Clean. Prod. 2018, 172, 2301–2312. [Google Scholar] [CrossRef]
- Giacomarra, M.; Galati, A.; Crescimanno, M.; Tinervia, S. The integration of quality and safety concerns in the wine industry: The role of third-party voluntary certifications. J. Clean. Prod. 2016, 112, 267–274. [Google Scholar] [CrossRef]
- Corbo, C.; Lamastra, L.; Capri, E. From Environmental to Sustainability Programs: A Review of Sustainability Initiatives in the Italian Wine Sector. Sustainability 2014, 6, 2133–2159. [Google Scholar] [CrossRef]
- Szolnoki, G. A cross-national comparison of sustainability in the wine industry. J. Clean. Prod. 2013, 53, 243–251. [Google Scholar] [CrossRef]
- Gabzdylova, B.; Raffensperger, J.F.; Castka, P. Sustainability in the New Zealand wine industry: Drivers, stakeholders and practices. J. Clean. Prod. 2009, 17, 992–998. [Google Scholar] [CrossRef]
- Gilinsky, A., Jr.; Newton, S.K.; Vega, R.F. Sustainability in the global wine industry: Concepts and cases. Agric. Agric. Sci. Procedia 2016, 8, 37–49. [Google Scholar] [CrossRef]
- Grebitus, C.; Steiner, B.; Veeman, M.M. Paying for sustainability: A cross-cultural analysis of consumers’ valuations of food and non-food products labeled for carbon and water footprints. J. Behav. Exp. Econ. 2016, 63, 50–58. [Google Scholar] [CrossRef]
- D’Ammaro, D.; Capri, E.; Valentino, F.; Grillo, S.; Fiorini, E.; Lamastra, L. Benchmarking of carbon footprint data from the Italian wine sector: A comprehensive and extended analysis. Sci. Total Environ. 2021, 779, 146416. [Google Scholar] [CrossRef]
- Santiago-Brown, I.; Metcalfe, A.; Jerram, C.; Collins, C. Sustainability assessment in wine-grape growing in the new world: Economic, environmental, and social indicators for agricultural businesses. Sustainability 2015, 7, 8178–8204. [Google Scholar] [CrossRef]
- OIV—International Organisation of Vine and Wine. Resolution OIV-CST 518-2016; General Principles of Sustainable Vitiviniculture—Environmental—Social—Economic and Cultural Aspects; OIV: Dijon, France, 2016; Available online: https://www.oiv.int/public/medias/5766/oiv-cst-518-2016-en.pdf (accessed on 21 October 2022).
- Tubiello, F.N.; Rosenzweig, C.; Conchedda, G.; Karl, K.; Gütschow, J.; Xueyao, P.; Obli-Laryea, G.; Wanner, N.; Qiu, S.Y.; De Barros, J.; et al. Greenhouse gas emissions from food systems: Building the evidence base. Environ. Res. Lett. 2021, 16, 065007. [Google Scholar] [CrossRef]
- Amienyo, D.; Camilleri, C.; Azapagic, A. Environmental impacts of consumption of Australian red wine in the UK. J. Clean. Prod. 2014, 72, 110–119. [Google Scholar] [CrossRef]
- Galbreath, J. On the Relevancy of Climate Change to Business: Evidence from the Margaret River Wineregion of Australia; Working Paper No. 107; American Association of Wine Economists: New York, NY, USA, 2012; Available online: https://wine-economics.org/working-papers/ (accessed on 21 October 2022).
- Hannah, L.; Roehrdanz, P.R.; Ikegami, M.; Shepard, A.V.; Shaw, M.R.; Tabor, G.; Zhi, L.; Marquet, P.A.; Hijmans, R.J. Climate change, wine, and conservation. Proc. Natl. Acad. Sci. USA 2012, 17, 6907–6912. [Google Scholar] [CrossRef]
- Jradi, S.; Chameeva, T.B.; Delhomme, B.; Jaegler, A. Tracking carbon footprint in French vineyards: A DEA performance assessment. J. Clean. Prod. 2018, 192, 43–54. [Google Scholar] [CrossRef]
- Vázquez-Rowe, I.; Villanueva-Rey, P.; Iribarren, D.; Moreira, M.T.; Feijoo, G. Joint life cycle assessment and data envelopment analysis of grape production for vinification in the Rías Baixas appellation (NW Spain). J. Clean. Prod. 2012, 27, 92–102. [Google Scholar] [CrossRef]
- OIV—International Organisation of Vine and Wine. Resolution OIV-CST 431-2011: General Principles of the OIV Greenhouse Gas Accounting Protocol (GHGAP) for the Vine and Wine Sector; OIV: Dijon, France, 2011. Available online: https://www.oiv.int/public/medias/2107/oiv-cst-431-2011-en.pdf (accessed on 21 October 2022).
- Galletto, L.; Barisan, L. Carbon footprint as a lever for sustained competitive strategy in developing a smart oenology: Evidence from an exploratory study in Italy. Sustainability 2019, 11, 1483. [Google Scholar] [CrossRef]
- Karwacka, M.; Ciurzyńska, A.; Lenart, A.; Janowicz, M. Sustainable development in the agri-food sector in terms of the carbon footprint: A Review. Sustainability 2020, 12, 6463. [Google Scholar] [CrossRef]
- Röös, E.; Sundberg, C.; Tidåker, P.; Strid, I.; Hansson, P.A. Can carbon footprint serve as an indicator of the environmental impact of meat production? Ecol. Indic. 2013, 24, 573–581. [Google Scholar] [CrossRef]
- Weidema, B.P.; Thrane, M.; Christensen, P.; Schmidt, J.; Løkke, S. Carbon footprint: A catalyst for life cycle assessment? J. Ind. Ecol. 2008, 12, 3–6. [Google Scholar] [CrossRef]
- Martins, A.A.; Costa, M.C.; Araújo, A.R.; Morgado, A.; Pereira, J.M.; Fontes, N.; Graça, A.; Caetano, N.S.; Mata, T.M. Sustainability evaluation of a Portuguese “terroir” wine. In Proceedings of the 41st World Congress of Vine and Wine, BIO Web of Conferences, Punta del Este, Uruguay, 19–23 November 2018; EDP Sciences: Les Ulis, France, 2019. 12/03017. [Google Scholar]
- Martins, A.A.; Araújo, A.R.; Graça, A.; Caetano, N.S.; Mata, T.S. Toward sustainable wine: Comparison of two Portuguese wines. J. Clean. Prod. 2018, 183, 662–676. [Google Scholar] [CrossRef]
- Benedetto, G. The environmental impact of a Sardinian wine by partial life cycle assessment. Wine Econ. Policy 2013, 2, 33–41. [Google Scholar] [CrossRef]
- Neto, B.; Dias, A.C.; Machado, M. Life cycle assessment of the supply chain of a Portuguese wine: From viticulture to distribution. Int. J. Life Cycle Assess. 2013, 18, 590–602. [Google Scholar] [CrossRef]
- Bosco, S.; Di Bene, C.; Galli, M.; Remorini, D.; Massai, R.; Bonari, E. Greenhouse gas emissions in the agricultural phase of wine production in the Maremma rural district in Tuscany, Italy. Ital. J. Agron. 2011, 6, e15. [Google Scholar] [CrossRef]
- Navarro, A.; Puig, R.; Fullana-i-Palmer, P. Product vs. corporate carbon footprint: Some methodological issues. A case study and review on the wine sector. Sci. Total Environ. 2017, 581, 722–733. [Google Scholar] [CrossRef]
- Bonamente, E.; Scrucca, F.; Rinaldi, S.; Merico, M.C.; Asdrubali, F.; Lamastra, L. Environmental impact of an Italian wine bottle: Carbon and water footprint assessment. Sci. Total Environ. 2016, 560, 274–283. [Google Scholar] [CrossRef]
- Rinaldi, S.; Bonamente, E.; Scrucca, F.; Merico, M.C.; Asdrubali, F.; Cotana, F. Water and carbon footprint of wine: Methodology review and application to a case study. Sustainability 2016, 8, 621. [Google Scholar] [CrossRef]
- Marras, S.; Masia, S.; Duce, P.; Spano, D.; Sirca, C. Carbon footprint assessment on a mature vineyard. Agric. For. Meteorol. 2015, 214, 350–356. [Google Scholar] [CrossRef]
- Bosco, S.; Di Bene, C.; Galli, M.; Remorini, D.; Massai, R.; Bonari, E. Soil organic matter accounting in the carbon footprint analysis of the wine chain. Int. J. Life Cycle Assess. 2013, 18, 973–989. [Google Scholar] [CrossRef]
- Casolani, N.; D’Eusanio, M.; Liberatore, L.; Raggi, A.; Petti, L. Life Cycle Assessment in the wine sector: A review on inventory phase. J. Clean. Prod. 2022, 379, 134404. [Google Scholar] [CrossRef]
- Sinisterra-Solís, N.K.; Sanjuán, N.; Estruch, V.; Clemente, G. Assessing the environmental impact of Spanish vineyards in Utiel-Requena PDO: The influence of farm management and on-field emission modelling. J. Environ. Manag. 2020, 262, 110325. [Google Scholar] [CrossRef] [PubMed]
- Vázquez-Rowe, I.; Rugani, B.; Benetto, E. Tapping carbon footprint variations in the European wine sector. J. Clean. Prod. 2013, 43, 146–155. [Google Scholar] [CrossRef]
- Saxe, H. LCA-Based Comparison of the Climate Footprint of Beer vs. Wine & Spirits; Report No. 207; Institute of Food and Resource Economics: Copenhagen, Denmark, 2010. [Google Scholar]
- Ponstein, H.J.; Meyer-Aurich, A.; Prochnow, A. Greenhouse gas emissions and mitigation options for German wine production. J. Clean. Prod. 2019, 212, 800–809. [Google Scholar] [CrossRef]
- Litskas, V.D.; Tzortzakis, N.; Stavrinides, M.C. Determining the carbon footprint and emission hotspots for the wine produced in Cyprus. Atmosphere 2020, 11, 463. [Google Scholar] [CrossRef]
- Pattara, C.; Giannantonio, L.; Lorito, V.; Vinciguerra, R.; Piscicelli, M.; Cichelli, A. Il contributo dei fertilizzanti all’effetto serra nella filiera vitivinicola. In Proceedings of the 38th World Congress of Vine and Wine (Part 2), Mainz, Germany, 5–10 July 2015; EDP Sciences: Les Ulis, France, 2015; Volume 5, p. 05001. [Google Scholar]
- Ferrara, C.; De Feo, G. Life cycle assessment application to the wine sector: A critical review. Sustainability 2018, 10, 395. [Google Scholar] [CrossRef]
- Forum per la Sostenibilità del Vino. Primo Rapporto sulla Sostenibilità nel Vino; Unione Italiana Vini: Milan, Italy, 2014; Available online: http://www.vinosostenibile.org/wp-content/uploads/2014/10/Primo-Rapporto-Sostenibilita-del-Vino-Ottobre-2014.pdf (accessed on 21 October 2022).
- Notarnicola, B.; Tassielli, G.; Renzulli, P.A.; Di Capua, R.; Saija, G.; Salomone, R.; Primerano, P.; Petti, L.; Raggi, A.; Casolani, N.; et al. Life cycle inventory data for the Italian agri-food sector: Background, sources and methodological aspects. Int. J. Life Cycle Assess. 2022. [Google Scholar] [CrossRef]
- REG_SOPD_002_20210801; Regolamento Applicativo Dello Standard Sostenibilità Della Filiera Vitivinicola: Organizzazioni, Prodotti, Denominazioni di Origine (SOPD). Equalitas: Cagliari, Italy, 2021. Available online: https://www.equalitas.it/lo-standard/ (accessed on 21 October 2022).
- Lamastra, L.; Balderacchi, M.; Di Guardo, A.; Monchiero, M.; Trevisan, M. A novel fuzzy expert system to assess the sustainability of the viticulture at the wine-estate scale. Sci. Total Environ. 2016, 572, 724–733. [Google Scholar] [CrossRef]
- VIVA. Sustainability in the Italian Wine Sector. Available online: https://viticolturasostenibile.org/en/specifications-and-indicators/the-indicators/air/ (accessed on 21 October 2022).
- Biau, G.; Devroye, L. Lectures on the Nearest Neighbor Method; Springer: Cham, Switzerland, 2015; pp. 154–196. [Google Scholar]
- Lovie, P. Coefficient of Variation. Encyclopedia of Statistics in Behavioral Science; John Wiley & Sons, Inc.: Hoboken, NJ, USA, 2005; Volume 1, pp. 317–318. [Google Scholar]
- Litskas, V.D.; Irakleous, T.; Tzortzakis, N.; Starvrinides, M.C. Determining the carbon footprint of indigenous and introduced grape varieties through Life Cycle Assessment using the island of Cyprus as a case study. J. Clean. Prod. 2017, 156, 418–425. [Google Scholar] [CrossRef]
- Gazulla, C.; Raugei, M.; Fullana-i-Palmer, P. Taking a life cycle look at crianza wine production in Spain: Where are the bottlenecks? Int. J. Life Cycle Assess. 2010, 15, 330–337. [Google Scholar] [CrossRef]
- Casolani, N.; Pattara, C.; Liberatore, L. Water and carbon footprint perspective in Italian durum wheat production. Land Use Policy 2016, 58, 394–402. [Google Scholar] [CrossRef]
- Cartone, A.; Casolani, N.; Liberatore, L.; Postiglione, P. Spatial analysis of grey water in Italian cereal crops production. Land Use Policy 2017, 68, 97–106. [Google Scholar] [CrossRef]
- Tsalidis, G.A.; Kryona, Z.P.; Tsirliganis, N. Selecting south European wine based on carbon footprint. Resour. Environ. Sustain. 2022, 9, 100066. [Google Scholar] [CrossRef]
- Scrucca, F.; Bonamente, E.; Rinaldi, S. Carbon footprint in the wine industry. In Environmental Carbon Footprints; Muthu, S.S., Ed.; Butterworth-Heinemann: Oxford, UK, 2018; pp. 161–196. [Google Scholar]
- Fusi, A.; Guidetti, R.; Benedetto, G. Delving into the environmental aspect of a Sardinian white wine: From partial to total life cycle assessment. Sci. Total Environ. 2014, 472, 989–1000. [Google Scholar] [CrossRef]
- Meneses, M.; Torres, C.M.; Castells, F. Sensitivity analysis in a life cycle assessment of an aged red wine production from Catalonia, Spain. Sci. Total Environ. 2016, 562, 571–579. [Google Scholar] [CrossRef]
- Gierling, F.; Blanke, M. Carbon reduction strategies for regionally produced and consumed wine: From farm to fork. J. Environ. Manag. 2021, 278, 111453. [Google Scholar] [CrossRef] [PubMed]
- Murmura, F.; Liberatore, L.; Bravi, L.; Casolani, N. Evaluation of Italian companies’ perception about ISO 14001 and Eco Management and Audit Scheme III: Motivations, benefits and barriers. J. Clean. Prod. 2018, 174, 691–700. [Google Scholar] [CrossRef]
- Figge, F.; Hahn, T.; Schaltegger, S.; Wagner, M. The Sustainability Balanced Scorecard—Linking sustainability management to business strategy. Bus. Strategy Environ. 2002, 11, 269–284. [Google Scholar] [CrossRef]


| Phases | Range | Minimum | Maximum | Mean | Std. Deviation | Variance |
|---|---|---|---|---|---|---|
| Agricultural | 0.75 | 0.05 | 0.80 | 0.25 | 0.18 | 0.03 |
| Industrial | 1.00 | 0.03 | 1.03 | 0.28 | 0.20 | 0.04 |
| Bottling | 0.64 | 0.30 | 0.94 | 0.58 | 0.12 | 0.02 |
| Distribution | 0.51 | 0.01 | 0.52 | 0.26 | 0.14 | 0.02 |
| Disposal | 0.10 | 0.00 | 0.10 | 0.04 | 0.03 | 0.00 |
| All phases | 1.71 | 0.81 | 2.52 | 1.41 | 0.33 | 0.11 |
| N° | Percent | ||
|---|---|---|---|
| Sample | Training | 36 | 80% |
| Holdout | 9 | 20% | |
| Valid | 45 | 100% | |
| Excluded | 8 | ||
| Total | 53 |
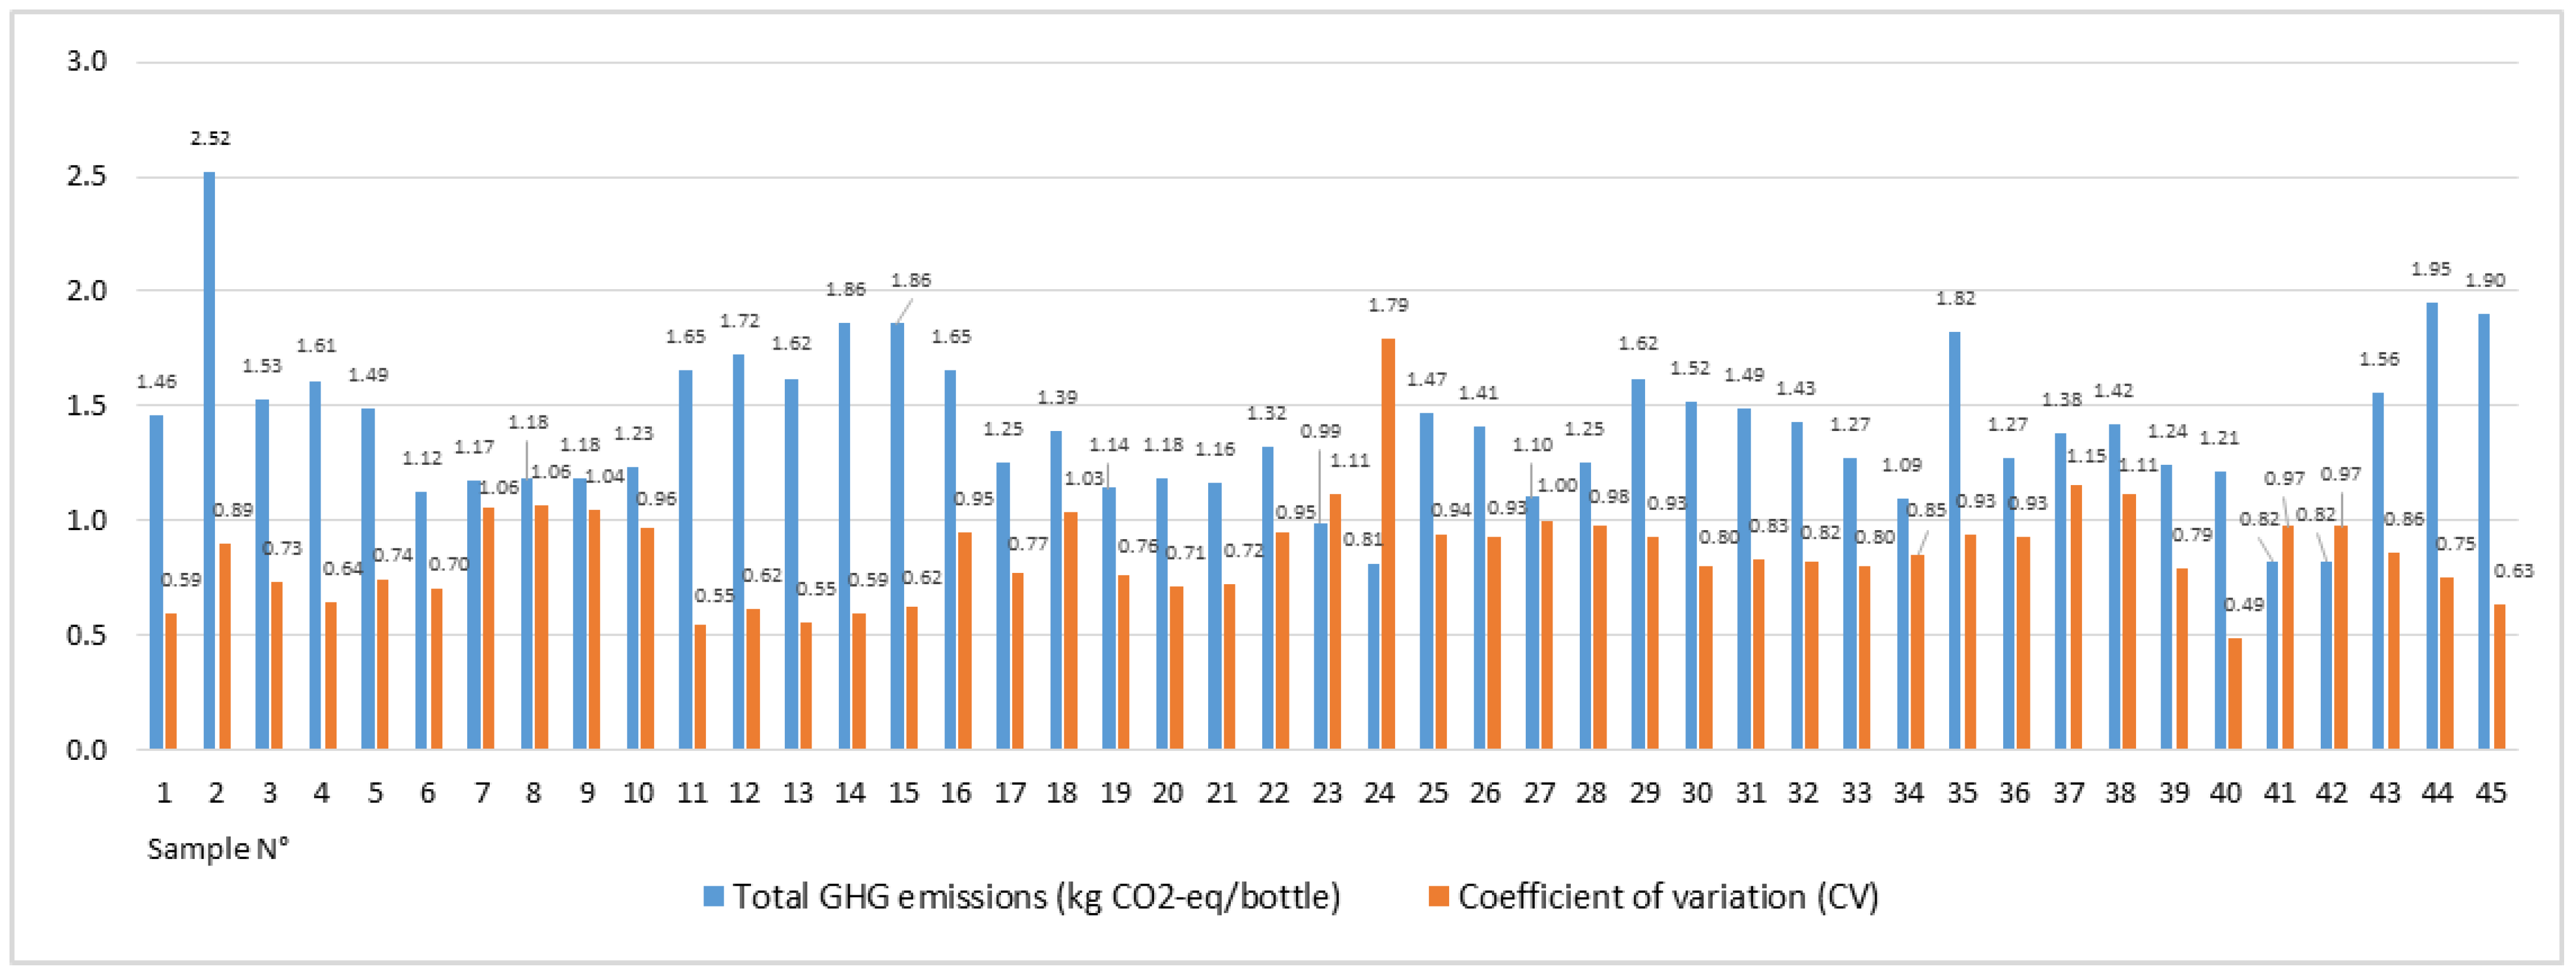
| Wine Profile N° | Agricultural Phase | Industrial Phase | Bottling Phase | Distribution Phase | Disposal Phase |
|---|---|---|---|---|---|
| 1 | 0.85 | 0.97 | 1.16 | 1.07 | 2.46 |
| 2 | 0.45 | 1.63 | 3.62 | 1.30 | 2.74 |
| 3 | 1.01 | 1.11 | 1.02 | 1.22 | 0.55 |
| 4 | 1.17 | 1.13 | 1.02 | 1.22 | 1.92 |
| 5 | 1.05 | 1.11 | 1.02 | 1.07 | 0.55 |
| 6 | 0.69 | 0.78 | 0.74 | 1.03 | 0.55 |
| 7 | 0.32 | 1.11 | 0.42 | 1.19 | 0.82 |
| 8 | 0.32 | 1.11 | 0.42 | 1.15 | 0.82 |
| 9 | 0.36 | 1.11 | 0.42 | 1.19 | 0.82 |
| 10 | 0.81 | 1.06 | 0.21 | 1.22 | 0.82 |
| 11 | 1.66 | 0.78 | 1.44 | 1.42 | 0.27 |
| 12 | 1.29 | 1.02 | 1.44 | 1.49 | 0.27 |
| 13 | 1.46 | 0.78 | 1.44 | 1.53 | 0.27 |
| 14 | 1.46 | 1.02 | 1.44 | 1.88 | 0.27 |
| 15 | 1.58 | 1.14 | 1.44 | 1.49 | 0.27 |
| 16 | 1.50 | 1.42 | 0.32 | 1.38 | 0.55 |
| 17 | 0.45 | 0.88 | 0.95 | 1.30 | 0.55 |
| 18 | 1.62 | 1.21 | 0.70 | 0.27 | 0.00 |
| 19 | 0.49 | 0.81 | 0.81 | 1.11 | 0.55 |
| 20 | 0.65 | 0.81 | 0.81 | 1.11 | 0.55 |
| 21 | 0.61 | 0.81 | 0.81 | 1.11 | 0.55 |
| 22 | 1.13 | 1.00 | 1.48 | 0.04 | 0.55 |
| 23 | 0.69 | 0.95 | 0.84 | 0.04 | 0.55 |
| 24 | 0.20 | 1.18 | 0.11 | 0.08 | 0.82 |
| 25 | 0.40 | 1.25 | 0.91 | 1.38 | 0.55 |
| 26 | 0.40 | 1.18 | 0.91 | 1.22 | 0.55 |
| 27 | 0.40 | 0.97 | 0.39 | 1.11 | 0.55 |
| 28 | 0.57 | 0.92 | 1.72 | 0.11 | 1.37 |
| 29 | 0.45 | 0.88 | 2.67 | 0.54 | 2.46 |
| 30 | 0.49 | 0.88 | 2.18 | 0.69 | 2.46 |
| 31 | 0.57 | 0.88 | 2.18 | 0.50 | 2.46 |
| 32 | 0.49 | 0.88 | 2.04 | 0.54 | 2.46 |
| 33 | 1.74 | 0.99 | 1.16 | 0.42 | 0.05 |
| 34 | 1.74 | 0.90 | 0.74 | 0.42 | 0.05 |
| 35 | 3.24 | 1.07 | 0.10 | 1.07 | 2.19 |
| 36 | 1.01 | 1.07 | 0.09 | 1.07 | 2.19 |
| 37 | 0.36 | 1.37 | 0.35 | 1.49 | 0.55 |
| 38 | 0.24 | 1.37 | 0.60 | 1.45 | 0.55 |
| 39 | 1.62 | 0.71 | 1.20 | 0.11 | 1.09 |
| 40 | 0.97 | 0.52 | 0.95 | 1.26 | 1.09 |
| 41 | 1.05 | 0.69 | 0.25 | 0.15 | 1.37 |
| 42 | 1.05 | 0.69 | 0.25 | 0.15 | 1.37 |
| 43 | 0.65 | 1.19 | 0.39 | 1.91 | 2.74 |
| 44 | 3.24 | 0.83 | 0.91 | 1.49 | 0.27 |
| 45 | 2.51 | 0.83 | 0.91 | 1.99 | 0.55 |
Disclaimer/Publisher’s Note: The statements, opinions and data contained in all publications are solely those of the individual author(s) and contributor(s) and not of MDPI and/or the editor(s). MDPI and/or the editor(s) disclaim responsibility for any injury to people or property resulting from any ideas, methods, instructions or products referred to in the content. |
© 2023 by the authors. Licensee MDPI, Basel, Switzerland. This article is an open access article distributed under the terms and conditions of the Creative Commons Attribution (CC BY) license (https://creativecommons.org/licenses/by/4.0/).
Share and Cite
Casolani, N.; Chiodo, E.; Liberatore, L. Continuous Improvement of VIVA-Certified Wines: Analysis and Perspective of Greenhouse Gas Emissions. Sustainability 2023, 15, 2349. https://doi.org/10.3390/su15032349
Casolani N, Chiodo E, Liberatore L. Continuous Improvement of VIVA-Certified Wines: Analysis and Perspective of Greenhouse Gas Emissions. Sustainability. 2023; 15(3):2349. https://doi.org/10.3390/su15032349
Chicago/Turabian StyleCasolani, Nicola, Emilio Chiodo, and Lolita Liberatore. 2023. "Continuous Improvement of VIVA-Certified Wines: Analysis and Perspective of Greenhouse Gas Emissions" Sustainability 15, no. 3: 2349. https://doi.org/10.3390/su15032349
APA StyleCasolani, N., Chiodo, E., & Liberatore, L. (2023). Continuous Improvement of VIVA-Certified Wines: Analysis and Perspective of Greenhouse Gas Emissions. Sustainability, 15(3), 2349. https://doi.org/10.3390/su15032349