Article

Gamma Attenuation and Mechanical Characteristics of a Lead/NBR/SBR Rubber Composite with Black Nanocarbon Reinforcement

1
Engineering Mathematics and Physics Department, Faculty of Engineering and Technology, Future University in Egypt (FUE), New Cairo 11835, Egypt
2
Physics Department, Faculty of Science, Ain Shams University, Cairo 11566, Egypt
3
Basic Science Department, Faculty of Engineering, The British University in Egypt (BUE), El Sherouk City 11837, Egypt
4
Polymers and Pigments Department, National Research Centre, Giza 12622, Egypt
*
Author to whom correspondence should be addressed.
Sustainability 2023, 15(3), 2165; https://doi.org/10.3390/su15032165
Submission received: 24 November 2022 / Revised: 23 December 2022 / Accepted: 10 January 2023 / Published: 24 January 2023
(This article belongs to the Section Sustainable Materials)

Abstract

:
In this work, black nanocarbon-loaded 0–100 parts-per-hundred (phr) PbO-filled acrylonitrile butadiene rubber (NBR)/styrene-butadiene rubber (SBR) blend composites were prepared by using an ordinary standard rubber mixer. Both mechanical and gamma attenuation properties of the prepared samples were investigated. Maximum tensile strength and elongation at break were obtained at 40 phr PbO concentration. The obtained values for the mass attenuation coefficient with the increased PbO concentration from 0–100 phr ranged from 0.12–0.22 cm2/g at 0.239 MeV. Scanning electron microscope (SEM) with the elemental mapping analysis results showed high homogeneity at 40 phr of the prepared rubber composites, with some areas of elemental agglomeration at a high concentration of lead oxide. The obtained results highly recommend the use of the prepared nanocarbon-reinforced PbO/NBR/SBR blend compared to those previously used as personal protective equipment in radiation-shielding applications.

1. Introduction

People are at risk of being exposed to harmful ionizing radiation due to today’s rapid advancement in radiation innovation and applications in different fields such as industry, farming, and medicine. As a result, radiation protection procedures such as using shielding materials became necessary [1,2]. In the gas and petroleum industry, natural radioactivity may be found in rocks and around certain oil and gas-bearing formations. Drilling through these rocks or bringing them to the surface can result in radioactive waste. Dealing with radioactive waste is likely to require the use of protective wearables such as aprons, gloves, and overshoes made from radiation-shielding material [3]. The interaction of gamma rays and neutrons with various plastics and rubber polymers used for their shielding properties has been researched and investigated utilizing simulation programs [4,5,6].
Heavy elements such as lead, bismuth, and barium and their compounds are generally utilized for gamma shielding applications due to their minimal expense, heavy molecular weight, high density, and high radiation attenuation capabilities. These elements have customarily been shaped as sheets, plates, foils, laminates, blocks, and bricks [7,8]. Polymers loaded with heavy elements are broadly preferred for radiation-shielding purposes because of their special properties such as their shaping flexibility, low expense, low density, lower toxicity, high adaptability, and processing simplicity [9]. Several polymeric materials such as nitrile butadiene rubber (NBR) and styrene-butadiene rubber (SBR) have distinct properties that may be useful for radiation-shielding applications. The former has a broad range of radiation stability and radiation resistance, while the second has good mechanical properties and high elasticity [9].
Because lead and its constituents have a high gamma shielding efficiency, the fabrication and investigation of polymeric composites containing Lead or Lead oxides have been the attention of various studies [8,10,11]. Rubber–lead mixture samples exhibit good pliability and homogeneity, and with increasing lead concentrations, they provide the best radiation shielding [12]. Furthermore, polyethylene, polyethylene plastic, and ethylene propylene diene monomer (EPDM) composites doped with lead oxides provide effective radiation shielding [13,14,15,16].
Polymers filled with nanoparticles such as nanocarbon black are a development of nanocomposite materials. The new approach aims to use filler nanoparticles to improve their general performance [17,18,19]. In the literature, there have been numerous forms of nanocomposites based on plastics and rubbers. Because of its plentiful supply, low density, persistent conductivity, and low cost, nanoscale carbon black (CB) is one of the most widely utilized nanofillers. It is a well-known nanotechnology application and nanomaterial for modifying the mechanical, electrical, and other physical properties of polymers [17]. It has been used to improve tensile properties, tear and abrasion resistance, hardness, etc., of vulcanized rubber [20,21].
The current study aims to prepare a new shielding material composite made from an NBR/SBR blend and loaded with black nanocarbon particles. This blend will be the host matrix for a PbO filler. The effect of lead oxide concentration on both the mechanical and shielding properties of the prepared blend will be investigated. The optimum concentration of the lead filler will be determined. This developed material composite should have distinct physicomechanical and attenuation features, be lightweight, and have low expense allowing it to be used in the fabrication of radiation protection equipment used by medical, industrial, and military personnel.

2. Materials and Methods

2.1. Sample Preparation

Acrylonitrile butadiene rubber (NBR) with a 32% acrylonitrile content and a specific gravity of 1.17 was supplied by Bayer AG (Berlin, Germany). Styrene-butadiene rubber (SBR) with a 23.5% styrene content and a specific gravity of 0.945 was supplied by Bayer AG (Berlin, Germany). Butadiene rubber (BR) with a specific gravity of 0.90 was supplied by Bayer AG (Berlin, Germany). As a plasticizer, dioctyl phthalate (DOP) with a specific gravity of 0.991 and boiling point of 384 °C was used. Two phr elemental sulfur, a fine pale-yellow powder, with a specific gravity of 2.04–2.06 at room temperature was used as a cross-linking agent with other additives such as ZnO, stearic acid and mercaptobenzothiazole sulfenamide (MBTS) with concentrations 5, 2, and 2 phr, respectively. Trimethyl-quinoline (TMQ) was used as an antioxidant. Solvents and other chemicals of commercial grade such as processing oil and N330 (nanocarbon black) were also used. All of the rubber ingredients were of commercial grade and were purchased from Aldrich Co (Steinheim am Albuch, Germany). All ingredients were compounded as shown in Table 1.
Following ASTM D1417-16, NBR/SBR blends were first mixed on two roll mixing mills, with an outer diameter of 470 mm, a working distance of 300 mm, a roll flow speed of 24 rpm, and a fraction ratio of 1:1.4 at 25 °C for 15 min. Then, ZnO, stearic acid, DOP, MPTS, and processing oil were added and mixed for about 10 min. Sulfur was subsequently added and mixed at the end before making sheets using a hot hydraulic press at 162 ± 1 °C and a pressure of about 4 MPa.

2.2. Material Characterization

A JASCOFT-IR6200 spectrometer using the KBr pellet technique was used to measure the Fourier-transformation infrared (FTIR) absorption spectra of prepared samples in the spectral range 400–4000 cm−1.
A scanning electron microscope (SEM), (FEI Inspect S, Oxford, MS, USA) was used to determine the nature of the particle distribution in the prepared rubber matrix. EDX mapping assisted in the assignment of the elements in the observed agglomeration of the SEM-scan images.
The crystallographic phase identification and line profile analysis of the prepared samples were checked and analyzed at room temperature using X-ray diffraction (XRD). An X-ray powder diffractometer, Philips X’pert Pro, was used for XRD analysis, employing Cu Kα radiation (1.5418 A) with a scanning speed reaching 0.3 s.

2.3. Mass Density Measurement

The mass density was measured at room temperature with a standard Archimedes procedure based on the following equation [22]:
ρ = W a W a W b ρ b
where W a is the sample’s weight in air, W b is the sample’s weight in toluene, and ρ b is toluene density of ( ρ b = 0.87   g / c m 3 ).
Teledyne isotopes (Huntsville, AL, USA) and a “2 × 2” NaI (Tl) scintillation detector under appropriate geometrical conditions with an energy resolution of 8% at 0.662 MeV, and four gamma energies were used to measure the gamma-ray shielding parameters for the prepared rubber blends. From a Cs-137-point source, 0.662 MeV gamma photons were emitted, from a 232Th-point source, 0.239 MeV and 0.911 MeV gamma photons were emitted, and finally, from a Co-60-point source, 1.332 MeV gamma photons were emitted.

2.4. Mechanical Properties Measurement

The ASTM standard testing procedure was used to determine the mechanical properties of the rubber samples such as tensile strength, elongation at break, and hardness. Tensile strength was tested using an electronic Zwick tensile testing machine (model Z010, Germany) according to ASTM D412. Hardness was tested using a Durometer Shore A (Bareiss, Oberdischingen, Germany) according to ASTM D2240.

3. Theoretical Background

The mass attenuation of a photon beam through a certain medium material of density (ρ) and thickness (t) can be determined by using the modified Beer–Lambert law as follows [23]:
μ m = 1 ρ t l n ( I o I )
where Io and I are the incident and transmitted intensities through the investigated material, respectively. The mass attenuation coefficient ( μ m ) of a compound or a mixture can be determined as follows:
μ m = i w i ( μ m ) i
where ( μ m ) i is the mass attenuation coefficient of the ith element of the mixture. The XCOM web database was used for calculating the values of the mass attenuation coefficients across a broad range of energy from 0.015–15 MeV in this study [24].
The material thickness that reduces the photon beam intensity to one-half of its initial value is defined as the half-value layer (HVL), which can be calculated with the following equation:
H V L = 0.693 μ
where μ is the coefficient of linear attenuation of the material, which depends on the material type, the photon energy, and the mass density.
The effective atomic number of a material (Zeff) is the ratio between its effective atomic cross-section (σa) and electronic cross-section (σe). Utilizing the values obtained for Equation (4), we can determine Zeff values for the prepared rubber samples using the following equation [25]:
Z e f f = σ a σ e = i f i A i ( μ m ) i i f i A i Z i ( μ m ) i
where Ai, Zi, and fi represent the atomic weight, atomic number, and fractional abundance of the ith element, respectively. Taylor recently developed and introduced the Auto-Zeff program in Visual Basic to rapidly compute effective atomic numbers [26]. The effective electron densities (Neff) of the rubber mixture samples were calculated using the following equation [27]:
N e f f = N A Z e f f i f i A i         ( e l e c t r o n s / g )
where NA is Avogadro’s number. As shown in Equation (6), Neff varies with the energy in a similar manner to Zeff which depends on the interaction processes involved.

4. Results and Discussion

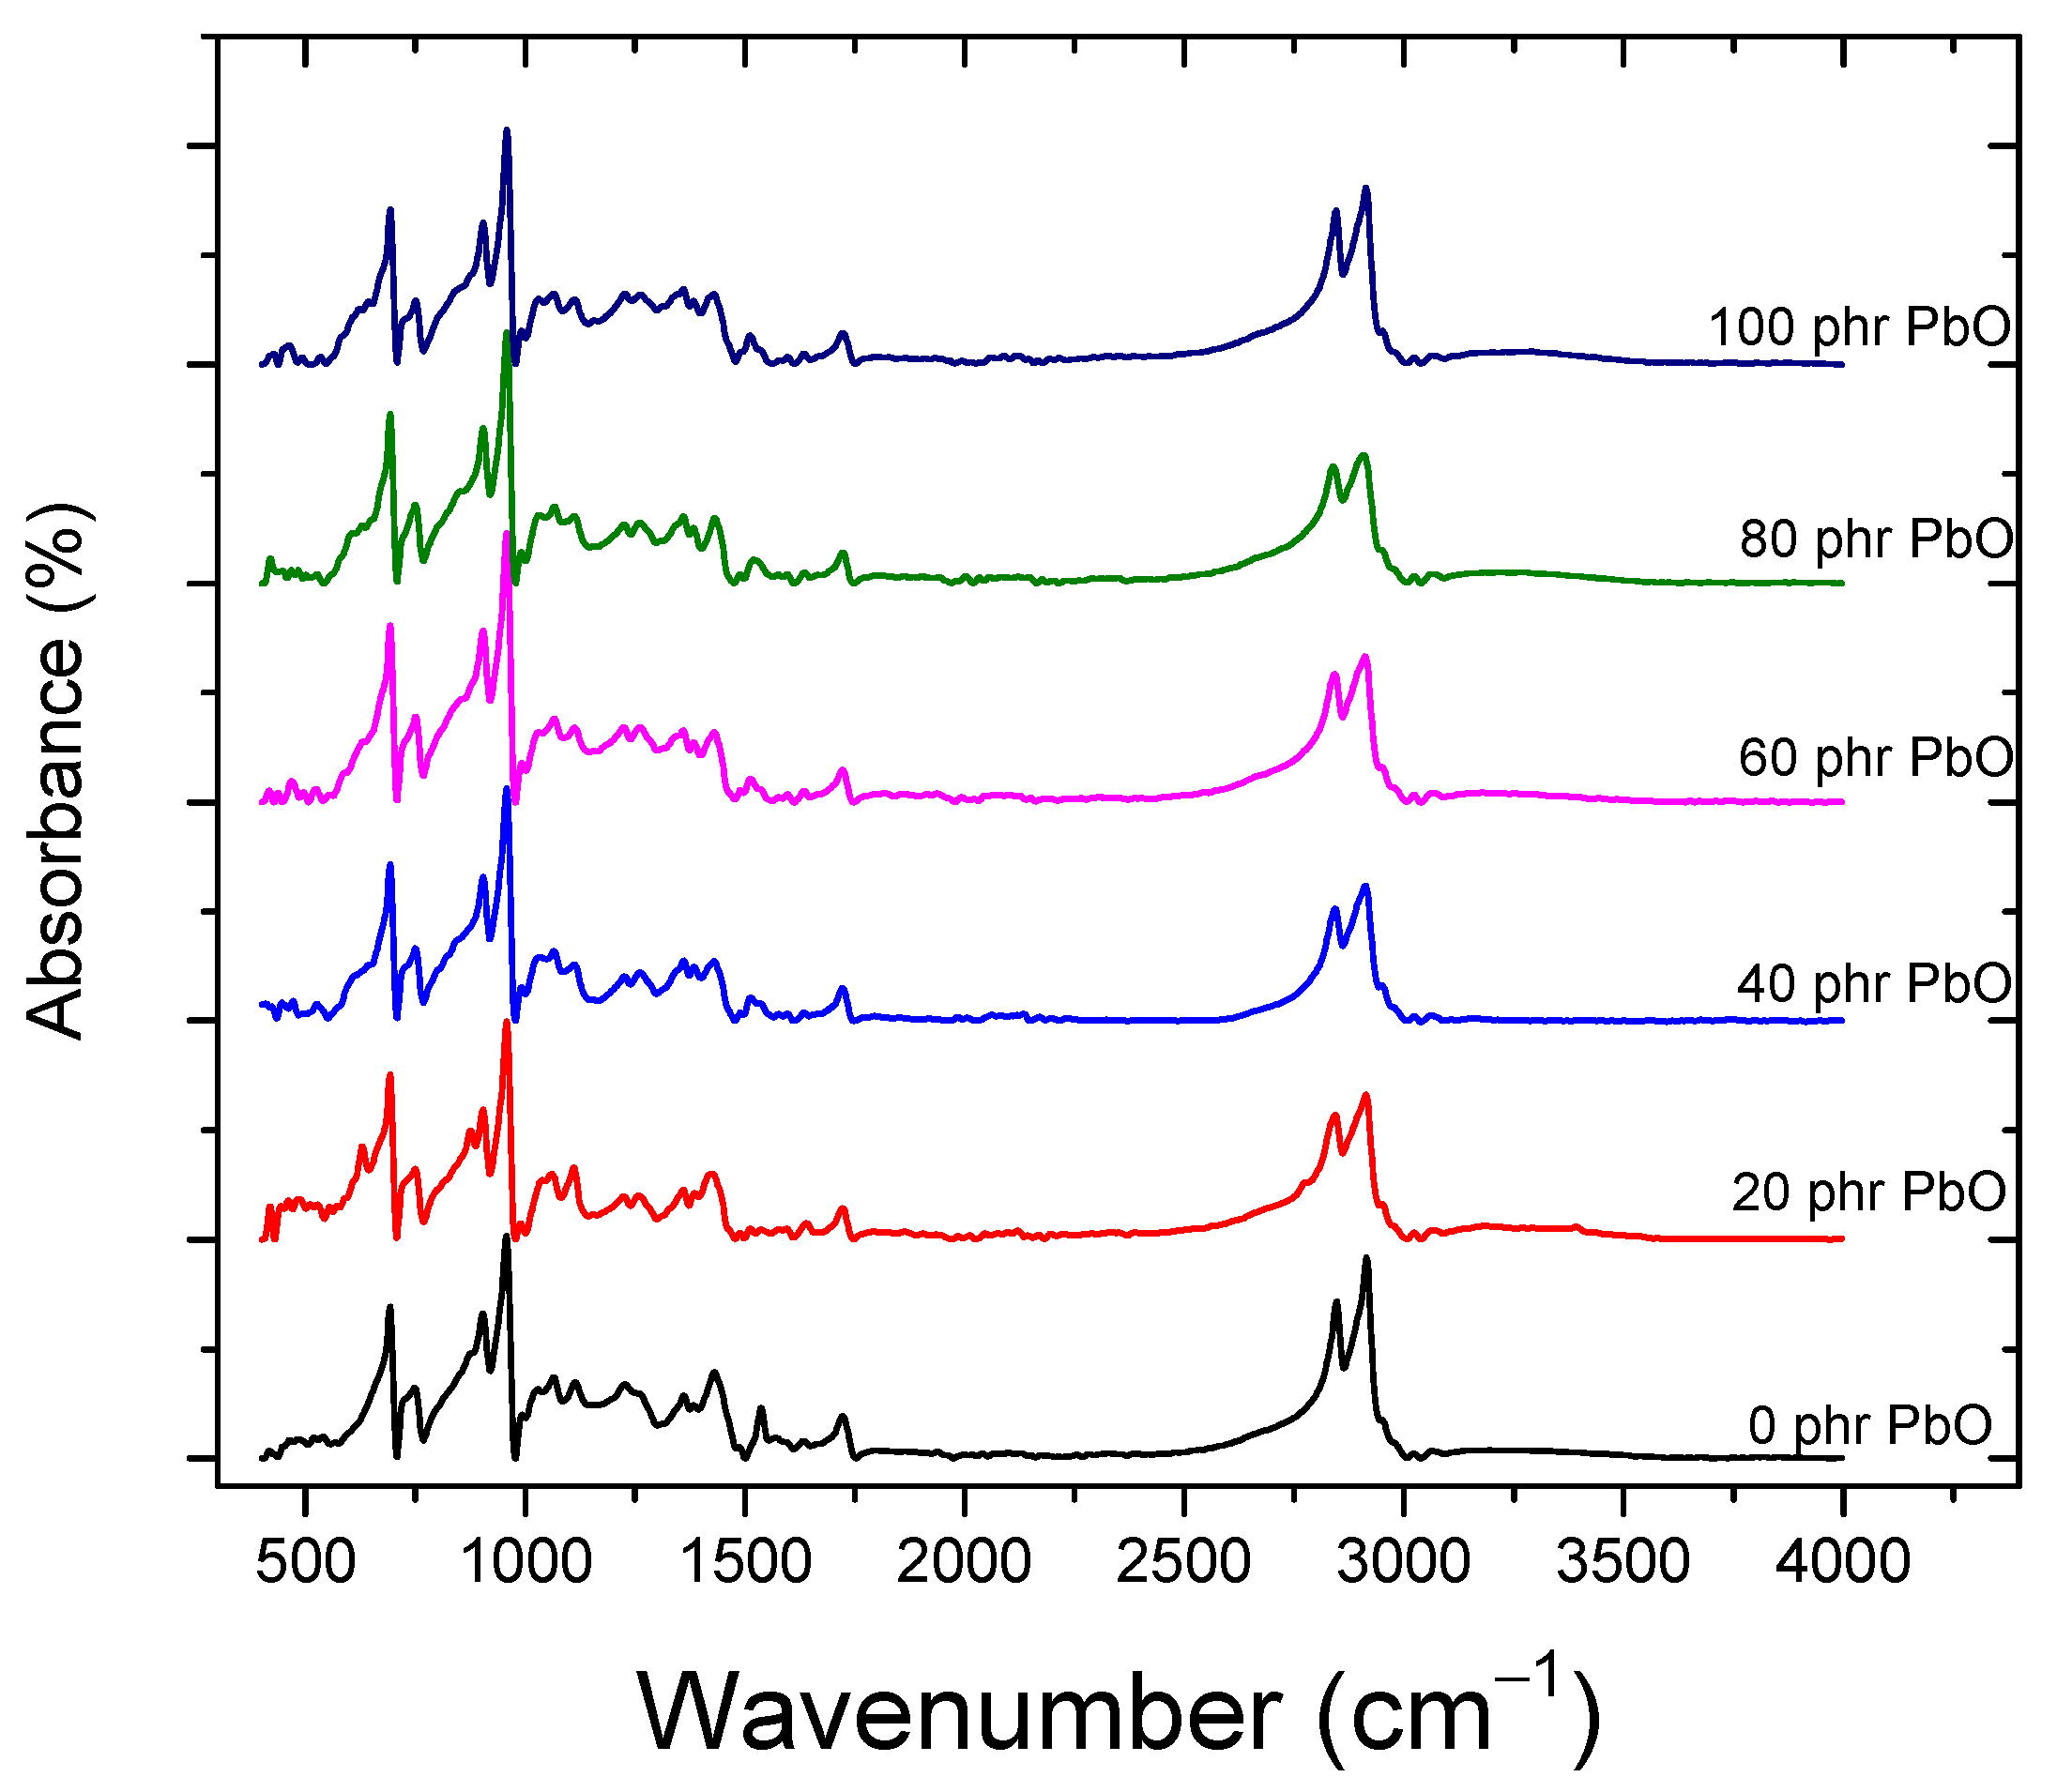
4.1. Fourier-Transform Infrared Spectroscopy (FTIR)

The FTIR spectra of the NBR/SBR blends filled with different concentrations of lead oxide (0–100 phr) are shown in Figure 1. The two strong peaks observed in all samples in the range 2915–2908 cm−1 and 2846–2839 cm−1 were due to the symmetric stretching of the C–H band. The peak at 1723–1722 cm−1 was due to the C=O stretching band of aldehyde in the system. The peak at 1640–1634 cm−1 corresponded to the C=C stretching band that can be attributed to the alkane group, and the peak at 1430–1426 cm−1 corresponded to the O-H bending band that can be attributed to carboxylic acid. Both peaks at 1385–1383 cm−1 and 1361–1360 cm−1 corresponded to the S=O stretching band of phenol. The peak at 1263–1258 cm−1 corresponded to a C-O stretching group attributed to alkyl aryl ether, while the peak at 1227–1224 cm−1 corresponded to the C-N stretching group attributed to the amine class. Both peaks at 1114–1111 cm−1 and 1066–1060 cm−1 corresponded to a C-O stretching group attributed to the ester class. The peaks observed at 957–959 cm−1 and 749–751 cm−1 correspond to the C=C bending attributed to the alkane group. The peak observed at about 470 cm−1 in all of the samples except S0 (lead-free) is attributed to the Pb–O stretching linkage in the filled blend molecules [28,29].

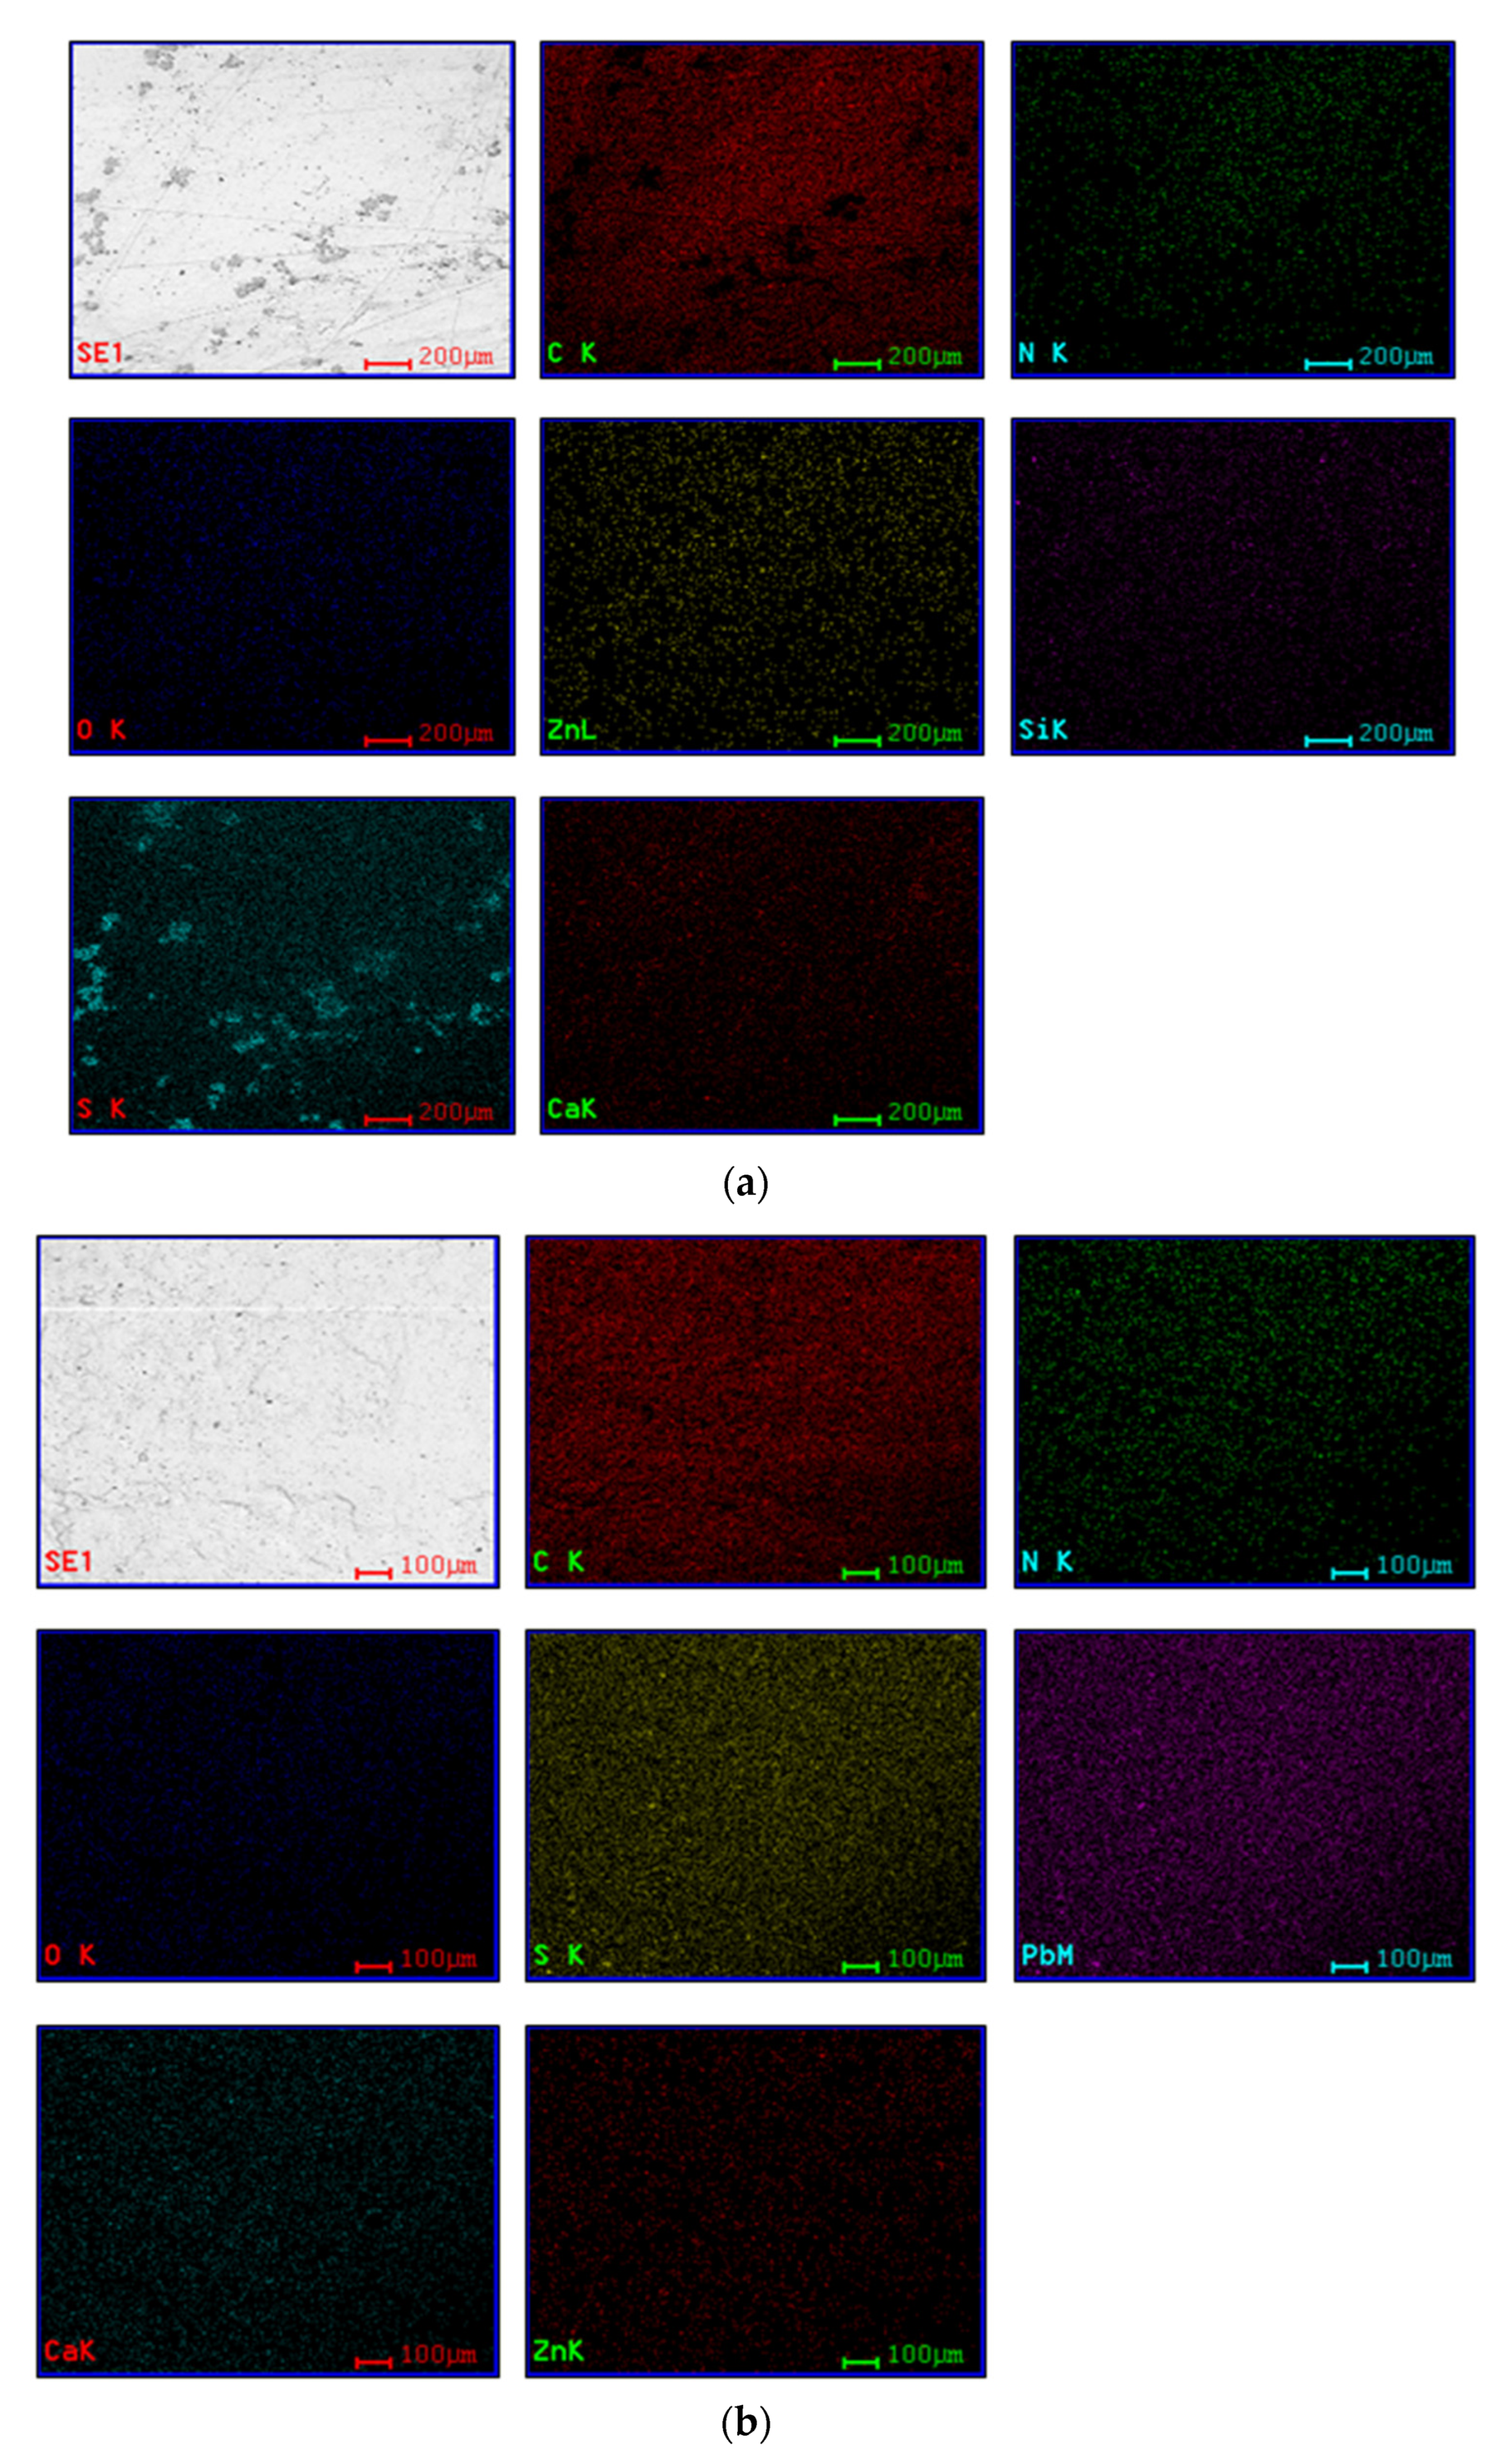
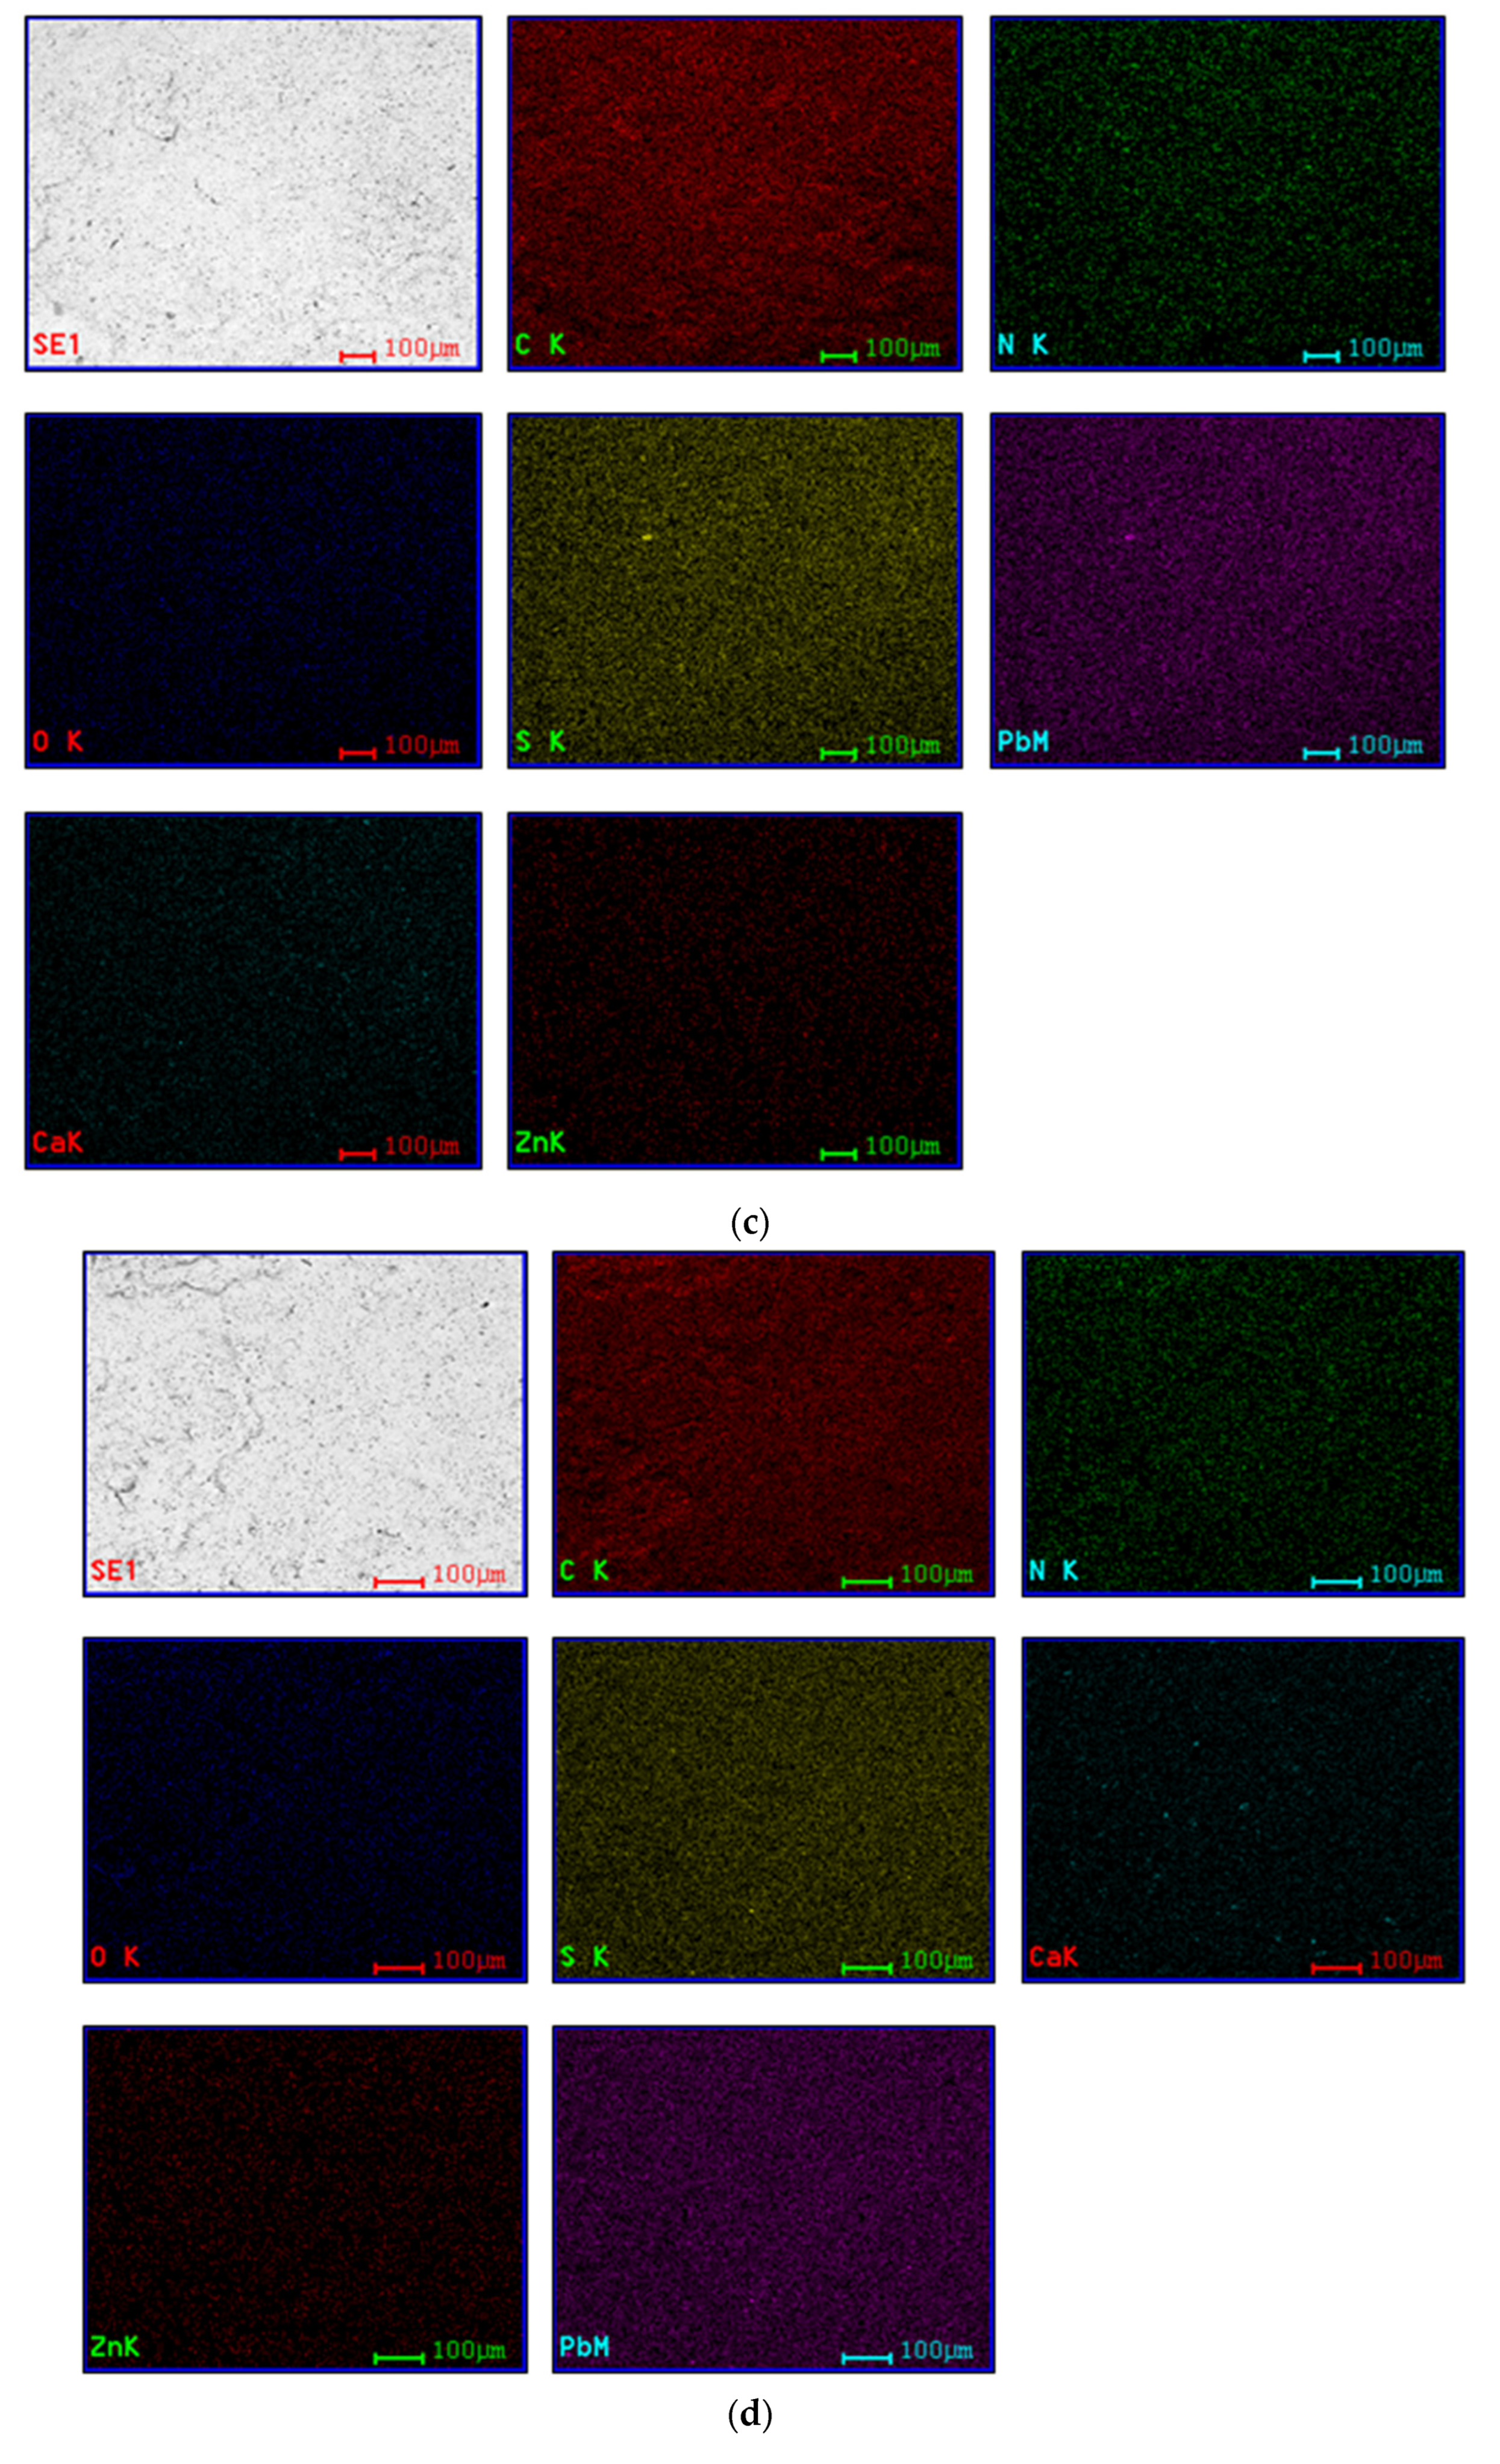
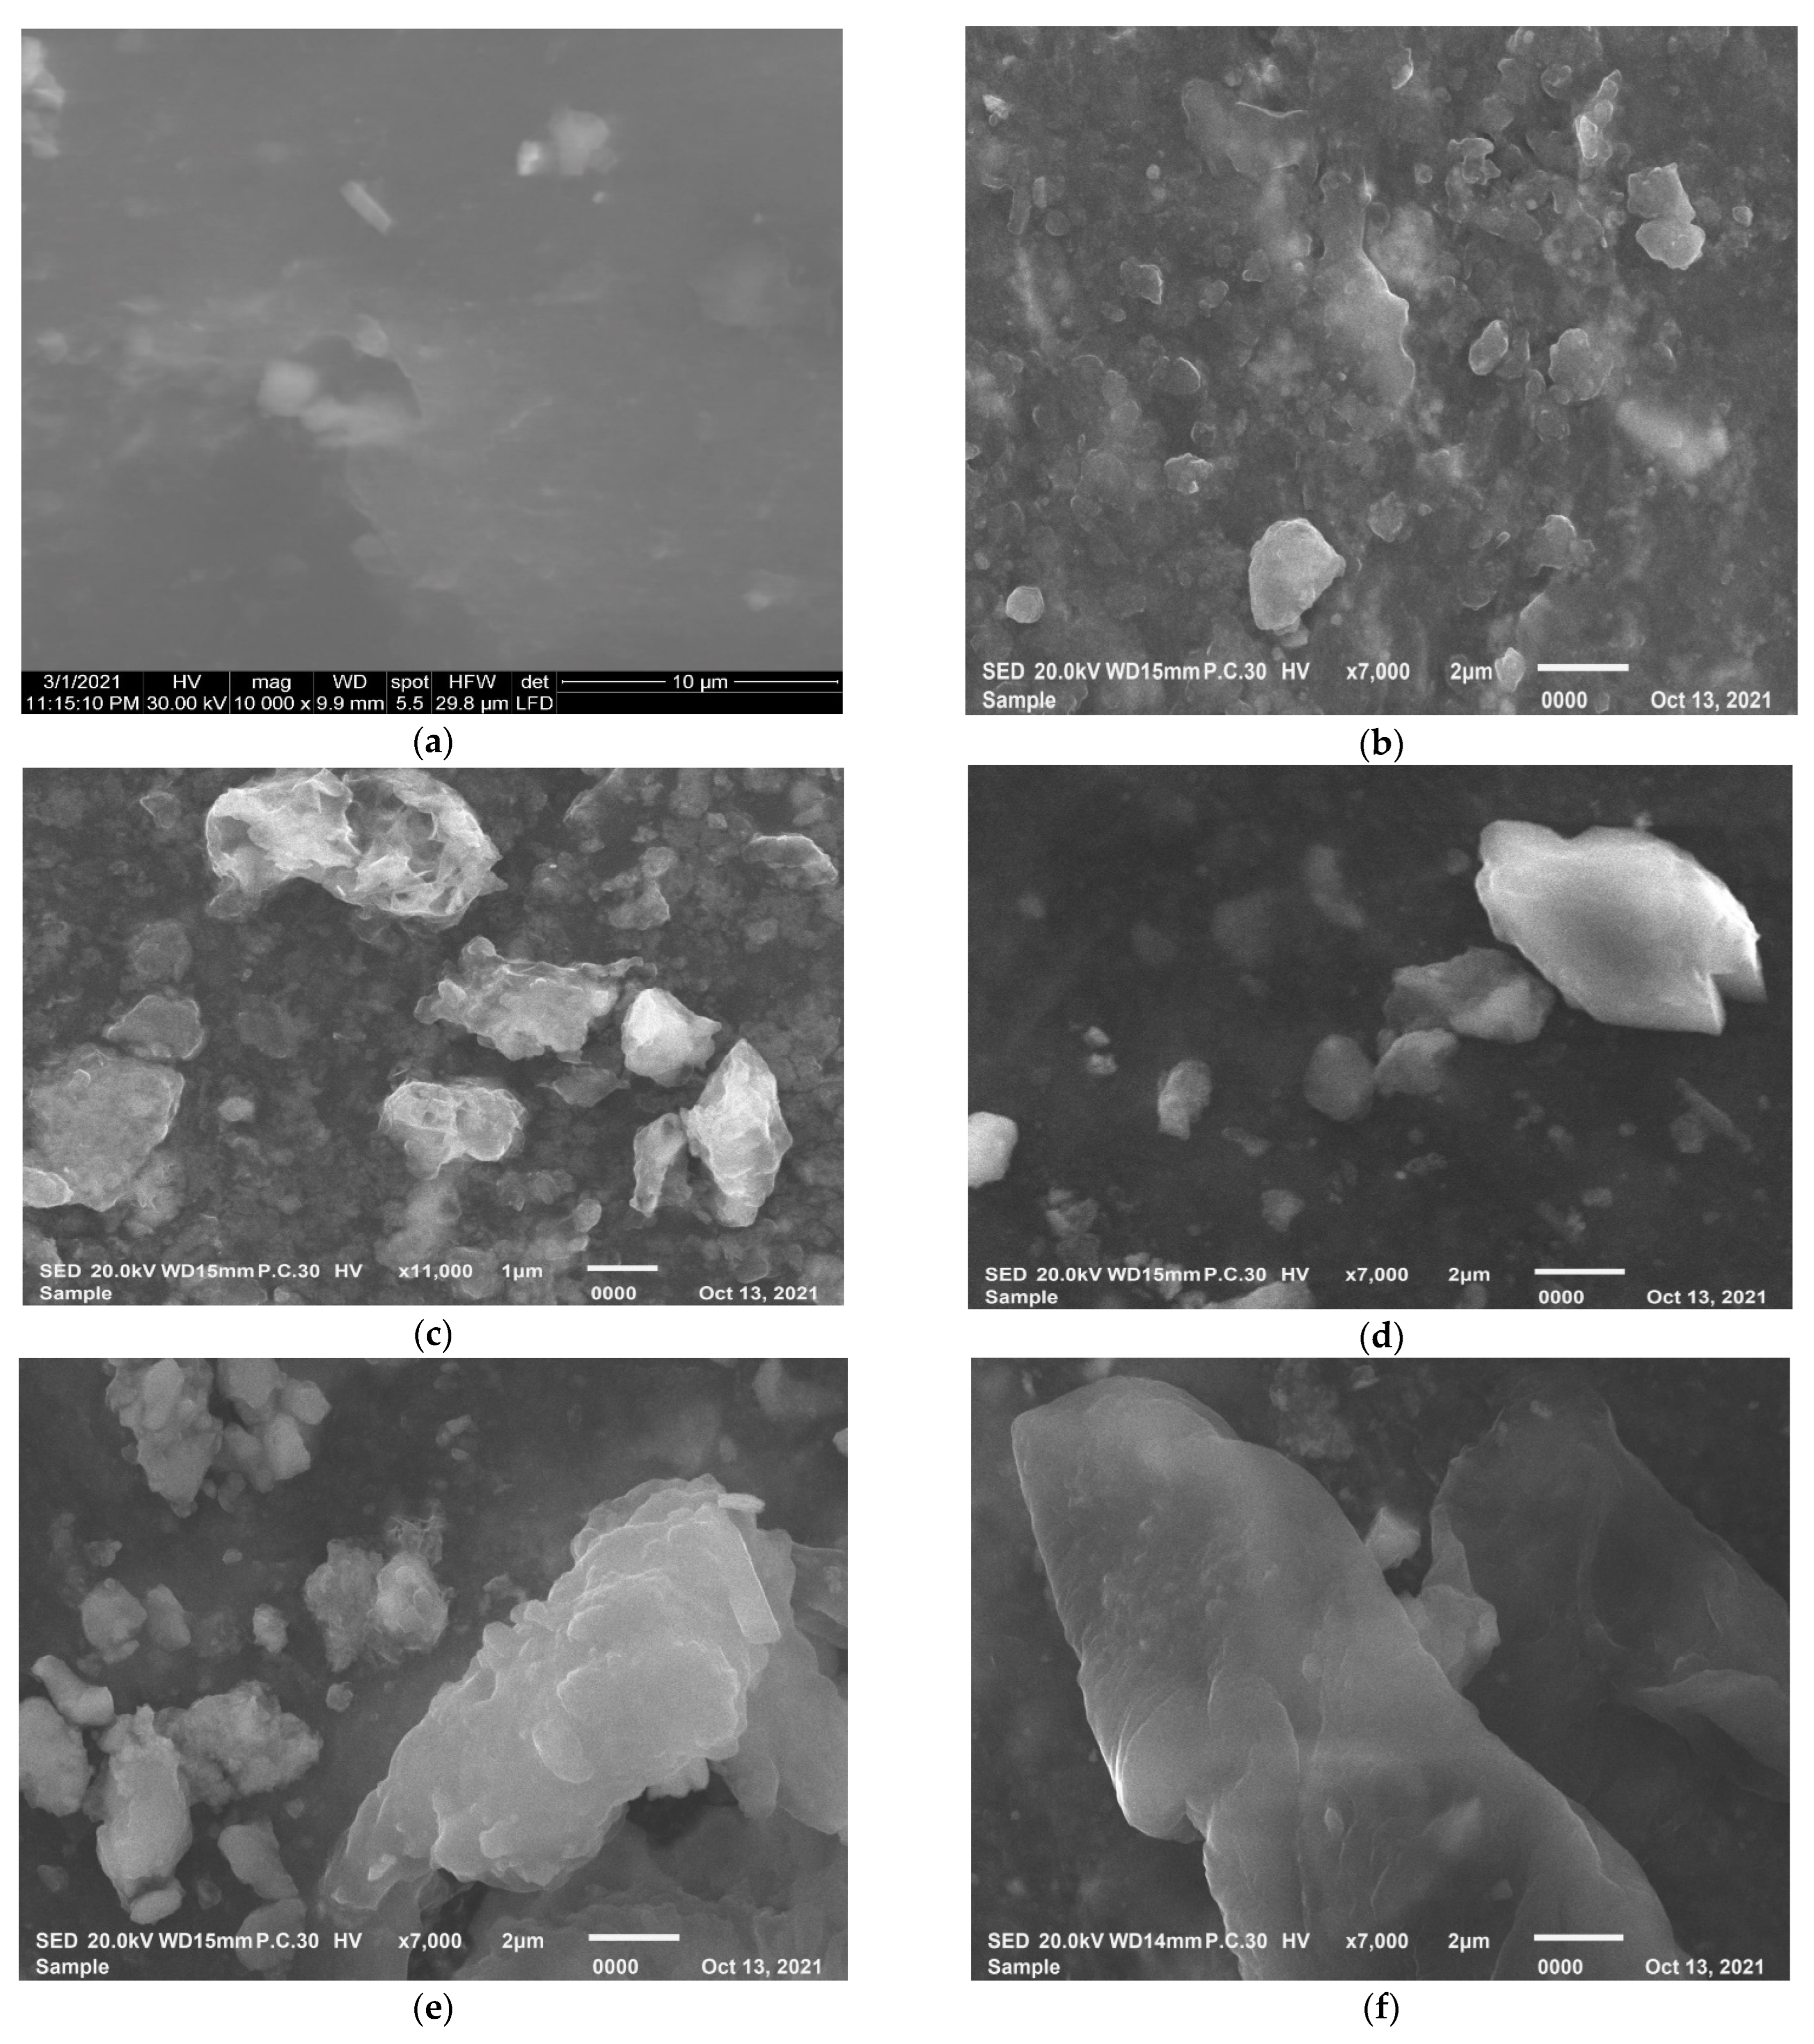
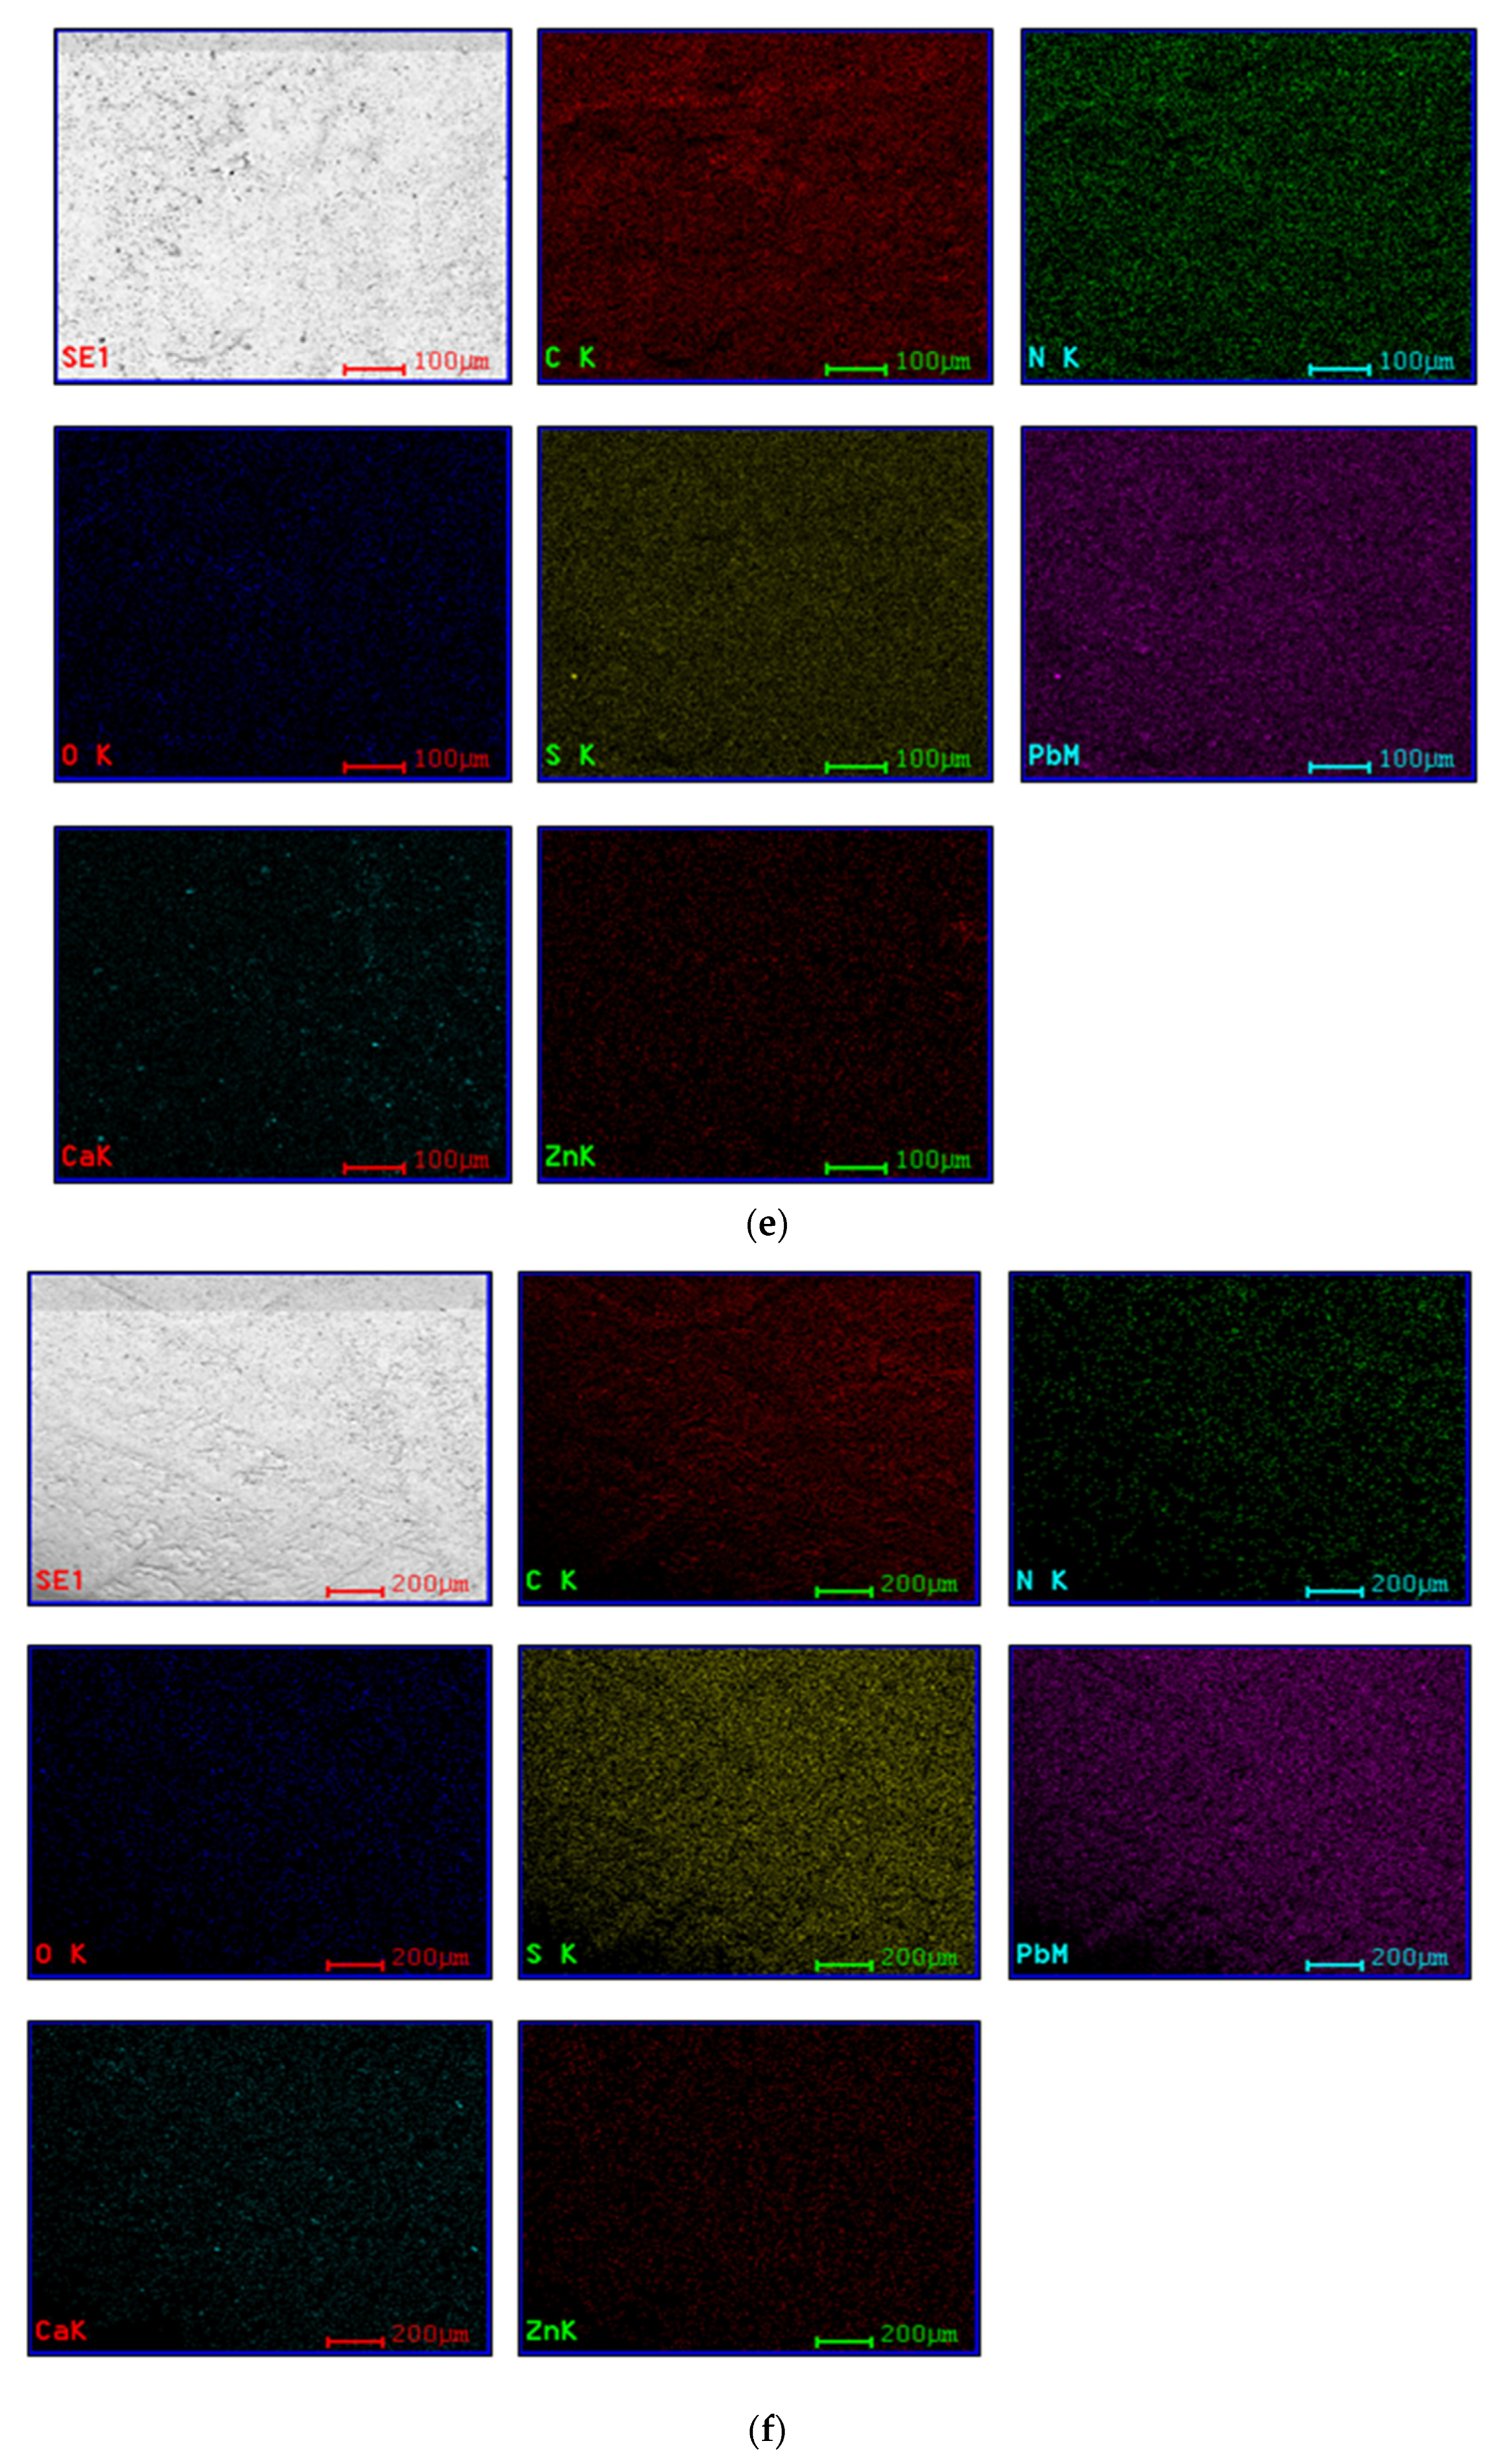
4.2. Scanning Electron Microscope (SEM)

A scanning electron microscope (SEM, FEI Inspect S, Oxford USA) was used to determine the nature of the particle distribution in the prepared rubber matrix. Figure 2 shows the SEM images of NBR/SBR composites with different fillers (PbO) concentrations. The areas of elemental agglomeration are shown in some parts of Figure 2a–f. This agglomeration appears differently among the obtained samples, which may result from the compounding technique between PbO and the SBR/NBR blends. The elemental concentration of the NBR/SBR blends at different PbO concentrations is detected by energy dispersive X-ray analysis (EDX) and depicted in Table 2. Upon increasing the filler concentration, the SEM microphotographs of the PbO-containing NBR/SBR composites revealed different morphologies. The 10 phr-filled NBR/SBR blend composite had a fine and consistent distribution. According to the findings, the homogeneity of particle distribution decreases as the PbO level rises. Similar behavior was observed in several rubber composites at different filler concentrations [30]. The EDX mapping of the elemental compositions of all the prepared composites is shown in Figure 2a–f. This elemental mapping assists in the assignment of the elements involved in the observed agglomeration in the SEM images (Figure 2).
As shown in Figure 3, lead oxide seems to be uniformly distributed among the other elements in the prepared rubber composites at different phr concentrations. This uniformity supports the recommended use of this PbO-filled NBR/SBR blend as an effective material for radiation-shielding applications.

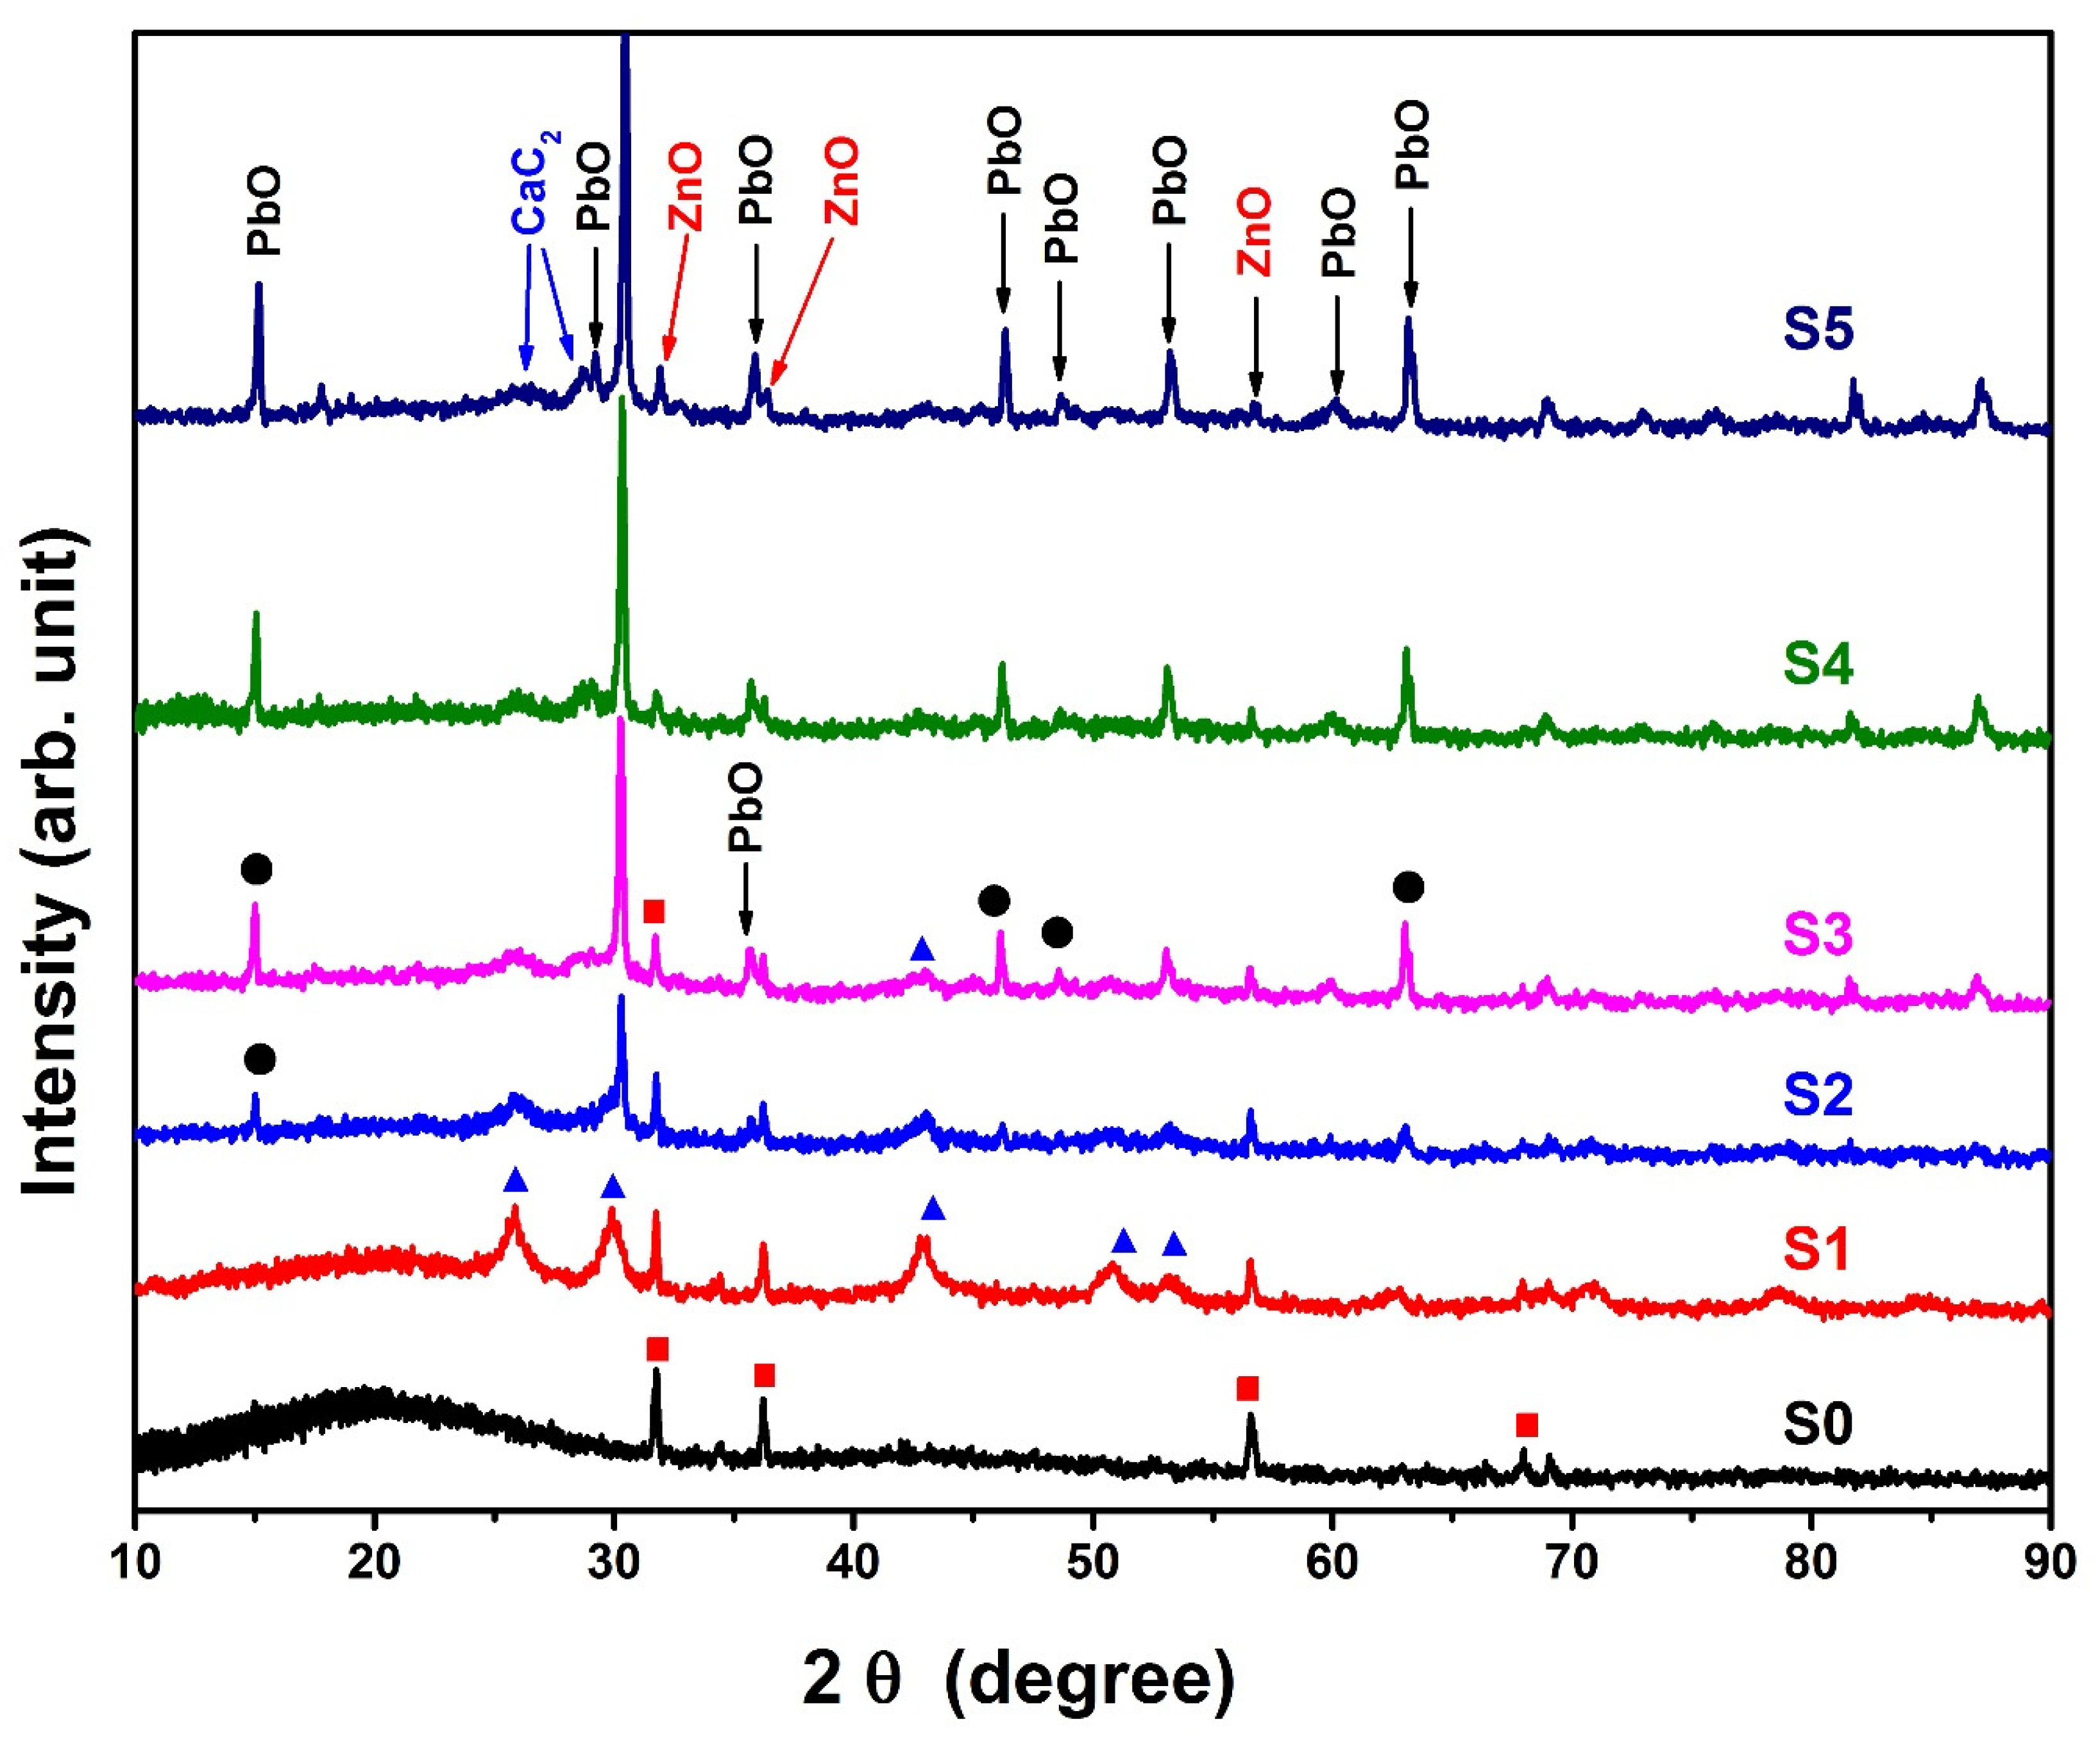
4.3. X-ray Diffraction (XRD)

The X-ray diffraction patterns (XRD) for the lead /NBR/SBR rubber composite samples doped with different amounts of PbO are shown in Figure 4. The crystallographic phase identification and line profile analysis were performed using the High Score Plus program. For sample S0, diffraction peaks were observed at 31.7, 36.2, 56.6, and 67.9°. The obtained peaks were matched to the hexagonal ZnO phase (ICDD no 01-070-2551). The observed peaks were assigned to the (100), (101), (110), and (112) planes, respectively. The line profile fitting estimates the crystallite size to be 73 nm and the lattice parameters, a, and c, to be 3.2 and 5.2 A°, respectively. For sample S1, additional peaks were observed at 26.3, 30.3, 43.4, and 51.4°, and these peaks were matched to the CaC2 phase with a cubic system (ICDD no 01-074-2044). The lattice parameter and crystallite size are estimated to be 5.86 A° and 101 nm, respectively. On the other hand, although the elemental analysis and EDX confirm the presence of the Pb element, no peaks for the PbO phase were detected due to the low amount added.
The XRD pattern of sample S2 was seen to include the peaks of the previously observed phases, ZnO and CaC2, in addition to a diffraction peak at 15.02°, which was assigned to the orthorhombic phase of PbO with the ICDD card no 00-005-0570. From samples S3 to S5, strong diffraction peaks for the PbO phase were detected and all of them were a good match with the abovementioned ICDD card. The lattice parameters a, b, and c of the orthorhombic PbO were 5.48, 4.75, and 5.89 A°, respectively, and the crystallite size was estimated to be 60 nm.
The relative intensity ratio for multiple phases is a good indicator for quantitative phase analysis. As illustrated in Figure 4, as the percentage of PbO increased, the peak intensity of PbO increased, and the intensity of ZnO and CaC2 decreased. The effect of the enhancement in the peak intensity ratio of PbO on both ZnO and CaC2 is an indicator of the PbO percentage, which is in agreement with the results obtained from EDX.

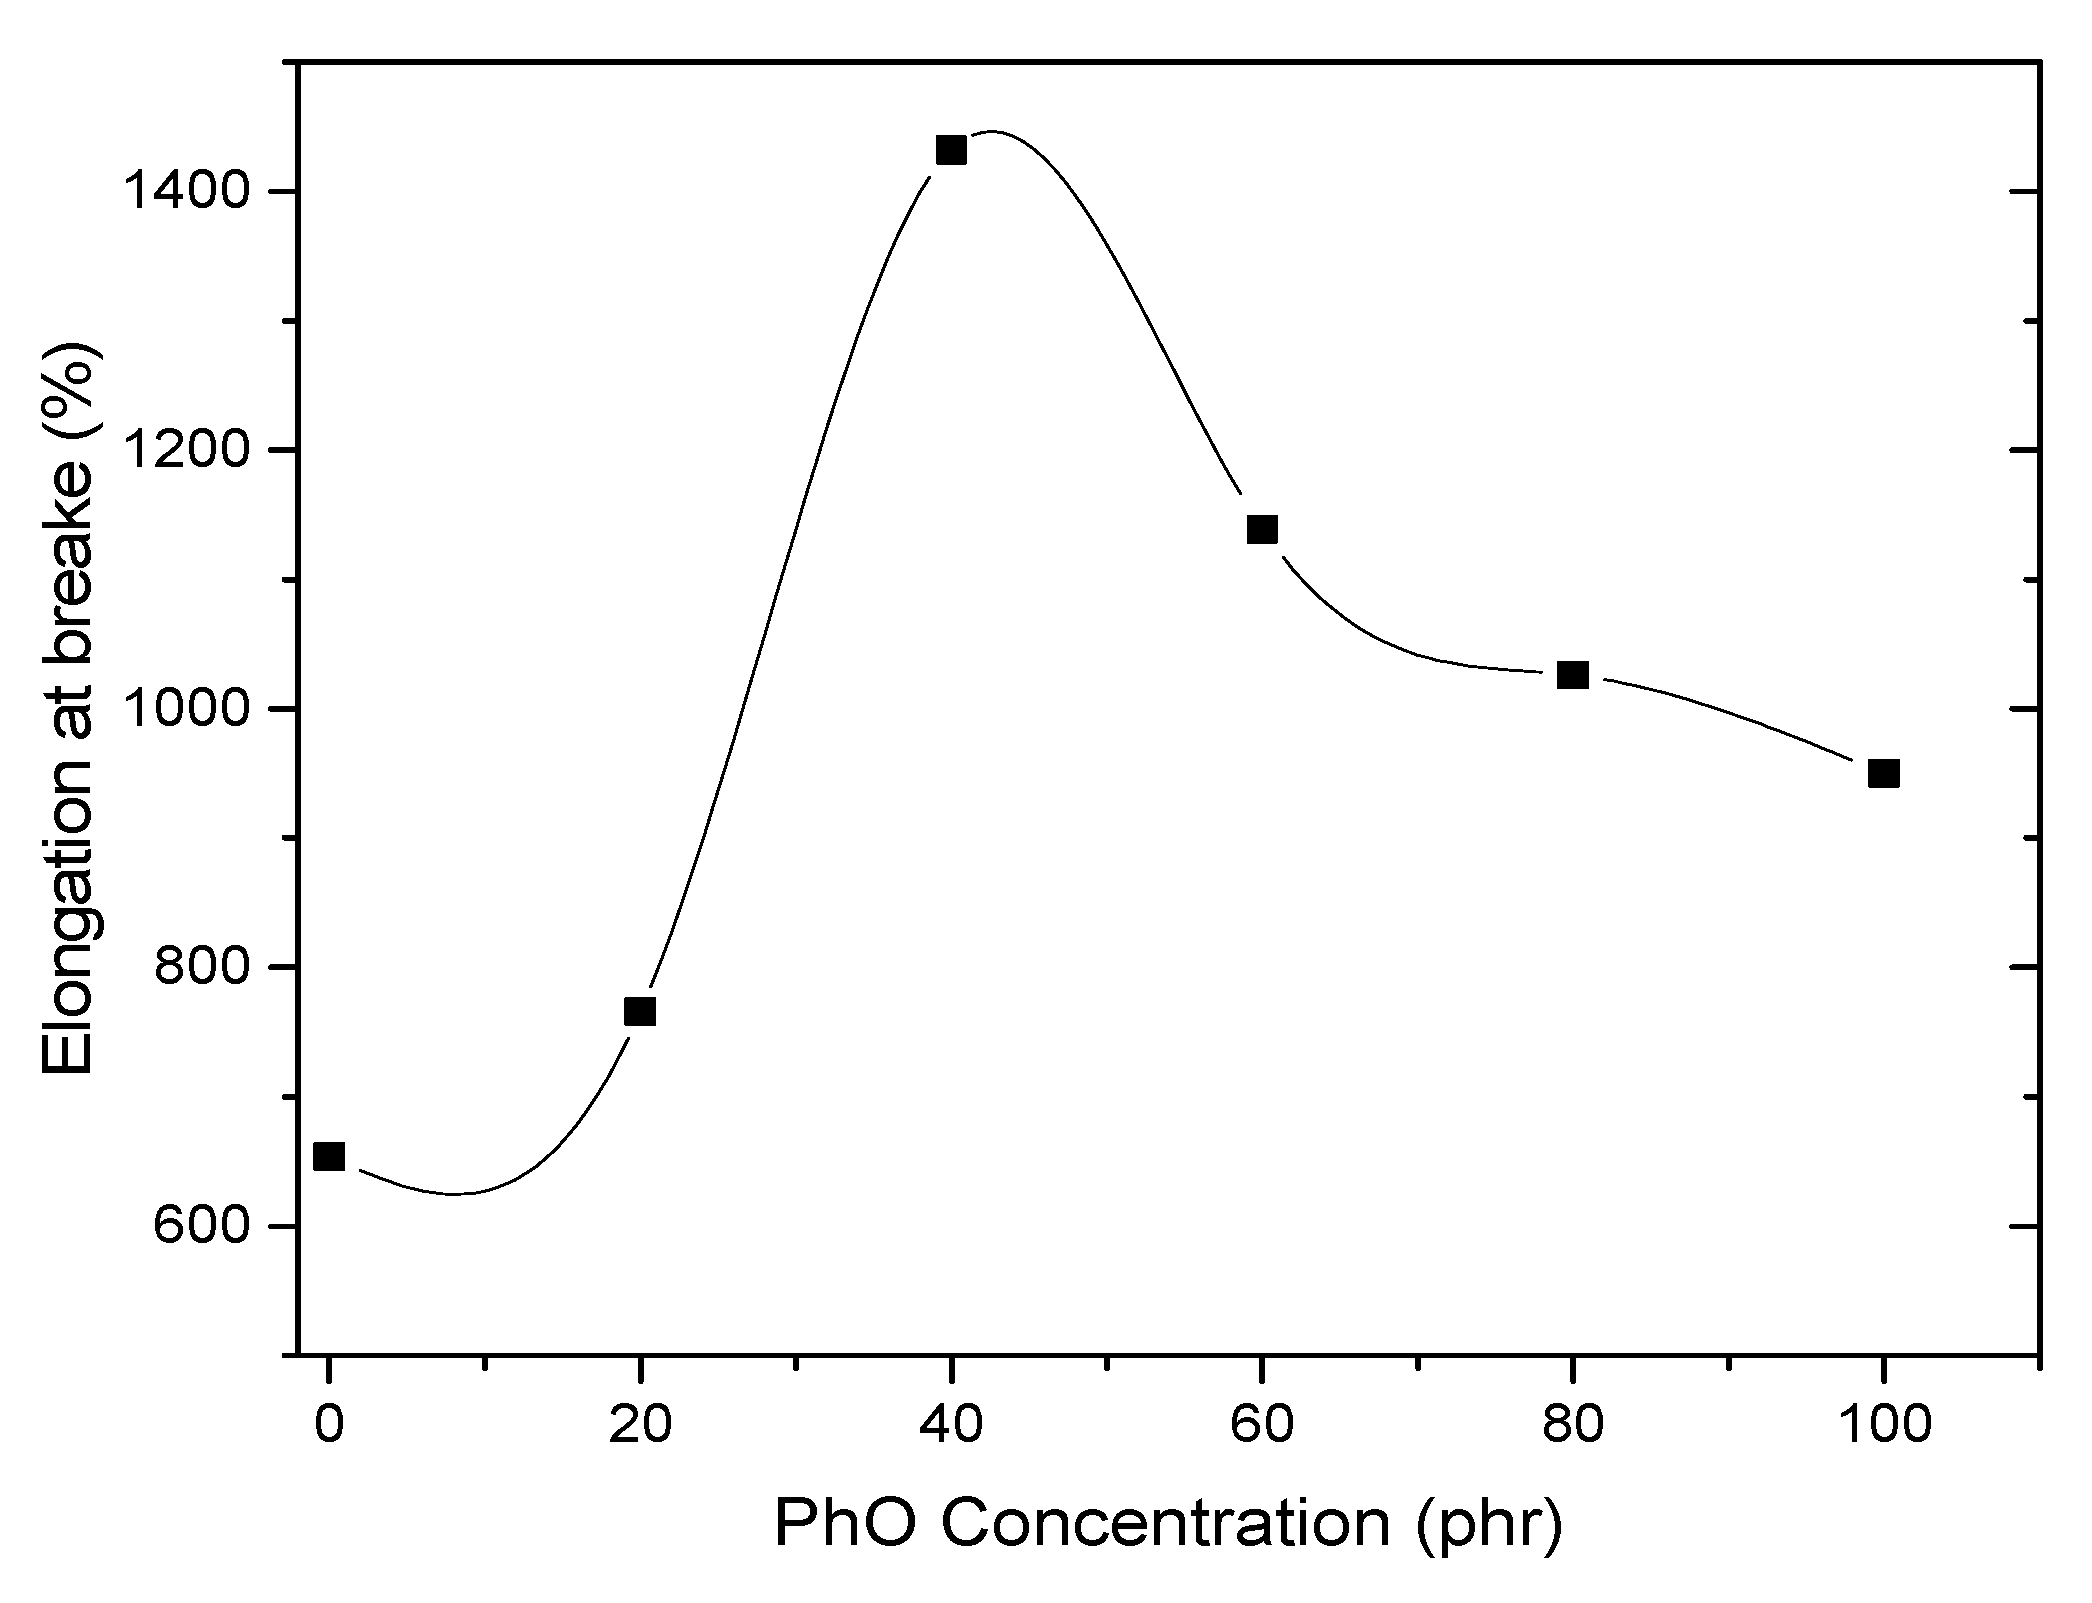
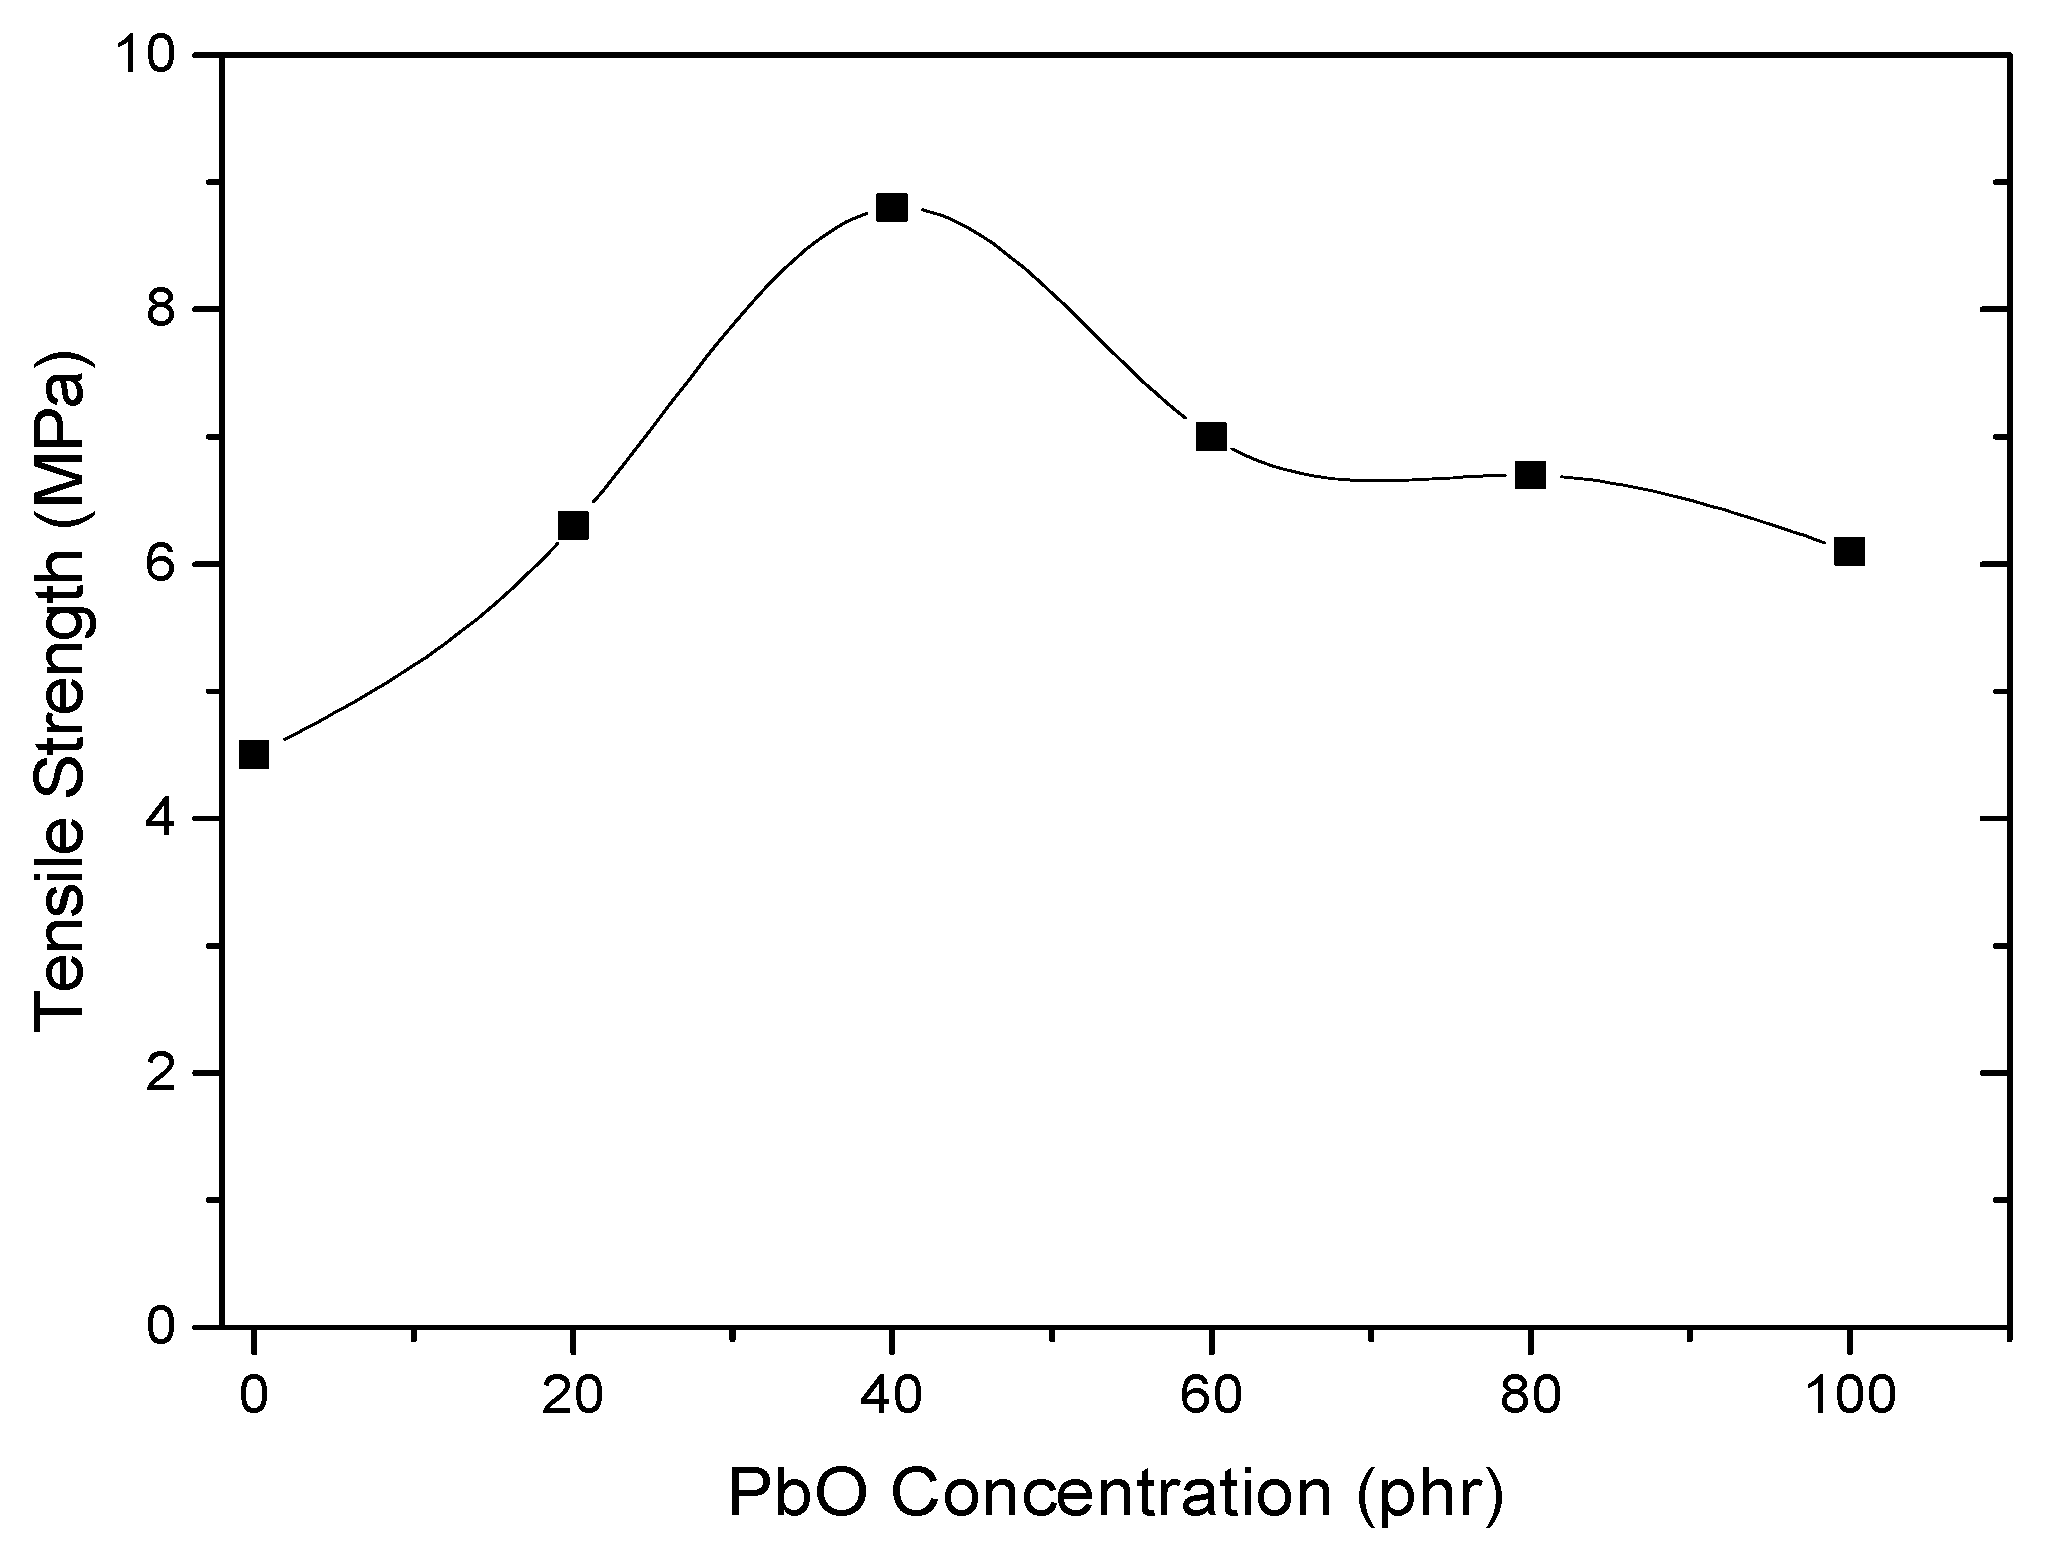
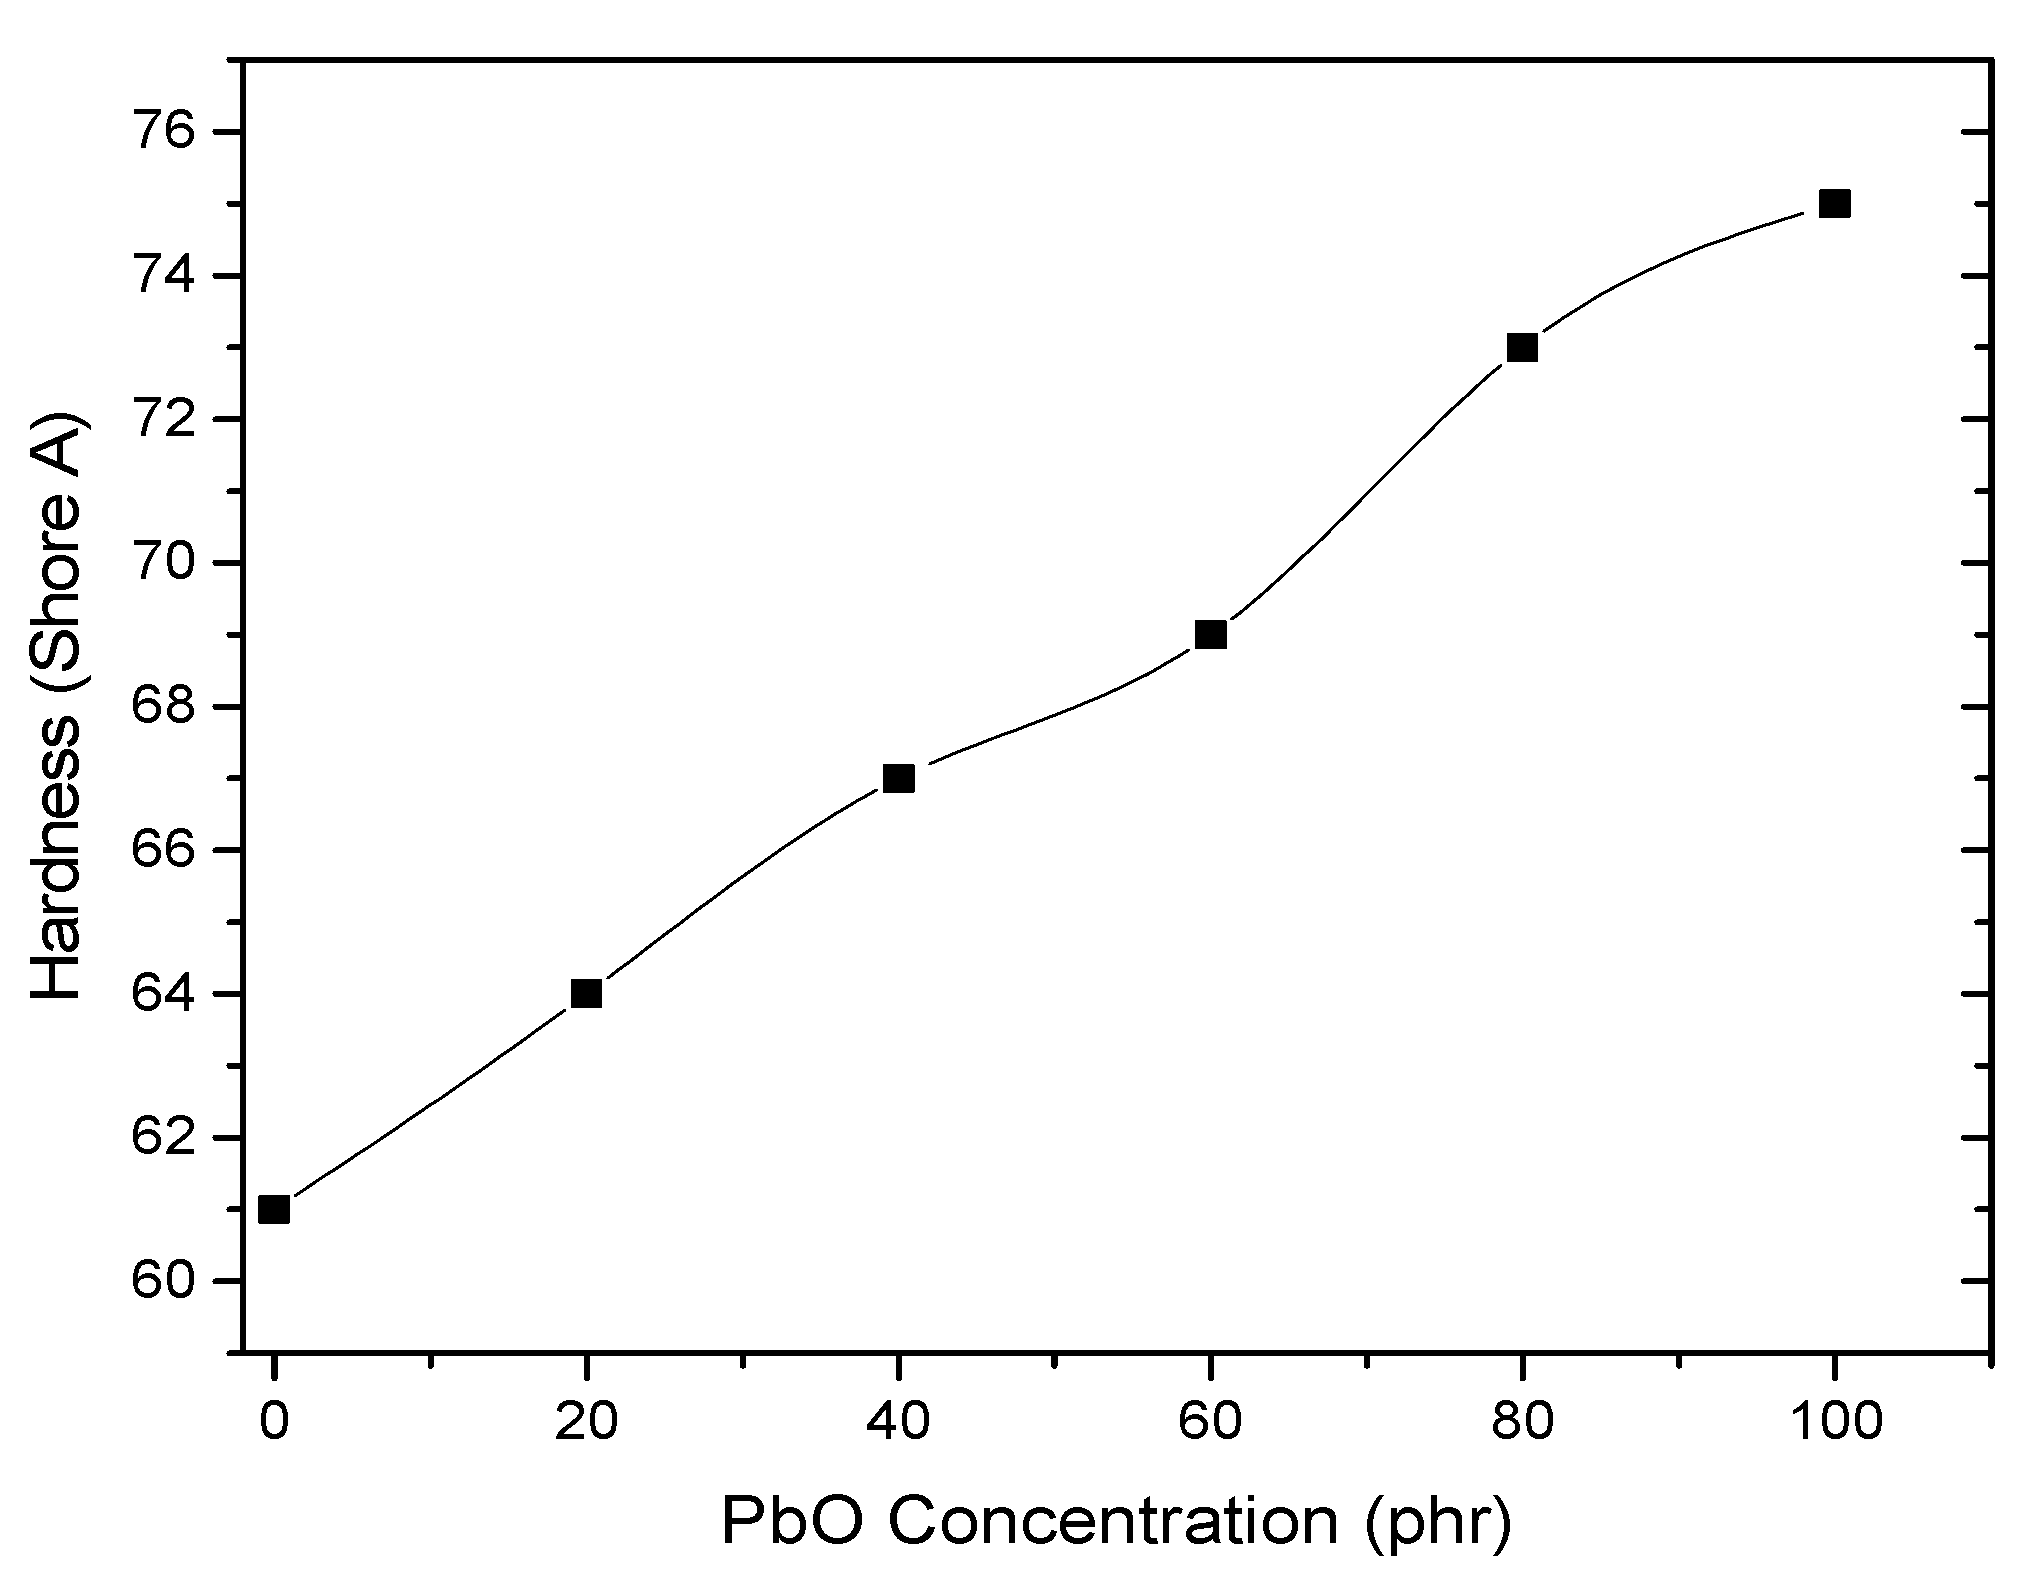
4.4. Mechanical Properties

Figure 5 and Figure 6 show the influence of lead concentration on the tensile strength and elongation at the break of an NBR/SBR blend, respectively. Tensile strength and elongation at break increase with increasing lead concentrations until PbO concentrations reach 40 phr, at which point they decrease. More surface area is available for intermolecular interaction between filler particles and rubber molecules as the filler loading is increased, resulting in reinforcement. However, at roughly 40 phr of filler loading, maximal reinforcing is obtained, following which, dilution occurs when the filler quantity is raised [10]. Because the filler particles or aggregates were no longer properly distributed or wetted by the rubber phase, tensile strength and elongation at break were reduced. Several rubber composites have revealed similar results, as reported [5,11,31].
Since the hardness of rubber always increases with the filler load [32], the hardness of the prepared rubber is increased with the increase in the concentration of lead, as shown in Figure 7. This behavior can be explained by the reduction in the plasticity of the rubber chain with the increase in filler concentration resulting in an increase in the rigidity of the rubber composites due to the hard nature of PbO [33].

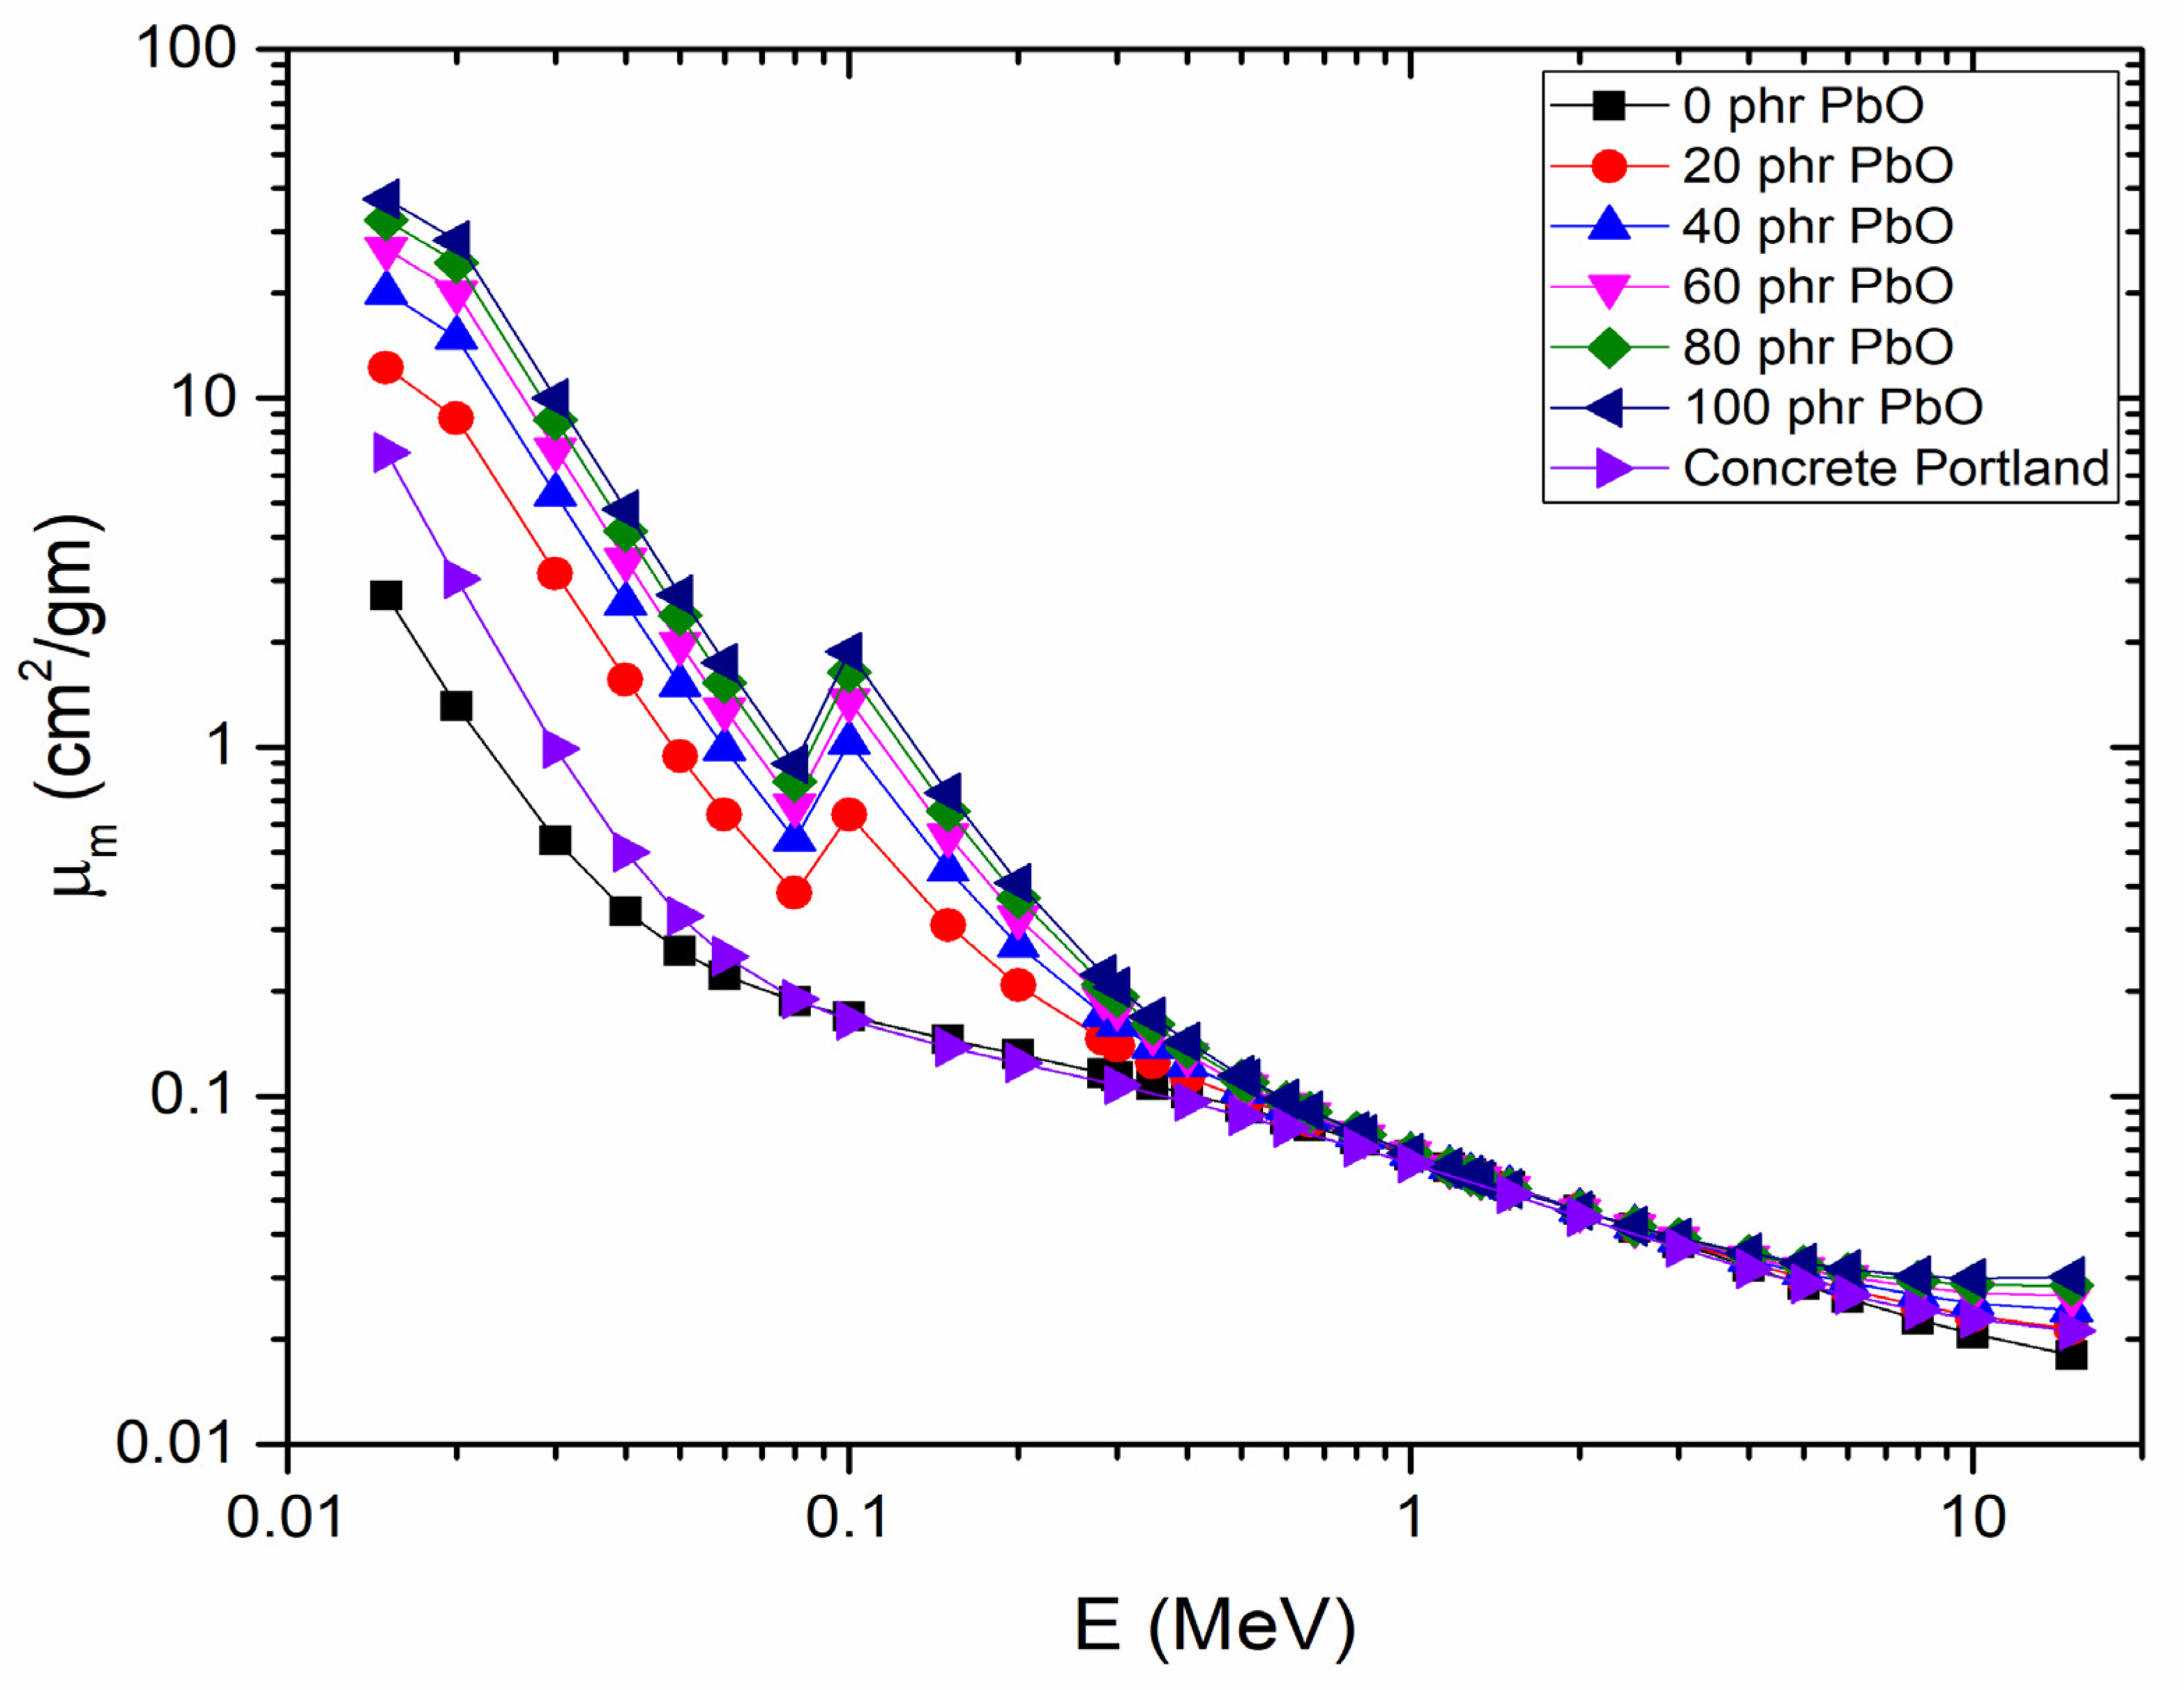
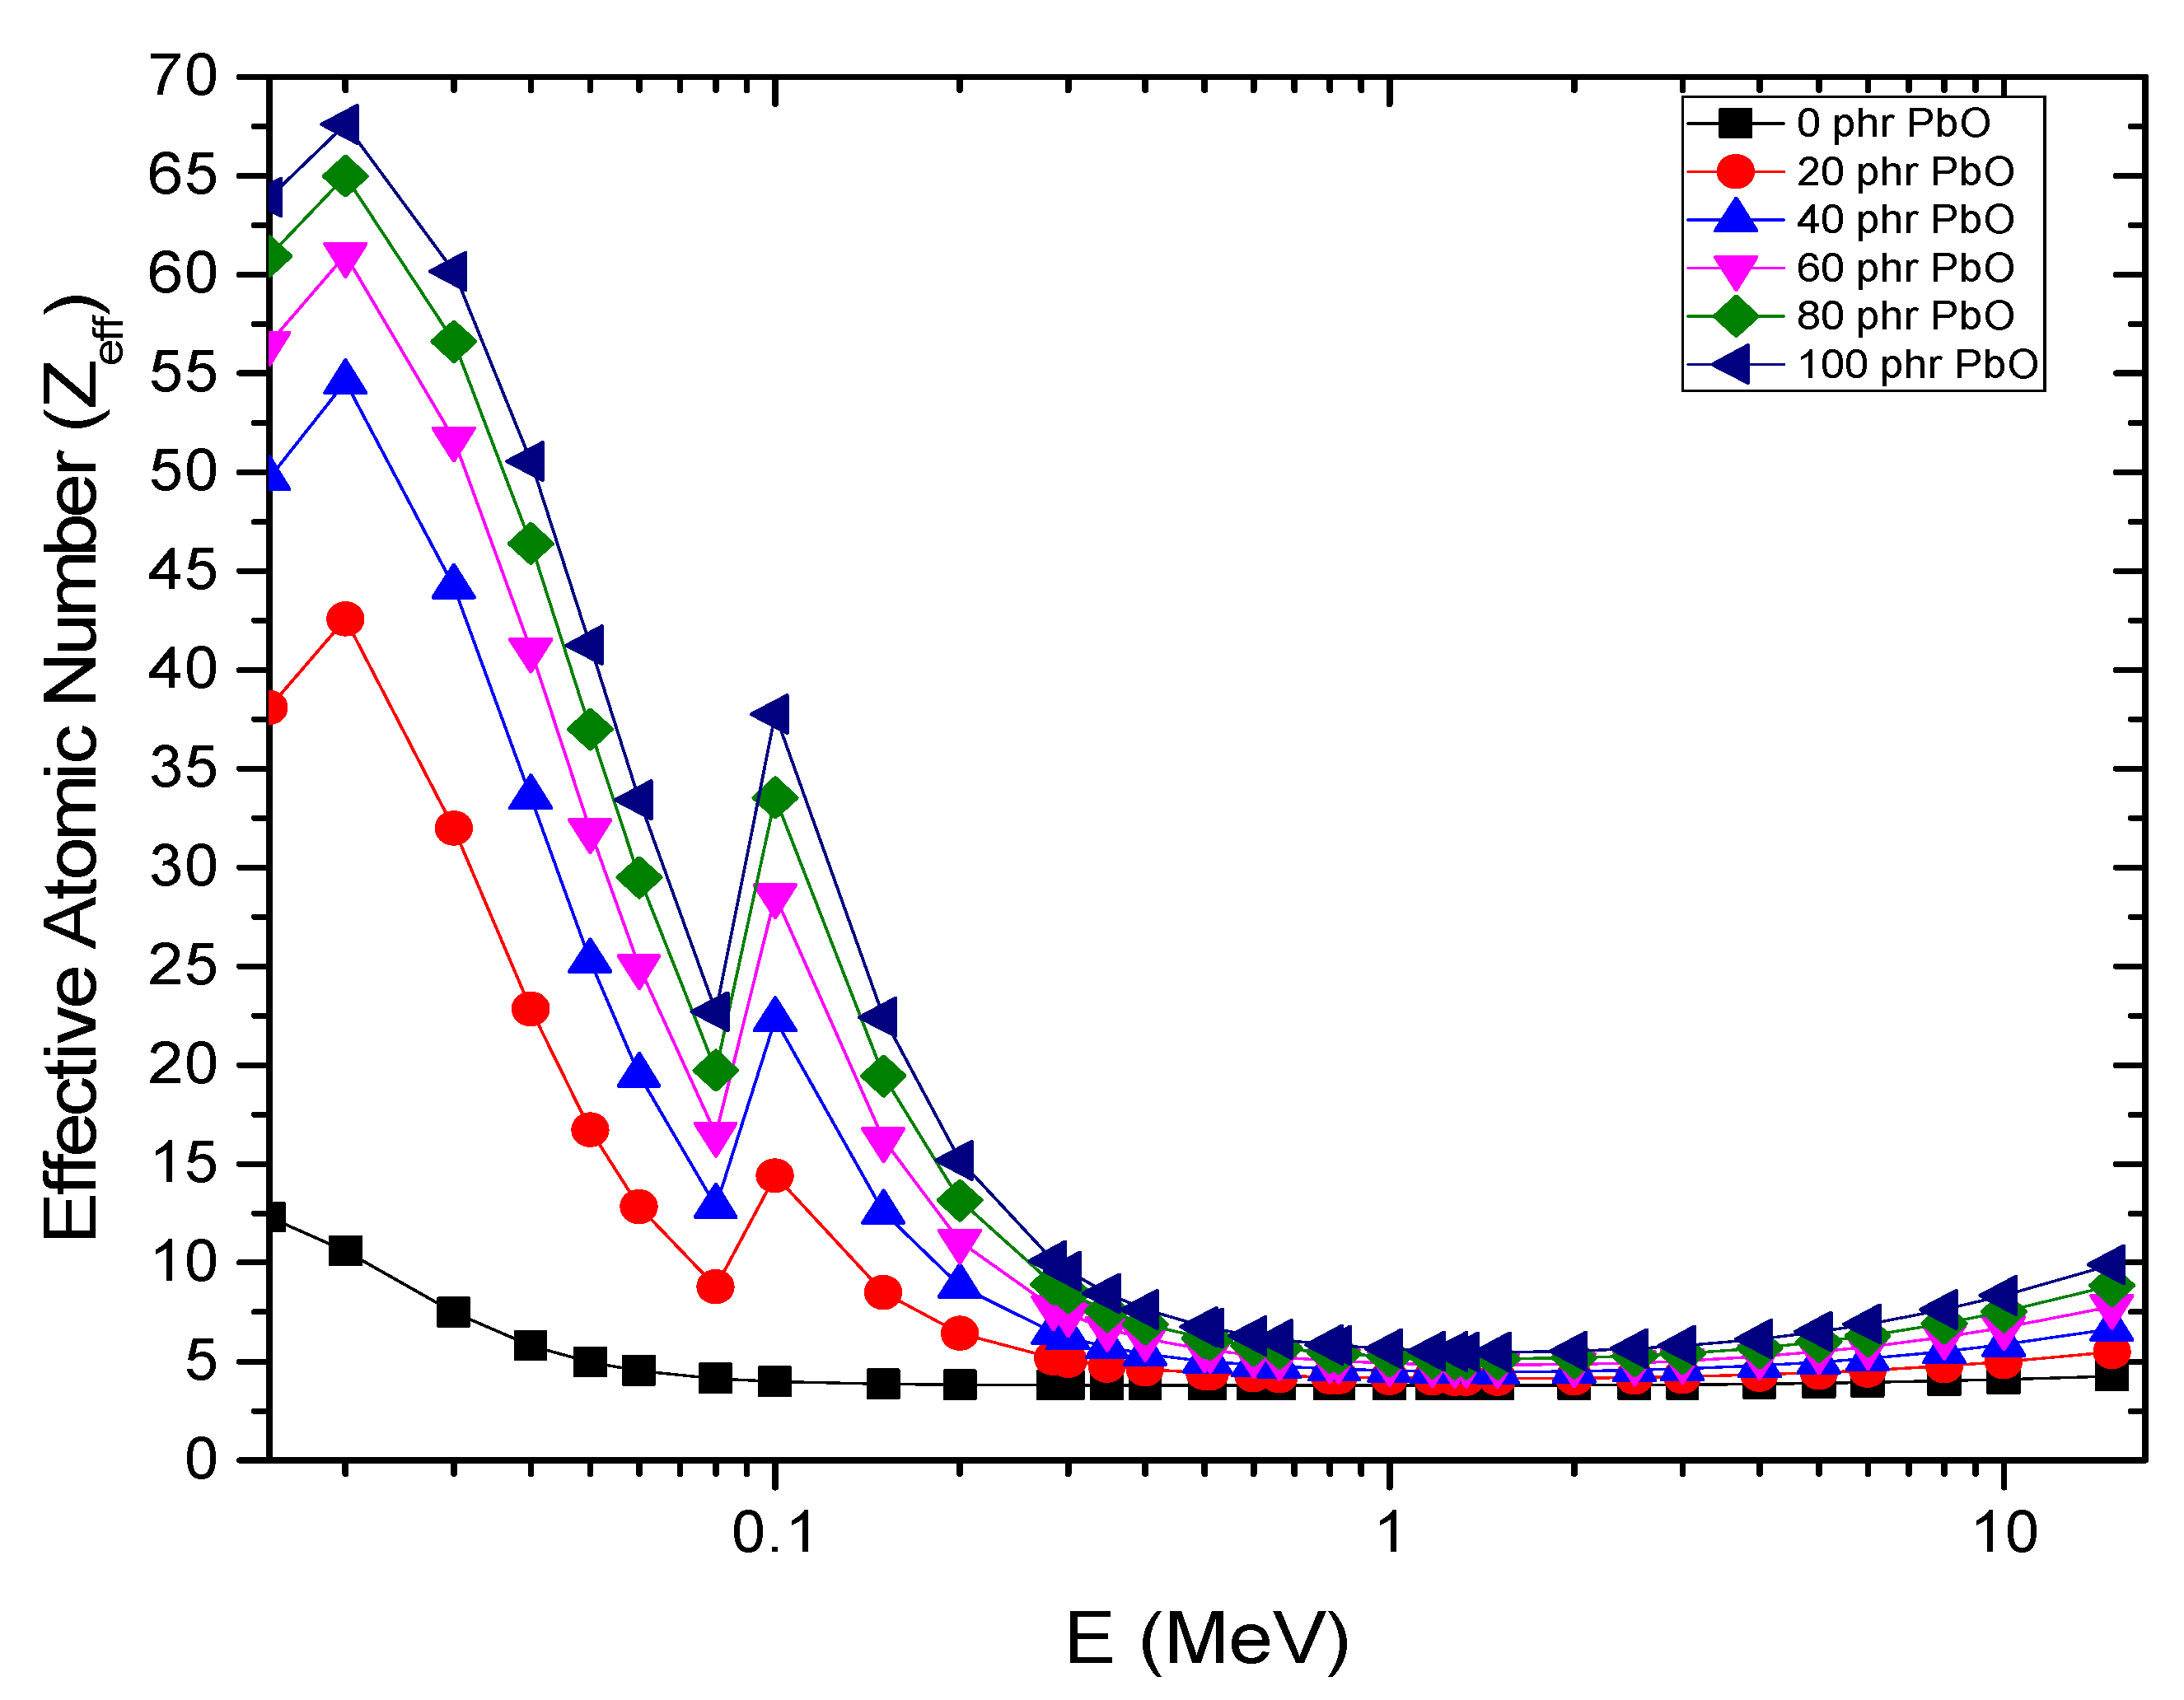
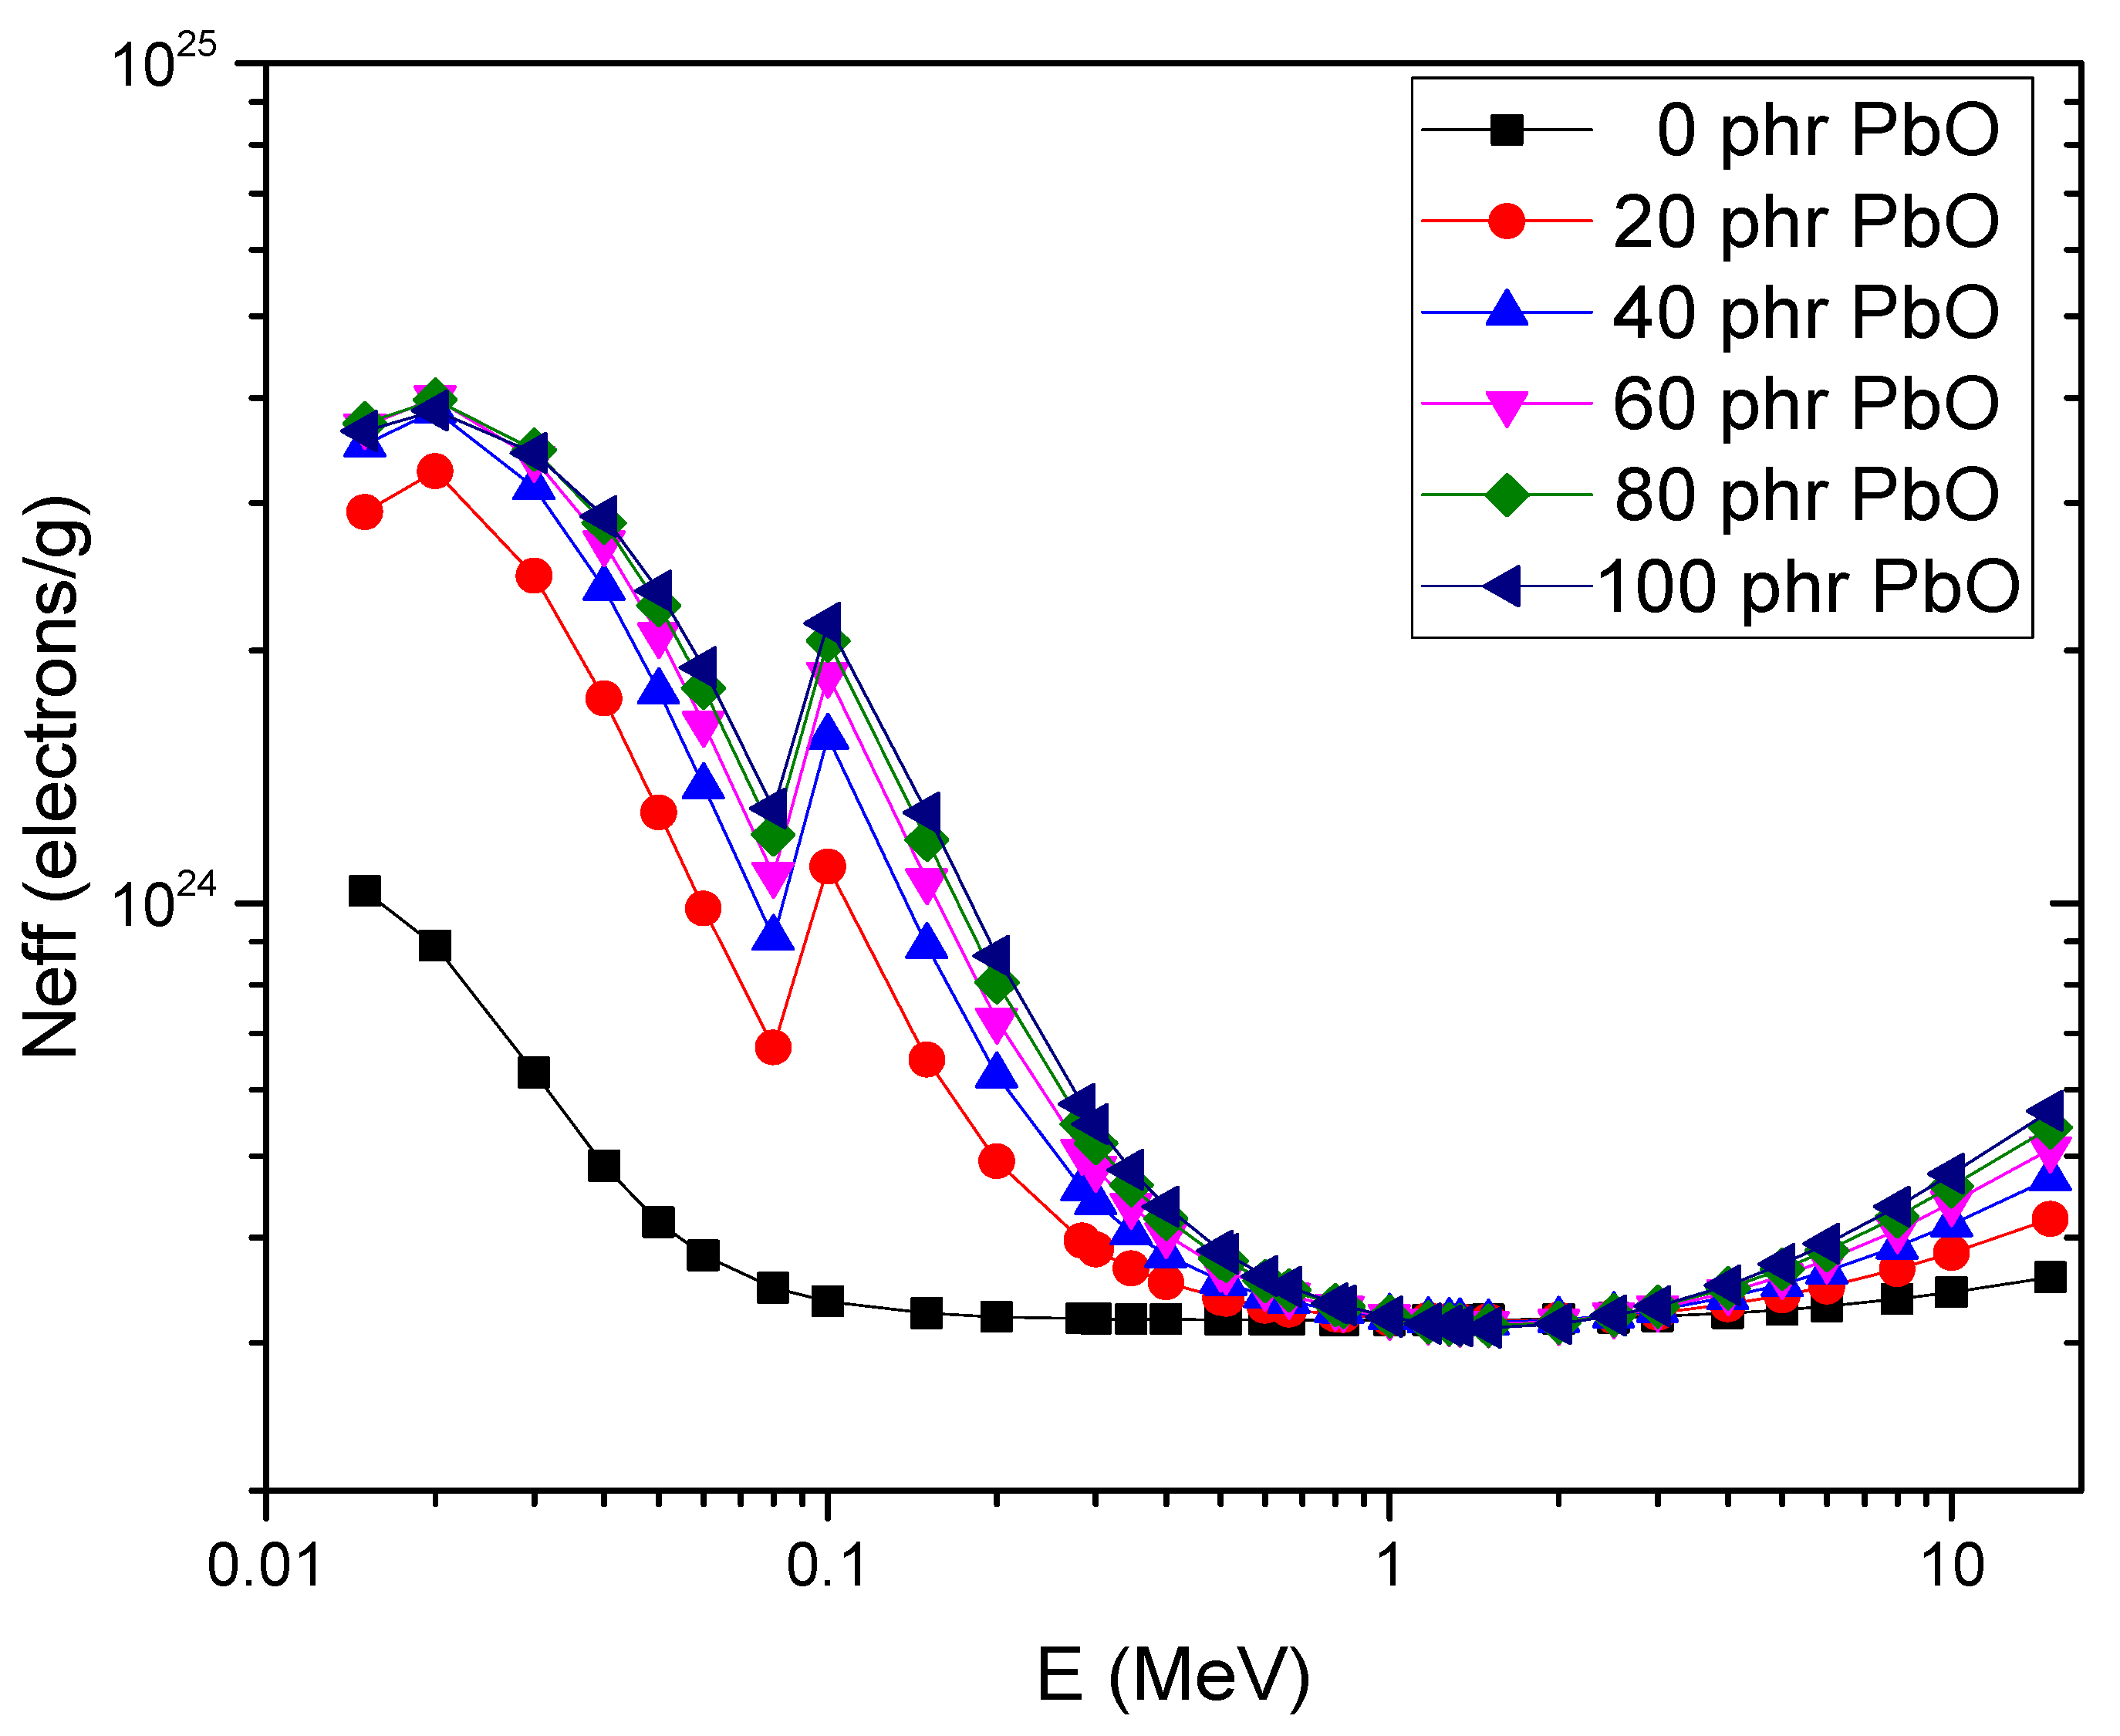
4.5. Gamma-Ray Shielding Properties

The measured and theoretically calculated total mass attenuation coefficients (μm), Zeff, and Neff at 0.239, 0.662, 1.173, 1.332, and 2.51 MeV of the prepared PbO-filled SBR/NBR blends at different concentrations of PbO are shown in Table 3. Due to the very heavy atomic weight of Pb (207.2), as the concentration of PbO increases, higher values of the mass attenuation coefficient are obtained. The obtained experimental values for all of the measured parameters varied within 5% of the theoretical values.
For the purpose of comparison with other shielding materials, the values of the mass attenuation coefficient for all of the prepared samples and those for Portland concrete for a wide range of energies 0.015–15 MeV were determined. Figure 8, Figure 9 and Figure 10 illustrate the calculated mass attenuation coefficients, effective atomic numbers, and effective electron densities, respectively. Figure 8 depicts the variation in total mass attenuation coefficients with incident photon energy with the chemical content of the prepared material, both of which may be explained by determining the dominating radiation interaction. The absorption K-edge for Pb is attributable to the observed peak of µm for all PbO-filled NBR/SBR blends at 0.088 MeV.
The observed variation in µm for all of the prepared samples can be explained by the energy and effective atomic number dependence and interaction with the photon radiation. At low (E < 0.6 MeV), photoelectric absorption is the most predominant process. The rapid decrease in µm with increases in the incident photon energy for all of the prepared composites in this region is due to the fact that the probability of photoelectric absorption is inversely proportional to the incident photon energy, as E3.5 [34,35]. The significant difference in the µm values in the low-energy region can be attributed to the direct dependence of the photoelectric cross-section on the atomic numbers of the constituent elements. The values of Zeff for all of the prepared rubber blends in the energy range from 0.015 to 15 MeV are shown in Figure 4. All of the prepared rubber blends containing PbO exhibited similar behavior. The attenuation cross-section is proportional to Z4−5 for photoelectric attenuation, proportional to Z for a Compton interaction, and proportional to Z2 for pair production. Therefore, the Zeff values increased as the percentage of PbO increased [34,35]. The difference in the atomic number in the low-energy region, which converted into the Zeff in the case of the material composite, can be observed in Figure 9.
At intermediate incident photon energies (0.6 MeV < E < 5 MeV), the µm decreases slowly with increasing photon energy and becomes nearly constant when the incident photon energy reaches 3 MeV. (Figure 8). Furthermore, when compared to the low-energy area, differences in total attenuation coefficient values are essentially nonexistent; almost equal values have been found for various composites. This means that in the intermediate energy zone, the chemical composition of the chosen rubber blends is less relevant. Figure 8 indicates that Compton scattering (especially incoherent scattering) becomes the dominating kind of photon interaction as the incident photon energy increases; the partial µm drops steadily. Because the cross-section of the Compton scattering process is inversely proportional to the incident photon energy, this coefficient changes (E−1) [34,35]. As a result, the slow decrease in the values of the total attenuation coefficient at intermediate energy is primarily due to the contribution of the Compton scattering process’s partial mass attenuation coefficient, which explains why lower values of all the samples’ mass attenuation coefficients were obtained in this energy region (the minimum values of µm for all investigated samples were observed at 5 MeV). The minor difference in µm values seen between the six samples in this energy band, on the other hand, is attributable to the linear Z-dependence of the Compton scattering cross-section [34,35].
When the input photon energy approaches 15 MeV, the µm values become almost constant (Figure 8) in the high-energy region (5 MeV < E). Moreover, the change in m with chemical composition reappears, but it is less pronounced than the fluctuation seen in the low-incident photon energy zone. The pair-production process may have gained dominance in the high-energy region, causing these behaviors. On the other hand, the Z-dependence of the cross-section of pair creation, which is proportional to Z2, can explain the fluctuation of m with chemical composition. [34,35]. Figure 7 depicts a small variation in Zeff in this high-energy region, which reflects why the variation in µm is small in this region. All PbO-filled SBR/NBR blend samples have high attenuation coefficients compared to concrete, especially with low-energy photon emissions, which are necessarily important for shielding applications used during X-ray diagnoses.
The effective electron density of all of the prepared samples is shown in Figure 10. As the filler concentration increases, the electron density increases. This was predicted with a metallic filler such as lead where the high density of electrons will be obtained in the photoelectric effect region compared with both Compton and pair-production regions.

5. Conclusions

In this study, black nanocarbon-loaded 0–100 phr PbO-filled SBR/NBR blends were prepared. Both mechanical and gamma shielding properties were investigated. The obtained results indicated that the PbO filler acts as a good reinforcing material for NBR/SBR blends at 40 phr. The nature of the particle distribution in the prepared rubber matrix was investigated by using an SEM. The elemental concentrations of the NBR/SBR composites at different PbO concentrations were determined by using energy dispersive X-ray analysis (EDX). The EDX mapping of the elemental compositions of all the prepared composites showed that lead was uniformly distributed among the other elements in the prepared rubber composites at different phr concentrations. The uniformity recommends the use of these PbO-filled NBR/SBR blends as effective materials for radiation-shielding applications. The results obtained for the total gamma attenuation of all prepared PbO-filled SBR/NBR blend samples showed high gamma attenuation coefficients compared to those for concrete, especially at low-energy photon emissions. These results support the recommended use of the prepared PbO-filled NBR/SBR blends for the fabrication of personal protective equipment used in radiation-shielding applications.

Author Contributions

Methodology, R.G., E.S., H.E., D.E.E.-N. and M.E.; Formal analysis, E.S., D.E.E.-N. and M.E.; Writing—original draft, R.G., E.S. and M.E.; Supervision, E.S., D.E.E.-N. and A.B. All authors have read and agreed to the published version of the manuscript.

Funding

This research received no external funding.

Institutional Review Board Statement

Not applicable.

Informed Consent Statement

Not applicable.

Data Availability Statement

Not applicable.

Conflicts of Interest

The authors declare no conflict of interest.

References

  1. Nambiar, S.; Yeow, J.T.W. Polymer-composite materials for radiation protection. ACS Appl. Mater. Interfaces 2012, 4, 5717–5726. [Google Scholar] [CrossRef] [PubMed]
  2. Castañeda-Facio, A.; Benavides, R.; Martínez-Pardo, M. Thermal stability of PVC formulations gamma irradiated at different dose rates. Radiat. Phys. Chem. 2014, 97, 75–80. [Google Scholar] [CrossRef]
  3. Canel, A.; Korkut, H.; Korkut, T. Improving neutron and gamma flexible shielding by adding medium-heavy metal powder to epoxy based composite materials. Radiat. Phys. Chem. 2019, 158, 13–16. [Google Scholar] [CrossRef]
  4. Sayyed, M. Investigation of shielding parameters for smart polymers. Chin. J. Phys. 2016, 54, 408–415. [Google Scholar] [CrossRef]
  5. Mann, K.S.; Rani, A.; Heer, M.S. Shielding behaviors of some polymer and plastic materials for gamma-rays. Radiat. Phys. Chem. 2015, 106, 247–254. [Google Scholar] [CrossRef]
  6. Mirji, R.; Lobo, B. Computation of the mass attenuation coefficient of polymeric materials at specific gamma photon energies. Radiat. Phys. Chem. 2017, 135, 32–44. [Google Scholar] [CrossRef]
  7. Martin, J.E. Physics for Radiation Protection, 3rd ed.; Wiley-VCH: Hoboken, NJ, USA, 2013. [Google Scholar]
  8. Harish, V.; Nagaiah, N.; Prabhu, T.N.; Varughese, K.T. Preparation and characterization of lead monoxide filled unsaturated polyester based polymer composites for gamma radiation shielding applications. J. Appl. Polym. Sci. 2009, 112, 1503–1508. [Google Scholar] [CrossRef]
  9. Drobny, J.G. Ionizing Radiation and Polymers: Principles, Technology, and Applications; CRC Press: Boca Raton, FL, USA, 2012. [Google Scholar]
  10. Harish, V.; Nagaiah, N. Thermal degradation of lead monoxide filled polymer composite radiation shields. AIP Conf. Proc. 2011, 89–90. [Google Scholar] [CrossRef]
  11. Mandal, S.; Alam, S. Studies on gamma radiation resistance polyethersulphone films reinforced by lead oxide. Mater. Res. Innov. 2013, 17, 373–376. [Google Scholar] [CrossRef]
  12. Mheemeed, A.K.; Hasan, H.I.; Al-Jomaily, F.M. Gamma-ray absorption using rubber—Lead mixtures as radiation protection shields. J. Radioanal. Nucl. Chem. 2011, 291, 653–659. [Google Scholar] [CrossRef]
  13. Belgin, E.E.; Aycik, G.A. Preparation and radiation attenuation performances of metal oxide filled polyethylene based composites for ionizing electromagnetic radiation shielding applications. J. Radioanal. Nucl. Chem. 2015, 306, 107–117. [Google Scholar] [CrossRef]
  14. Mahmoud, M.E.; El-Khatib, A.M.; Badawi, M.S.; Rashad, A.R.; El-Sharkawy, R.M.; Thabet, A.A. Recycled high-density polyethylene plastics added with lead oxide nanoparticles as sustainable radiation shielding materials. J. Clean. Prod. 2018, 176, 276–287. [Google Scholar] [CrossRef]
  15. Mahmoud, M.E.; El-Khatib, A.M.; Badawi, M.S.; Rashad, A.R.; El-Sharkawy, R.M.; Thabet, A.A. Fabrication, characterization and gamma rays shielding properties of nano and micro lead oxide-dispersed-high density polyethylene composites. Radiat. Phys. Chem. 2018, 145, 160–173. [Google Scholar] [CrossRef]
  16. Özdemir, T.; Güngör, A.; Akbay, I.; Uzun, H.; Babucçuoglu, Y. Nano lead oxide and epdm composite for development of polymer based radiation shielding material: Gamma irradiation and attenuation tests. Radiat. Phys. Chem. 2018, 144, 248–255. [Google Scholar] [CrossRef]
  17. Majeed, A.H.; Hamza, M.S.; Kareem, H.R. Effect of Ading Nanocarbon Black on the Mechanical Properties of Epoxy. Diyala J. Eng. Sci. 2014, 7, 94–108. [Google Scholar] [CrossRef]
  18. Fu, J.-F.; Yu, W.-Q.; Dong, X.; Chen, L.-Y.; Jia, H.-S.; Shi, L.-Y.; Zhong, Q.-D.; Deng, W. Mechanical and tribological properties of natural rubber reinforced with carbon blacks and Al2O3 nanoparticles. Mater. Des. 2013, 49, 336–346. [Google Scholar] [CrossRef]
  19. Shahamatifard, F.; Rodrigue, D.; Park, K.W.; Frikha, S.; Mighri, F. Natural rubber nanocomposites: Effect of carbon black/multi-walled carbon nanotubes hybrid fillers on the mechanical properties and thermal conductivity. Polym. Technol. Mater. 2021, 60, 1686–1696. [Google Scholar] [CrossRef]
  20. Maiti, M.; Sadhu, S.; Bhowmick, A.K. Effect of carbon black on properties of rubber nanocomposites. J. Appl. Polym. Sci. 2005, 96, 443–451. [Google Scholar] [CrossRef]
  21. Abdelsalam, A.A.; Araby, S.; El-Sabbagh, S.H.; Abdelmoneim, A.; Hassan, A.M. Effect of carbon black loading on mechanical and rheological properties of natural rubber/styrene-butadiene rubber/nitrile butadiene rubber blends. J. Thermoplast. Compos. Mater. 2019, 34, 490–507. [Google Scholar] [CrossRef]
  22. Abdel-Baki, M.; Salem, A.; Abdel-Wahab, F.; El-Diasty, F. Bond character, optical properties and ionic conductivity of Li2O/B2O3/SiO2/Al2O3 glass: Effect of structural substitution of Li2O for LiCl. J. Non-Crystalline Solids 2008, 354, 4527–4533. [Google Scholar] [CrossRef]
  23. Singh, V.P.; Badiger, N.; Kaewkhao, J. Radiation shielding competence of silicate and borate heavy metal oxide glasses: Comparative study. J. Non-Crystalline Solids 2014, 404, 167–173. [Google Scholar] [CrossRef]
  24. Berger, M.J. Photon Cross Sections Database. NIST Standard Reference Database 8 (XGAM). 1998. Available online: http//physics.nist.gov/PhysRefData/Xcom/Text/XCOM.html (accessed on 10 October 2022).
  25. Tijani, S.; Kamal, S.M.; Al-Hadeethi, Y.; Arib, M.; Hussein, M.; Wageh, S.; Dim, L. Radiation shielding properties of transparent erbium zinc tellurite glass system determined at medical diagnostic energies. J. Alloy. Compd. 2018, 741, 293–299. [Google Scholar] [CrossRef]
  26. Taylor, M.L.; Smith, R.L.; Dossing, F.; Franich, R.D. Robust calculation of effective atomic numbers: The Auto-Zeffsoftware. Med. Phys. 2012, 39, 1769–1778. [Google Scholar] [CrossRef] [PubMed]
  27. Tonguc, B.T.; Arslan, H.; Al-Buriahi, M.S. Studies on mass attenuation coefficients, effective atomic numbers and electron densities for some biomolecules. Radiat. Phys. Chem. 2018, 153, 86–91. [Google Scholar] [CrossRef]
  28. Arulmozhi, K.T.; Mythili, N. Studies on the chemical synthesis and characterization of lead oxide nanoparticles with different organic capping agents. AIP Adv. 2013, 3, 122122. [Google Scholar] [CrossRef]
  29. Atef, S.; El-Nashar, D.E.; Ashour, A.H.; El-Fiki, S.; El-Kameesy, S.U.; Medhat, M. Effect of gamma irradiation and lead content on the physical and shielding properties of PVC/NBR polymer blends. Polym. Bull. 2019, 77, 5423–5438. [Google Scholar] [CrossRef]
  30. Intom, S.; Kalkornsurapranee, E.; Johns, J.; Kaewjaeng, S.; Kothan, S.; Hongtong, W.; Chaiphaksa, W.; Kaewkhao, J. Mechanical and radiation shielding properties of flexible material based on natural rubber/ Bi2O3 composites. Radiat. Phys. Chem. 2020, 172, 108772. [Google Scholar] [CrossRef]
  31. Bel, T.; Arslan, C.; Baydogan, N. Radiation shielding properties of poly (methyl methacrylate) / colemanite composite for the use in mixed irradiation fields of neutrons and gamma rays. Mater. Chem. Phys. 2019, 221, 58–67. [Google Scholar] [CrossRef]
  32. Aggarwal, S.L. Rubber Technology, 3rd ed.; Morton, M., Ed.; Van Nostrand Reinhold: New York, NY, USA, 1987; p. 638. [Google Scholar] [CrossRef]
  33. Huang, W.; Yang, W.; Ma, Q.; Wu, J.; Fan, J.; Zhang, K. Preparation and characterization of γ-ray radiation shielding PbWO4/EPDM composite. J. Radioanal. Nucl. Chem. 2016, 309, 1097–1103. [Google Scholar] [CrossRef]
  34. Hubbell, J.H. Review of photon interaction cross section data in the medical and biological context. Phys. Med. Biol. 1999, 44, R1–R22. [Google Scholar] [CrossRef]
  35. Hubbell, J. Photon mass attenuation and energy-absorption coefficients. Int. J. Appl. Radiat. Isot. 1982, 33, 1269–1290. [Google Scholar] [CrossRef]
Figure 1. FTIR spectra of 0–100 phr PbO-filled NBR/SBR.
Sustainability 15 02165 g001
Figure 2. Scanning Electron Microscope micrographs of SBR/NBR blends at (a) 0 phr PbO, (b) 20 phr PbO, (c) 40 phr PbO, (d) 60 phr PbO, (e) 80 phr PbO, and (f) 100 phr PbO.
Sustainability 15 02165 g002
Figure 3. (a) EDX chemical compositions and elemental mapping of 0 phr lead/NBR + SBR. (b) EDX chemical compositions and elemental mapping of 20 phr lead/NBR + SBR. (c) EDX chemical compositions and elemental mapping of 40 phr lead/NBR + SBR. (d) EDX chemical compositions and elemental mapping of 60 phr lead/NBR + SBR. (e) EDX chemical compositions and elemental mapping of 80 phr lead/NBR + SBR. (f) EDX chemical compositions and elemental mapping of 100 phr lead/NBR + SBR.
Sustainability 15 02165 g003aSustainability 15 02165 g003bSustainability 15 02165 g003c
Figure 4. XRD of NBR/SBR blends filled with different concentrations of lead oxide (0–100 phr).
Sustainability 15 02165 g004
Figure 5. The effect of lead concentration on the tensile strength of the NBR/SBR blend.
Sustainability 15 02165 g005
Figure 6. The effect of lead concentration on the elongation at break of the NBR/SBR blend.
Sustainability 15 02165 g006
Figure 7. The effect of lead concentration on the hardness of NBR/SBR blend.
Sustainability 15 02165 g007
Figure 8. Mass attenuation coefficients of 20–100 phr PbO-filled NBR/SBR and Portland concrete.
Sustainability 15 02165 g008
Figure 9. Effective Atomic Number (Zeff) of 0–100 phr PbO-filled NBR/SBR.
Sustainability 15 02165 g009
Figure 10. Effective electron density (Neff) of 0–100 phr PbO-filled SBR/NBR.
Sustainability 15 02165 g010
Table 1. The investigated NBR/SBR blend’s chemical components and concentrations.
IngredientsAmounts (phr) *
Acrylonitrile butadiene rubber (NBR)50
Styrene-butadiene rubber (SBR)50
Butadiene rubber (BR)20
Stearic acid2
ZnO5
Processing oil10
Dioctyl phthalate (DOP)10
N330 (nanocarbon black)40
Mercapto benzothiazole sulfenamide (MBTS) rubber accelerator2
Trimethyl-quinoline (TMQ)1
Sulfur (S)2
PbO20–100
* phr: parts-per-hundred NBR-SBR rubber.
Table 2. EDX detected elemental contents (wt%) of the lead/NBR/SBR composites.
ElementPbO Concentration (phr)
020406080100
C77.6072.9175.9874.9869.5766.56
N09.1011.926.658.177.954.17
O07.006.235.875.275.224.39
S04.412.622.792.724.164.21
Ca0.870.390.360.260.500.45
Zn1.020.450.50.480.590.58
Pb05.477.938.1011.7119.64
Table 3. Theoretical and experimental determination of radiation-shielding parameters of PbO-filled SBR/NBR blends at different photon energies.
Energy (MeV)PbO (phr)µm (cm2/g)HVL (cm)Zeff (Electrons/Atom)Neff (Electrons/g) × 1023
Theoretical ExperimentalTheoreticalExperimentalTheoreticalExperimentalTheoreticalExperimental
0.66200.0820.0822.4682.4543.7983.8003.1933.190
200.0840.0842.3382.3624.2784.2803.2853.280
400.0870.0862.2472.2544.7484.6953.3603.321
600.0880.0882.1882.1945.2125.2103.4143.410
800.2080.2080.9220.9225.6565.6603.4623.460
1000.0910.0912.0982.0976.1176.1203.4933.490
1.17300.0620.0623.2413.2413.7963.8003.1923.190
200.0620.0623.1663.1764.1544.1503.1903.190
400.0620.0623.1193.1254.5064.5103.1893.190
600.0620.0623.0993.0894.8534.8501.1791.180
800.0620.0623.0843.0885.1855.1903.1733.170
1000.0620.0623.0683.0625.5345.5303.1613.160
1.33200.0580.0583.4613.4623.7963.8003.1923.190
200.0580.0583.3893.3854.1454.1403.1823.180
400.0580.0573.3463.3934.4874.4133.1753.125
600.0580.0583.3313.3264.8244.8203.1603.160
800.0580.0573.3203.3115.1475.0613.1503.096
1000.0580.0603.3073.1645.4875.6793.1343.238
2.5100.0420.0424.8474.8533.8183.8203.2103.210
200.0420.0424.7124.7834.1964.2003.2233.220
400.0420.0424.6244.6144.5684.5703.2333.230
600.0420.0414.5804.5834.9354.8133.2323.153
800.0420.0424.5464.5625.2855.2903.2343.230
1000.0420.0424.5104.5005.6535.6503.2383.230
Disclaimer/Publisher’s Note: The statements, opinions and data contained in all publications are solely those of the individual author(s) and contributor(s) and not of MDPI and/or the editor(s). MDPI and/or the editor(s) disclaim responsibility for any injury to people or property resulting from any ideas, methods, instructions or products referred to in the content.

