Article

Sustainable Development Strategy of Low-Cost Airlines: Empirical Evidence for Indonesia Based on Analysis of Passenger Loyalty

by
Arief Kusuma Among Praja
1,
Rian Adi Septiawan
1,
Tantri Yanuar Rahmat Syah
1,
Endah Murtiana Sari
2,*,
Maya Puspita Dewi
1,
Purwanto Sarjana Katijan
1,
Tezara Cionita
3 and
Yin Ling Lai
3
1
Faculty of Economics and Business, Universitas Esa Unggul, Jakarta 11510, Indonesia
2
Faculty of Engineering, Universitas Esa Unggul, Jakarta 11510, Indonesia
3
Faculty of Engineering and Quantity Surveying, INTI International University, Nilai 71800, Malaysia
*
Author to whom correspondence should be addressed.
Sustainability 2023, 15(3), 2093; https://doi.org/10.3390/su15032093
Submission received: 21 December 2022 / Revised: 16 January 2023 / Accepted: 17 January 2023 / Published: 22 January 2023
(This article belongs to the Section Sustainable Transportation)

Abstract

:
The rapid progress in the competitive business environment has increased customer expectations and demands, thus leading to a situation where many companies are competing fiercely, especially low-cost airline companies or low-cost carriers (LCCs). The company carries out a strategy of providing satisfaction for its passengers to generate great loyalty. The purpose of this study is to find out what factors can affect passenger loyalty, such as service quality (SQ), price (P), customer satisfaction (S), and perceived value (PV) on LCC airlines in Indonesia. This study used quantitative methods through surveys which were conducted on 313 respondents in Indonesian, via online questionnaire data collection in July–August 2021. To test the relationship between variables, this study used statistical analysis with LISREL structural equation modelling (SEM). The present study was conducted concerning LCC companies in Indonesia and refers only to Indonesian consumers. There are 7 hypotheses in this study, of which 4 hypotheses are confirmed and 3 are invalidated. Some results obtained show that, in this case and with reference to Indonesian consumers only for the substitution service offered by LCCs, we have to discuss atypical manifestations of consumer behaviour (good SQ does not necessarily lead to increased S and lower price does not necessarily lead to increased S, etc.). At the same time, this study shows that consumer loyalty remains the essential factor for the survival of LCCs in the market.

1. Introduction

In this modern era, low-cost airline services have emerged, filled with various airline companies, thus triggering intense competition and forcing airline companies to set strategies by taking a market approach to dominate the existing market share [1]. Therefore, retaining customers is a way to make airlines survive in critical situations [2]. On the other hand, service quality (SQ) is a strength for airlines in business competition in order to maintain the company’s survival [3]. SQ is very important because it influences consumer behavioral intentions [4]. In a business, SQ can provide a strong instrument for companies to achieve their strategic goals [5,6]. Furthermore, Shen and Yahya [2], Hussain et al. [7], and Akamavi et al. [8] also stated that, when facing competition, companies must be able to improve the quality of their services. Thus, they can create satisfaction and retain these customers in order to maintain the company’s survival [2,6,9]. During the pandemic, the airline industry experienced a drastic decline, and in 2022, this situation did not recover to how it was in 2019.
The results of the study by Shen and Yahya [2], Akamavi et al. [8], Jiang and Zhang [10], and Hussain [11] proved that the quality of service provided by airlines could increase passenger satisfaction. This satisfaction leads to increased loyalty. A similar opinion also states that the increase in service quality will affect customer satisfaction (S). Liu and Lee [4] argue that SQ is a basic attribute influencing passenger behavior because high SQ can create satisfaction and loyalty. In essence, improving SQ to increase satisfaction and create loyalty is a must [12]. According to Itt and Sakun [13], not only SQ but also the price (P) has a positive influence on satisfaction. Affordable prices for a product can meet customer expectations so that they will recommend the product to others [2]. Meanwhile, Nishimura et al. [14] and Ladhari [15] stated that SQ has an influence on perceived value (PV) because, if the customer feels the service for the product and his purchases exceed his expectations, a PV will grow for the customer.
Research conducted by Shen and Yahya [2] only focuses on SQ, P, satisfaction, and loyalty. Then, other studies discuss the relationship between SQ and satisfaction [16,17], P and satisfaction [4,8,18,19], satisfaction and loyalty [10,20,21,22], and the effect of satisfaction mediates the relationship between SQ and customer loyalty (L) [6,9,11]. However, research in the aviation sector that examines PV is still rare, even though the PV itself has an influence on satisfaction and loyalty [23,24]. Therefore, we add the variable PV in this study and in accordance with those recommended by Shen and Yahya [2].
In addition, previous studies were carried out on airlines abroad by Shen and Yahya [2] and Erdogan and Hussain [16]. They explained that there might be differences in the nature and results of the research to be obtained because we performed it on airlines in Indonesia. Based on some of these explanations, the main purpose of this study is to adopt the SERVQUAL model. We examine the effect of SQ on S and PV, P on S, S with L, and PV on S and L, then determine the role of S in mediating the relationship of SQ and L on low-cost airlines or low-cost carriers (LCCs) (Lion Air, Air Asia, and Citilink) in Indonesia.
Trust is defined by Chaudhari and Holbrook [25] as “the willingness of the ordinary consumer to rely on the brand’s capacity to accomplish its stated role.” Customers view trusted brands as possessing unrivaled competence, efficacy, and effectiveness in delivering on their promises. It constantly produces and contributes value, even when it is not in the brand owners’ financial interests. Customers must perceive and believe they are identical to the brand and underlying company culture. The degree to which customers share values and beliefs linked with the brand’s values and conduct will determine the level of persistent trust customers will have in their minds and hearts.

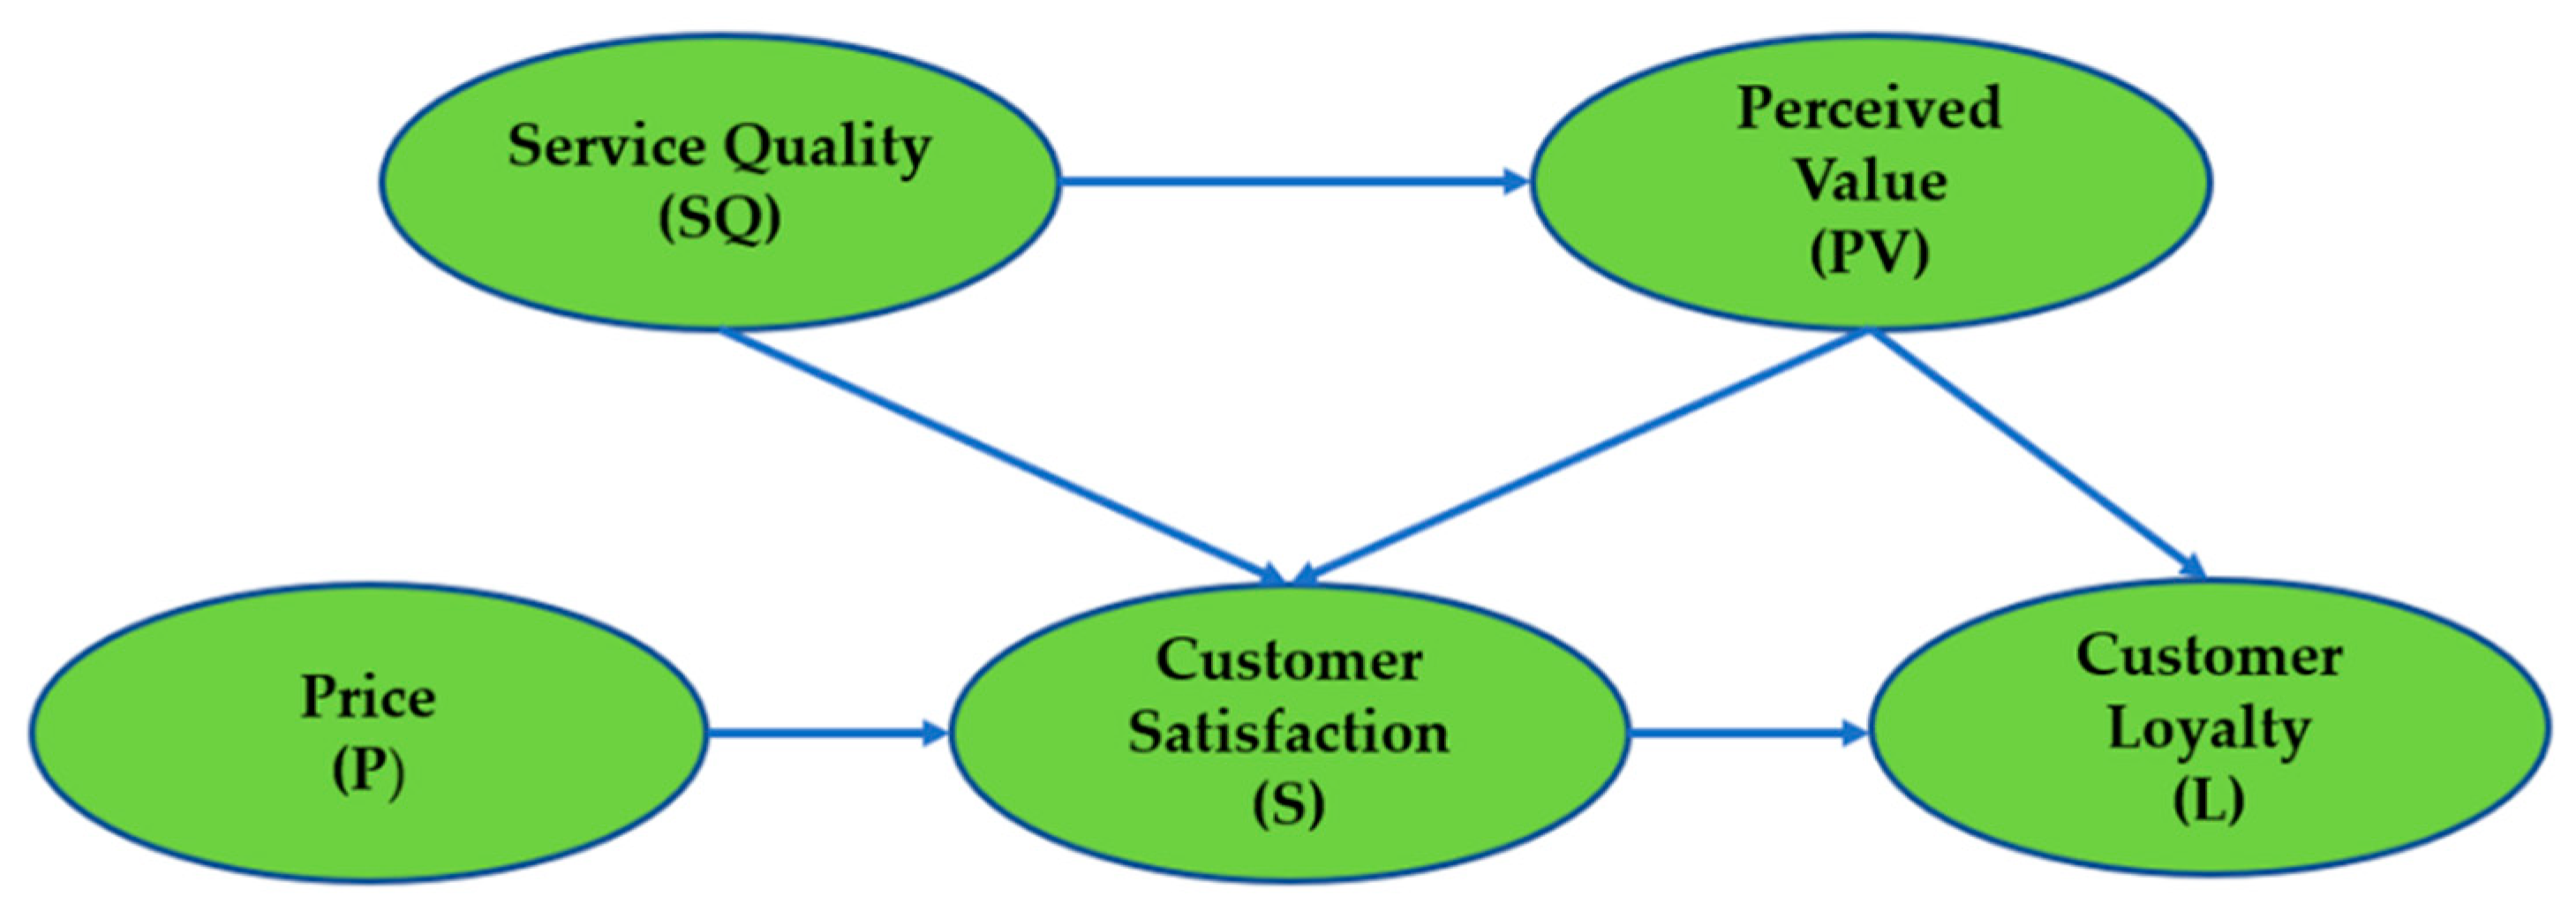
2. Relationship between Variables

2.1. Service Quality (SQ)

Fine [26] described SQ as the result of a comparison between customer expectations and the services provided. SQ is not just a product service but also includes worker, process, and environmental services [27]. A business requires an improving SQ, including airlines; good or bad SQ will depend on consumers’ perceptions of the services they receive [28]. Measuring SQ itself is controversial in a marketing service, and this is because certain industries must use a slightly different measurement model to find out the key factors. This has led to many studies discussing the theory of SQ to fully measure SQ [27]. Fine [26] stated that SQ has three dimensions, namely, SQ, physical quality, and interactive quality, where the company focuses on corporate image. While Zeithaml [29], Hansemark, and Albinsson [30] explained that the SERVQUAL model is a guideline for measuring SQ, this model consists of 10 dimensions converted into five dimensions, namely, tangibility, reliability, responsiveness, assurance, and empathy.
According to Hussain et al. [7] and Yang et al. [31], the SQ of an airline is an important factor triggering high passenger satisfaction rates. Furthermore, Hussain [11] concluded that, in order to achieve the maximum level of satisfaction, the level of SQ provided must also be maximized. Calisir et al. [17] also stated that SQ has a positive influence on satisfaction levels. Similarly, Shen and Yahya [2] stated that SQ is assessed based on service performance and everything related to the service itself. At the same time, S can be known after passengers experience the services provided. Therefore, several researchers, such as Shen and Yahya [2], Hussain et al. [7], and Calisir et al. [17], proved that SQ has an influence on S.

2.2. Price (P)

P is a value that is a benchmark for the value of an item [32]. In the aviation industry, LCCs usually have a lot of enthusiasts compared to full-service airlines due to cheaper airfare [2]. Airline ticket prices are one of the main considerations for passengers when choosing an airline [33]. Petrick [32] argues that perceptions of P trigger consumers to seek products or services, convenience, and value changes. Previous research stated that, if customers feel satisfied with something they bought, they will voluntarily recommend it to others to do the same thing as they do. It can also be stated that P is one of the important factors that must be considered by producers [2].
P plays an important role in influencing passengers to determine which airline to use, especially for low-cost airline customers or commonly known LCCs [4]. From an LCC point of view, passengers tend to engage in relatively high P differentials in order to gain more profit [19]. According to Mikulić and Prebežac [18], low prices are a distinct satisfaction factor for airline passengers, especially low-cost airlines. The research that has been conducted previously shows that the P level of an airline is the main consideration for prospective passengers in choosing the airline to be used [33]. The P is a determinant of passenger satisfaction [8,17]. It can be concluded that ticket prices have a significant influence on overall passenger satisfaction because the more affordable the ticket prices, the higher the passenger satisfaction [10]. A previous study by Shen and Yahya [2] showed that P affects the level of S.

2.3. Customer Satisfaction (S)

Satisfaction is described as happiness with the performance of something that meets expectations [34]. The concept of S is based on a business that wants to continue and be profitable, so what must be undertaken is to provide satisfaction to customers [35]. Oliver [20] argues that satisfaction will be achieved if customer expectations can be met. S will provide many benefits for a business, including that customers will show their loyalty and not want to switch to products or services provided by competitors [30]. This statement is reinforced by Abdullah et al. [36], who stated that high S would create a loyalty effect on them. The level of S is also the basis for determining the level of success of a company in carrying out its business strategy [37].

2.4. Customer Loyalty (L)

Loyalty is defined as a form of commitment and trust to return to use the same preferred product or service consistently and continuously [20]. In the aviation industry, loyalty is a key factor that determines the survival of airlines, profits, and also customer reach [17]. Shen and Yahya [2] divide loyalty into various forms, namely, behavioral loyalty, attitudinal loyalty, and loyalty (a combination of the two). Behavioral loyalty focuses on repeated purchases of goods or services from one brand, while attitudinal loyalty is an illustration of the psychological aspect [33]. Furthermore, Oliver [20] states that consumer loyalty consists of two types, namely, affective loyalty and cognitive loyalty, where affective loyalty refers to a customer’s feelings and emotions. In contrast, cognitive loyalty describes customer behavior in repurchasing a particular product.
Chanpariyavatevong [38] argues that, among the several factors that affect loyalty, satisfaction is the aspect that most influences L. If a customer does not feel satisfied with the services of an airline, then the customer will use another airline [21]. On the other hand, if the consumer is satisfied with a product, it is highly likely that the consumer will be loyal [8]. This shows that S has a positive impact on the level of passenger loyalty [8,17,39,40]. A similar opinion also states that S will make them return to using the LCC airline [22]. In predicting the level of loyalty, S has a more significant effect than SQ because satisfaction is directly proportional to loyalty [10]. The previous study conducted by Leong et al. [1] and Song et al. [41] also proves that S increases L.
Measuring S in the aviation sector is very important because it is a benchmark for airline survival in facing competition between airlines [7]. For airlines, devising the right strategy to maintain their competitive position is very important because passengers are looking for SQ and S, which will lead to their loyalty [2]. Mediation of S greatly influences SQ and L [9]. If the customer is satisfied with the quality of the service provided, it will affect his loyalty through this mediation [23]. Hussain [7] argues that SQ and loyalty are indicators of S. The study conducted by Kasiri et al. [9] revealed that the mediating role of satisfaction between the dimensions of SQ and L is significant.

2.5. Perceived Value (PV)

Fine [26] considers PV as the value felt by customers, where the size of the value depends on the amount of costs incurred. Another opinion states that PV is obtained from customer perceptions of SQ determined by several factors, such as financial factors and other factors [32]. Meanwhile, Diaz [42] explained that PV is directly proportional to the value of money. This statement is in accordance with the studies of Heung and Ngai [43], Sadeh [44], Song et al. [45], and Day and Cai [46] which concluded that there is a positive relationship regarding PV between customer perceptions and loyalty. When customers feel a high PV, they will tend to visit again and invite others to do the same [24]. In addition, PV can affect behavioral intentions and S with the quality of service they receive from a product or service [47].
SQ is an object that is highly taken into account in many studies because it is considered to have a positive impact on creating a competitive advantage for a company [15]. Apart from that, SQ has a large influence on the PV felt by customers [14]. The correlation between SQ and PV and brand image and S has been extensively tested and researched [37,38]. In fact, a study recommends that SQ be improved with the aim of encouraging PV for customers. If the quality of service received by customers exceeds their expectations, then PV will be felt by them and also be an advantage for the company [48]. The previous study by Shen and Yahya [2] also shows that SQ has a direct and positive influence on PV.
PV is considered a comparison between the costs incurred and the benefits obtained by customers [6]. Tam [48] also stated that, if you want to make customers feel high satisfaction and become loyal, companies must be able to make customers feel that the value of the quality of service they receive exceeds the costs incurred by these customers. This is in accordance with what was stated by Leong et al. [1]; the higher the customer expectations about PV, the higher their level of satisfaction. Raditha [23] also stated the same thing: S is influenced by the customer expectations of the PV it receives. Previous studies have shown that PV has a positive relationship with S [13].
According to Yang et al. [31] PV drives loyalty in the trading business. Likewise, Wu and Cheng [5] stated that PV has the greatest effect that can affect loyalty. This is supported by Kuo [28], who stated that PV is a strong trigger for L. Therefore, according to Leong et al. [1] and Akamavi et al. [8], it is necessary to pay full attention to customers in the form of the amount of PV received in order to increase S and loyalty. This is because PV is a strong factor of L [49]. Previous studies have shown that a high PV will create L, as per Raditha et al. [23] and Fine [26].

3. Materials and Methods

This study uses a survey method by distributing questionnaires online to collect data. Furthermore, the data that were successfully collected will be measured using the Likert scale method, which has five answer choices: a score of five means strongly agree, a score of four means agree, a score of three means neutral, a score of two means disagree, and a score of one means strongly disagree. The measurement of the SQ variables adopted from Zu et al. [27] consists of 5 dimensions: tangibility (5 questions), reliability (5 questions), responsiveness (4 questions), assurance (2 questions), and empathy (5 questions). For the P variable, it was adopted from Jiang and Zhang [10], Mikulić and Prebežac [18], and Munoz et al. [50], which consists of 10 questions. The satisfaction variable was adopted from Akamavi et al. [8] and Raditha et al. [23], which consists of 10 questions. The loyalty variable was adopted from Akamavi et al. [8] and Curry and Gao [12], which consists of 9 questions. Then, the variable PV was adopted from Raditha et al. [23] and Mai et al. [24], which consists of 8 questions. The total measurement is 58 questions which are analyzed by quantitative method. Based on the hypothesis framework, the research model can be illustrated in Figure 1 below.
Figure 1 illustrates the relationship variables that build various hypotheses, including SQ with PV and S; PV with SQ, S, and L; and S with P, L, PV, and SQ.
The population in this study are users who prefer low-cost airlines over full-service airlines in Indonesia. The research sample is low-cost airline users on Lion Air, Air Asia, and Citilink airlines in Indonesia. The population to be studied in this study is the adult population who have used low-cost airlines in Indonesia, which means that everyone can take part in this study. Still, because the concentration lies on low-cost airlines, participants who prefer full-service airlines will be excluded from this study [2]. Data collection was carried out from July–August 2021. In accordance with the provisions of LISREL structural equation modelling (SEM) analysis, the number of samples is obtained from the number of questionnaires multiplied by 5 [51] so that the number of respondents needed in this study is at least 290 people.
This study uses the dimension reduction factor in SPSS to determine the reliability of each question used in the questionnaire. Furthermore, to determine the level of significance and the interrelationship between each variable, we use the LISREL SEM analysis method. The validity test in this study was carried out by looking at the values of Kaiser–Meyer–Olkin (KMO) and measure of sampling adequacy (MSA), where the minimum value limit of KMO and MSA is 0.5. According to Hair [51], the reliability test was carried out by taking into account the value of Cronbach’s Alpha, where if the value is close to 1, it will be better.
Based on the results of the pre-test that was carried out on 30 respondents, factor analysis was then carried out to test the validity and reliability tests using SPSS software so that the results were found for the SQ variable and satisfaction variable, all of which were declared valid. Meanwhile, for the P variable, from 10 questions, only 8 were declared valid, and for the loyalty variable, from 9 questions, only 8 had valid questions. In comparison, the PV variable, from 8 questions, only had 7 valid questions. Thus, the results of the pre-test obtained 54 valid questions from the previous 58 questions. Therefore, this study requires a minimum sample of 270 respondents according to the Rules of Thumb by Hair [51]. However, we distributed a total of 469 respondents to the questionnaire, and 313 respondents declared it valid.

4. Results

Based on distributing questionnaires from 313 respondents, the data we managed to obtain based on demographic aspects includes the frequency of using LCC airlines. A total of 142 respondents (45%) used them 2 times, while 171 respondents (55%) used them more than 3 times. For gender, 117 respondents (37%) were male, and 196 respondents (63%) were female. Additionally, for age ranges, there were 116 respondents (37%) aged less than 21 years, 180 respondents (58%) aged 21 to 40 years, and 17 respondents (5%) over 40 years of age. Then, based on education level, there were 109 respondents (35%) of high school level, 179 respondents (57%) of bachelor level, 12 respondents (4%) of Masters level, 1 respondent (0.003%) of Doctoral level, and another 12 respondents (4%) of other. Then, based on total expenses in a month other than credit or vehicle and house installments, 163 or 52% had expenses of 100–200 USD, as many as 82 or 26% had expenses of 200–400 USD, as many as 52 or 17% had spending of 400–500 USD, as many as 9 or 3% had spending of 500–1000 USD, and as many as 7 or 2% had spending of >1000 USD. Based on the airline that is used more often, 192 respondents (61%) used Lion Air airlines, 42 respondents (13%) used Air Asia airlines, and 79 respondents (25%) used Citilink airlines.
Based on the validity and reliability tests carried out, it shows that all variables have a loading factor value above 0.5, so all variables are declared valid. Furthermore, the results on the reliability test with a minimum limit value of construct reliability are 0.6, and the variance extracted value is 0.5 [51]. The construct reliability values of the variables were: SQ 0.95, P 0.91, satisfaction 0.97, loyalty 0.94, PV 0.94. The variance extracted values of the variables were: SQ 0.79, P 0.56, satisfaction 0.73, loyalty 0.62, PV 0.70.
Furthermore, by looking at the determinant coefficient (R squared) value in each equation, the following results are obtained: first, the satisfaction variable is influenced by the PV, SQ, and P variables with the determinant coefficient (R squared) value of 0.86. This shows that 86% of the satisfaction variable is influenced by the PV, SQ, and P variables. The remaining 14% can be explained by other variables outside this study. Second, the loyalty variable is influenced by the satisfaction and PV variables with the determinant coefficient (R squared) value of 0.92. This case shows that 92% of the loyalty variable is influenced by the satisfaction and PV variables. Meanwhile, the remaining 8% can be explained by other variables outside of this study. Third, the PV variable is influenced by the SQ variable, with an R2 value of 0.86. This case shows that 86% of the PV variable is influenced by the SQ variable, while the remaining 14% can be explained by other variables outside this study.
In the model suitability test, the results of the analysis show that there are still a number of items with good fitness levels on Chi-Square, ECVI, AIC, CAIC, and RMSEA; for Fit Index, GFI, and Critical N, the results are a marginal fit. The following research results are described in the t-value diagram (Figure 2).
The results of this study prove that satisfaction cannot fully mediate the relationship between SQ and loyalty because SQ does not increase S with a t-value of 0.81. This is because the SQ variable has no direct relationship to loyalty.
Based on the t-value path diagram, as shown in Figure 2 above, the research model hypothesis test can be presented as follows (Table 1).
Referring to the hypothesis test table above, all variables that have a t-value above 1.96 in this study support the research hypothesis that was created. Of the 7 hypotheses above, 3 are not supported, while the remaining 4 hypotheses are supported. Hypotheses that are not supported include H1, high service quality increases customer satisfaction, H2, low prices increase customer satisfaction, and H4, customer satisfaction mediates the relationship between service quality and customer loyalty.

5. Discussion

This study aims to determine the effect of SQ on S and PV, P on S, then S on L, and the effect of PV on S and loyalty in low-cost airlines or LCCs in Indonesia. First, the results of this study do not prove that high SQ will increase S with reference to Indonesian consumers and LCC service. This can happen because several dimensional factors of SQ are not considered by airline users. Of course, this affects the level of the SQ value itself. These results are supported by previous research, which states that the dimensions of tangibility and empathy dimensions in the SQ variable do not significantly influence S [52]. This result is also again supported by research conducted by Masudin et al. [53], which states that SQ does not significantly affect S. These results are also reinforced by Jari et al. [54], who explained that the direct relationship between SQ and S is very weak or insignificant.
In the case of LCCs from Indonesia, there is a higher rate of air accidents than the rate recorded at a global level because legislation is more flexible on the management of these companies. Therefore, in the view of the sample respondents, the level/type of SQ offered by the LCC no longer seems to be a sufficiently important factor to be taken into account when making the decision to purchase the service.
As stated by Srivastava and Kaul [55], the key to S comes from past experience using a service product. Therefore, aspects of SQ from low-cost airlines are not able to increase S. In addition, the quality of service in the service aspect of the airline staff does not have a positive impact on satisfaction.
The following results also do not prove that lower prices will increase S. This finding is in line with previous research conducted by Adeleke and Aminu [56] and Jere and Mukupa [57], which states that P is not a determinant of satisfaction and loyalty and is not significant. In this case, it shows that, even though the perceived value of LCC airline flights is low and affordable, it does not make customers satisfied and is also unable to make customers show their loyalty. Setting a low P certainly has operational and strategic objectives because pricing still requires consideration of other factors as a possible driver of satisfaction in the low-cost airline sector or LCCs. In addition, the causes of low prices are not able to increase S because, in this case, respondents consider the P. The cost they pay is not proportional to the quality of SQ they receive. This is in line with what was conveyed by [58] that S, with the results of fulfillment, will have an effect on S and loyalty. Companies need to focus on their S through the provision of good and correct quality of service to increase their profitability. Plus, privacy concerns have a significant effect on customer trust. Switching costs are customers’ perception of time, money, and effort related to changes in service providers or direct expenses that customers may spend to transit from one supplier to another [24].
In addition, it is very likely that respondents choose to use low-cost airlines. It is not because of the factor of wanting to obtain satisfaction. The respondents who are only able to use low-cost airlines as a substitute for full-service airlines usually neglect or do not consider the aspect of satisfaction. With an affordable P level, of course, the effect of satisfaction is not so strong. Unlike the case with full-service airline flights, which are much more expensive from the aspect of P, satisfaction is the hope for the users. Another cause of low prices does not increase S because most airlines implement a paid policy for baggage that exceeds the limit. In general, the baggage limit for each passenger is 15 kilograms (kg). This, of course, requires passengers to incur additional costs beyond the cost of airplane tickets in order to pay for the excess baggage. It is this factor that makes the cost of passengers using low-cost aircraft greater and unprofitable from the respondent’s point of view, so they are not able to increase satisfaction.
Furthermore, this study proves that high S will increase L. This finding is in line with previous research [22], which stated that consumers who are satisfied with the service of a product would be loyal to the product. Satisfaction is an important aspect because it is an indicator to determine whether consumers will reuse the product continuously in the future or not. Furthermore, satisfaction triggers customers to return to using LCC airlines on other occasions [22]. In addition, the satisfaction felt by low-cost airline passengers or LCCs will have a hugely positive effect on the company. This is because this form of L will be implemented in the form of massive activity from the customer himself. The customer will recommend the product or service they use to other people and their closest circle, such as friends, family, or even people he just met. In other words, customers indirectly participate in marketing service products from low-cost airlines.
This study also has implications for management to determine the role of satisfaction in mediating the relationship between SQ and airline loyalty. Loyalty, as a positive effect of satisfaction, provides benefits from the customer side and also the service provider. This is because loyalty is the end of the totality both from the aspect of the customer who will continue to use the same product continuously and the end of the totality of the company in providing its best service optimally and consistently [59]. Intense competition in the aviation industry forces business actors in this sector to maintain their market share by creating a sense of satisfaction for their customers so that they do not switch to other airline service providers. In other words, the main focus for airline companies is to create loyalty by increasing S.
In this study, it is not proven that S mediates the relationship between SQ and L. This finding is in line with Dhasan and Aryupong [60]. They state that the mediating effect of satisfaction between SQ and loyalty only occurs partially. This partial mediation effect occurs because maybe passengers only see tangible and intangible aspects of SQ in the SQ dimension, where the dimension of SQ itself is the basis that determines the loyalty aspect. As a result, this may trigger customers to not really consider aspects of SQ.
The results further prove that high SQ will increase PV. This finding is in line with previous research conducted by Nishimura et al. [14] and Raditha et al. [23], who stated that SQ has a strong or positive effect on PV. When low-cost airline passengers experience high SQ, of course, they will feel the benefits that spur self-perception that the services provided by low-cost airlines increase the PV they obtain. PV increases because the quality of airline service they receive meets their expectations or even exceeds their previous expectations about the quality of service provided by low-cost airlines or LCCs. The higher the level of SQ provided by airlines to customers, the higher the customer’s PV will be.
Next, the results of this study indicate that a high PV will increase S. This finding is supported by previous research, which says that PV has a positive effect on the level of S [13]. When an airline company wants to know the level of S, one of the indicators is by looking at the PV. Furthermore, this indicates that airline passengers who feel their expectations are well fulfilled also feel the PV they obtain is high, giving a high satisfaction effect. In the world of low-cost airline flights, PV is a measure of passenger satisfaction. This is because the LCC aviation sector prioritizes low prices for greater profits for its customers. In the marketing aspect itself, PV for customers is the company’s main focus. This is because the company wants to make its customers feel satisfied with the product services it provides. For companies, making customers feel satisfied by providing a high PV provides more benefits for the company’s survival to continue to maintain its existence in the business world.
Other results in this study also show that a high PV will increase L, in line with Wu and Cheng [5], that the greatest effect given by PV is loyalty. The PV felt by low-cost airline passengers spurs them to be loyal to the airline. This is because the majority of LCC passengers always see the PV they obtain according to their expectations or not. Therefore, if their expectations are met, and the PV they obtain is high, they will become loyal and continue to be loyal. On this basis, there is a need for focused attention for airlines to evaluate the PV received by their passengers. This is crucial in order to be able to create and increase loyalty to products or services provided by airlines because a high PV will strengthen L [61]. Implementation to provide PV can be performed in various ways. For example, it can be performed through promotions to attract customer interest, then renewable innovations. It also can include service elements that are more profitable for users of low-cost airlines; in this case, free baggage up to a maximum of 20–25 kg/person, where the previous limit was 15 kg/person. The addition of baggage capacity triggers customers to feel a high PV and keeps customers from switching to other airlines.

6. Conclusions

Based on the results obtained in this study, it can be concluded that SQ and P are not necessarily the main factors that drive S for this type of substitution service offered by LCCs and for the specific culture of Indonesian consumers. This shows that good SQ and affordable prices do not affect passenger satisfaction and also do not make passengers loyal. However, there are different results illustrating the effect of satisfaction on loyalty. In Ref. [52], it is proven that SQ increases PV for low-cost airline passengers, which can then increase S and loyalty for low-cost airlines or LCCs in Indonesia. This can happen because of several factors that influence and trigger airline users to consider aspects of PV more than SQ and P factors.
Future research is expected to be able to overcome this limitation by conducting cross-country or even cross-regional research. Second, the data collection in the study was carried out online using a questionnaire. The incoming data had several deficiencies, and the respondents did not wholeheartedly fill out the questionnaire. Therefore, it is hoped that further research will use a different method so that respondents fill out the questionnaire wholeheartedly and also the data obtained are in accordance with their needs and expectations. Third, this study only adopted two independent variables: in the form of SQ and P, as well as PV variables as intervening variables and satisfaction as mediating variables. Thus, it is hoped that future research will be able to add other variables, such as security, technology acceptance, cultural factors, and repurchase intention.
Furthermore, there are several managerial implications in this study that are important to note; namely, airlines should give greater focus and attention to aspects of PV. This research shows that PV has a positive effect on S and loyalty. Therefore, if the PV provided by LCC airlines to passengers is high, it will make passengers feel satisfied and increase their loyalty to the airline.
This study has several limitations that can be improved in further research. First, this research was conducted in Indonesia or is included in the Southeast Asia region. The results would be different if the research were to be carried out in other countries in different regions so that this research could only be disseminated in a limited manner to a certain region. It is hoped that future research can be more specific to reveal airline routes and to benchmark outside Indonesia so that it can become an international-level recommendation. Low prices are not an attraction and it can be seen that culture in Indonesia is dominated by indulgence values of 38% [62]. This shows that traveling is not a priority for Indonesians. The low score of 38 in this dimension shows that Indonesia has a culture of restraint. Societies with low scores in this dimension tend to have cynicism and pessimism. Additionally, in contrast to indulgent societies, restrained societies do not put much emphasis on leisure time and control the gratification of their desires. People with this orientation have the perception that their actions are restrained by social norms and feel that indulging themselves is somewhat wrong.

Author Contributions

Conceptualization, A.K.A.P.; methodology, R.A.S., T.Y.R.S., and P.S.K.; validation, E.M.S. and Y.L.L.; formal analysis, E.M.S. and M.P.D.; investigation, A.K.A.P.; data curation, T.C. and P.S.K.; writing—original draft preparation, A.K.A.P. and R.A.S.; writing—review and editing, E.M.S. and Y.L.L.; visualization, M.P.D. and T.C.; supervision, T.Y.R.S.; project administration, T.Y.R.S. All authors have read and agreed to the published version of the manuscript.

Funding

This research received no external funding.

Institutional Review Board Statement

I hereby recognize that the title and names mentioned below have conducted the research by following the ethical terms and conditions of conducting research. All information collected during the study has been kept strictly confidential and only used for academic purposes.

Informed Consent Statement

Not applicable.

Data Availability Statement

Data are contained within the article.

Acknowledgments

The authors would like to thank the Faculty of Economics and Business, Esa Unggul University, for the support.

Conflicts of Interest

The authors declare no conflict of interest.

References

  1. Leong, L.-Y.; Hew, T.-S.; Lee, V.-H.; Ooi, K.-B. An SEM–artificial-neural-network analysis of the relationships between SERVPERF, customer satisfaction and loyalty among low-cost and full-service airline. Expert Syst. Appl. 2015, 42, 6620–6634. [Google Scholar] [CrossRef]
  2. Shen, C.; Yahya, Y. The impact of service quality and price on passengers’ loyalty towards low-cost airlines: The Southeast Asia perspective. J. Air Transp. Manag. 2021, 91, 101966. [Google Scholar] [CrossRef]
  3. Tsafarakis, S.; Kokotas, T.; Pantouvakis, A. A multiple criteria approach for airline passenger satisfaction measurement and service quality improvement. J. Air Transp. Manag. 2018, 68, 61–75. [Google Scholar] [CrossRef]
  4. Liu, C.-H.S.; Lee, T. Service quality and price perception of service: Influence on word-of-mouth and revisit intention. J. Air Transp. Manag. 2016, 52, 42–54. [Google Scholar] [CrossRef]
  5. Wu, H.-C.; Cheng, C.-C. A hierarchical model of service quality in the airline industry. J. Hosp. Tour. Manag. 2013, 20, 13–22. [Google Scholar] [CrossRef]
  6. Shah, F.T.; Syed, Z.; Imam, A.; Raza, A. The impact of airline service quality on passengers’ behavioral intentions using passenger satisfaction as a mediator. J. Air Transp. Manag. 2020, 85, 101815. [Google Scholar] [CrossRef]
  7. Hussain, R.; Al Nasser, A.; Hussain, Y.K. Service quality and customer satisfaction of a UAE-based airline: An empirical investigation. J. Air Transp. Manag. 2015, 42, 167–175. [Google Scholar] [CrossRef]
  8. Akamavi, R.K.; Mohamed, E.; Pellmann, K.; Xu, Y. Key determinants of passenger loyalty in the low-cost airline business. Tour. Manag. 2015, 46, 528–545. [Google Scholar] [CrossRef]
  9. Kasiri, L.A.; Cheng, K.T.G.; Sambasivan, M.; Sidin, S.M. Integration of standardization and customization: Impact on service quality, customer satisfaction, and loyalty. J. Retail. Consum. Serv. 2017, 35, 91–97. [Google Scholar] [CrossRef]
  10. Jiang, H.; Zhang, Y. An assessment of passenger experience at Melbourne Airport. J. Air Transp. Manag. 2016, 57, 80–88. [Google Scholar] [CrossRef]
  11. Hussain, R. The mediating role of customer satisfaction: Evidence from the airline industry. Asia Pac. J. Mark. Logist. 2016, 28, 22. [Google Scholar] [CrossRef]
  12. Curry, N.; Gao, Y. Low-Cost Airlines—A New Customer Relationship? An Analysis of Service Quality, Service Satisfaction, and Customer Loyalty in a Low-Cost Setting. Serv. Mark. Q. 2012, 33, 104–118. [Google Scholar] [CrossRef] [Green Version]
  13. Boon-Itt, S. Managing self-service technology service quality to enhance e-satisfaction. Int. J. Qual. Serv. Sci. 2015, 7, 373–391. [Google Scholar] [CrossRef]
  14. Li, Y.; Nishimura, N.; Yagami, H.; Park, H.-S. An Empirical Study on Online Learners’ Continuance Intentions in China. Sustainability 2021, 13, 889. [Google Scholar] [CrossRef]
  15. Ladhari, R. Alternative measures of service quality: A review. Manag. Serv. Qual. Int. J. 2008, 18, 65–86. [Google Scholar] [CrossRef]
  16. Nadiri, H.; Hussain, K. Perceptions of service quality in North Cyprus hotels. Int. J. Contemp. Hosp. Manag. 2005, 17, 469–480. [Google Scholar] [CrossRef]
  17. Calisir, N.; Basak, E.; Calisir, F. Key drivers of passenger loyalty: A case of Frankfurt–Istanbul flights. J. Air Transp. Manag. 2016, 53, 211–217. [Google Scholar] [CrossRef]
  18. Mikulić, J.; Prebežac, D. What drives passenger loyalty to traditional and low-cost airlines? A formative partial least squares approach. J. Air Transp. Manag. 2011, 17, 237–240. [Google Scholar] [CrossRef]
  19. Obermeyer, A.; Evangelinos, C.; Püschel, R. Price dispersion and competition in European airline markets. J. Air Transp. Manag. 2013, 26, 31–34. [Google Scholar] [CrossRef]
  20. Oliver, R.L. Whence Consumer Loyalty? J. Mark. 1999, 63, 33–44. [Google Scholar] [CrossRef]
  21. Namukasa, J. The influence of airline service quality on passenger satisfaction and loyalty the case of Uganda airline industry. TQM J. 2013, 25, 520–532. [Google Scholar] [CrossRef]
  22. Koklic, M.K.; Kukar-Kinney, M.; Vegelj, S. An investigation of customer satisfaction with low-cost and full-service airline companies. J. Bus. Res. 2017, 80, 188–196. [Google Scholar] [CrossRef]
  23. Raditha, H.; Clemes, M.D.; Dean, D. The Impact of Customer Engagement and Selected Higher Order Marketing Constructs on Airline Passenger Loyalty. Int. J. Qual. Serv. Sci. 2017, 34, 1–5. [Google Scholar]
  24. Mai, K.N.; Nguyen, P.N.D. International Tourists’ Loyalty to Ho Chi Minh City Destination—A Mediation Analysis of Perceived Service Quality and Perceived Value. Sustainability 2019, 11, 5447. [Google Scholar] [CrossRef] [Green Version]
  25. Chaudhuri, A.; Holbrook, M.B. The Chain of Effects from Brand Trust and Brand Affect to Brand Performance: The Role of Brand Loyalty. J. Mark. 2001, 65, 81–93. [Google Scholar] [CrossRef] [Green Version]
  26. Fine, L.M. Services marketing. Bus. Horiz. 2008, 51, 163–168. [Google Scholar] [CrossRef]
  27. Zu, E.; Liu, S.-Y.; Hsu, B.-M.; Wang, Y.-C.; Lau, E.M. An Analysis of the Success Factors for Passenger Boarding Enthusiasm for Low-Cost Regional Airline Routes. Sustainability 2020, 12, 6600. [Google Scholar] [CrossRef]
  28. Wu, K.-J.; Liao, C.-J.; Tseng, M.-L.; Chou, P.-J. Understanding Innovation for Sustainable Business Management Capabilities and Competencies under Uncertainty. Sustainability 2015, 7, 13726–13760. [Google Scholar] [CrossRef] [Green Version]
  29. Greco, B.; Bielory, L.; Stephany, D.; Hsu, S.; Gascon, P.; Nienhuis, A.; Young, N. Antithymocyte globulin reacts with many normal human cell types. Blood 1983, 62, 1047–1054. [Google Scholar] [CrossRef] [Green Version]
  30. Hansemark, O.C.; Albinsson, M. Customer satisfaction and retention: The experiences of individual employees. Manag. Serv. Qual. Int. J. 2004, 14, 40–57. [Google Scholar] [CrossRef]
  31. Yang, J.; Shen, G.Q.; Ho, M.; Drew, D.S.; Chan, A.P.C. Exploring critical success factors for stakeholder management in construction projects. J. Civ. Eng. Manag. 2009, 15, 337–348. [Google Scholar] [CrossRef]
  32. Petrick, J.F.; Backman, S.J. An Examination of the Construct of Perceived Value for the Prediction of Golf Travelers’ Intentions to Revisit. J. Travel Res. 2002, 41, 38–45. [Google Scholar] [CrossRef]
  33. Vlachos, I.; Lin, Z. Drivers of airline loyalty: Evidence from the business travelers in China. Transp. Res. Part E Logist. Transp. Rev. 2014, 71, 1–17. [Google Scholar] [CrossRef] [Green Version]
  34. Kotler, P.; Caslione, J.A. How marketers can respond to recession and turbulence. J. Cust. Behav. 2009, 8, 187–191. [Google Scholar] [CrossRef]
  35. Farooq, M.S.; Salam, M.; Fayolle, A.; Jaafar, N.; Ayupp, K. Impact of service quality on customer satisfaction in Malaysia airlines: A PLS-SEM approach. J. Air Transp. Manag. 2018, 67, 169–180. [Google Scholar] [CrossRef]
  36. Abdullah, F.; Suhaimi, R.; Saban, G.; Hamali, J. Bank Service Quality (BSQ) Index: An indicator of service performance. Int. J. Qual. Reliab. Manag. 2011, 28, 542–555. [Google Scholar] [CrossRef]
  37. Bloemer, J.; de Ruyter, K.; Peeters, P. Investigating drivers of bank loyalty: The complex relationship between image, service quality and satisfaction. Int. J. Bank Mark. 1998, 16, 276–286. [Google Scholar] [CrossRef] [Green Version]
  38. Chanpariyavatevong, K.; Wipulanusat, W.; Champahom, T.; Jomnonkwao, S.; Chonsalasin, D.; Ratanavaraha, V. Predicting Airline Customer Loyalty by Integrating Structural Equation Modeling and Bayesian Networks. Sustainability 2021, 13, 7046. [Google Scholar] [CrossRef]
  39. Allen, J.; Eboli, L.; Forciniti, C.; Mazzulla, G.; Ortúzar, J.D.D. The role of critical incidents and involvement in transit satisfaction and loyalty. Transp. Policy 2019, 75, 57–69. [Google Scholar] [CrossRef]
  40. Forgas, S.; Moliner, M.A.; Sánchez, J.; Palau, R. Antecedents of airline passenger loyalty: Low-cost versus traditional airlines. J. Air Transp. Manag. 2010, 16, 229–233. [Google Scholar] [CrossRef]
  41. Song, H.; Wang, J.; Han, H. Effect of image, satisfaction, trust, love, and respect on loyalty formation for name-brand coffee shops. Int. J. Hosp. Manag. 2018, 79, 50–59. [Google Scholar] [CrossRef]
  42. Díaz, M.R.; Rodríguez, T.F.E.S.; Díaz, R.R. A Model of Market Positioning Based on Value Creation and Service Quality in the Lodging Industry: An Empirical Application of Online Customer Reviews. Tour. Econ. 2015, 21, 1273–1294. [Google Scholar] [CrossRef]
  43. Heung, V.C.S.; Ngai, E.W.T. The Mediating Effects of Perceived Value and Customer Satisfaction on Customer Loyalty in the Chinese Restaurant Setting. J. Qual. Assur. Hosp. Tour. 2008, 9, 85–107. [Google Scholar] [CrossRef]
  44. Sadeh, F.E.; Mousavi, A.L.; Sadeh, S. Factors Affecting Tourist Satisfaction and Its Consequences. J. Basic. Appl. Sci. Res. 2012, 2, 1557–1560. [Google Scholar]
  45. Song, Z.; Su, X.; Li, L. The Indirect Effects of Destination Image on Destination Loyalty Intention Through Tourist Satisfaction and Perceived Value: The Bootstrap Approach. J. Travel Tour. Mark. 2013, 30, 386–409. [Google Scholar] [CrossRef]
  46. Yi, S.; Day, J.; Cai, L.A. Exploring Tourist Perceived Value: An Investigation of Asian Cruise Tourists′ Travel Experience. J. Qual. Assur. Hosp. Tour. 2014, 15, 63–77. [Google Scholar] [CrossRef]
  47. Gummesson, E. Total Relationship Marketing, 3rd ed.; Elsevier Ltd.: Oxford, UK, 2008. [Google Scholar]
  48. Tam, L.M.J. Customer Satisfaction, Service Quality and Perceived Value: An Integrative Model. J. Mark. Manag. 2004, 20, 897–917. [Google Scholar] [CrossRef]
  49. Park, J.-W.; Robertson, R.; Wu, C.-L. Modelling the Impact of Airline Service Quality and Marketing Variables on Passengers’ Future Behavioural Intentions. Transp. Plan. Technol. 2006, 29, 359–381. [Google Scholar] [CrossRef]
  50. Medina-Muñoz, D.R.; Medina-Muñoz, R.D.; Suárez-Cabrera, M. Determining important attributes for assessing the attractiveness of airlines. J. Air Transp. Manag. 2018, 70, 45–56. [Google Scholar] [CrossRef]
  51. Klemelä, J. Multivariate Data Analysis; John Wiley & Sons, Inc.: Hoboken, NJ, USA, 2018. [Google Scholar] [CrossRef] [Green Version]
  52. Virima, M.; Sandada, M.; Ndoro, T.T.; Chuchu, T. The impact of service quality drivers on customer satisfaction in internet provision services of Zimbabwe. J. Bus. Retail. Manag. Res. 2019, 14, 98–105. [Google Scholar] [CrossRef]
  53. Masudin, I.; Safitri, N.T.; Restuputri, D.P.; Wardana, R.W.; Amallynda, I.; Tan, A.W.K. The effect of humanitarian logistics service quality to customer loyalty using Kansei engineering: Evidence from Indonesian logistics service providers. Cogent Bus. Manag. 2020, 7, 1826718. [Google Scholar] [CrossRef]
  54. Juga, J.; Juntunen, J.; Grant, D.B. Service quality and its relation to satisfaction and loyalty in logistics outsourcing relationships. Manag. Serv. Qual. Int. J. 2010, 20, 496–510. [Google Scholar] [CrossRef]
  55. Srivastava, M.; Kaul, D. Social interaction, convenience and customer satisfaction: The mediating effect of customer experience. J. Retail. Consum. Serv. 2014, 21, 1028–1037. [Google Scholar] [CrossRef]
  56. Adeleke, A.; Aminu, S.A. The Determinants of Customer Loyalty in Nigeria’s GSM Market. Int. J. Bus. Soc. Sci. 2012, 3, 209–222. [Google Scholar]
  57. Jere, M.G.; Mukupa, A. Customer satisfaction and loyalty drivers in the Zambian mobile telecommunications industry. J. Bus. Retail. Manag. Res. 2018, 13, 120–128. [Google Scholar] [CrossRef] [Green Version]
  58. Ali, B.J.; Gardi, B.; Jabbar Othman, B.; Ali Ahmed, S.; Burhan Ismael, N.; Abdalla Hamza, P.; Mahmood Aziz, H.; Sabir, B.Y.; Sorguli, S.; Anwar, G. The Impact of Service Quality on Customer Satisfaction in Hospitality. Int. J. Eng. Bus. Manag. 2021, 5, 2456–8678. [Google Scholar] [CrossRef]
  59. Kotler, P.; Keller, K.L. Marketing Management, 15th ed.; Pearson Education, Inc.: London, UK, 2016. [Google Scholar]
  60. Dhasan, D.; Aryupong, M. Effects of product quality, service quality and price fairness on customer engagement and customer loyalty. ABAC J. 2019, 39, 82–102. [Google Scholar]
  61. Svotwa, T.D.; Roberts-Lombard, M.; Jaiyeoba, O. Black Friday rituals, customer perceived value and loyalty among young adult customers in South Africa: A Stimulus-Organism-Response perspective. Cogent Bus. Manag. 2020, 7, 1793523. [Google Scholar] [CrossRef]
  62. Indonesia—Hofstede Insights. Available online: https://www.hofstede-insights.com/country/indonesia/ (accessed on 5 January 2023).
Figure 1. Research Model.
Sustainability 15 02093 g001
Figure 2. Path diagram t-value analysis of the role of mediation variables.
Sustainability 15 02093 g002
Table 1. Research model hypothesis test.
HypothesisHypothesis StatementT-ValueExplanation
H1High service quality will increase customer satisfaction0.81The data do not support the hypothesis
H2Low prices will
increase customer satisfaction
1.49The data do not support the hypothesis
H3High customer satisfaction will increase customer loyalty3.39The data support the hypothesis
H4Customer satisfaction mediates the relationship between service quality and loyalty customerSQD-S
0.81
S-L
3.39
The data do not support the hypothesis
H5High service quality will increase perceivedvalue17.67The data support the hypothesis
H6High perceived value
will increase customer satisfaction
8.10The data support the hypothesis
H7High perceived value
will increase customer loyalty
7.53The data support the hypothesis
Disclaimer/Publisher’s Note: The statements, opinions and data contained in all publications are solely those of the individual author(s) and contributor(s) and not of MDPI and/or the editor(s). MDPI and/or the editor(s) disclaim responsibility for any injury to people or property resulting from any ideas, methods, instructions or products referred to in the content.

