

A New Geographic Information System (GIS) Tool for Hydrogen Value Chain Planning Optimization: Application to Italian Highways

 ,
,  ,
, 
Abstract
1. Introduction
2. Materials and Methods
2.1. The SuperP2G-Italy Tool
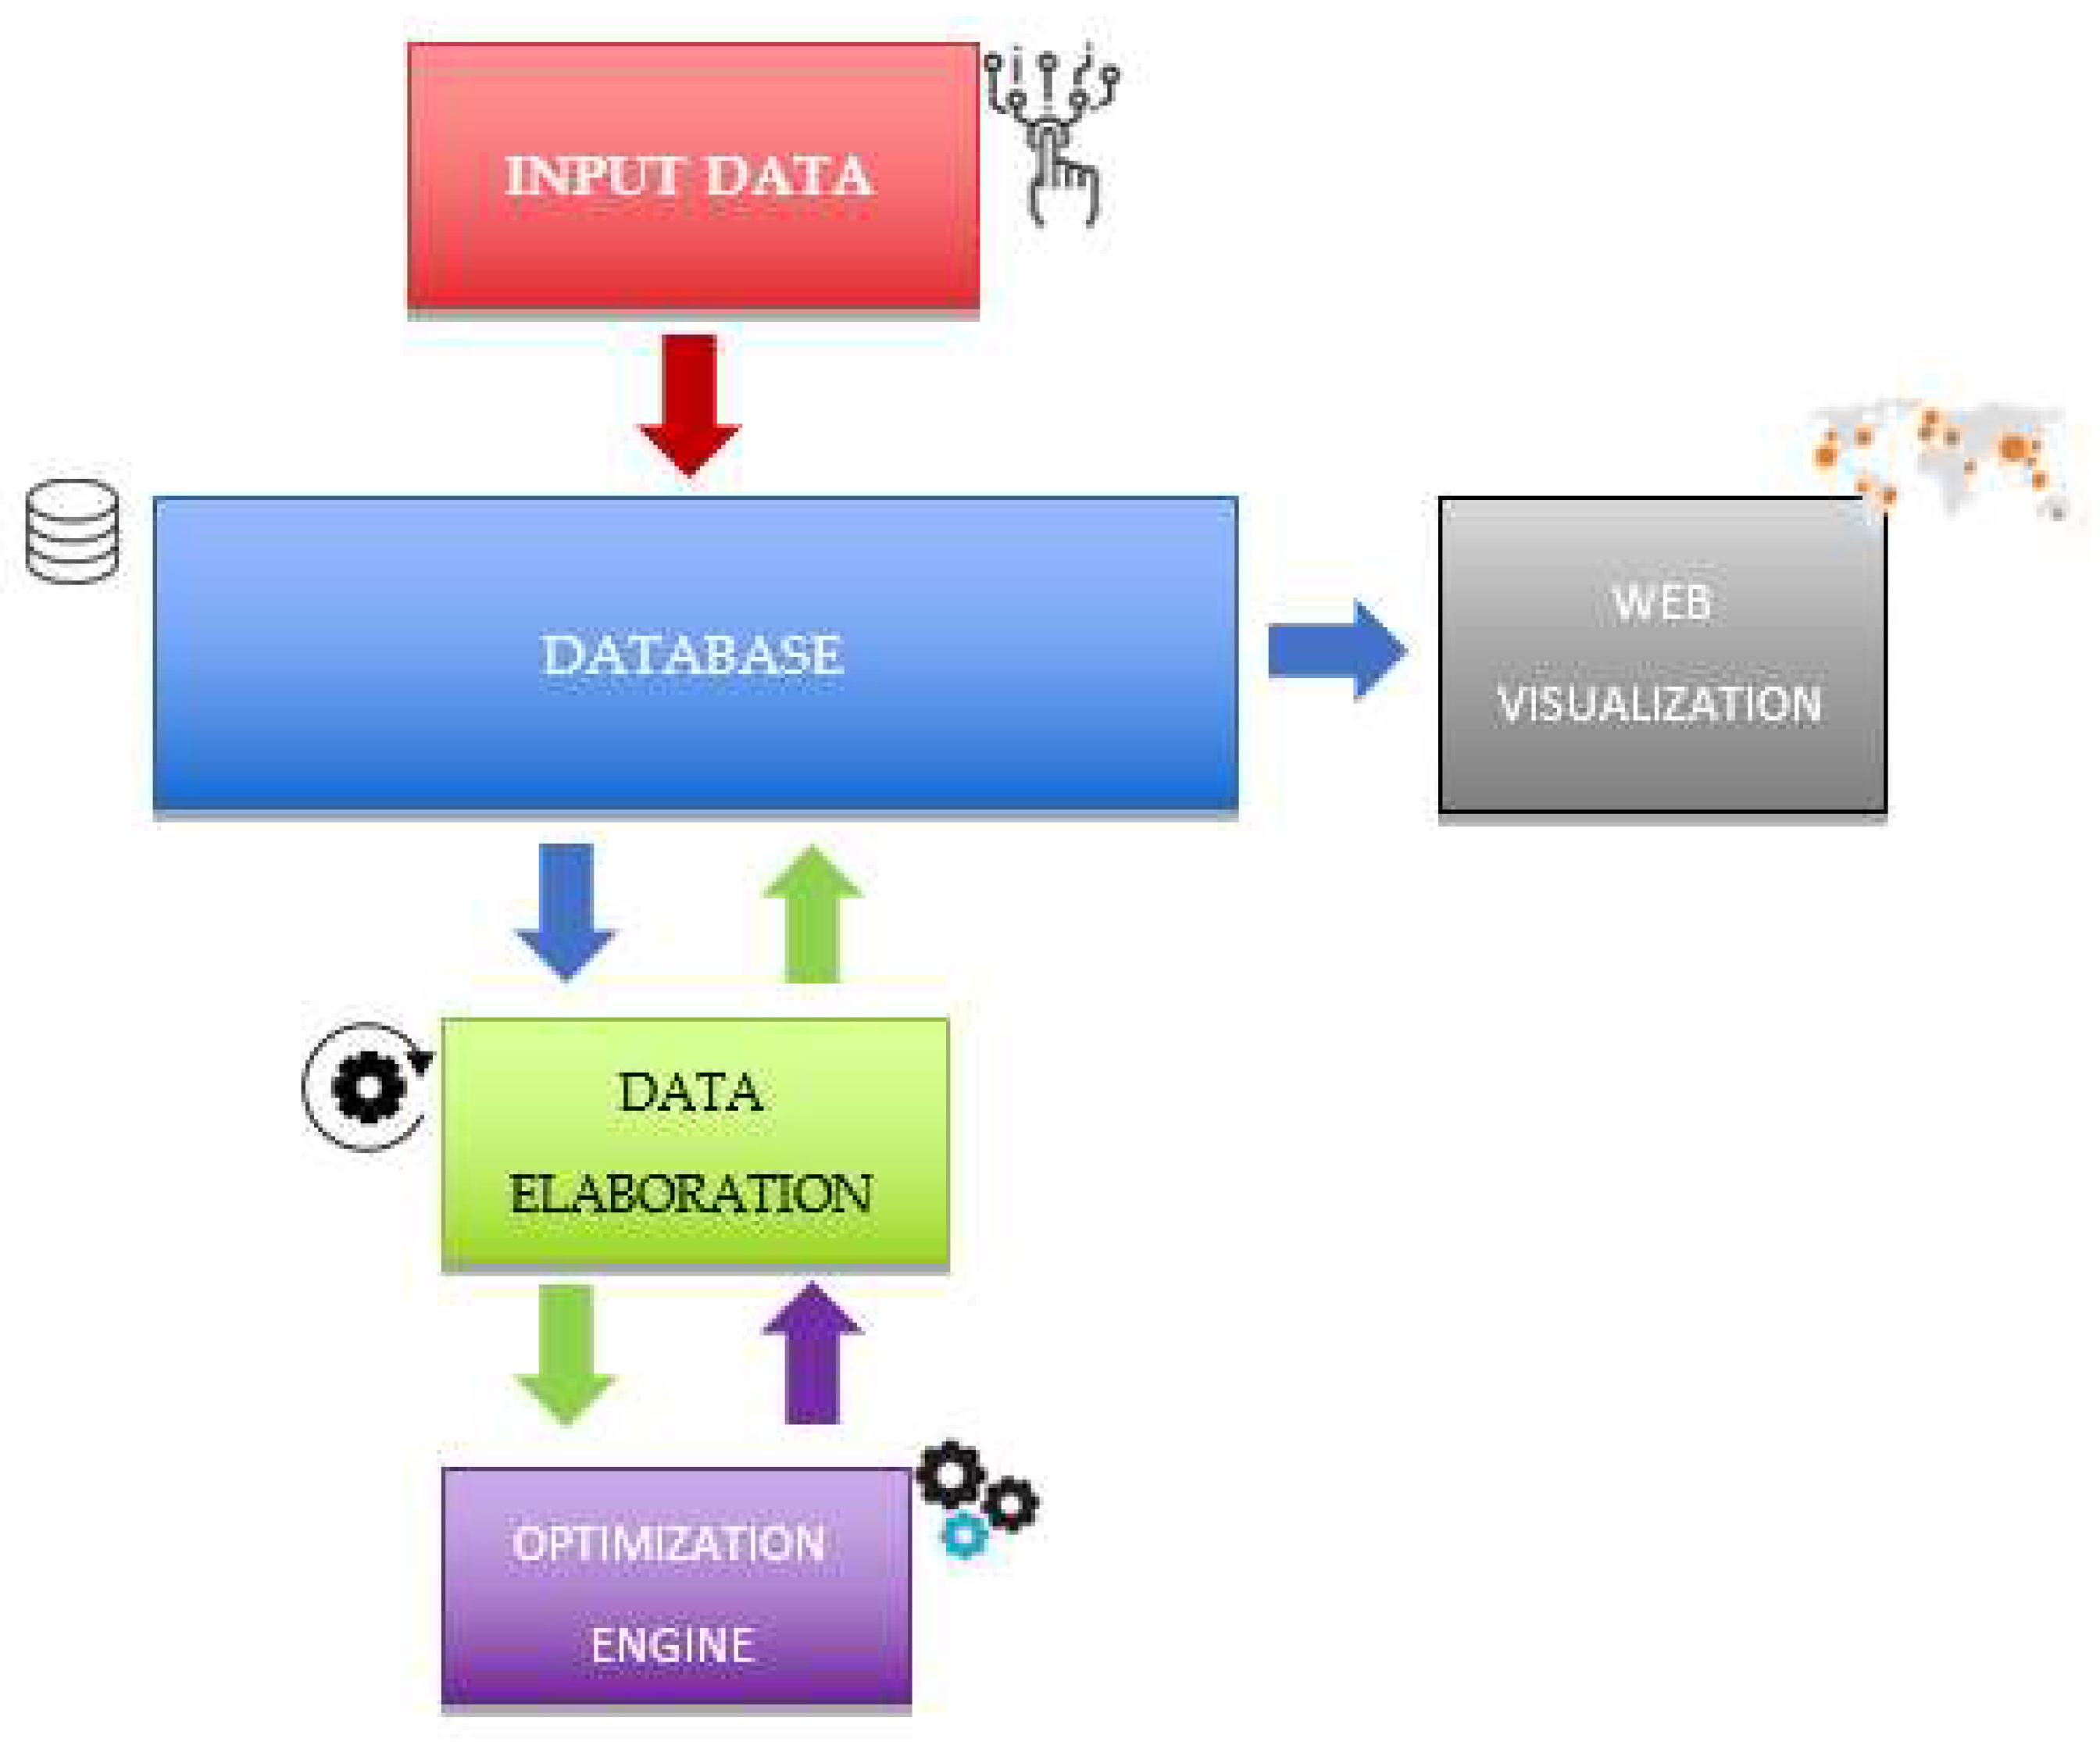
2.1.1. Overview: The Code and the Structure
2.1.2. Input Data
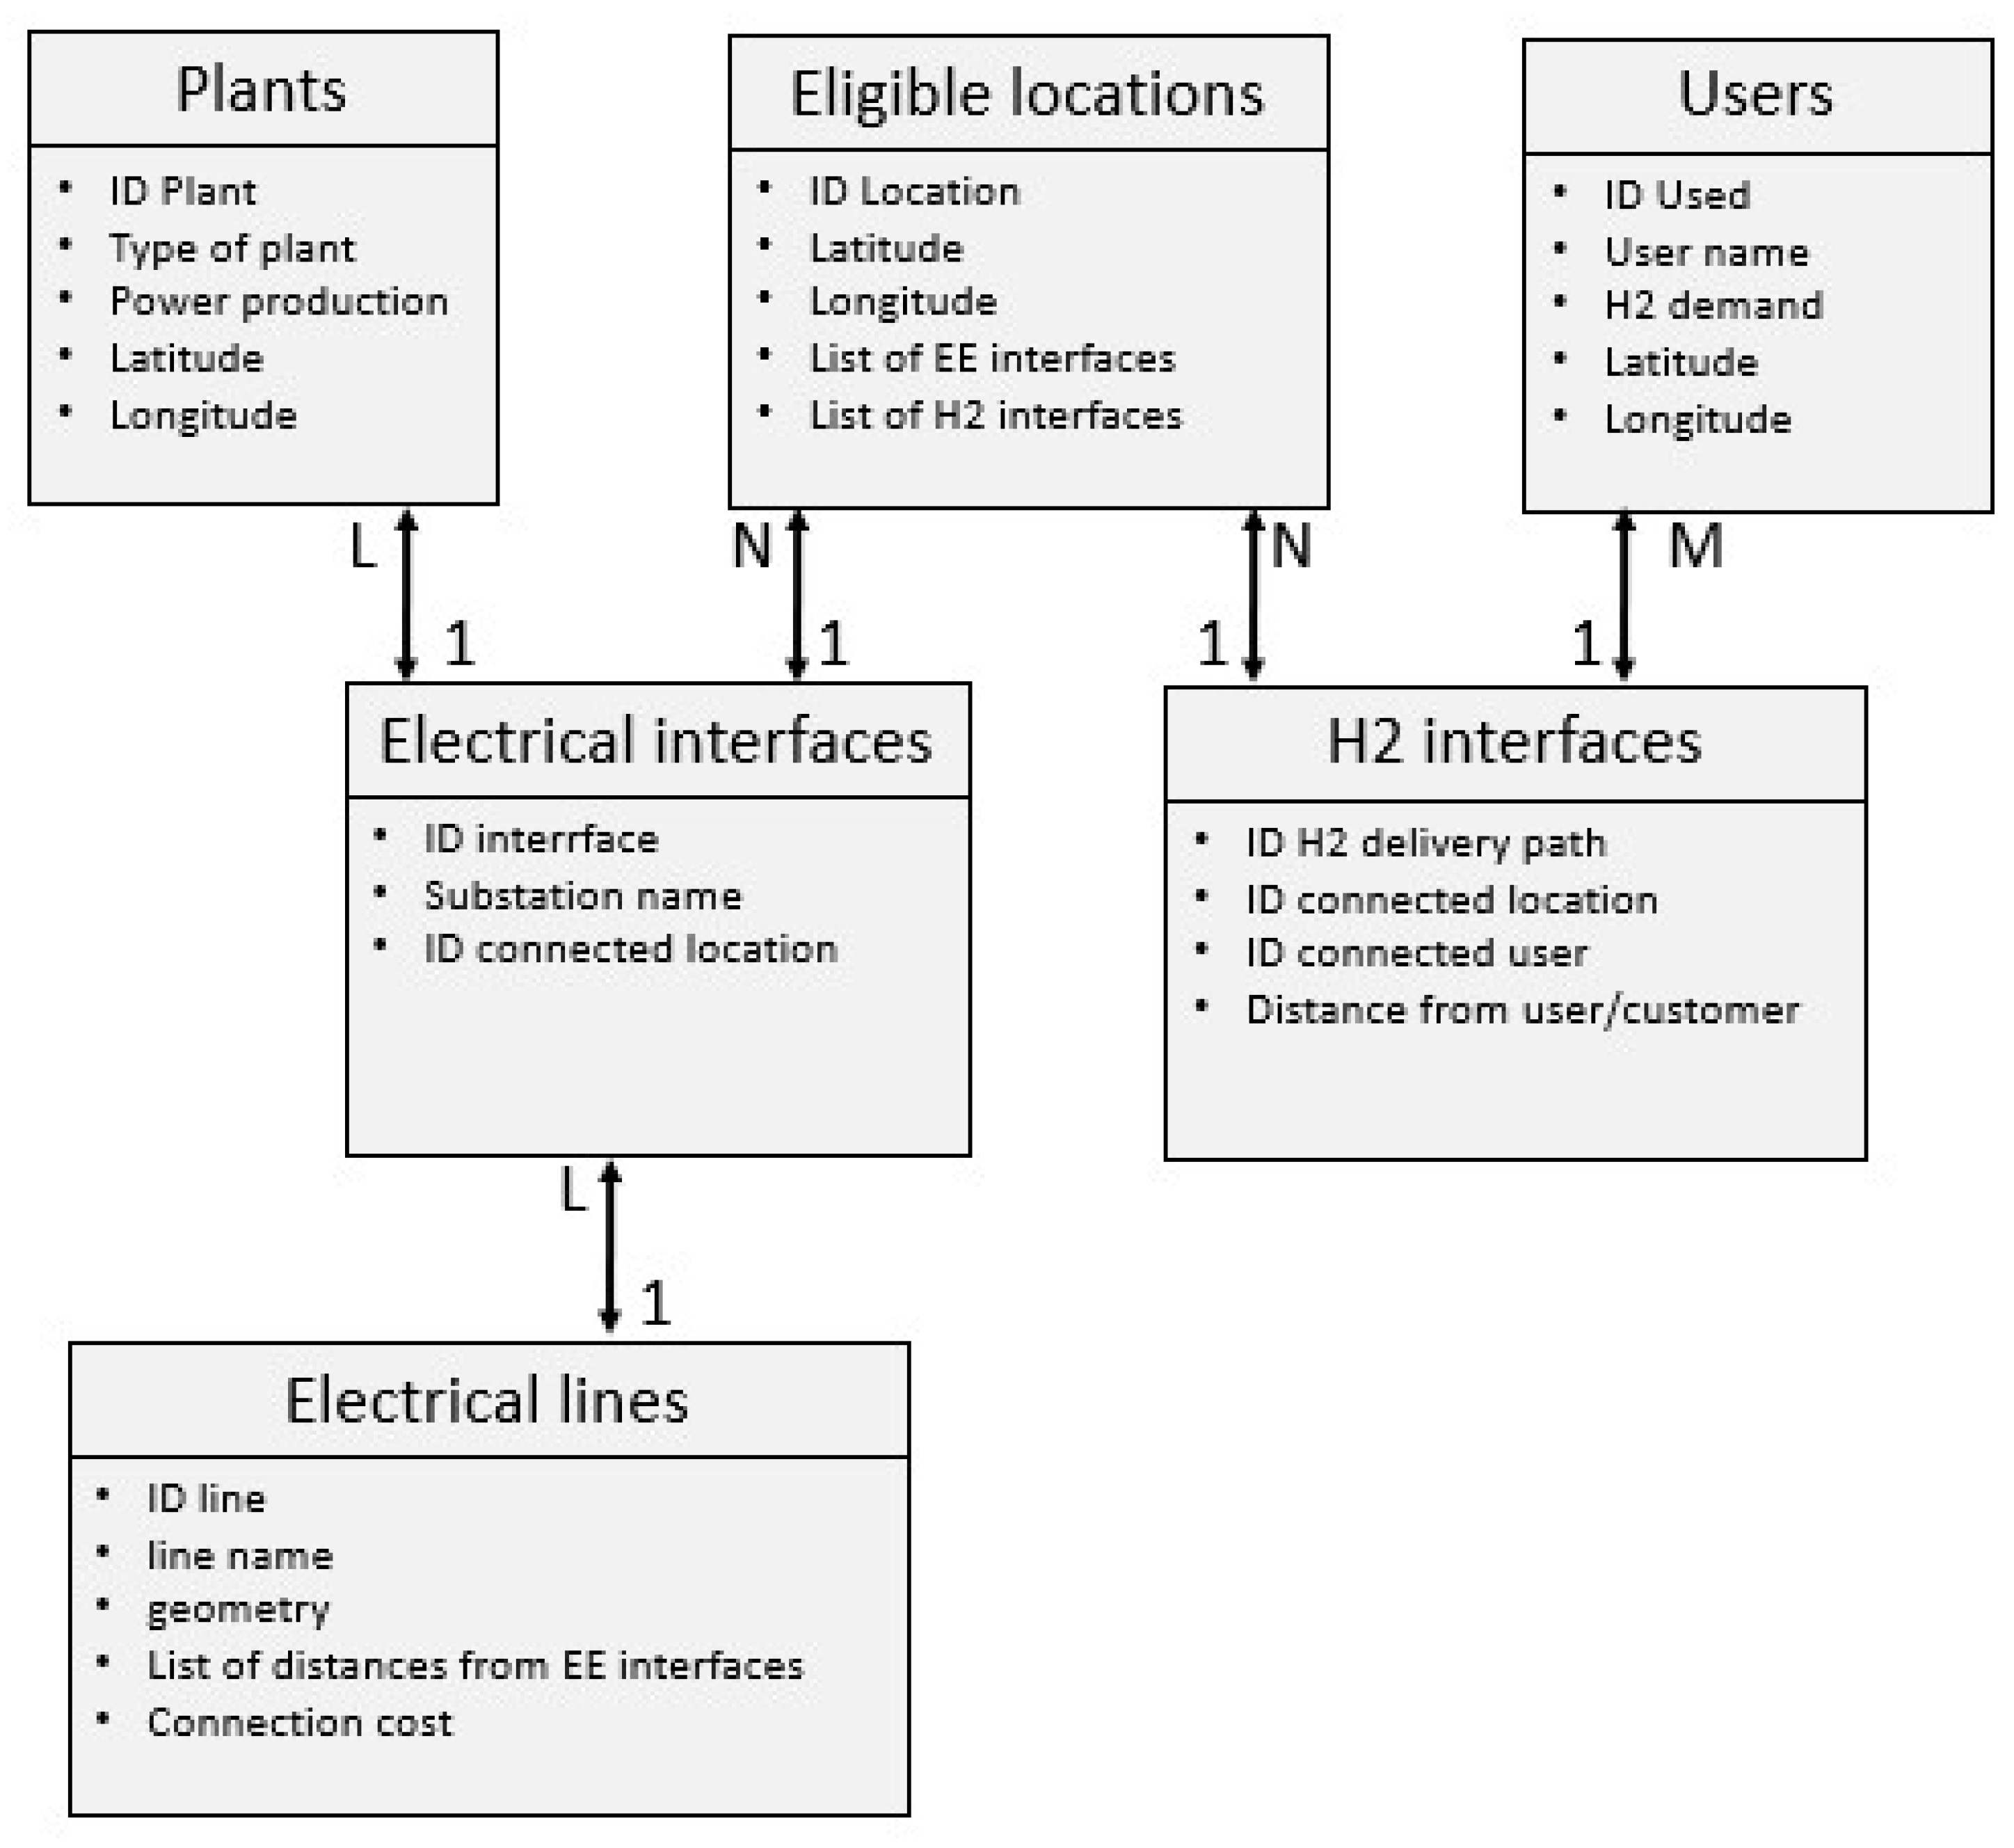
2.1.3. The Database
2.1.4. Data Elaboration
- Thanks to the high number of renewable plants, clustering techniques are applied to aggregate renewable power plants.
- Territorial meshing is performed to have homogeneous data for distance/costs computation and demand aggregation (only in specific use cases).
- Power and gas/fuel network geometry is manipulated.
- Other preprocessing operations assemble data from different sources (national open databases, administrative/statistical territorial information collections, GIS server for mapping, national infrastructure database).
- The clustering technique (density based, distance based, K-means) used for unsupervised learning.
- The mesh granularity to represent the analysed territory through a set of eligible P2G positions, one among which is selected as the best subset to minimize LCOH.
- The number of selected electrical networks to calculate distances for P2G connections (the presence of different nominal voltage/capacity networks may result in different costs).
- The technique to evaluate the distance from P2G plants to consumers (e.g., geodesic, routing), even if they can be adjusted to simplify calculations.
2.1.5. The Mathematical Optimization Model
2.1.6. The Optimization Solver
2.1.7. SuperP2G-Italy Limitations
- Approximation of continuous variables—the current version of the tool elaborates the data in a mesh in which size can be decided by the users. Therefore, a very fine mesh could be selected to resolve the problem. However, as for other nondeterministic class problems, the computational time increases, rapidly diminishing the size of the mesh.
- Geographical boundary conditions—in the current version, the tool calculated the best position for the plant without taking into account of any potential boundary constraints, such as hydrogeological ones, fire and earthquake risks, and reserve areas or forbidden areas.
- Complex cost models—the estimation of the P2H plants’ capital expenditure (CAPEX) and operational expenditure (OPEX) requires a complex cost function that depends on many parameters and boundary conditions, first of all the size. However, the introduction of too many restrictive constraints or complex cost models could determine an “infeasible” condition using (currently available) deterministic mathematical solvers requiring a simplified estimation.
2.2. Hydrogen Demand on Italian Highways
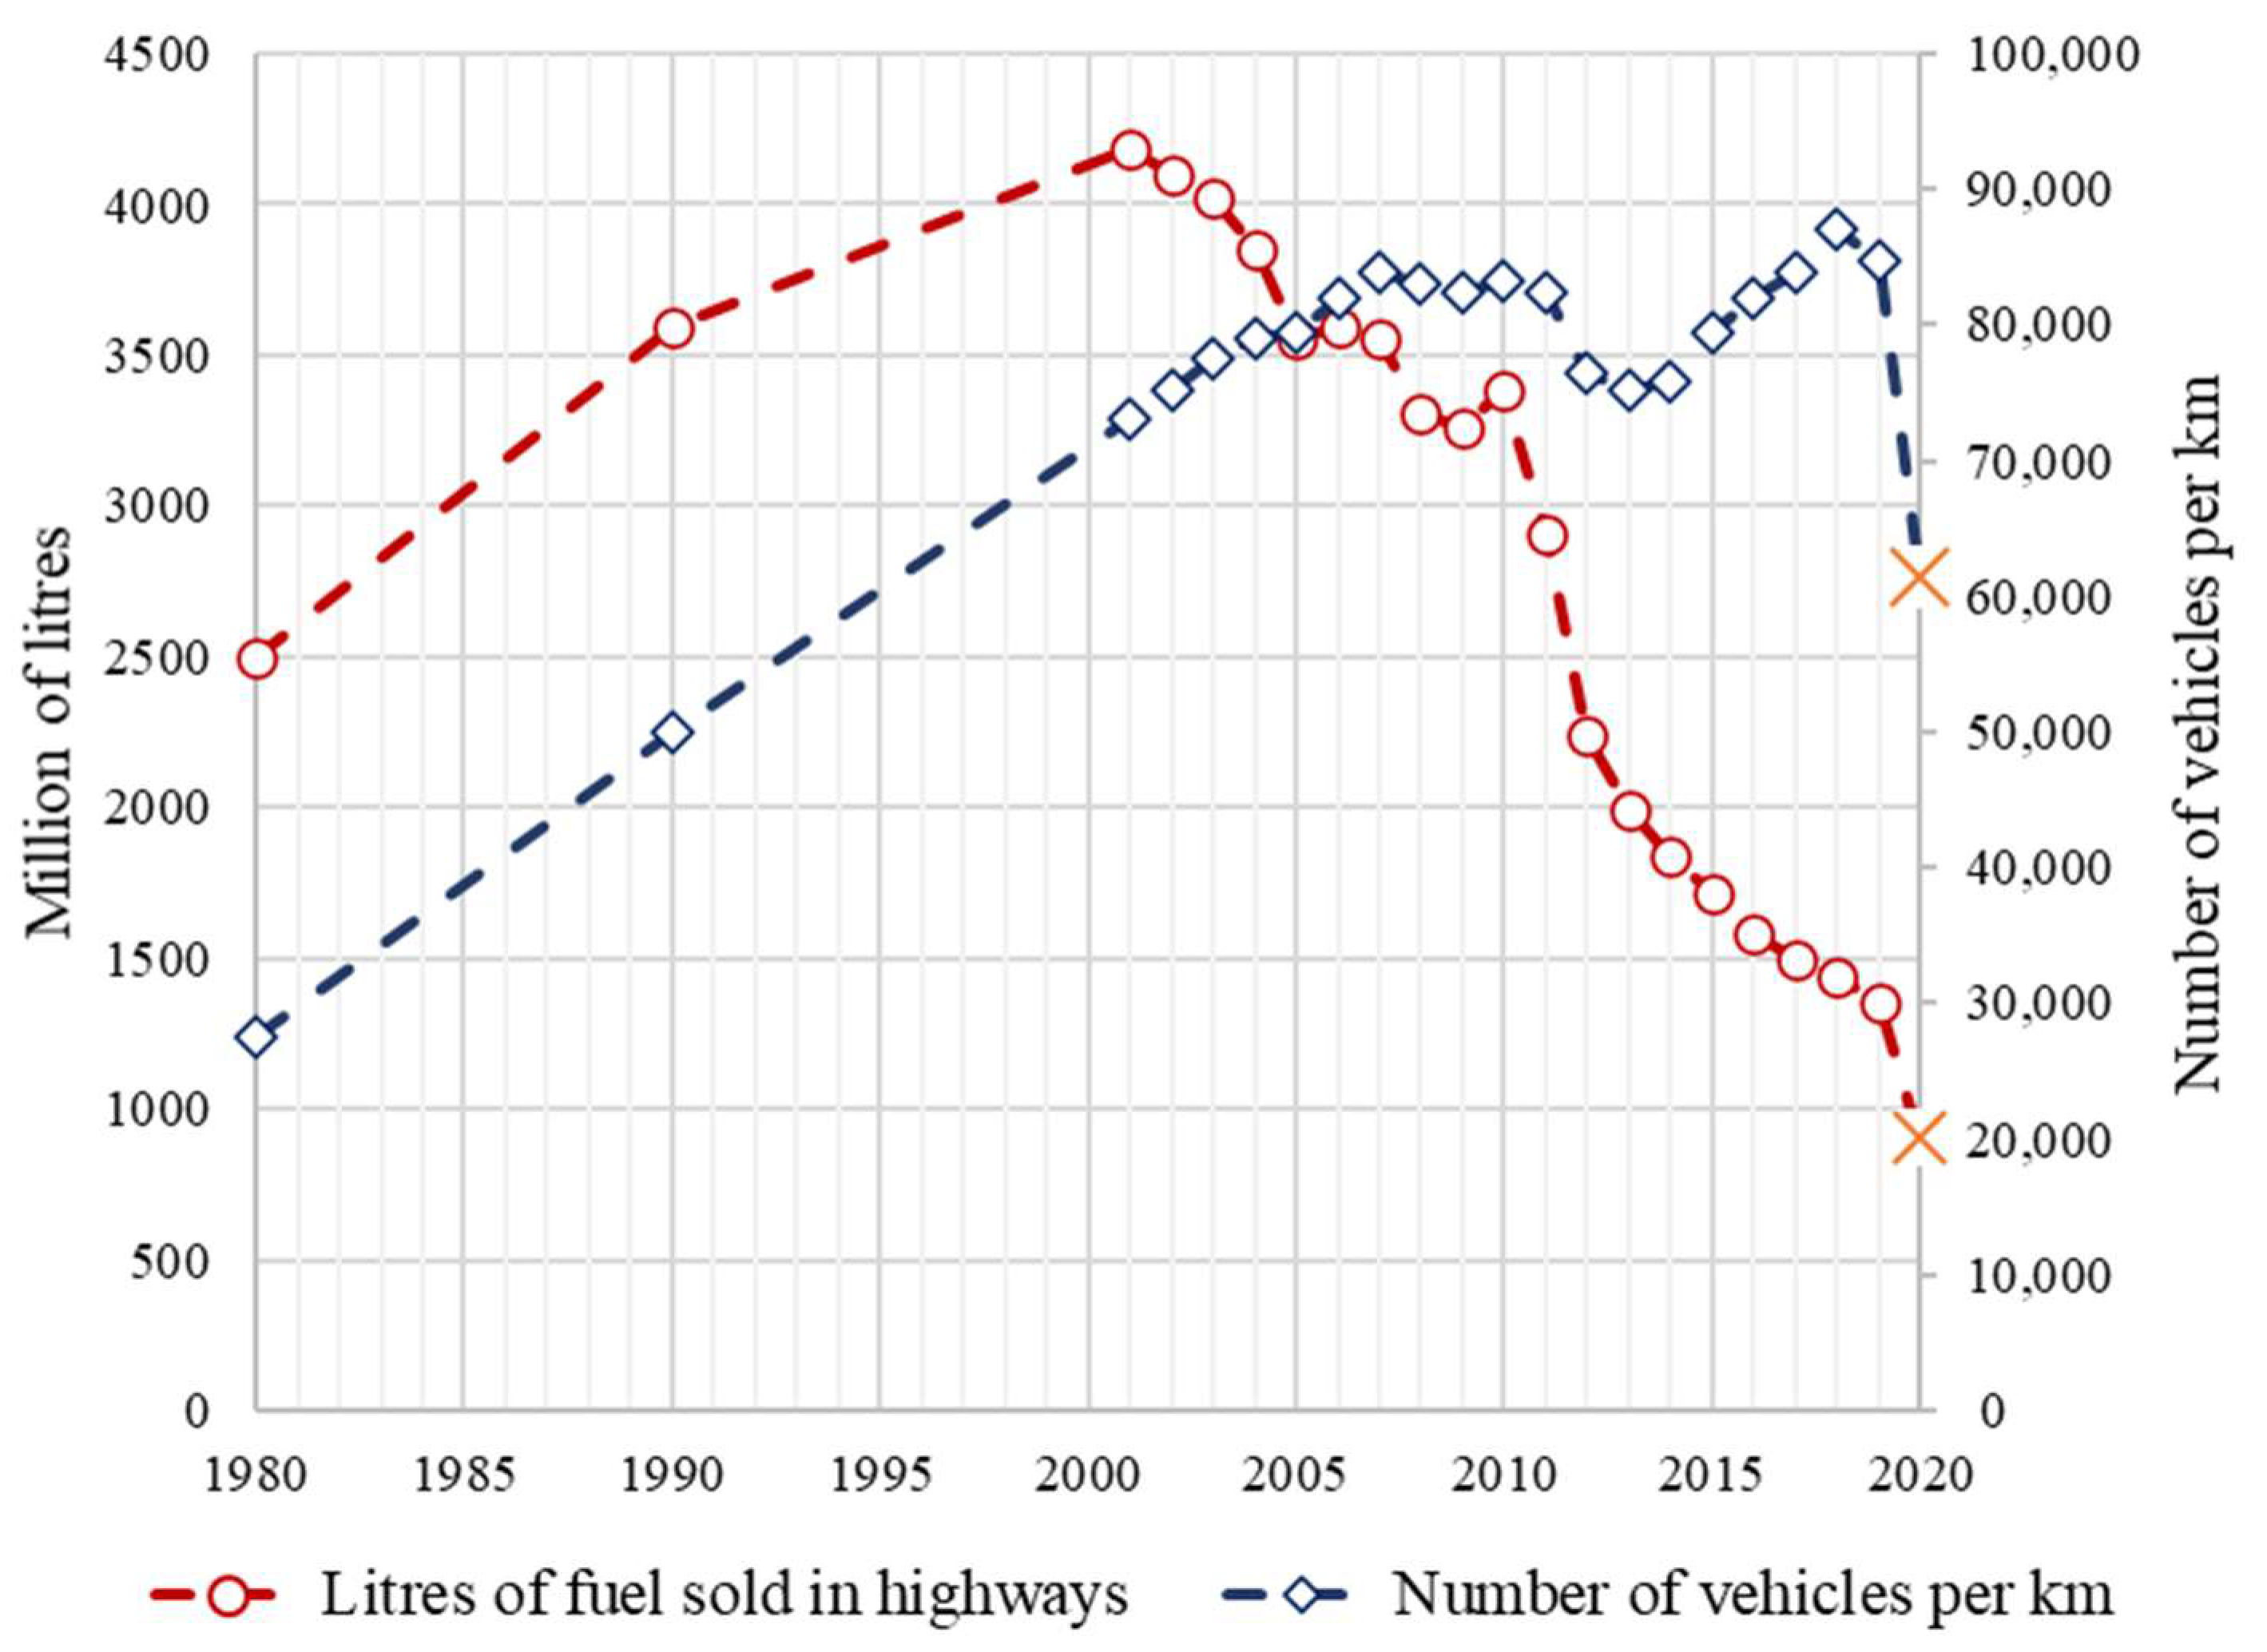
2.2.1. Italian Highways: Overview
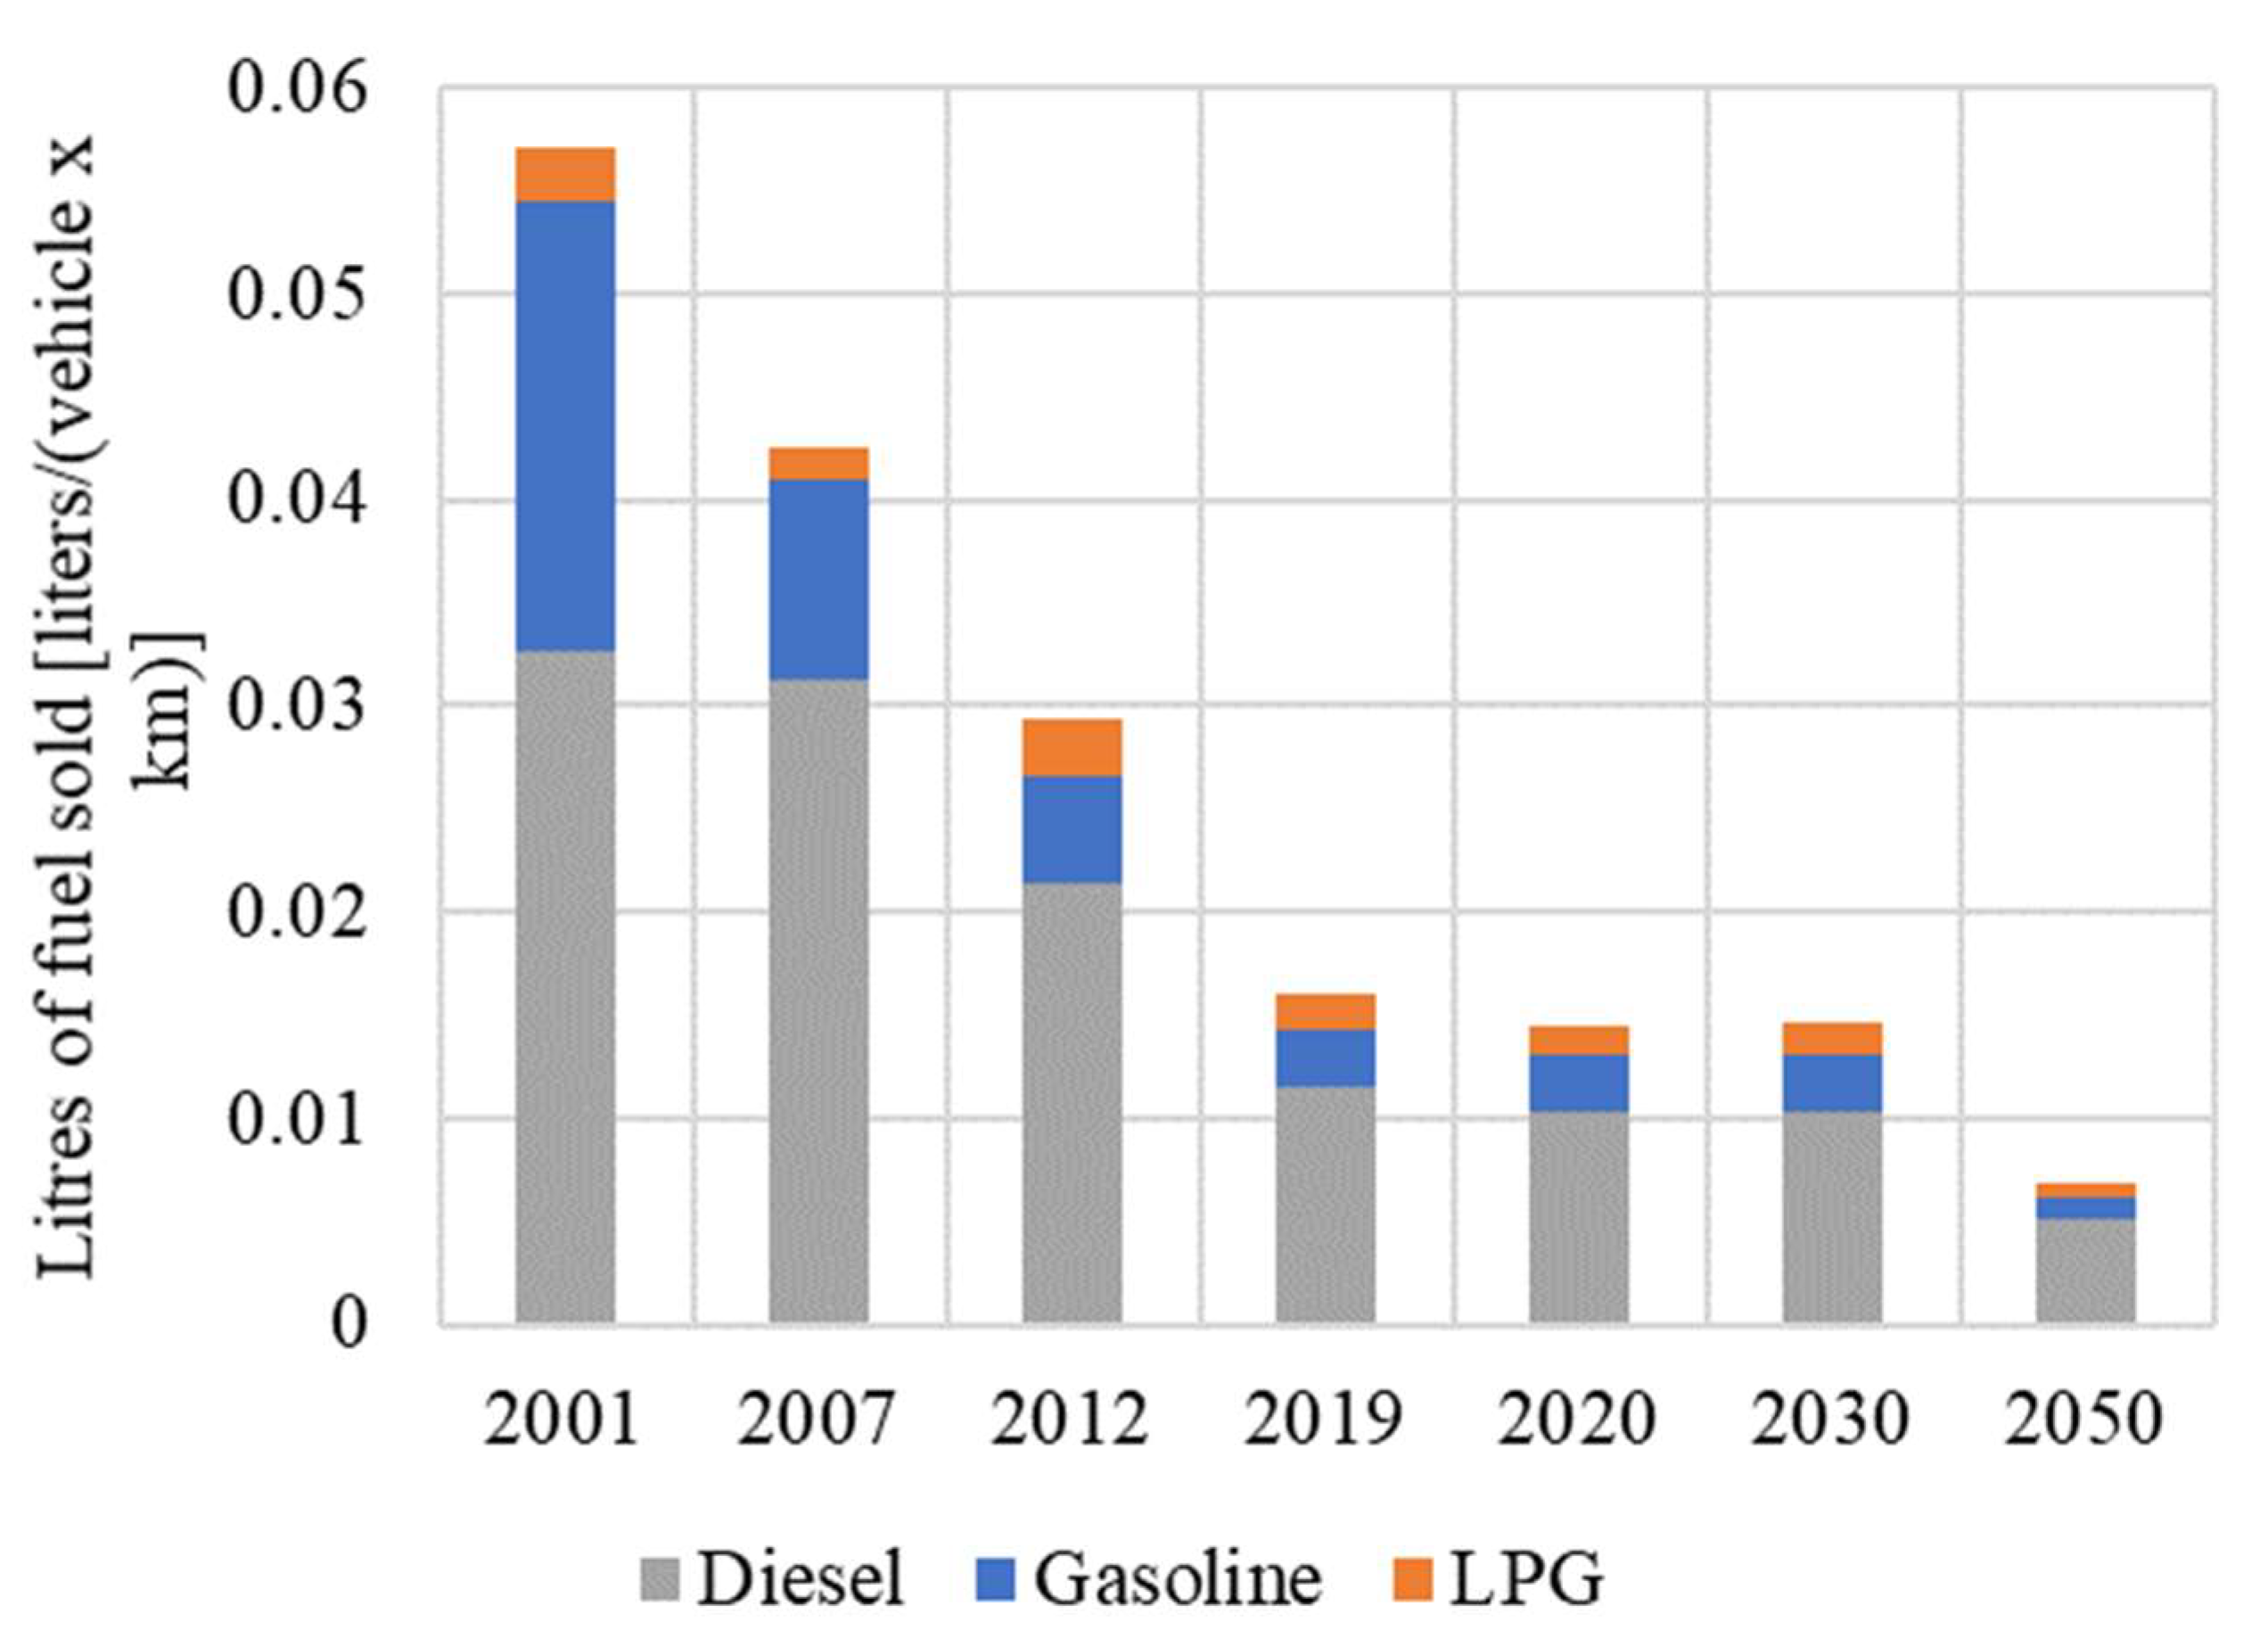
2.2.2. Hydrogen Demand Estimation
- l = 1, 2, 3. Specifically, l = 1 for gasoline, l = 2 for diesel, and l = 3 for LPG.
- n = 1, 2. Specifically, n = 1 for 2030 and n = 2 for 2050.
- αn is the hydrogen penetration in the mobility sector assumed equal to 2% in 2030 and 15% in 2050 in accordance with [50].
- Vl is the annual amount of the lth fuel sold on Italian highways in 2030 and in 2050 [L/year].
- LHV is the low heating value of the fuel, and it is assumed equal to 31.8 MJ/L, 36.1 MJ/L, 25.5 MJ/L, and 120 MJ/kg, respectively, for gasoline, diesel, LPG, and hydrogen.
- k = 1, 2, …,75 is the number of Italian highways’ routes.
- H2,n,p is the estimated hydrogen demand in the kth route.
- Nn,p is the number of refuelling stations in the kth route that will be converted to hydrogen.
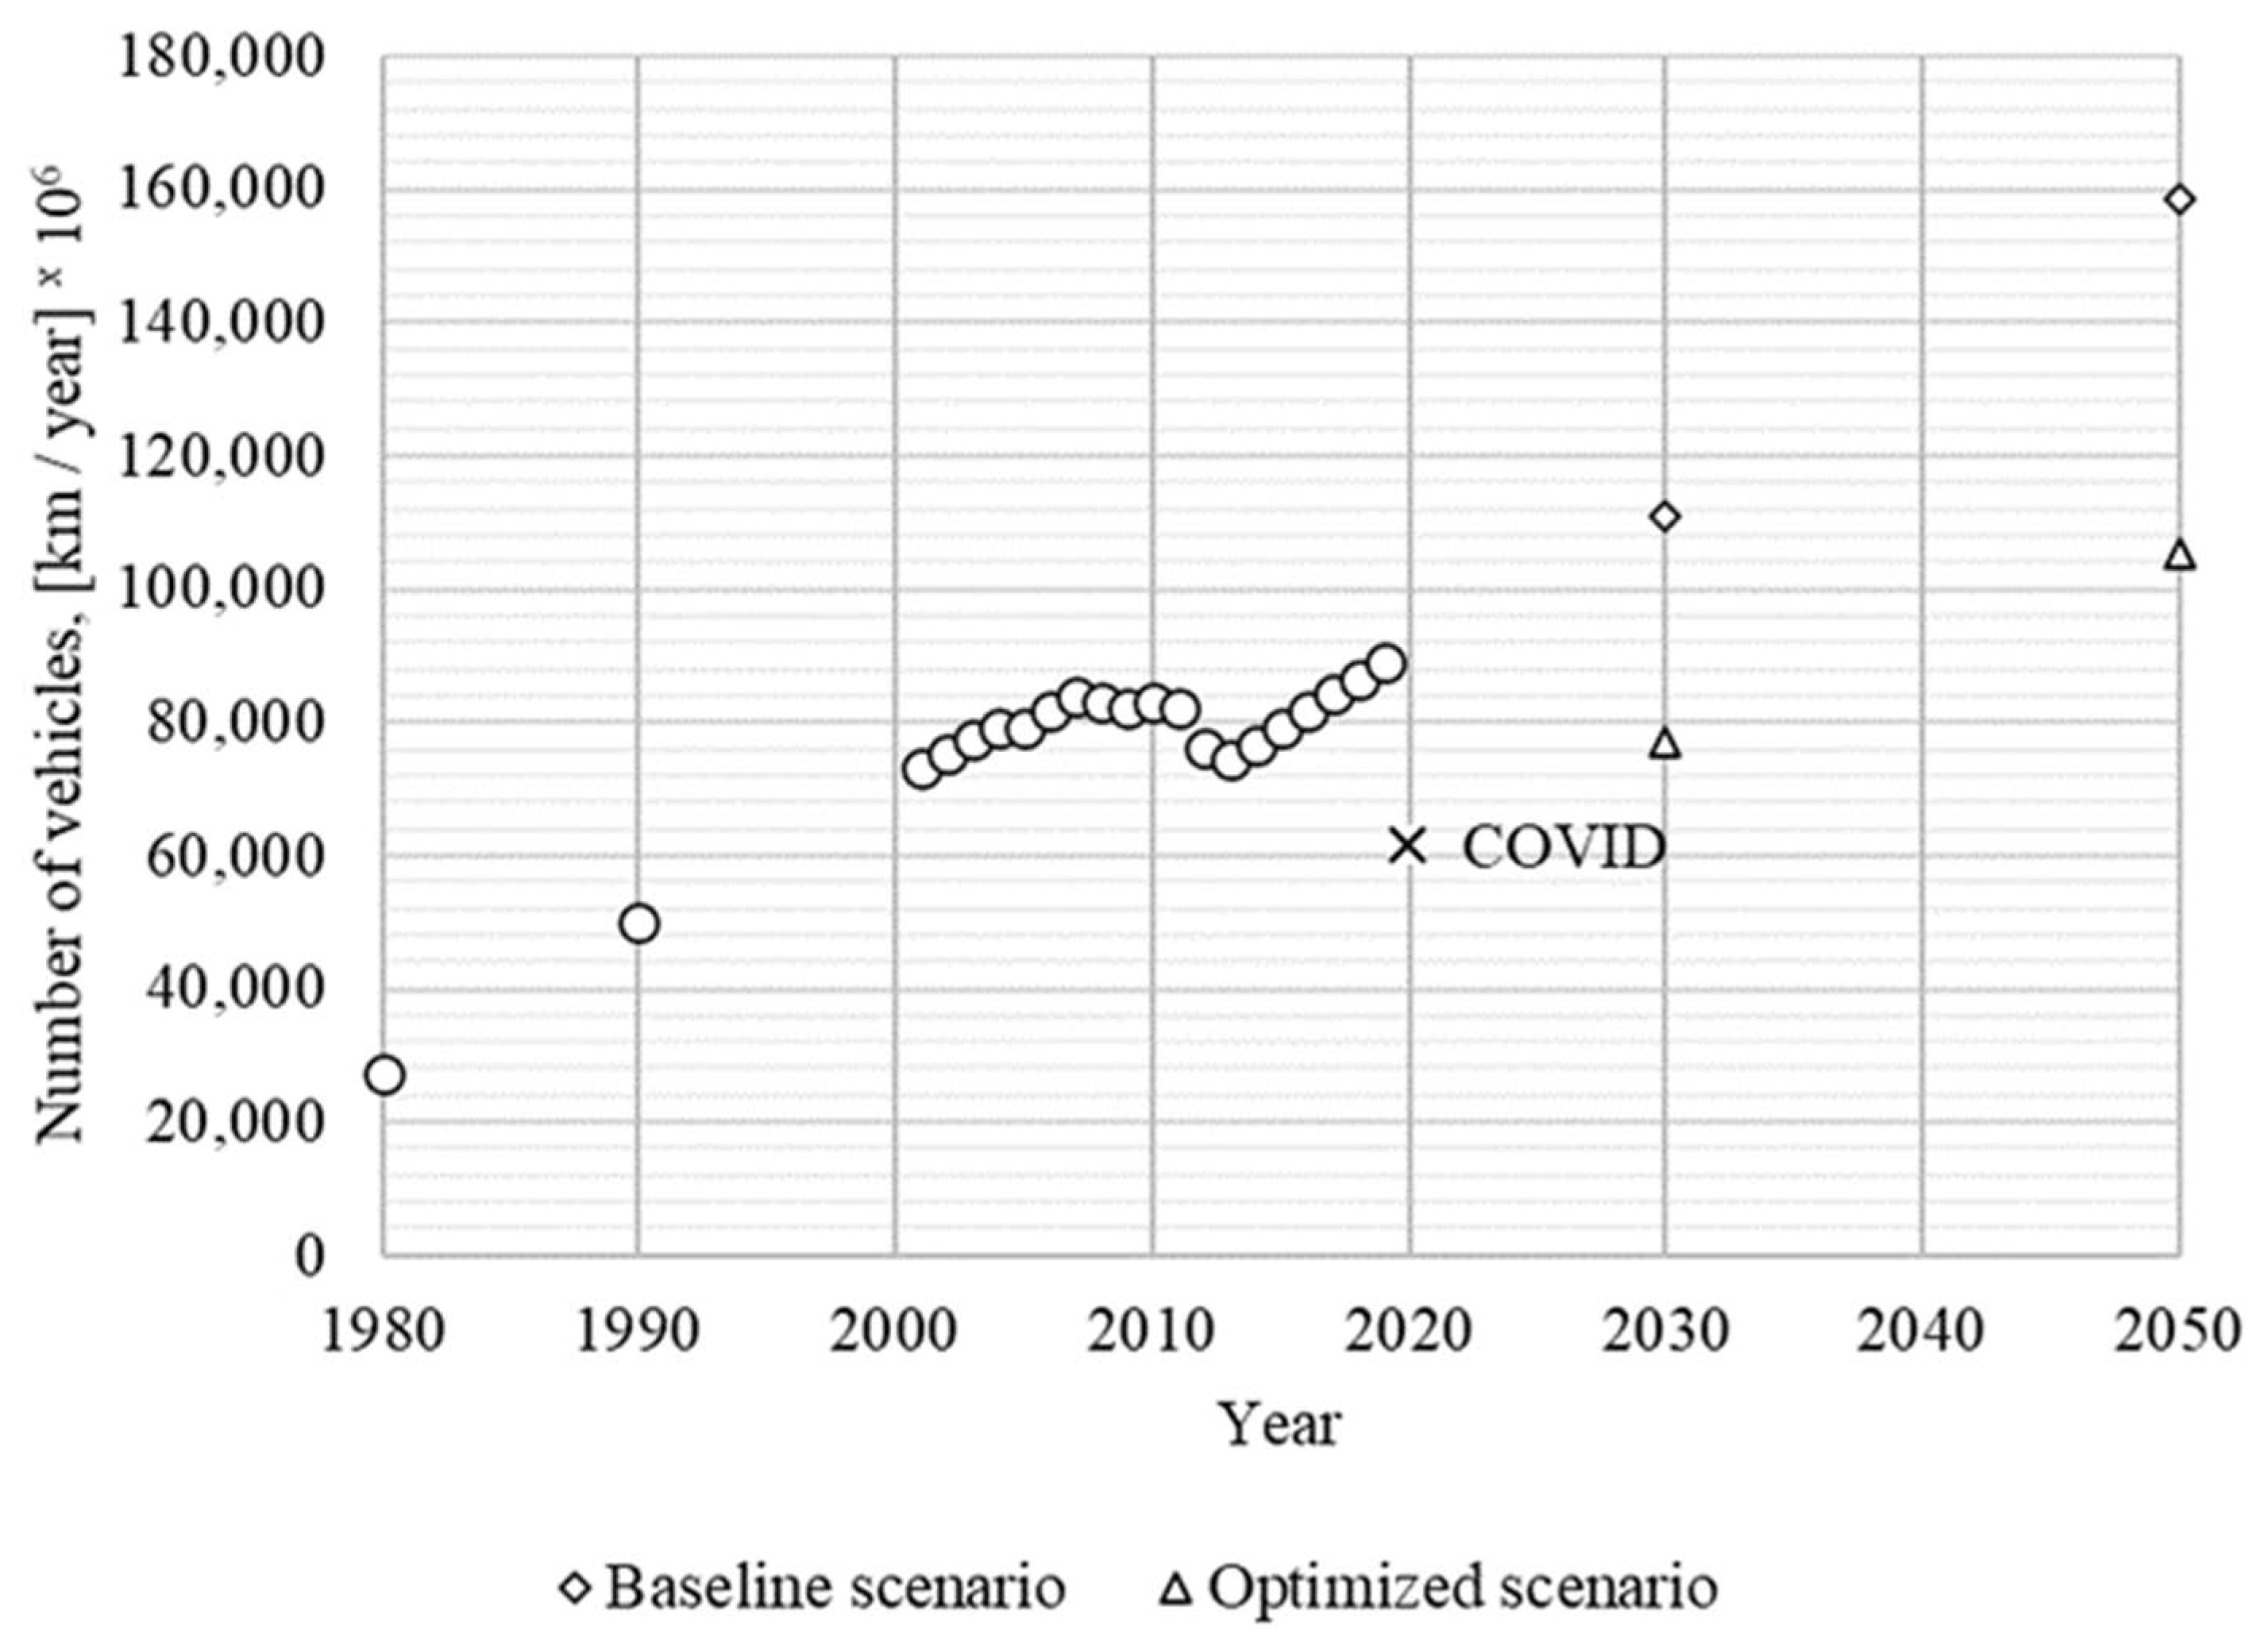
2.2.3. Scenario Definitions
- Hydrogen penetration—the parameters will depend on H2 penetration in the mobility market. As shown, in 2030 and 2050, a maximum penetration of 2% and 15%, respectively, is assumed.
- P2H plant nominal size—because there is a lower specific cost from increasing the nominal size, different plant sizes are investigated by the tool. As a preliminary assumption, a maximum P2H plant nominal size of 10 MW is considered for similar applications in 2030, while a high threshold and a low threshold, specifically 20 MW and 30 MW, respectively, are assumed for 2050.
- Baseline and optimized scenarios were investigated following the process from the previous section.
- A maximum daily distance covered by a truck was assumed to be equal to 200 km and 500 km.

| #sim | Temporal Frame | P2H Plant Nominal Size [kW] | H2 [%] | Scenario | truck_km | |
|---|---|---|---|---|---|---|
| 1 | Middle Term (2030) | (100, 300, 1000, 3000, 5000, 10,000) | 2 | base | 200 | |
| 2 | 2 | opt | ||||
| 3 | 2 | base | 500 | |||
| 4 | 2 | opt | ||||
| 5 | Long Term (2050) | (500, 1000, 3000, 5000, 10,000, 20,000, 30,000) | 15 | base | 200 | |
| 6 | 15 | opt | ||||
| 7 | 15 | base | 500 | |||
| 8 | 15 | opt | ||||
3. Results
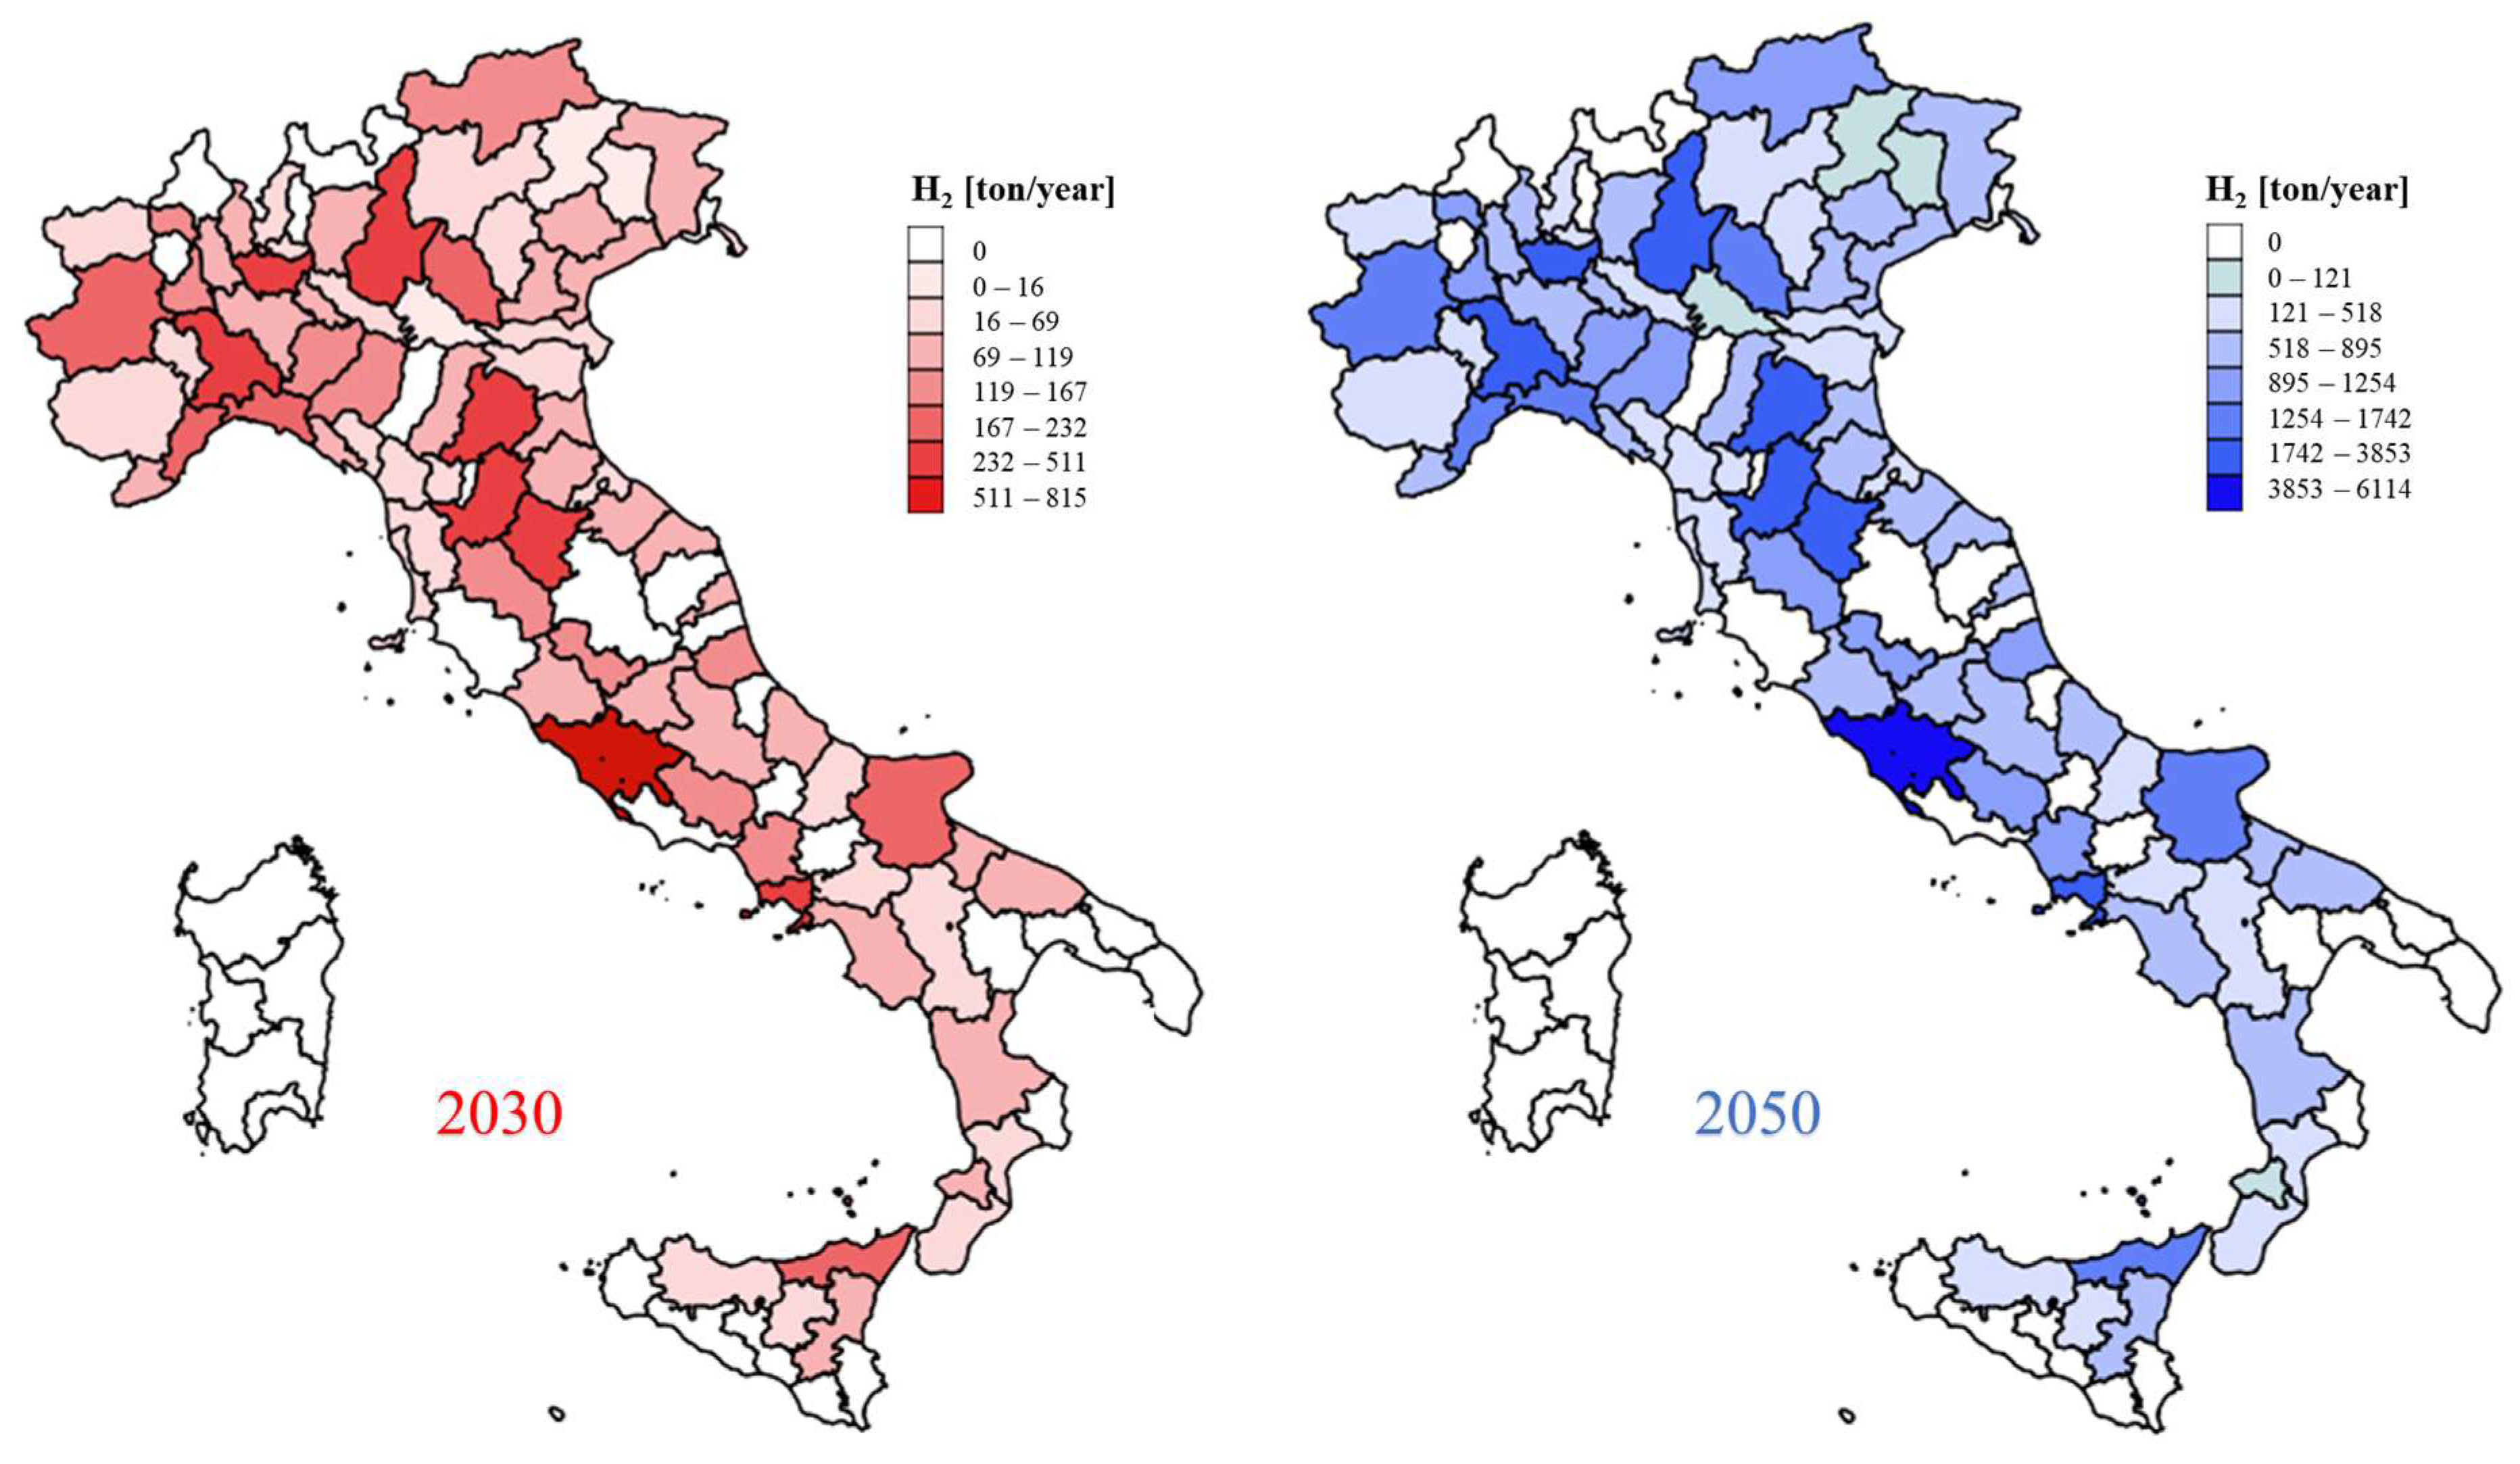
3.1. Hydrogen Demand on Italian Highways in 2030 and 2050
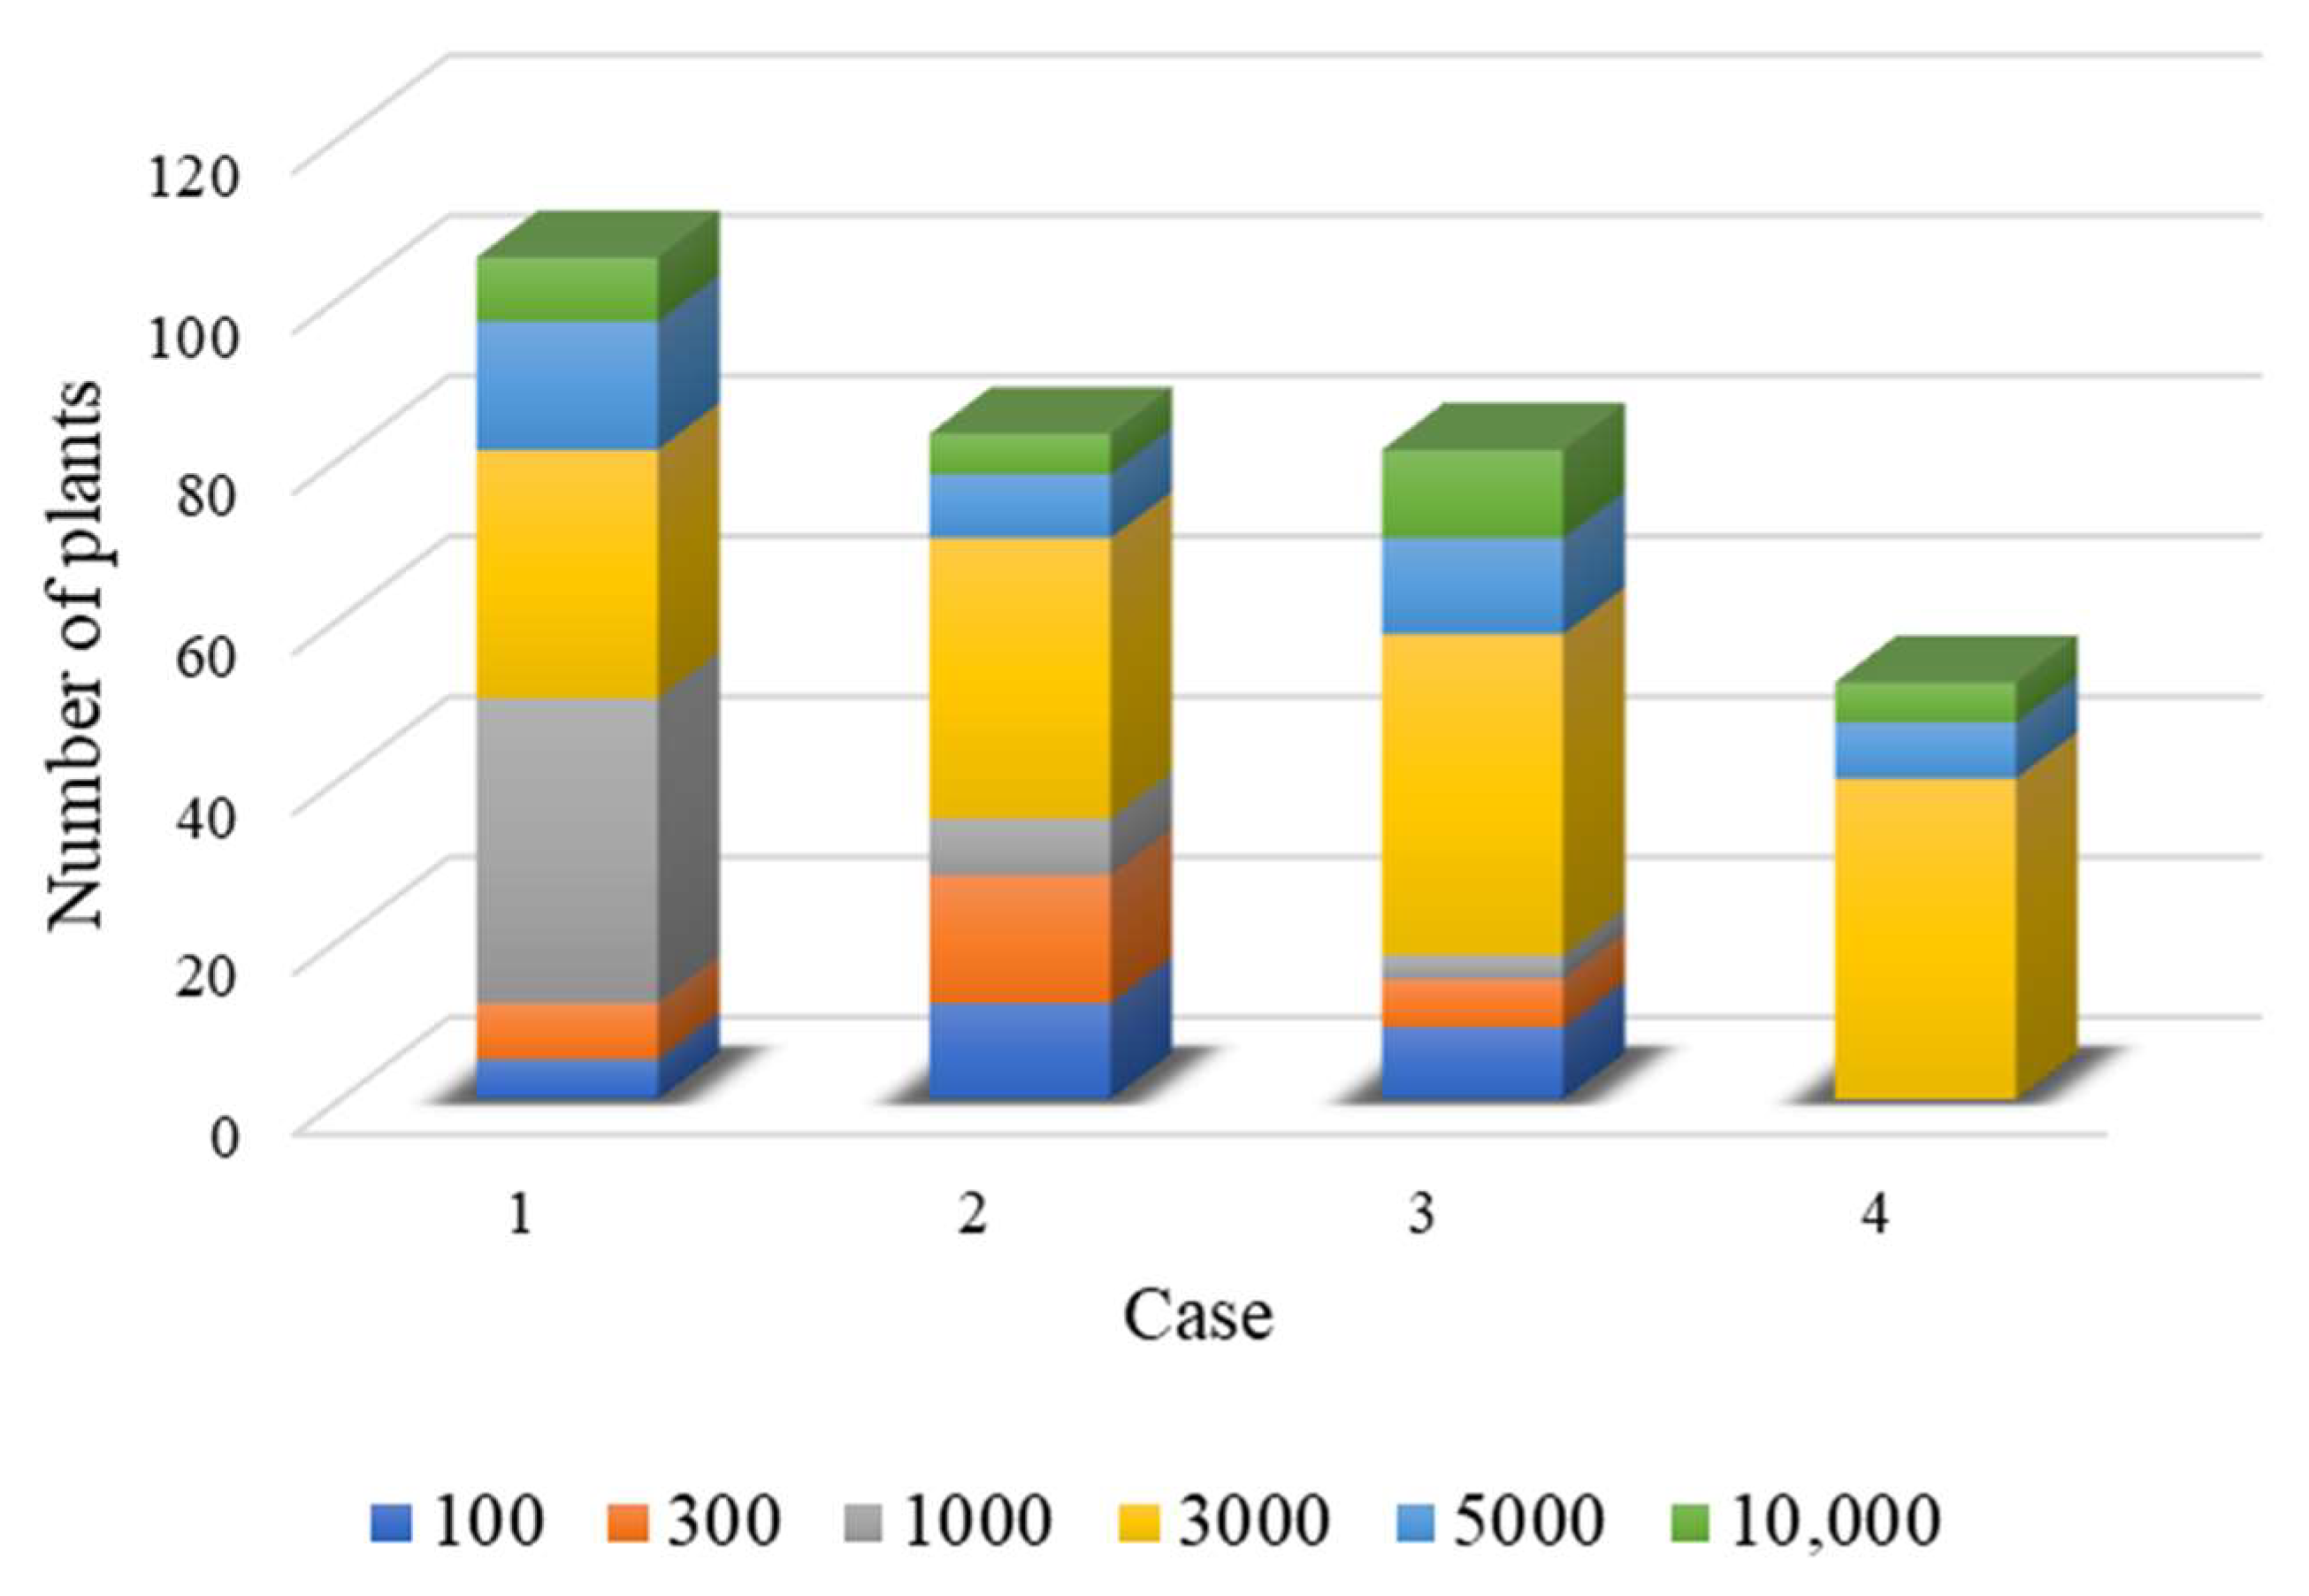
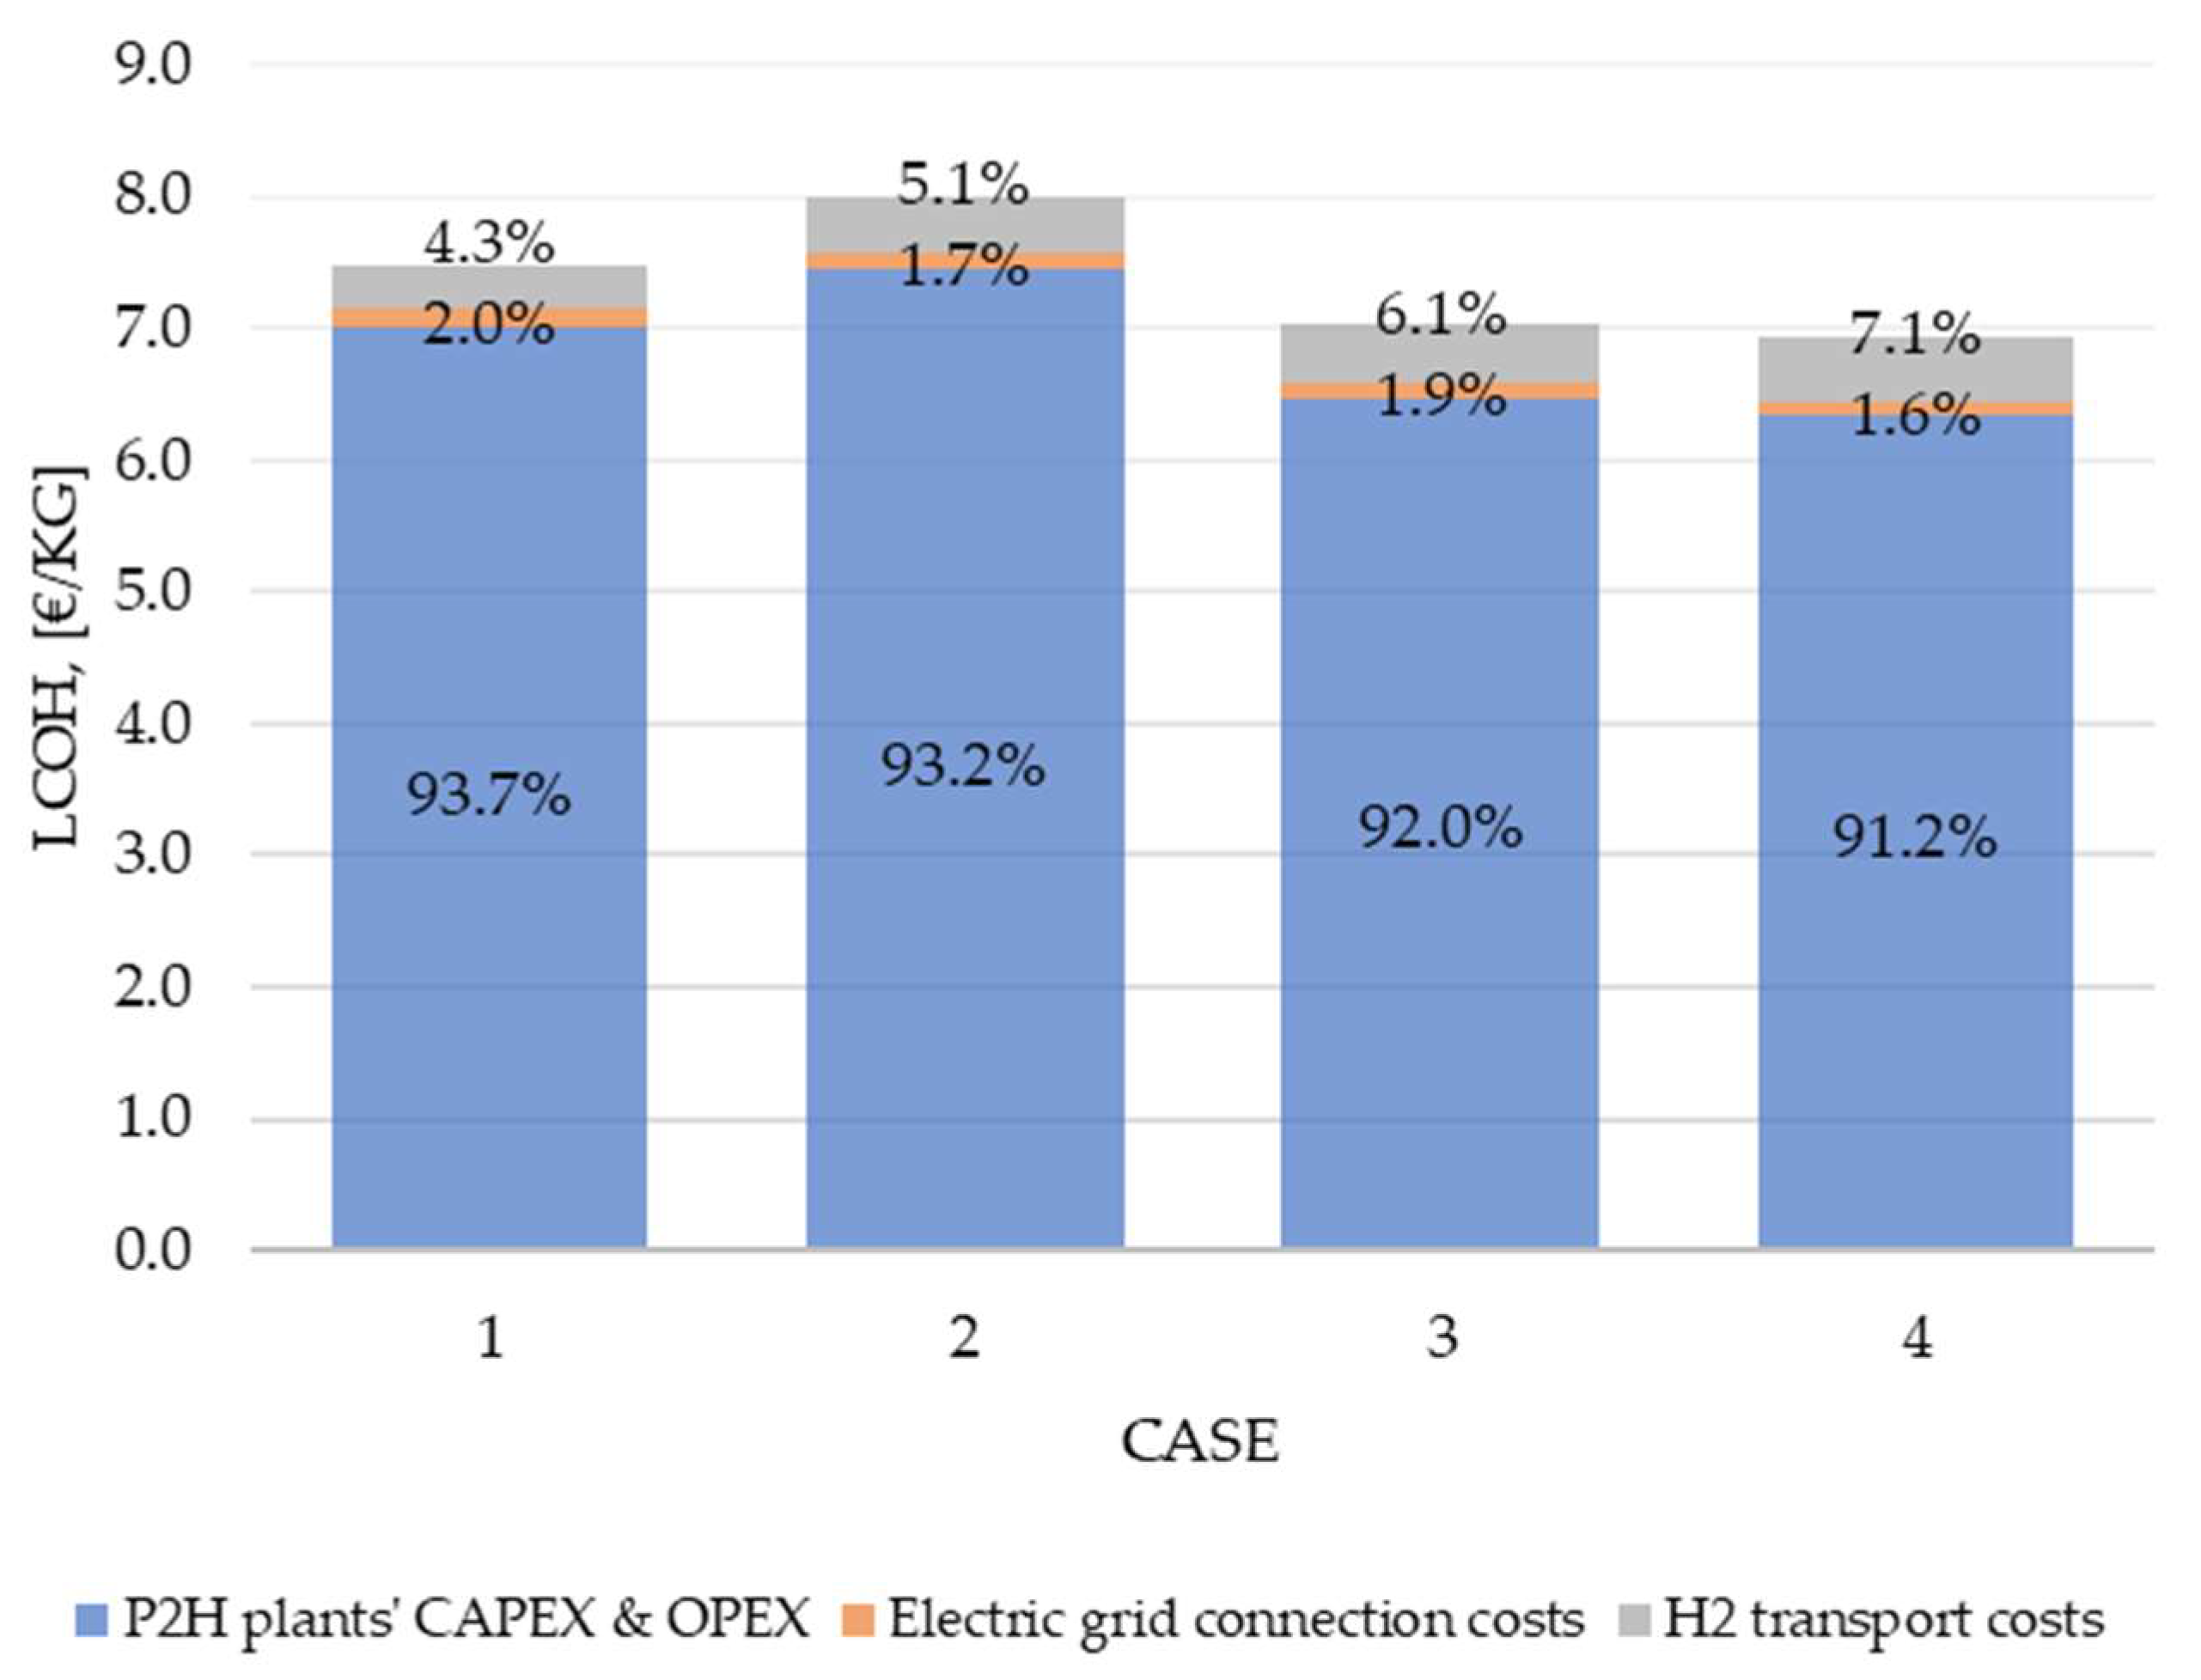
3.2. Scenario Analysis: 2030
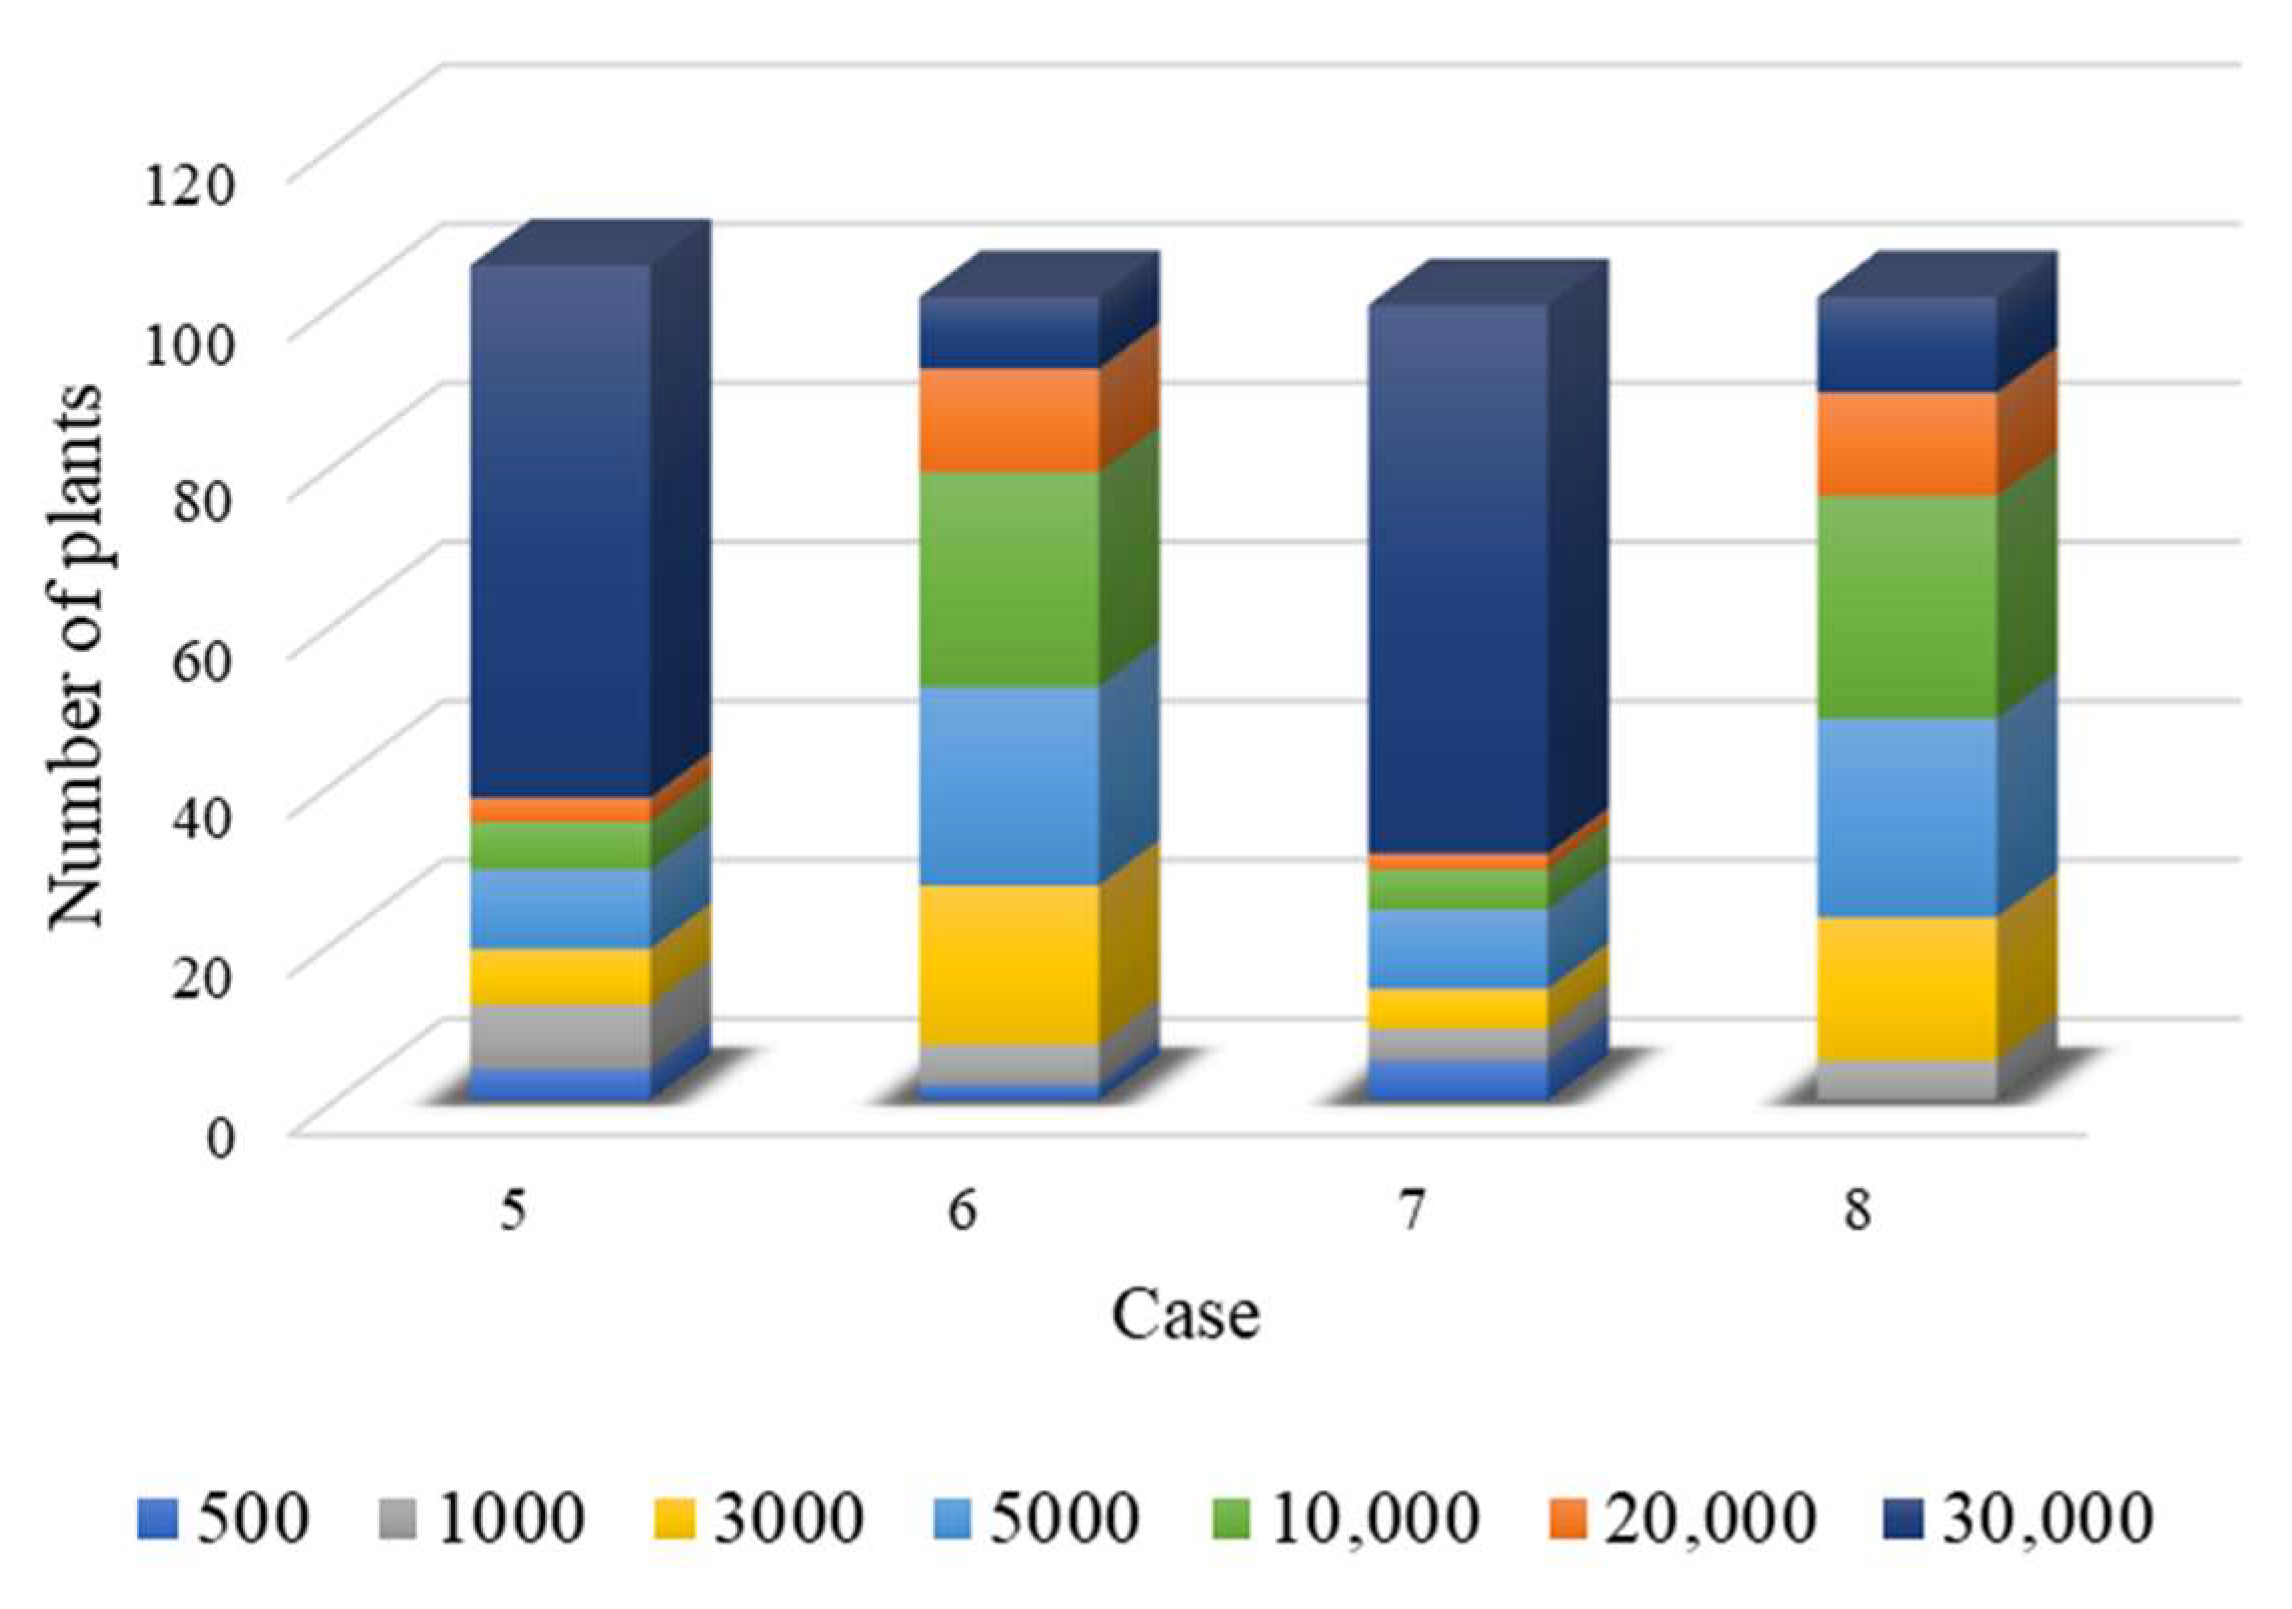
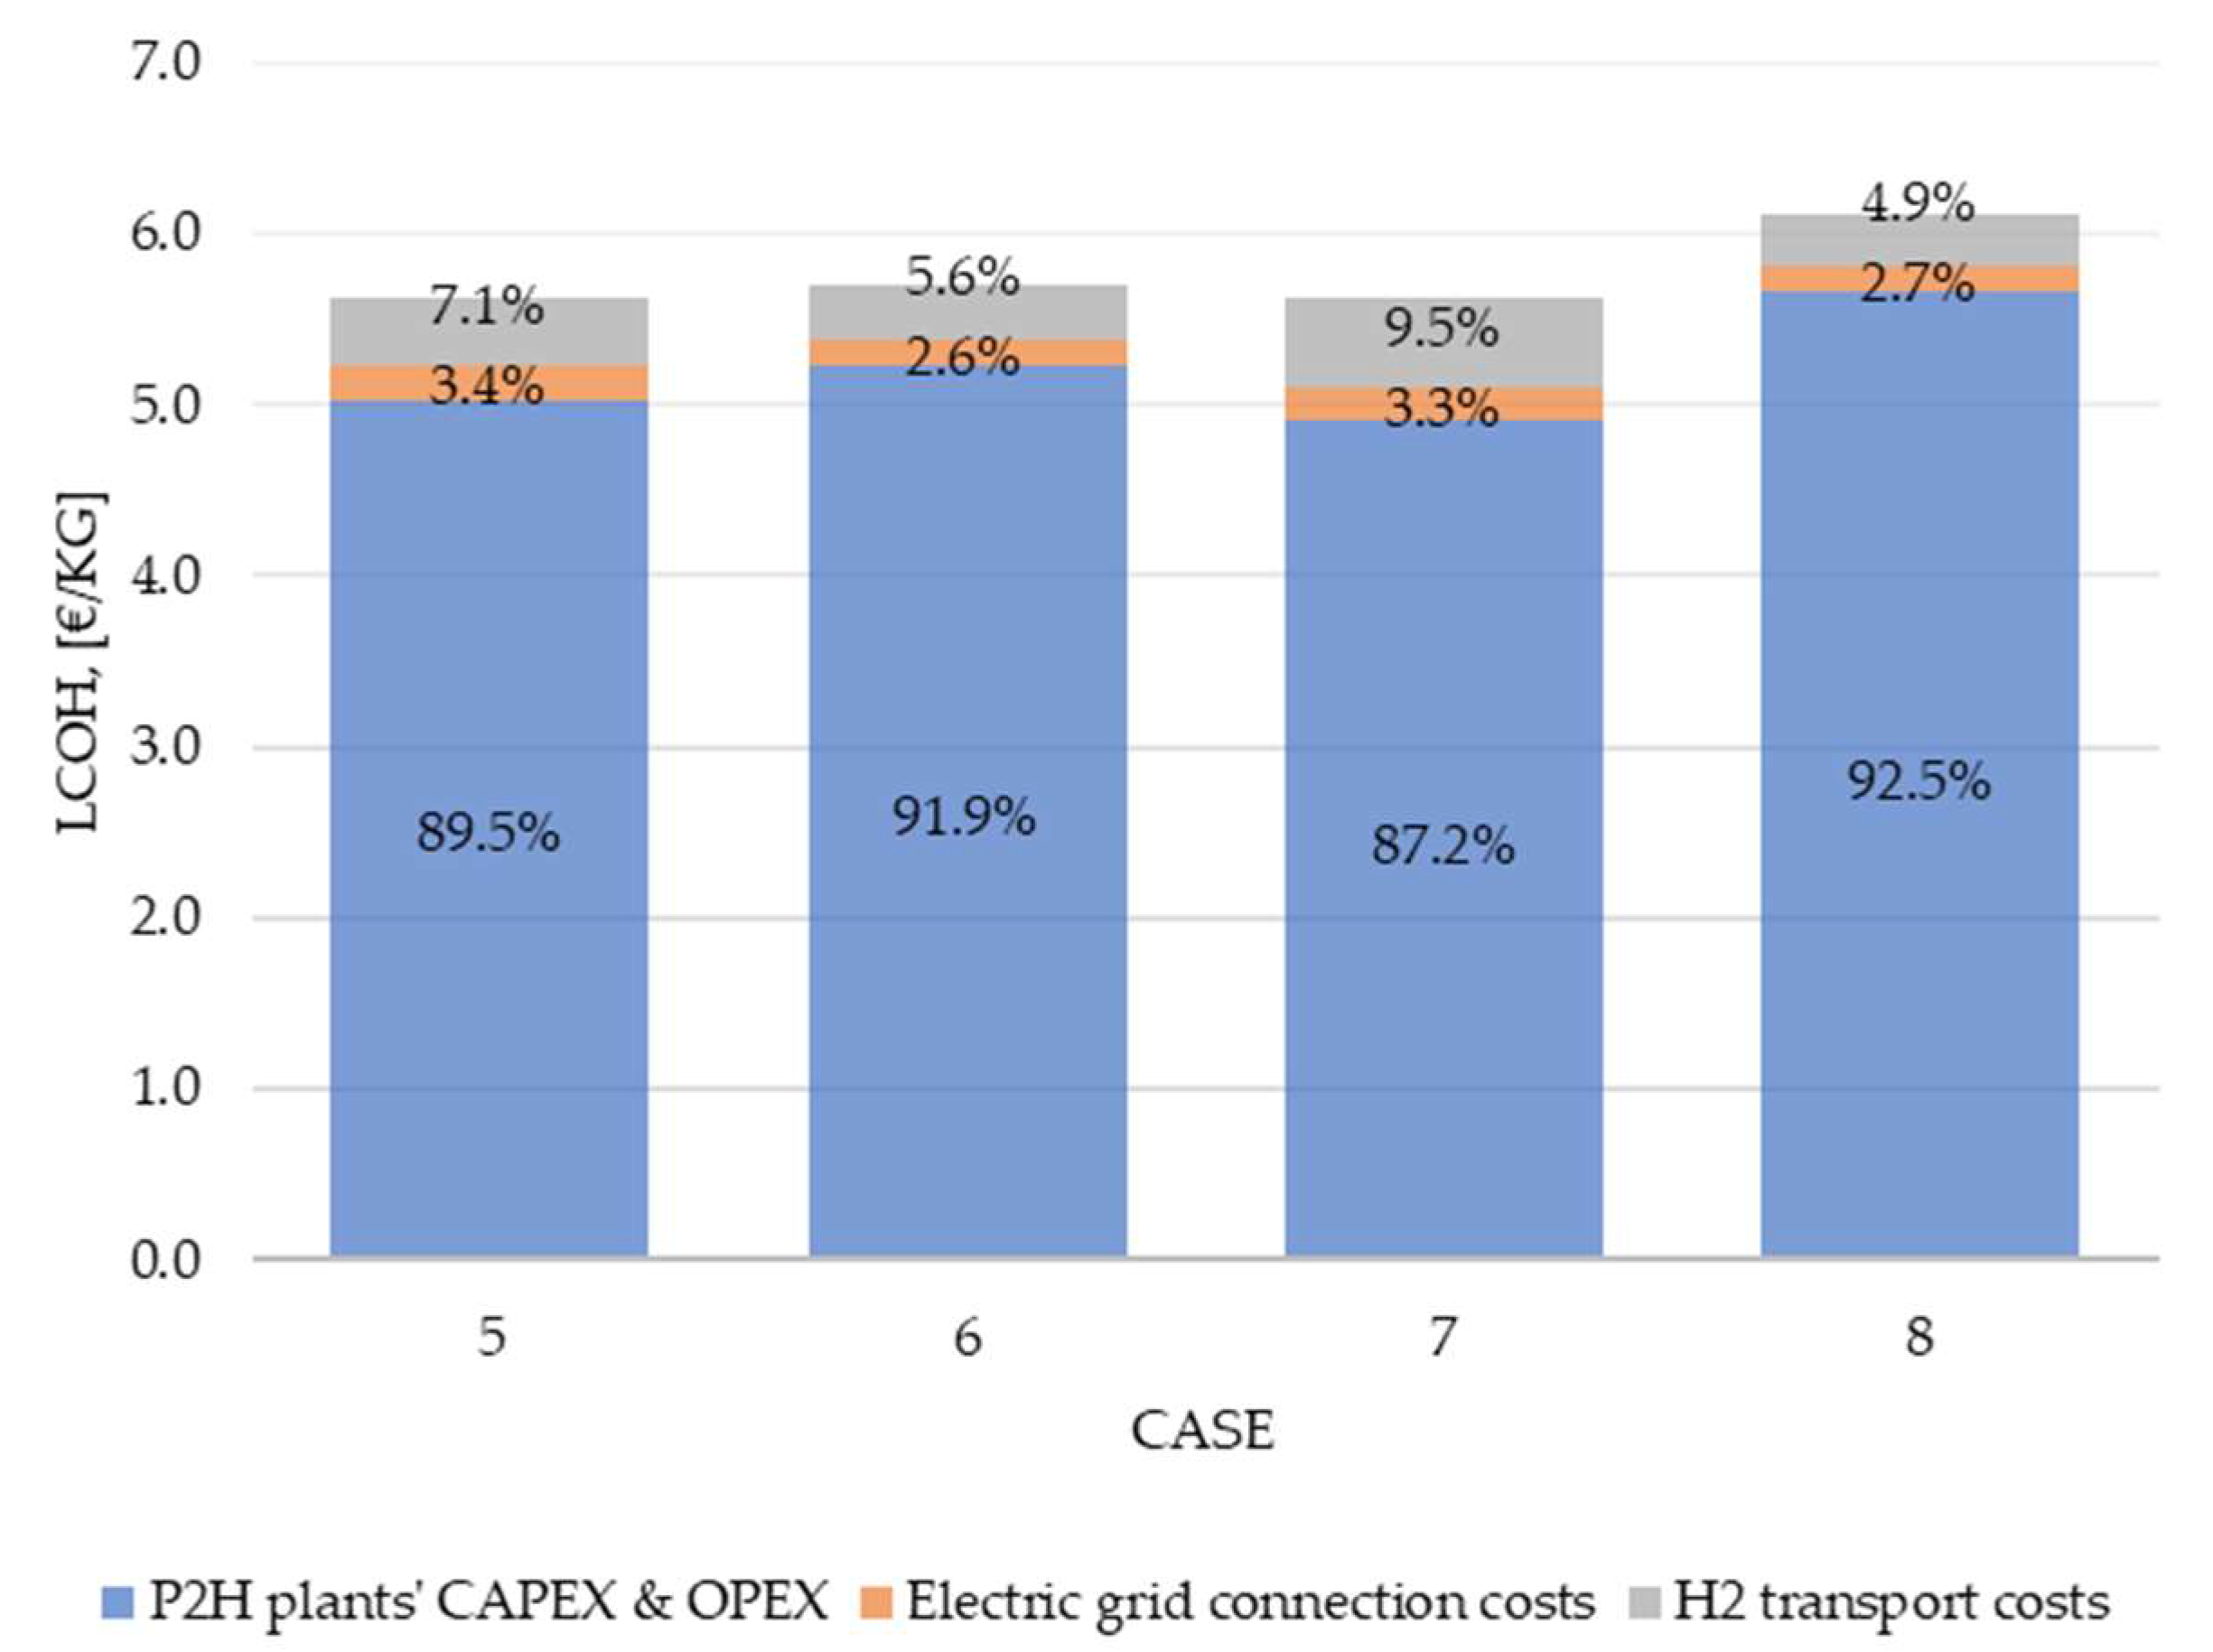
3.3. Scenario Analysis: 2050
- The granularity of the P2G plants’ availability (i.e., the set of available nominal power/capacity values in the scale production).

4. Discussion
5. Conclusions
- An LCOH in the range from 5 to 8 €/kg, i.e., 0.042 to 0.067 €/MJ, was calculated for the eight scenarios. Therefore, according to the present purchase costs without incentives or other supporting strategies, hydrogen mobility would be less convenient than a traditional one, resulting in a barrier to market uptake.
- Several plants must cover the entire hydrogen demand in all the investigated scenarios. While the plants’ design would be not so critical, authorization procedures have to be lightened, reducing the complexity and the time required to complete a project. Additionally, efforts should be taken to improve the public’s understanding of hydrogen, increasing social acceptance and avoiding phenomena such as NIMBYism that could stop projects and increase the expected costs.
- To increase the competitiveness of hydrogen mobility, efforts should be performed in R&D to reduce the cost of plants and improve efficiency. In the first case, standardized modules with a predefined size should be designed, and the plant configuration should be optimized to minimize investment costs. To date, this market is more characterized by customization that increases the total cost. In the second case, research should address increases in efficiency or the use of low-grade energy. New designs of traditional electrolysers, the use of different materials, or the direct exploitation of solar irradiation are some of the potential actions that can be taken.
- The possibility to use continuous values of P2H plants’ nominal capacity rather than a discrete set of values.
- While in the existing version, the geodesic distance is used to approximate the length of the path between two locations, the exact road distance will be implemented, increasing the accuracy of the results.
- The possibility for users to design their plant configuration, deriving expected CAPEX and OPEX.
Author Contributions
Funding
Institutional Review Board Statement
Informed Consent Statement
Data Availability Statement
Conflicts of Interest
Appendix A
Appendix A.1. Hydrogen Transport Cost
- cij is the transport cost between the jth consumer and the ith P2G plant.
- Di,j is the distance between the jth consumer and the ith P2G plant, in km.
| Source of cost | Value |
|---|---|
| CAPEX (truck + trailer) | 0.835 M€ (= 0.185 + 0.65) |
| O and M | 12% CAPEX truck + 2% CAPEX trailer |
| H2 conveyed by a truck | 300 kg |
| Fuel consumption | 34.5 km/L |
| Diesel cost | 1.4 €/L |
| Personnel cost | 3185 €/month |
| Daily operation | 8 h/day |
| WACC | 8% |
Appendix A.2. P2G Plant’s Electrical Connection Costs
- Pi is the P2G electrical power, kW.
- Dik is the geodetic distance between the P2G plant and the nearest medium/low-voltage electric cabinet.
- D’’ik is the geodetic distance between the P2G plant and the nearest high voltage transformation cabinet.
Appendix A.3. P2G Plant’s CAPEX and OPEX
- Water electrolysis section—hydrogen is produced in this section by electrolysers. For the calculation, the PEM technology was assumed to be based on its greater flexibility with respect to the alkaline technology, even its higher CAPEX.
- Compression section—hydrogen is compressed up to 250 barg from a suction pressure of up to 30 barg. Two compressors are considered in the simplified configuration to maximize the availability of the plant.
- Storage section—hydrogen is assumed to be stored in AISI 316L Type I storage vessels.
- Refilling—hydrogen is filled in the truck in this section.
- CAPEXEL is the CAPEX of the electrolysis section [€].
- CAPEXCOMP is the CAPEX of the compression section [€].
- CAPEXSTORAGE is the CAPEX of the storage section [€].
- CAPEXFILLING is the CAPEX of the filling section [€].
- OTHER includes nonequipment and civil work costs that are required for the realization of the plant [€]. Particularly, nonequipment costs include (i) engineering costs, (ii) distributed control system (DCS) and energy management unit (EMU) installation costs, and (iii) interconnection, commissioning, and start-up costs.
- OPEXEL includes the following source of costs: electricity, O and M, water, and stack replacement.
- OPEXCOMP includes electricity and O and M.
- OPEXSTORAGE includes O and M costs.
- OPEXFILLING includes electricity and O and M.
- OTHER includes the P2G plant’s general O and M costs.
| Source of Cost | Value |
|---|---|
| CAPEXEL | Pel < 700 kW: Pel ≥ 700 kW and Pel < 2000 kW: Pel ≥700 kW: where C0: 4000 €/kW; C0,1: 1000 €/kW; Pel,0: 100 kW; Pel,1: 700 kW; n = −0.37; a: 0.7 |
| CAPEXCOMP CAPEXFILLING-GASEOUS | A: 100 [€], B: 300 [€], a: 0.66; b: 0.66; c: 0.25; d: 0.25—COMP A: 500 [€], B: 300 [€], a: 0.66; b: 0.66; c: 0.25; d: 0.25—COMP Q is the nominal flowrate [kg/h]; Qref is the reference flowrate equal to 50 kg/h; pdisc is the discharge pressure [bar], pin is the inlet pressure [bar], and pref is the reference pressure equal to 50 barg and 200 barg; and inflation and depreciation from 2017 are taken into account. |
| CAPEXSTORAGE | 300 |
| Cother | |
| Electricity price | 75 €/MWh |
| OPEX | Electrolyser: 2%, 3%, or 4% of the CAPEX for, respectively, Pel < 1000 kW, 1000 ≤Pel < 5000, and Pel> 5000 kW Compressors, storage; filling stations: 2% of CAPEX |
| Electricity cost | 75 €/MWh |
Appendix A.4. Assumed Constraints
- Energy and mass conservation balances
- ○
- For each user/customer, the sum of the xij fractions must be 1;
- ○
- For each generator, the sum of x’ik must be lower than 1;
- ○
- The sum of hydrogen flows leaving each P2G plant must be lower than the plant capacity;
- ○
- The sum of the electrical power supply for each P2G plant must be lower than the plant capacity;
- ○
- The sum of hydrogen flows cannot be higher than the energy supplied (net of conversion efficiency coefficient).
- Market orientation/exploitation
- ○
- The P2G capacity nominal value belongs to a discrete set (to simulate a standardization of the plants for mass adoption/scaling economy).
- Distance and positioning limitations
- ○
- Each grid mesh centroid out of the considered territory was discarded as an eligible P2G position;
- ○
- As an option of the tool, the eligible P2G plant positions too far away from adequate (in terms of nominal voltage) electrical lines were neglected, owing to the hypothesis of relevant electrical connection costs;
- ○
- The case of hydrogen delivery by trucks was (for the sake of the completeness of the analysis) customized with the (optional) possibility to limit the trucks’ autonomy (i.e., routing distance).
Appendix A.5. Other Assumptions
- Meshing resolution—40 km2 mesh was adopted for the case study;
- P2G plant capacity sets—to estimate the importance of developing high-capacity electrolysers in the future (i.e., reduction of highest values of the set);
- Variable percentage of the aggregated fuel demand replaced with hydrogen equivalent;
- Maximum truck autonomy to reach users from P2G plants.
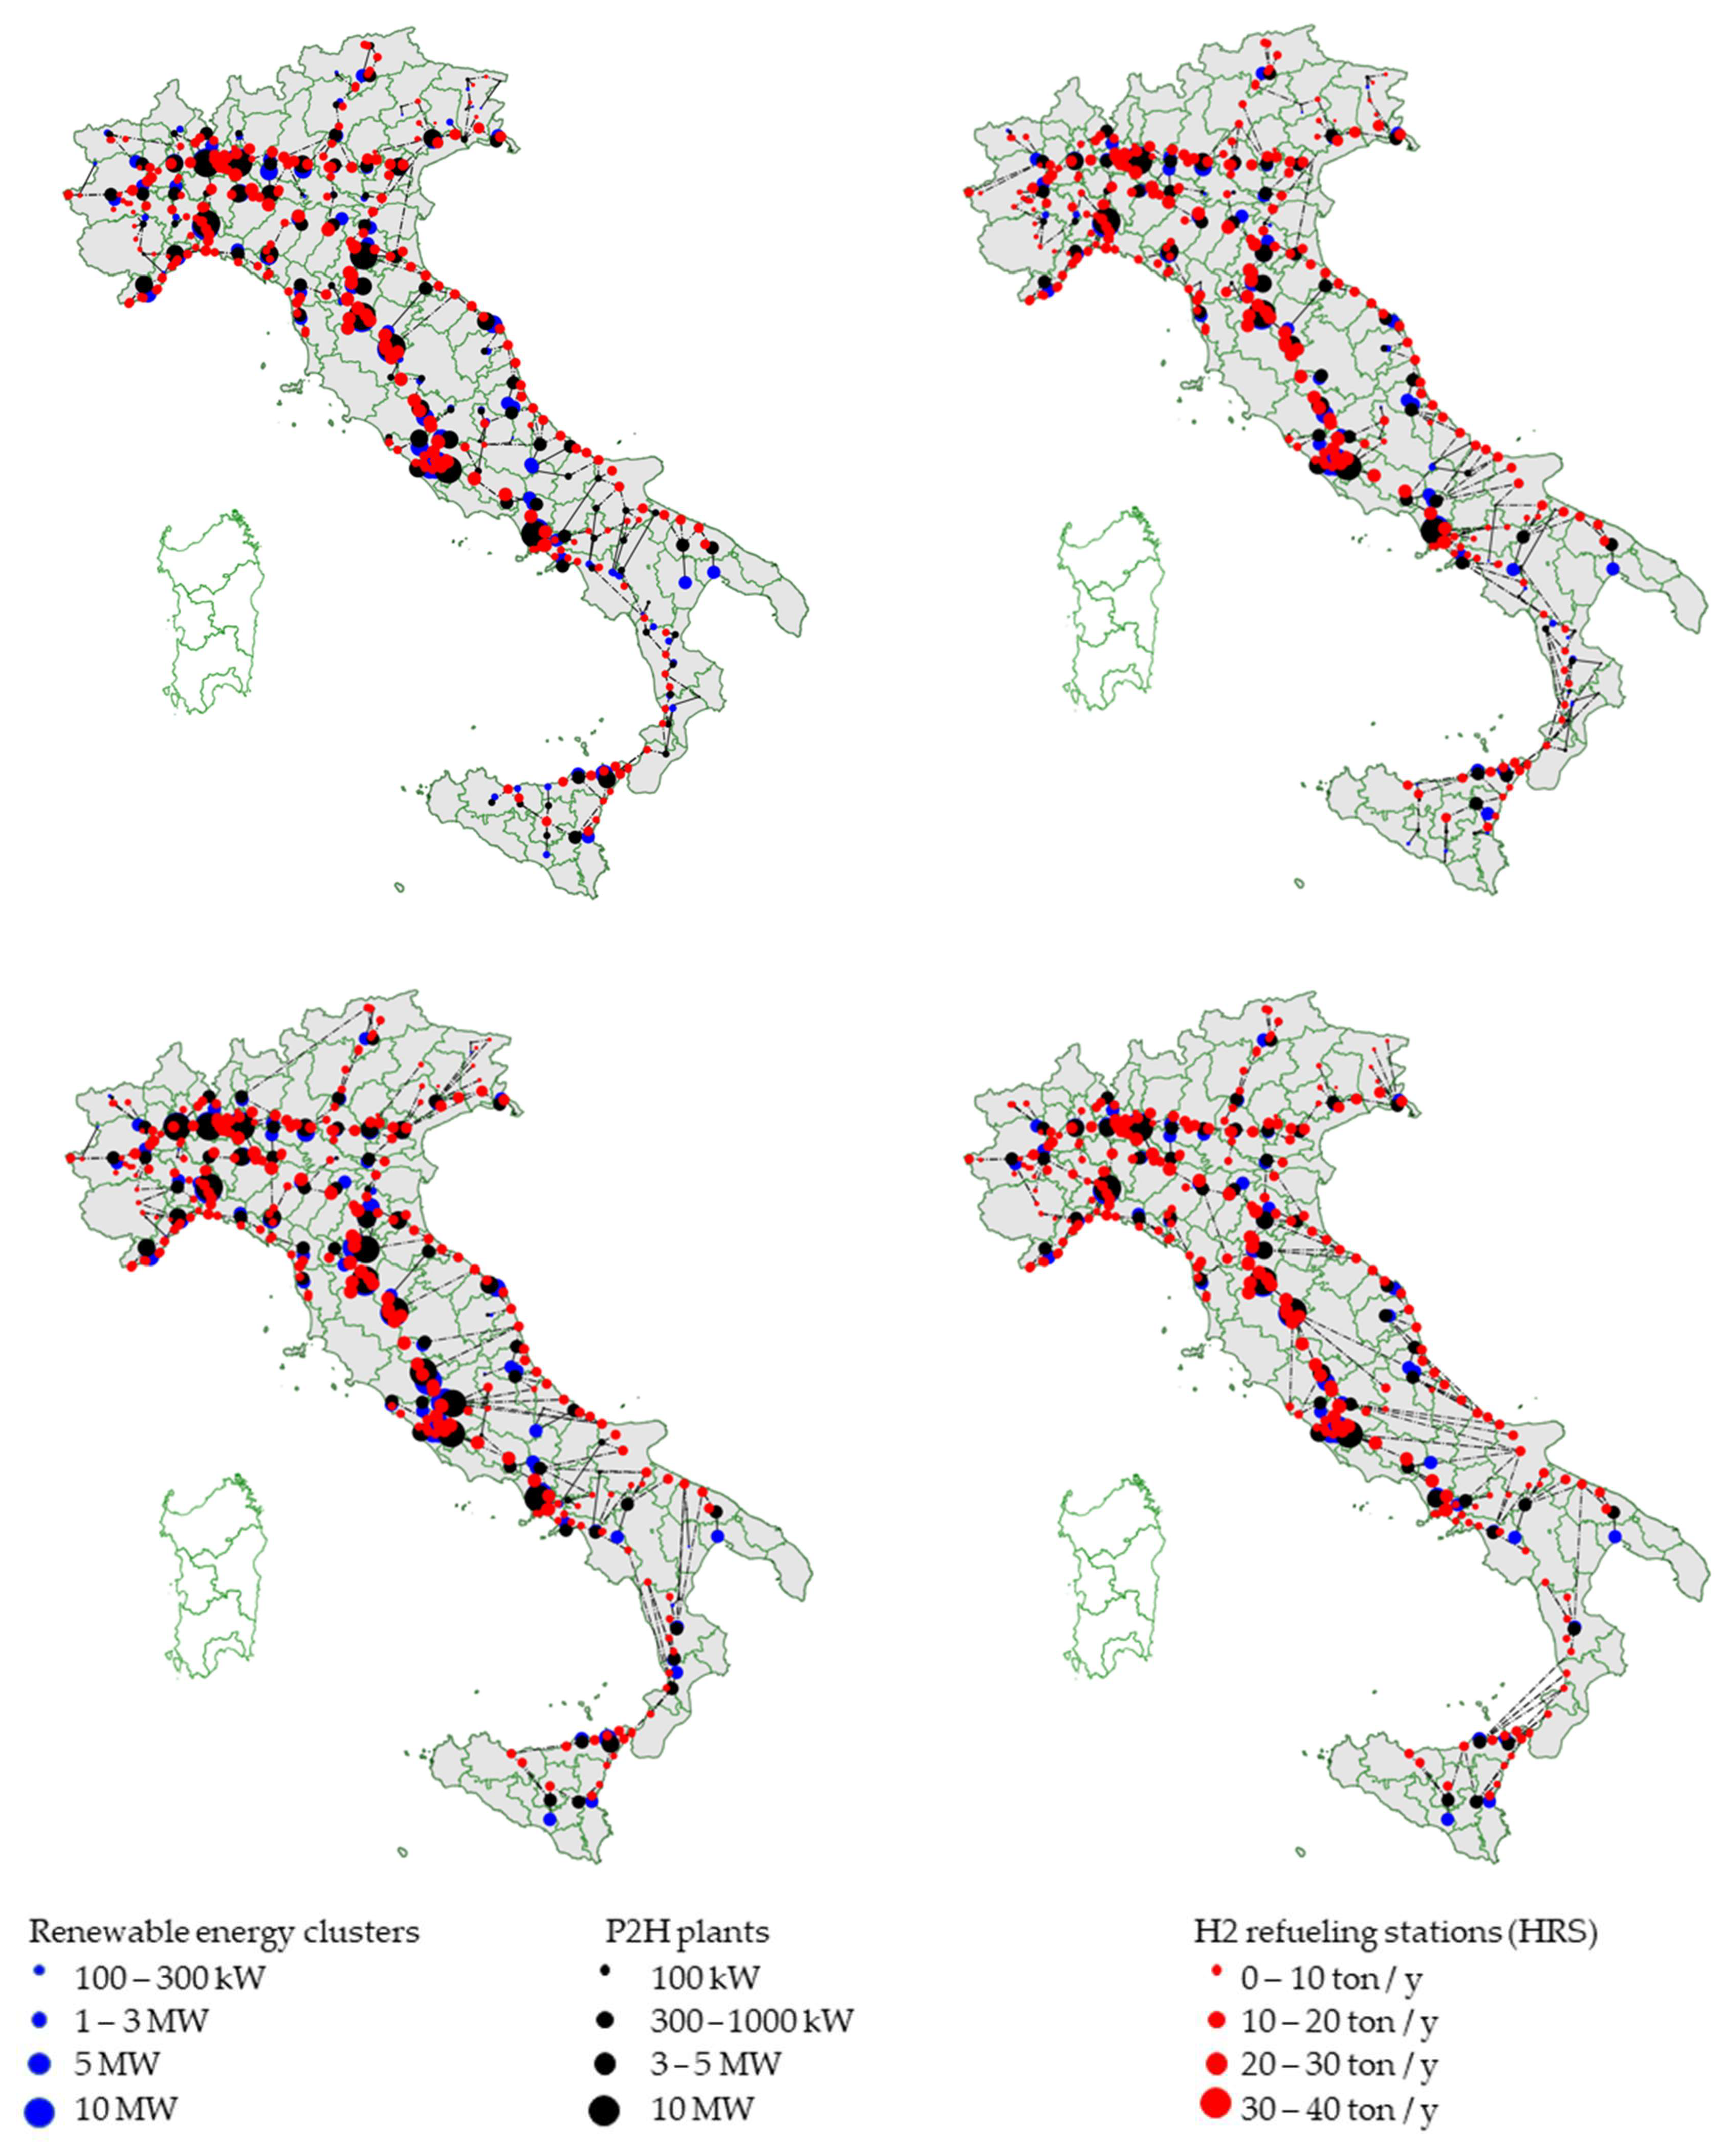
- Renewable energy generation—the overall PV production at NUTS-3 granularity (provincia in Italian). This is to exploit the current scenarios predicting continuous increments of RES plant penetration that can supply (along and beside the participation to the energy market) the conversion systems with a surplus (e.g., net of the possible consumption by priority loads) in production;
- On the demand side—the georeferenced information (position, fuel demand, association to specific motorways) of the refuelling devices on the Italian motorway network.
References
- European Commission. Alternative Fuels Infrastructure Regulation; European Commission: Brussels, Belgium, 2022. [Google Scholar]
- Hydrogen Europe. Alternative Fuels Infrastructure as the Key to Unlock the Potential of Hydrogen-Fuelled Mobility; Hydrogen Europe: Brussels, Belgium, 2021. [Google Scholar]
- H2Station.org. Available online: https://www.h2stations.org/ (accessed on 1 November 2022).
- Casamirra, M.; Castiglia, F.; Giardina, M.; Lombardo, C. Safety studies of a hydrogen refuelling station: Determination of the occurrence frequency of the accidental scenarios. Int. J. Hydrog. Energy 2009, 34, 5846–5854. [Google Scholar] [CrossRef]
- Zhang, C.; Cao, X.; Bujlo, P.; Chen, B.; Zhang, X.; Sheng, X.; Liang, C. Review on the safety analysis and protection strategies of fast filling hydrogen storage system for fuel cell vehicle application. J. Energy Storage 2022, 45, 103451. [Google Scholar] [CrossRef]
- Matthijsen, A.; Kooi, E. Safety distances for hydrogen filling stations. Fuel Cell Bull. 2006, 2006, 12–16. [Google Scholar] [CrossRef]
- Kwon, D.; Choi, S.; Yu, C. Improved safety by cross analyzing quantitative risk assessment of hydrogen refueling stations. Int. J. Hydrog. Energy 2022, 47, 10788–10798. [Google Scholar] [CrossRef]
- Sun, K.; Pan, X.; Li, Z.; Ma, J. Risk analysis on mobile hydrogen refueling stations in Shanghai. Int. J. Hydrog. Energy 2014, 39, 20411–20419. [Google Scholar] [CrossRef]
- Ministero dell’Interno. Decreto 23 Ottobre 2018: Regola Tecnica di Prevenzione Incendi per la Progettazione, Costruzione ed Esercizio Degli Impianti di Distribuzione di Idrogeno per Autotrazione; Ministero dell’Interno: Roma, Italy, 2018. [Google Scholar]
- ISO/TS 19880-1:2016; Gaseous Hydrogen—Fuelling Stations—Part 1: General Requirements. ISO: Geneva, Switzerland, 2016.
- Overview Hydrogen Refuelling for Heavy Duty Vehicles. Available online: https://h2-mobility.de/wp-content/uploads/sites/2/2021/08/H2-MOBILITY_Overview-Hydrogen-Refuelling-For-Heavy-Duty-Vehicles_2021-08-10.pdf (accessed on 9 November 2022).
- Simunovic, J.; Pivac, I.; Barbir, F. Techno-economic assessment of hydrogen refueling station: A case study in Croatia. Int. J. Hydrog. Energy 2022, 47, 24155–24168. [Google Scholar] [CrossRef]
- Barhoumi, E.; Okonkwo, P.; Farhani, S.; Belgacem, I.; Zghaibeh, M.; Mansir, I.; Bacha, F. Techno-economic analysis of photovoltaic-hydrogen refueling station case study: A transport company Tunis-Tunisia. Int. J. Hydrog. Energy 2022, 47, 24523–24532. [Google Scholar] [CrossRef]
- Micena, R.; Llerena-Pizarro, O.; De Souza, T.; Silvera, J. Solar-powered Hydrogen Refueling Stations: A techno-economic analysis. Int. J. Hydrog. Energy 2020, 45, 2308–2318. [Google Scholar] [CrossRef]
- Minutillo, M.; Perna, A.; Forcina, A.; Di Micco, S.; Jannelli, E. Analyzing the levelized cost of hydrogen in refueling stations with on-site hydrogen production via water electrolysis in the Italian scenario. Int. J. Hydrog. Energy 2021, 46, 13667–13677. [Google Scholar] [CrossRef]
- Dagdougui, H. Models, methods and approaches for the planning and design of the future hydrogen supply chain. Int. J. Hydrog. Energy 2012, 37, 5318–5327. [Google Scholar] [CrossRef]
- Grassi, S. Integrated spatial optimization model for renewable energy planning. In Proceedings of the 2nd AGILE PhD School 2013, Frauenwörth, Germany, 30 September–2 October 2013. [Google Scholar]
- Resch, B.; Sagl, G.; Törnros, T.; Bachmaier, A.; Eggers, J.; Herkel, S.; Narmsara, S.; Gündra, H. GIS-Based Planning and Modeling for Renewable Energy: Challenges and Future Research Avenues. ISPRS Int. J. Geo-Inf. 2014, 3, 662–692. [Google Scholar] [CrossRef]
- Valdes, J.; Wöllmann, S.; Weber, A.; Klaus, G.; Sigl, C.; Prem, M.; Bauer, R.; Zink, R. A framework for regional smart energy planning using volunteered geographic information. ADGEO 2020, 54, 179–193. [Google Scholar] [CrossRef]
- Kaijuka, E. GIS and rural electricity planning in Uganda. J. Clean. Prod. 2007, 15, 2013–2217. [Google Scholar] [CrossRef]
- Alhamwi, A.; Medjroubi, W.; Vogt, T.; Agert, C. GIS-based urban energy systems models and tools: Introducing a model for the optimisation of flexibilisation technologies in urban areas. Appl. Energy 2017, 191, 1–9. [Google Scholar] [CrossRef]
- De Meyer, A.; Cattrysse, D.; Orshoven, J. A generic mathematical model to optimise strategic and tactical decisions in biomass-based supply chains (OPTIMASS). Eur. J. Oper. Res. 2015, 245, 247–264. [Google Scholar] [CrossRef]
- Vukašinovic, V.; Gordic, D. Optimization and GIS-based combined approach for the determination of the most cost-effective investments in biomass sector. Appl. Energy 2016, 178, 250–259. [Google Scholar] [CrossRef]
- Alhamwi, A.; Medjroubi, W.; Vogt, T.; Agert, C. Development of a GIS-based platform for the allocation and optimisation of distributed storage in urban energy systems. Appl. Energy 2019, 251, 113360. [Google Scholar] [CrossRef]
- Ascione, F.; Bianco, N.; Mauro, G.; Napolitano, D. Knowledge and energy retrofitting of neighborhoods and districts. A comprehensive approach coupling geographical information systems, building simulations and optimization engines. Energy Convers. Manag. 2021, 230, 113786. [Google Scholar] [CrossRef]
- Chicherin, S.; Volkova, A.; Latosov, E. GIS based optimisation for district heating network planning. In Proceedings of the 16th International Symposium on District Heating and Cooling, DHC 2019, Hamburg, Germany, 9–12 September 2018. [Google Scholar]
- Schmidt, J.; Stange, P. Optimization of district heating network design. Energy Rep. 2021, 7, 97–104. [Google Scholar] [CrossRef]
- Cucchiaro, M.; Santin, M.; Chinese, D. Promoting industrial waste heat exploitation in district heating systems through a GIS-based planning approach. In Proceedings of the XXIV Summer School “Francesco Turco”—Industrial Systems Engineering, Brescia, Italy, 11–13 September 2020. [Google Scholar]
- Diaz, H.; Guedes Soares, C. An integrated GIS approach for site selection of floating offshore wind farms in the Atlantic continental European coastline. Renew. Sustain. Energy Rev. 2020, 134, 110328. [Google Scholar] [CrossRef]
- Garcia Marrero, L.; Ruiz, J. Web-based tool for the decision making in photovoltaic/wind farms planning with multiple objectives. Renew. Energ. 2021, 179, 2224–2234. [Google Scholar] [CrossRef]
- Cui, L.; Xu, Y.; Xu, L.; Huang, G. Wind Farm Location Special Optimization Based on Grid GIS and Choquet Fuzzy Integral Method in Dalian City, China. Energies 2021, 14, 2454. [Google Scholar] [CrossRef]
- Alla, S.; Bianco, V.; Tagliafico, L.; Scarpa, F. An innovative approach to local solar energy planning in Riva Trigoso, Italy. JOBE 2020, 27, 100968. [Google Scholar]
- Kucuksari, S.; Khaleghi, A.; Hamidi, M.; Zhang, Y.; Szidarovszky, F.; Bayraksan, G.; Son, Y. An Integrated GIS, optimization and simulation framework for optimal PV size and location in campus area environments. Appl. Energy 2014, 113, 1601–1613. [Google Scholar] [CrossRef]
- Ball, M.; Wietschel, M.; Rentz, O. Integration of hydrogen economy into the German energy system: An optimising modelling approach. Int. J. Hydrog. Energy 2007, 32, 1355–1368. [Google Scholar] [CrossRef]
- Strachan, N.; Balta-Ozkan, N.; Joffe, D.; McGeevor, K.; Hughes, N. Soft-linking energy systems and GIS models to investigate spatial hydrogen infrastructure development in a low-carbon UK energy system. Int. J. Hydrog. Energy 2009, 2, 642–657. [Google Scholar] [CrossRef]
- Samsatli, S.; Samsatli, N. The role of renewable hydrogen and inter-seasonal storage in decarbonising heat. Comprehensive optimisation of future renewable energy value chains. Appl. Energy 2019, 233–234, 854–893. [Google Scholar] [CrossRef]
- Zhou, J.; Wu, Y.; Tao, Y.; Gao, J.; Zhong, Z.; Xu, C. Geographic information big data-driven two stage optimization model for location of decision of hydrogen refueling stations: An empirical study in China. Energy 2021, 225, 120330. [Google Scholar] [CrossRef]
- Lin, R.; Ye, Z.; Guo, Z.; Wu, B. Hydrogen station location optimization based on multiple data sources. Int. J. Hydrog. Energy 2020, 45, 10270–10279. [Google Scholar] [CrossRef]
- Nicholas, M.; Handy, S.; Sperling, D. Using Geographic Information Systems to Evaluate Siting and Networks of Hydrogen Stations. TRR 2004, 1880, 126–134. [Google Scholar] [CrossRef]
- Johnson, N.; Ogden, J. A spatially-explicit optimization model for long-term hydrogen pipeline planning. Int. J. Hydrog. Energy 2012, 37, 5421–5433. [Google Scholar] [CrossRef]
- Li, L.; Manier, H.; Manier, M. Integrated optimization model for hydrogen supply chain network design and hydrogen fueling station planning. Comput. Chem. Eng. 2020, 134, 106683. [Google Scholar] [CrossRef]
- Baufumé, S.; Gruger, F.; Grube, T.; Krieg, D.; Linsenn, J.; Weber, M.; Hake, J.F.; Stolten, D. GIS-based scenario calculations for a nationwide German hydrogen pipeline infrastructure. Int. J. Hydrog. Energy 2013, 38, 3813–3829. [Google Scholar] [CrossRef]
- Soha, T.; Hartmann, B. Complex power-to-gas plant site selection by multi-criteria decision-making and GIS. Energy Convers. Manag. X 2022, 13, 100168. [Google Scholar] [CrossRef]
- Ali, F.; Bennui, A.; Chowdhury, S.; Techato, K. Suitable Site Selection for Solar-Based Green Hydrogen in Southern Thailand Using GIS-MCDM Approach. Sustainability 2022, 14, 6597. [Google Scholar] [CrossRef]
- Yee Mah, A.; Ho, W.; Hassim, M.; Hashim, H.; Muis, Z.; Ling, G.; Ho, C. Spatial optimization of photovoltaic based hydrogen electricity supply chain through an integrated geographical information system and mathematical modeling approach. Clean Technol. Environ. Policy 2022, 24, 393–412. [Google Scholar] [CrossRef]
- SuperP2G. Available online: https://superp2g.eu/ (accessed on 28 September 2022).
- Agadaga, G.O.; Akpan, N.P. Transshipment Problem and Its Variants: A Review. Math. Theory Model 2017, 7, 19–32. [Google Scholar]
- Green, N.P.; Finch, S.; Wiggins, J. The ‘State of the Art’ in Geographical Information Systems. Area 1985, 17, 295–301. [Google Scholar]
- PostgreSQL. Available online: https://www.postgresql.org/ (accessed on 2 January 2023).
- PostGIS. Available online: http://postgis.net/ (accessed on 2 January 2023).
- Zielstra, D.; Hochmair, H.H. Using free and proprietary data to compare shortest-path lengths for effective pedestrian routing in street networks. Transp. Res. Rec. J. Transp. Res. Board 2012, 2299, 41–47. [Google Scholar] [CrossRef]
- Debnath, P. A QGIS-Based Road Network Analysis for Sustainable Road Network Infrastructure: An Application to the Cachar District in Assam, India. Infrastructures 2022, 7, 114. [Google Scholar] [CrossRef]
- Mahabir, R.; Stefanidis, A.; Croitoru, A.; Crooks, A.T.; Agouris, P. Authoritative and Volunteered Geographical Information in a Developing Country: A Comparative Case Study of Road Datasets in Nairobi, Kenya. ISPRS Int. J. Geo-Inf. 2017, 6, 24. [Google Scholar] [CrossRef]
- Bynum, M.L.; Hackebeil, G.A.; Hart, W.E.; Laird, C.D.; Nicholson, B.L.; Siirola, J.D.; Watson, J.P.; Woodruff, D.L. Pyomo—Optimization Modeling in Python, 3rd ed.; Springer: Berlin/Heidelberg, Germany, 2021; Volume 67. [Google Scholar]
- William, H.E.; Watson, J.P.; Woodruff, D.L. Pyomo: Modeling and solving mathematical programs in Python. Math. Program. Comput. 2011, 3, 219–260. [Google Scholar]
- AISCAT. Informazioni; AISCAT: Roma, Italy, 2022. [Google Scholar]
- Report Autostrada Rete in Concessione—2001–2020 Edizione 2021. Available online: https://www.figisc.it/blog/2021/09/15/report-autostrada-rete-in-concessione-2001-2020-edizione-2021/ (accessed on 26 September 2022).
- European Commission. State of the Art on Alternative Fuels Transport Systems in the European Union; European Commission: Brussels, Belgium, 2020. [Google Scholar]
- Transport Demand and CO2 Emission to 2050. Available online: https://www.oecd-ilibrary.org/sites/9789282108000-5-en/index.html?itemId=/content/component/9789282108000-5-en (accessed on 3 October 2022).
- Making Cars 50% More Fuel Efficient by 2050 Worldwide. Available online: https://www.globalfueleconomy.org/media/46127/50by50-report-2009-lr.pdf (accessed on 3 October 2022).
- Clean Hydrogen Partnership. FCH 2 JU—MAWP Key Performance Indicators (KPIs). Available online: https://www.clean-hydrogen.europa.eu/knowledge-management/sria-key-performance-indicators-kpis/fch-2-ju-mawp-key-performance-indicators-kpis_en (accessed on 12 November 2022).
- Ministero dello Sviluppo Economico; Ministero dell’Ambiente e della Tutela del Territorio e del Mare; Ministero delle Infrastrutture e dei Trasporti. Piano Nazionale Integrato per L’Energia E Il Clima; Ministero dello Sviluppo Economico: Roma, Italy, 2019. [Google Scholar]
- Il PNIEC per la Transizione Ecologica. Available online: https://www.camera.it/leg17/561?appro=la-proposta-italiana-di-piano-nazionale-per-l-energia-e-il-clima (accessed on 11 January 2023).
- Caponi, R.; Bocci, E.; Del Zotto, L. Techno-Economic Model for Scaling Up of Hydrogen Refueling Stations. Energies 2022, 15, 7518. [Google Scholar] [CrossRef]
- UNRAE. Analisi del Mercato Autoveicoli in Italia. XX Edizione. Available online: https://unrae.it/files/Book%20UNRAE%202019_5e81efee08ac9.pdf (accessed on 17 October 2022).
- Saccani, C.; Pellegrini, M.; Guzzini, A. Analysis of the Existing Barriers for the Market Development of Power to Hydrogen (P2H) in Italy. Energies 2020, 13, 4835. [Google Scholar] [CrossRef]
- Reub, M.; Dimos, P.; Leon, A.; Grube, T.; Robinius, M.; Stolten, D. Hydrogen Road Transport Analysis in the Energy System: A Case Study for Germany through 2050. Energies 2021, 14, 3166. [Google Scholar]
- ARERA. Delibera ARG/elt 99/08. Available online: https://www.arera.it/it/docs/08/099-08arg.htm (accessed on 28 October 2021).
- Sergi, F.; Guzzini, A.; Brunaccini, G.; Aloisio, D.; Bianchini, A.; Pellegrini, M.; Saccani, C.; Tumminia, G.; Randazzo, N.; Ferraro, M.; et al. Data Collection and Management: Product Specifications. Available online: https://superp2g.wvgw-kunden.de/wp-content/uploads/2022/09/SUPERP2G_ITALY_Internal_Report_M1.pdf (accessed on 11 July 2022).


| Case | P2H Nominal Power [MW] | Number of Plants [-] | LCOH [€/kg] |
|---|---|---|---|
| 1 | 293.6 | 105 | 7.46 |
| 2 | 208.0 | 83 | 7.98 |
| 3 | 295.7 | 81 | 7.02 |
| 4 | 205.0 | 52 | 6.93 |
| Case | P2H Nominal Power [MW] | Number of Plants [-] | LCOH [€/kg] |
|---|---|---|---|
| 5 | 2277.0 | 111 | 5.62 |
| 6 | 991.0 | 101 | 5.69 |
| 7 | 2231.5 | 100 | 5.63 |
| 8 | 1084.0 | 101 | 6.12 |
Disclaimer/Publisher’s Note: The statements, opinions and data contained in all publications are solely those of the individual author(s) and contributor(s) and not of MDPI and/or the editor(s). MDPI and/or the editor(s) disclaim responsibility for any injury to people or property resulting from any ideas, methods, instructions or products referred to in the content. |
© 2023 by the authors. Licensee MDPI, Basel, Switzerland. This article is an open access article distributed under the terms and conditions of the Creative Commons Attribution (CC BY) license (https://creativecommons.org/licenses/by/4.0/).
Share and Cite
Guzzini, A.; Brunaccini, G.; Aloisio, D.; Pellegrini, M.; Saccani, C.; Sergi, F. A New Geographic Information System (GIS) Tool for Hydrogen Value Chain Planning Optimization: Application to Italian Highways. Sustainability 2023, 15, 2080. https://doi.org/10.3390/su15032080
Guzzini A, Brunaccini G, Aloisio D, Pellegrini M, Saccani C, Sergi F. A New Geographic Information System (GIS) Tool for Hydrogen Value Chain Planning Optimization: Application to Italian Highways. Sustainability. 2023; 15(3):2080. https://doi.org/10.3390/su15032080
Chicago/Turabian StyleGuzzini, Alessandro, Giovanni Brunaccini, Davide Aloisio, Marco Pellegrini, Cesare Saccani, and Francesco Sergi. 2023. "A New Geographic Information System (GIS) Tool for Hydrogen Value Chain Planning Optimization: Application to Italian Highways" Sustainability 15, no. 3: 2080. https://doi.org/10.3390/su15032080
APA StyleGuzzini, A., Brunaccini, G., Aloisio, D., Pellegrini, M., Saccani, C., & Sergi, F. (2023). A New Geographic Information System (GIS) Tool for Hydrogen Value Chain Planning Optimization: Application to Italian Highways. Sustainability, 15(3), 2080. https://doi.org/10.3390/su15032080