Article

Thermodynamics Analysis of a Membrane Distillation Crystallization Ion Recovery System for Hydroponic Greenhouses Assisted with Renewable Energy

Division of Sustainable Development, College of Science and Engineering, Hamad Bin Khalifa University, Qatar Foundation, Doha P.O. Box 34110, Qatar
*
Author to whom correspondence should be addressed.
Sustainability 2023, 15(3), 1876; https://doi.org/10.3390/su15031876
Submission received: 23 November 2022 / Revised: 24 December 2022 / Accepted: 30 December 2022 / Published: 18 January 2023

Abstract

:
Sustaining agricultural demands is a typical problem, particularly in locations afflicted by the scarcity of fresh water, poor farming soil, and hot weather. The main goal of this study is to perform a thermodynamic analysis of an integrated multigeneration system containing a direct contact membrane distillation crystallization system that recovers beneficial hydroponic farming nutrients from seawater using renewable energy resources. A parametric study is carried out to determine the impacts of various factors on the system, such as changing the rate of mass flow rate, recovery ratio, and salinity. This study proposes a novel sustainable multigeneration system for seawater desalination and ions recovery using the direct contact membrane distillation crystallization system to provide the hydroponic solution and greenhouse ventilation using the dual evaporator vapor compression refrigeration system. With overall exergy efficiency and energy efficiency of 41.40%, and 39.80%, respectively, the system requires about 1182.69 kW and 5314.6 kW of electrical and thermal power in total, respectively, to desalinate 5 kg/s of seawater and recover 170 mg/s of Sulfate (SO4), 81.28 mg/s of Magnesium (Mg), 25.48 mg/s of Calcium (Ca), and 24.16 mg/s of Potassium (K), yielding about 4.4 kg/s of a hydroponic solution, and ventilating 25 greenhouses with a volume of 600 m3 of single greenhouse.

1. Introduction

Providing agricultural needs is a typical problem, particularly in locations suffering from the scarcity of fresh water, poor farming soil, and hot weather. Human activities degrade available fresh water supplies, which are depleted due to insufficient precipitation caused by climate change. Furthermore, because fossil fuels are depleting at an increasing rate, the use of alternative energy sources should be increased to ensure a more sustainable future. For instance, sustainable and green energy sources are a good alternative to run heat and electrical engines instead of emission production sources. Therefore, it is important to encourage the generation of power from renewable resources and electrification of the transportation sector to fulfill a number of environmental sustainability goals [1,2]. More researchers are attempting to meet the needs of organisms, such as suitable living conditions, energy, medication, food, and fresh water. For instance, Abedrabboh et al. [3] designed an integrated system that depends on renewable sources, such as solar irradiation, ambient air, and geothermal cooling, to provide different services for agricultural greenhouses, such as electricity, space cooling, air conditioning, and water irrigation. Méndez et al. [4] designed another integrated system based on wind turbines and a solar chimney to produce fresh water and manage desalination brine.
Developing the agricultural sector is crucial for enhancing nutrition and food security [5]. A key metric for assuring national food security, preserving farmers’ livelihoods, and promoting sustainable agricultural growth is agricultural production efficiency [6,7,8]. In order to maintain food security and nourishment for everyone, now and in the future, sustainable agricultural development helps to improve resource efficiency, build resilience, and secure social equity and responsibility of agriculture and food systems [5]. Agricultural development is essential to food security in several ways, including by promoting food accessibility, availability, and stability, and by promoting food use [9]. To achieve the United Nations (UN) Sustainable Development Goal (SDG) 2, ending hunger by 2030, agriculture is essential to protect the region’s food supply [10]. In addition, SDG 2—zero hunger and other SDGs are supported by agriculture, which is essential for food security [11]. The agricultural industry, as well as food processing and production, is intimately related to food and water security [12]. It is assumed that management, legislation, and technical improvements will continue to increase the effectiveness of irrigation water utilization to project the water needs for agriculture and irrigation [12].
Different issues, such as bad weather and highly salinized soil, can be resolved with hydroponic gardening. In addition, hydroponic farming uses 90% less water than soil farming and enables farms to be established in areas where the weather and soil are adverse to conventional food production. The hydroponics solution should contain the main nutrients that help plants stay productive and healthy and increase crop quality, such as magnesium (Mg), potassium (K), and calcium (Ca), in order to provide a suitable farming condition for the plants for growing up. Since 3.3% of the sea and ocean water are dissolved salts, recovering these ions in a friendly and sustainable environmental way is essential [13]. According to Yadav et al. [14], desalination brine residue generates useful ions for agricultural purposes. Different ions, including sulfate (SO4), magnesium (Mg), calcium (Ca), and potassium (K), can be recovered from saltwater and used as helpful fertilizers for plants, according to Loganathan et al. [13]. Several minerals are produced during the saltwater extraction process and end up in the drained brine. The cost of producing water will go down, as well as the environmental issues associated with brine disposal, if these minerals can be recovered at a reasonable price.
The need for fresh water is rising, and the use of fossil fuels is not sustainable, which is increasing interest in using renewable energy for desalination processes [15]. There are different types of saltwater desalination technologies, such as reverse osmosis (RO), freezing desalination (FD), and membrane distillation (MD) [16]. The RO system is a water desalination process that uses pressure to force a solvent through a porous membrane in the opposite direction of natural osmosis without phase change, as mentioned in [16,17]. According to Ahmed et al. [18], the RO system has some advantages, such as high separation efficiency, lower energy consumption than thermal desalination, and water purification without phase change. The electrical energy consumption and the recovery ratio of the RO system are 2–5 kWh/m3 and 30–50%, respectively, with zero thermal energy consumption. In order to reduce the global water energy stress in a sustainable manner, membrane distillation (MD) is a potential separation method [19]. Membrane distillation uses a vapor pressure difference that is maintained over a microporous hydrophobic membrane as the driving force behind its thermal operation [18]. In MD, an aqueous solution’s vapor passes through a hydrophobic membrane and condenses on the opposite side, producing a superior distillate [19]. According to Ravi et al. [20] and Wei et al. [21], the MD system’s advantages are: High salinity seawater could be desalinated by the MD system; renewable energy could be used to reduce the energy consumption of the MD system; low operating pressure and temperature; and high recovery rate of water. A study by Ahmed et al. [18] mentioned that the thermal energy consumption, electrical energy consumption, and recovery ratio are 100 kWh/m3, 1–3.65 kWh/m3, and 60–80%, respectively. Because it is thermally powered, the process has more potential for utilizing solar and geothermal energy [15]. MD can be broken down into four different categories based on the technique used to collect the water vapor on the distillate side, which are: sweep gas membrane distillation (SGMD), vacuum membrane distillation (VMD), air-gap membrane distillation (AGMD), and direct contact membrane distillation (DCMD) [19]. Multiple studies show the ability to operate the MD system using the waste heat of different industrial sources. For instance, Lu et al. [22] used a heat exchanger network; Mohan et al. [23] used flue gases liberated by a gas turbine power plant; and Bouguecha et al. [24] used the waste heat of power plants as sources of thermal energy used to operate the MD system. In this study, the method used for membrane distillation is the DCMD method because of its simple configuration and high ratio of gained output [19,25].
Since there is no desalination system with a 100% recovery rate, there is a rejected brine; this waste brine has higher salinity and density than typical saltwater [17]. As a result, brine disposal will damage the marine environment, posing a serious challenge for desalination worldwide; therefore, environmentally friendly brine management is required [17,26,27]. Many technologies help deal with the rejected brine and get the most benefits from it in an environmentally friendly way; this brine contains different types of beneficial minerals, as mentioned at the beginning, and the concentrations of these beneficial minerals in the seawater are as follows: 10,800 mg/L of Na, 19,400 mg/L of Cl, 1290 mg/L of Mg, 2708 mg/L of SO4, 392 mg/L of K, and 411 mg/L of Ca, according to [28]. For instance, one of these technologies is the electrodialysis (ED) system, which comprises stacked anion- and cation-selective semi-permeable membranes. A study by Ye et al. [29] used an electrodialysis (ED) system supported by monovalent selective membranes (MSM) to demonstrate the potential for recovering magnesium ions from saltwater. Another study by Barros et al. [30] showed that 72% of potassium (K) could be recovered using a combined electrodialysis (ED) setup with a current efficiency of 54% and energy consumption of 9 kWh/m3. Another technology for brine management is the direct contact membrane distillation crystallization (DCMDC) system. This technology is a combination of the membrane distillation technology with an external crystallizer, where the rejected brine from the MD unit becomes first saturated and then supersaturated, which helps crystal formation, which is subsequently collected in an external crystallizer according to [17,31,32]. A study by Tunc et al. [33] shows that 80% of the water recovery rate and 6–7 tons/day of salt are achieved from the desalination process of the retentate of the RO system using the direct contact membrane distillation (DCMD) system. There are different crystallization processes: Evaporation crystallization (EVC) and cooling crystallization (CC). In the EVC process under heat treatment, the solvent separates from the solute, and the solute crystallizes out of the solution as solid-state crystals. The solvent can be evaporated from an unsaturated solution at a particular temperature by using an external heat source. The solution eventually approaches saturation as the solvent is gradually removed. Further solvent evaporation will cause the solute in the saturated solution to crystallize [34].
This paper aims to perform thermodynamic analysis of a DCMDC that recovers beneficial hydroponic ions from seawater using solar thermal energy, electricity using fuel cell, space cooling using the DEVCR system, fresh water, and hydroponic fertilizers using the DCMDC-CR system, and brine management using the chlor-alkali system. The objectives of this study are to: Design and study an integrated system for recovering beneficial hydroponic ions from the membrane distillation-rejected brine; apply thermodynamic rules on each unit and overall system and evaluate their results; and conduct several sensitivity analyses to determine the impacts of various factors on the system, such as the rate of mass flow, recovery ratio, and salinity.

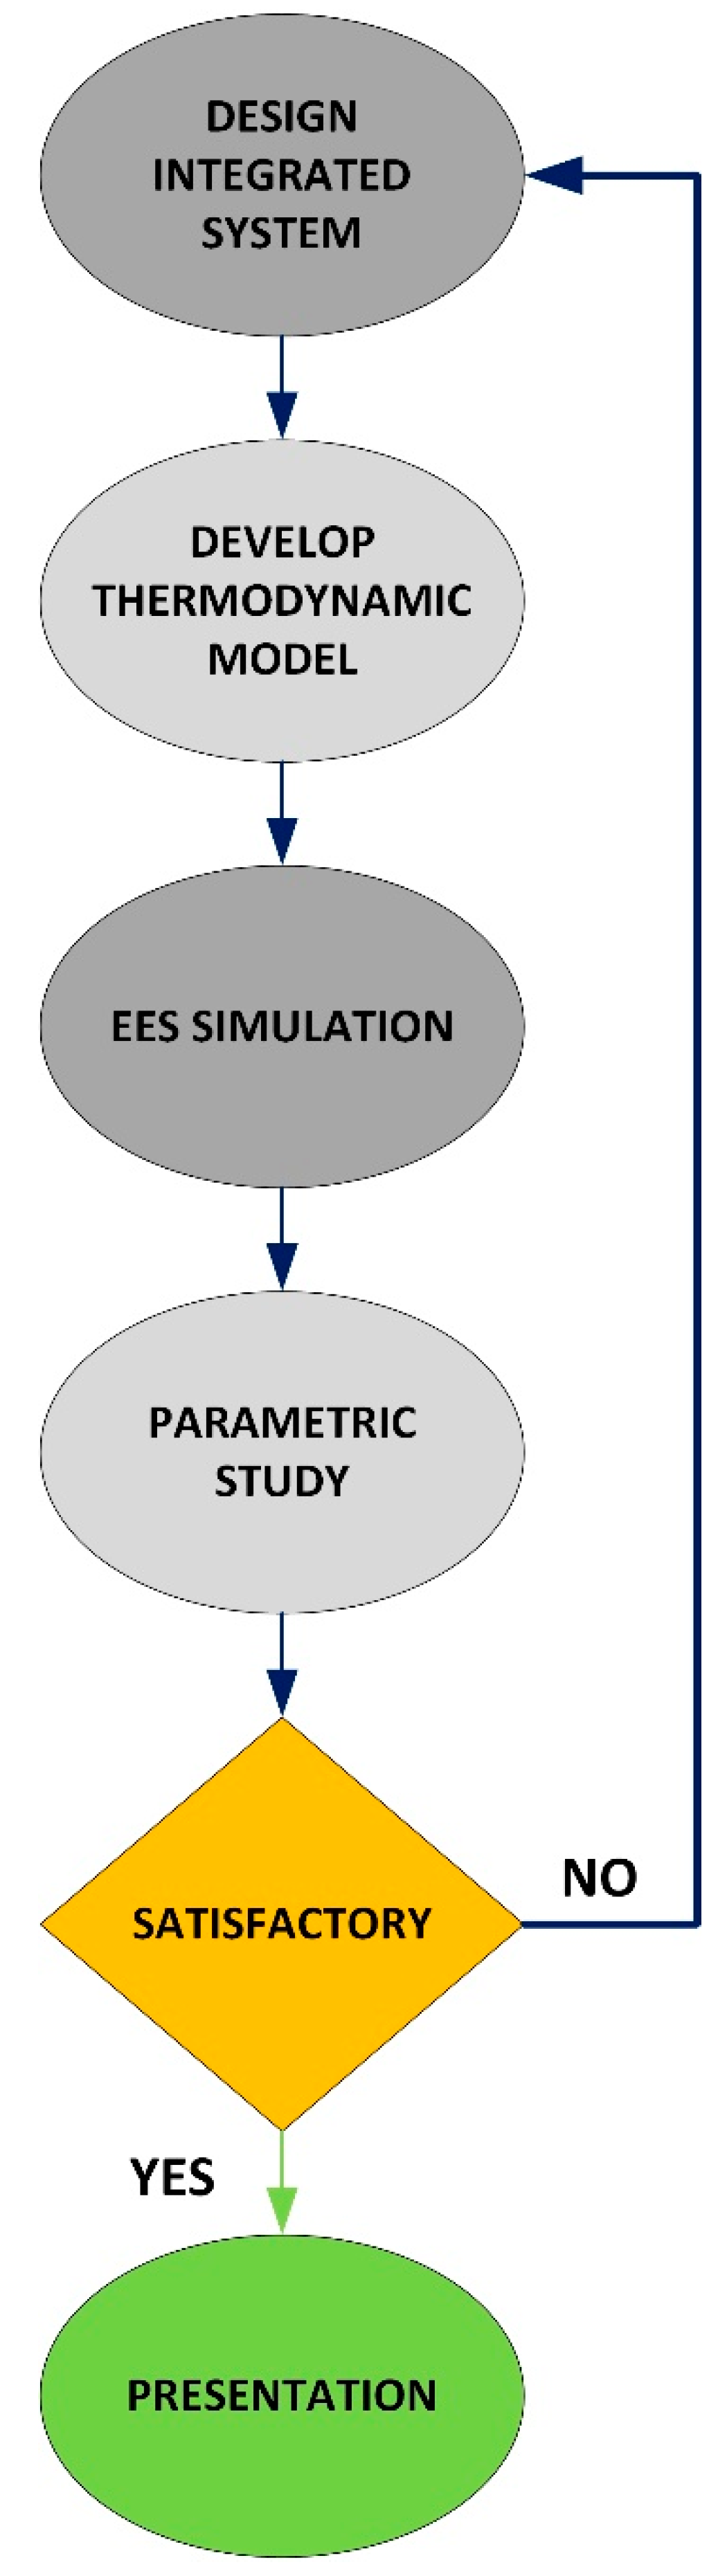
2. Materials and Methods

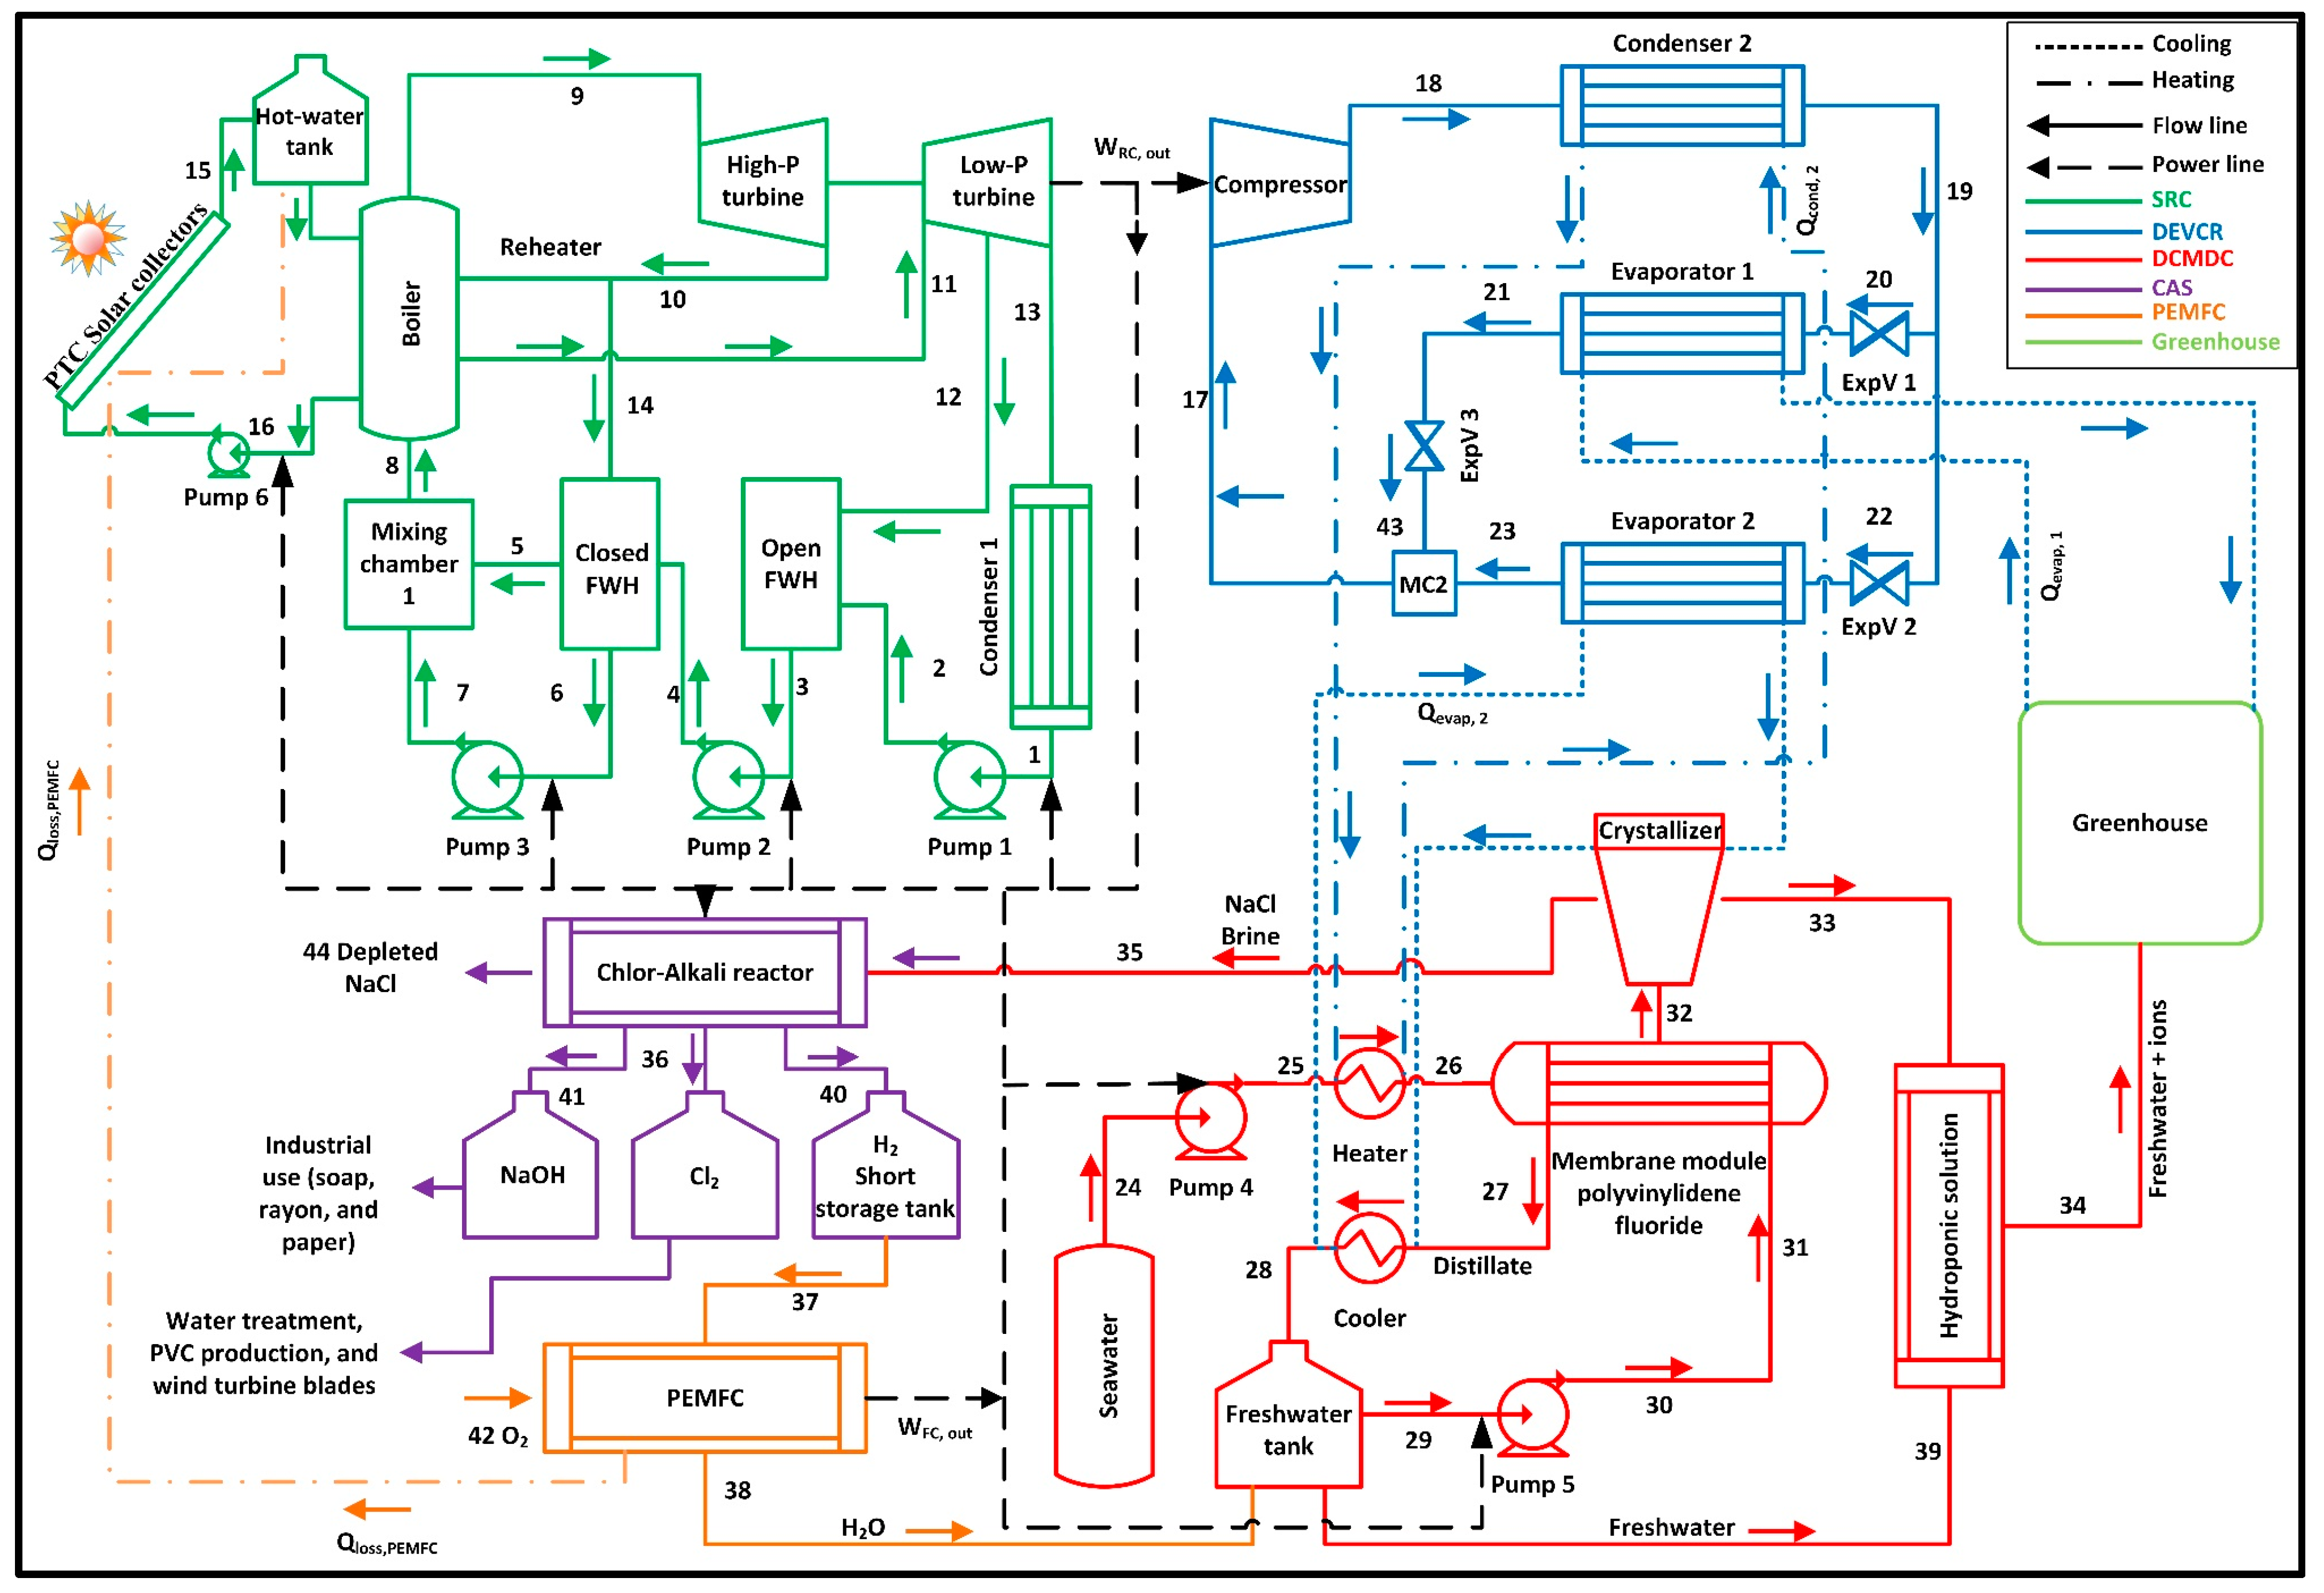
2.1. System Description

The integrated studied system of this paper contains a reheat-regenerative steam Rankine cycle (SRC) as a power generation unit because of its advantages, such as higher efficiency than the organic Rankine cycle (ORC), low cost, environmentally friendly, non-toxic, and high chemical stability of working fluid, and low pump consumption according to [35]. Since the (SRC) power generation system works by steam, the required heat to change the water from the saturated liquid phase to the superheated phase is provided using parabolic trough collectors (PTC) since the operating temperature of the PTC could achieve 400 °C to 500 °C [36]. Another system connected to the SRC is a dual evaporator vapor compression refrigeration system (DEVCR), where the function of this system is to provide cooling heat for the system that requires cooling. A DCMDC crystallization system is used as a saltwater desalination and ions recovery system. In addition, a chlor-alkali system (CAS) is used to manage the rejected brine from the crystalized, where the chlor-alkali system can produce hydrogen (H2), chlorine (Cl2), and sodium hydroxide (NaOH) according to [37], where the Cl2 is used for water treatment, PVC production, and wind turbine blades production according to [38]. The NaOH is stored for industrial use, such as producing soap, rayon, and paper, according to [39]. The H2 is mixed with O2 in a proton exchange membrane fuel cell (PEMFC) to produce electrical energy and fresh water, where the PEMFC system has an electrical efficiency between 40% to 50% with an output power capacity of 250 kW, with many advantages such as low cost, lightweight, the solidity of electrolyte, and the flexibility in input fuel [40]. The study procedures used to design and assess the thermodynamic viability of the system are shown in Figure 1.
The proposed system in Figure 2 is based on solar parabolic trough collectors (PTC) for thermal energy capture and a PEMFC unit for electricity production. The produced electric energy is distributed to multiple subsystems to achieve each system’s task. Firstly, at state 8, the water enters the boiling unit (Br) as compressed liquid and then it becomes superheated at state 9 due to the generated heat by PTC solar collectors during the day time and by hot water storage tank during night time. At state 9, the superheated water enters the high-pressure turbine (HPT) to produce mechanical energy and exits as a saturated mixture at state 10, where some amount of this output stream is sent to the closed feed water heater unit (CFWH) and the remaining amount is sent to the boiler to reheat it and send it as superheated water to the low-pressure turbine (LPT). At state 11, the superheated water enters the LPT to produce more mechanical energy and exits as a saturated mixture at state 13, where some amount of this output mixture is sent to the open feed water heater unit (OFWH), and the remaining amount is sent to the condenser #1 (Cond1) to condensate i. Here, it exits as saturated liquid at state 1, where it is pumped using the pump #1 (P1) and enters the OFWH as compressed liquid at state 2, where it is heated by the extracted amount from the LPT and mixed with it. Then, it exits as saturated liquid at state 3, where it is pumped using the pump #2 (P2) and enters the CFWH as compressed liquid at state 4, where it is heated by the extracted amount from the HPT without mixing with it, and exits as compressed liquid at state 5 with a higher temperature than state 4. The extracted amount from the HPT exits from the CFWH as a saturated liquid, where it is pumped using the pump #3 (P3) and enters the mixing chamber as compressed liquid at state 7, where it is mixed with the inlet stream at state 5 and exits as compressed liquid and enters in the Br. Secondly, at state 17, the R-134a refrigerant enters the compressor (Comp) as saturated vapor and exits as a superheated refrigerant at state 18 and enters the condenser #2 (Cond2) and exits as a saturated liquid at state 19, where the rejected heat from Cond2 is used as a heating source for the heating unit (HT) in the DCMDC system. Then, at state 19, the refrigerant is divided into two ways. Firstly, the refrigerant enters the expansion valve #1 (ExpV1) and exits as a low-quality saturated mixture at state 20 and enters the evaporator #1 (Evap1) to ventilate a greenhouse with 600 m3 volume and exits as saturated vapor at state 21. Then, it enters the expansion valve #3 (ExpV3) and exits at state 43 where the refrigerant’s pressure is equal to the refrigerant’s pressure at state 23. Secondly, the refrigerant enters the expansion valve #2 (ExpV2) and exits as a low-quality saturated mixture at state 23 and enters the evaporator #2 (Evap2) as a cooling source for the crystallizing (CR) and the cooling (CO) units in the DCMDC system, and exits as saturated vapor at state 23, where it is mixed in the mixing chamber with the refrigerant of state 43 and exits as saturated vapor and enters in the (Comp). Thirdly, at state 25, the water enters the HT as saturated liquid and is heated using the rejected heat from Cond2 and exits at state 26 as a saturated mixture where it enters the polyvinylidene fluoride membrane (PVF) to desalinate 5 kg/s of seawater and produce 4.4 kg/s of a hydroponic solution, where the vapor is separated from the mixture and sent to the CO, where it is condensed and exits as a saturated liquid for storage in the fresh water tank (FRT). The rejected liquid from the PVF unit exits from the PVF and enters the CR at state 32, where the needed ions are crystallized and sent to the hydroponic solution production unit (HSP), where the ions are mixed with fresh water depending on the greenhouse requirements, and then the hydroponics solution is sent to the greenhouse. The rejected brine from CR enters the CAS unit, where this system produces hydrogen (H2), chlorine (Cl2), and sodium hydroxide (NaOH). The produced H2 is sent to the PEMFC system, where it is mixed with O2 to produce fresh water and electrical energy, and the PEMFC heat loss is used as a heating source for the hot water storage tank in case any heat leakage happens during the night time. Cl2 is used for water treatment, PVC production, and wind turbine blade production, and the NaOH is stored for industrial use, such as producing soap, rayon, and paper.

2.2. Analysis

Since the study performs thermodynamic analysis, Engineering Equation Solver (EES) software is employed using different thermodynamics functions and libraries for various materials [41]. Furthermore, EES performs iterative solving, eliminating the tedious and time-consuming task of acquiring thermodynamic properties with built-in functions, such as temperature, pressure, enthalpy, entropy, and exergy. In addition, EES also includes parametric tables that allow the user to compare several variables at a time. Parametric tables can also be used for different sensitive analyses and plots. Therefore, EES software is used to analyze the subsystems shown in Figure 2. All the needed thermal properties, such as entropy, enthalpy, and exergy, for calculating and finding the unknown parameters of the balance equations mentioned in Tables S1–S3 are obtained. Using “EES: water and steam functions” and the provided instances mentioned by Çengel [42], the SRC subsystem is studied. Using the data provided by Pektezel et al. [43] and the “EES: R134a function”, the DEVCR subsystem is studied. Using the data provided by Kerme et al. [44], the parabolic trough collectors (PTC) are studied. Using the data provided by Ali et al. [45] and “EES: Seawater External Library,” the DCMDC crystallization subsystem is studied. In addition, the CAS subsystem is studied using “EES: Nasa External Library” and the information provided by Mir et al. [37]. The thermodynamic properties of the sulfate (SO4) are obtained using the HSC Chemistry software [46] because there is no library for SO4 properties inside EES. Using the data provided by Khan et al. [47], the fuel cell system (PEMFC) is modelled. Several sensitivity assessments are carried out to determine the impacts of various factors on the system, such as changing the rate of mass flow, recovery ratio, salinity, and different temperature and pressure values. Table S4 contains the used input parameters of each subsystem.

3. Results and Discussion

The following sections present and discuss the results of the subsystems and the overall system, such as the obtained thermodynamics data, mass flow rates, and efficiencies. Furthermore, the sensitivity analysis results are discussed and validated with the literature.

3.1. Results of Integrated System

The primary purpose of this system is to design a self-sufficient system with total net power equal to 0 kW, where the total input power is equal to the total output power of the overall system. For instance, the desired power to run the DEVCR, DCMDC, CAS, and other power-required systems, is generated using the SRC subsystem assisted with solar energy and PEMFC. Table S5 includes the results of the thermodynamic analysis at each state point. Table 1 shows the rate of mass flow of each recovered ion from 5 kg/s of seawater using the DCMDC-CR system, where the percentages of the dissolved salts in the seawater according to [48] are 3.05, 0.265, 0.123, 0.04, and 0.038% of NaCl, SO4, Mg, Ca, and K, respectively.
As shown in Table S5, from state 24 up to state 26, the water salinity is 35 g of salts/kg of water, where these states refer to the seawater before the desalination process. When seawater enters the PVF membranes with a rate of mass flow of 5 kg/s of seawater, the seawater is desalinated from 35 g of salts/kg to 0.5 g/kg with a recovery ratio of 70%. At state 27, the produced mass flow rate is 3.5 kg/s of fresh water with a salinity of 0.5 g/kg, which is suitable for the irrigation process [49]. At state 32, the rejected brine exits from the PVF membranes with a rate of mass flow of 1.5 kg/s and salinity of 87.5 g/kg, where the rejected brine equals 2.3 times the original salinity, according to [50]. Through the crystallizing unit, the required ions for plants that are included in the brine are crystallized, separated, and exit at state 33 at 0.9 kg/s of the rate of mass flow and 0.5 g/kg of salinity and a recovery ratio of 60%. The rate of mass flow of the recovered ions from seawater for hydroponic solution production are mentioned in Table 1.
Table S6 shows the obtained results of each subsystem and the overall system. For instance, the net power produced by the SRC system is 1086 kW, with energy efficiency and exergy efficiency equal to 36.37% and 34.76%, respectively, and these values are comparable to the SRC efficiency values mentioned by Çengel [42]. The required heat input for the SRC system is 2988 kW, where this heat is supplied to the system using a PTC system that produces heat of 2988 kW from solar energy with an area of 5976 m2 and 0.5 kW/m2 of solar irradiance and exergy efficiency and energy efficiency equal to 47.3%, and 90%, respectively. In addition, the output power from the PEMFC is 70.62 kW with 68.52% energy efficiency, which is comparable to other works mentioned in [51]. The total desired power of the overall integrated system is 1182.69 kW, and the total generated power of the overall integrated system is 1182.69 kW, wherefore the work net of the overall system is 0 kW with overall exergy efficiency and overall energy efficiency equal to 41.40% and 39.80%, respectively. The total required heat inputs for the whole system equals 5314.60 kW, which equals the sum of the required heat for the boiler and the heater and the sum of the absorbed heat for the cooling and the crystallizing units. The output heat for the whole system equals to 8739.80 kW, which equals to the generated heat using PTC, Cond1, and Cond2.
Table 2 contains the specifications and capacities of each unit, such as inputs, outputs, and other parameters. For instance, the total required surface area of the PTC system to generate 2988 kW of heat power is 5976 m2 with 0.5 kW/m2 of solar irradiance.

3.2. Sensitivity Analysis

The following section presents and discusses the results of the parametric analysis on the subsystem and overall system outputs and efficiencies.

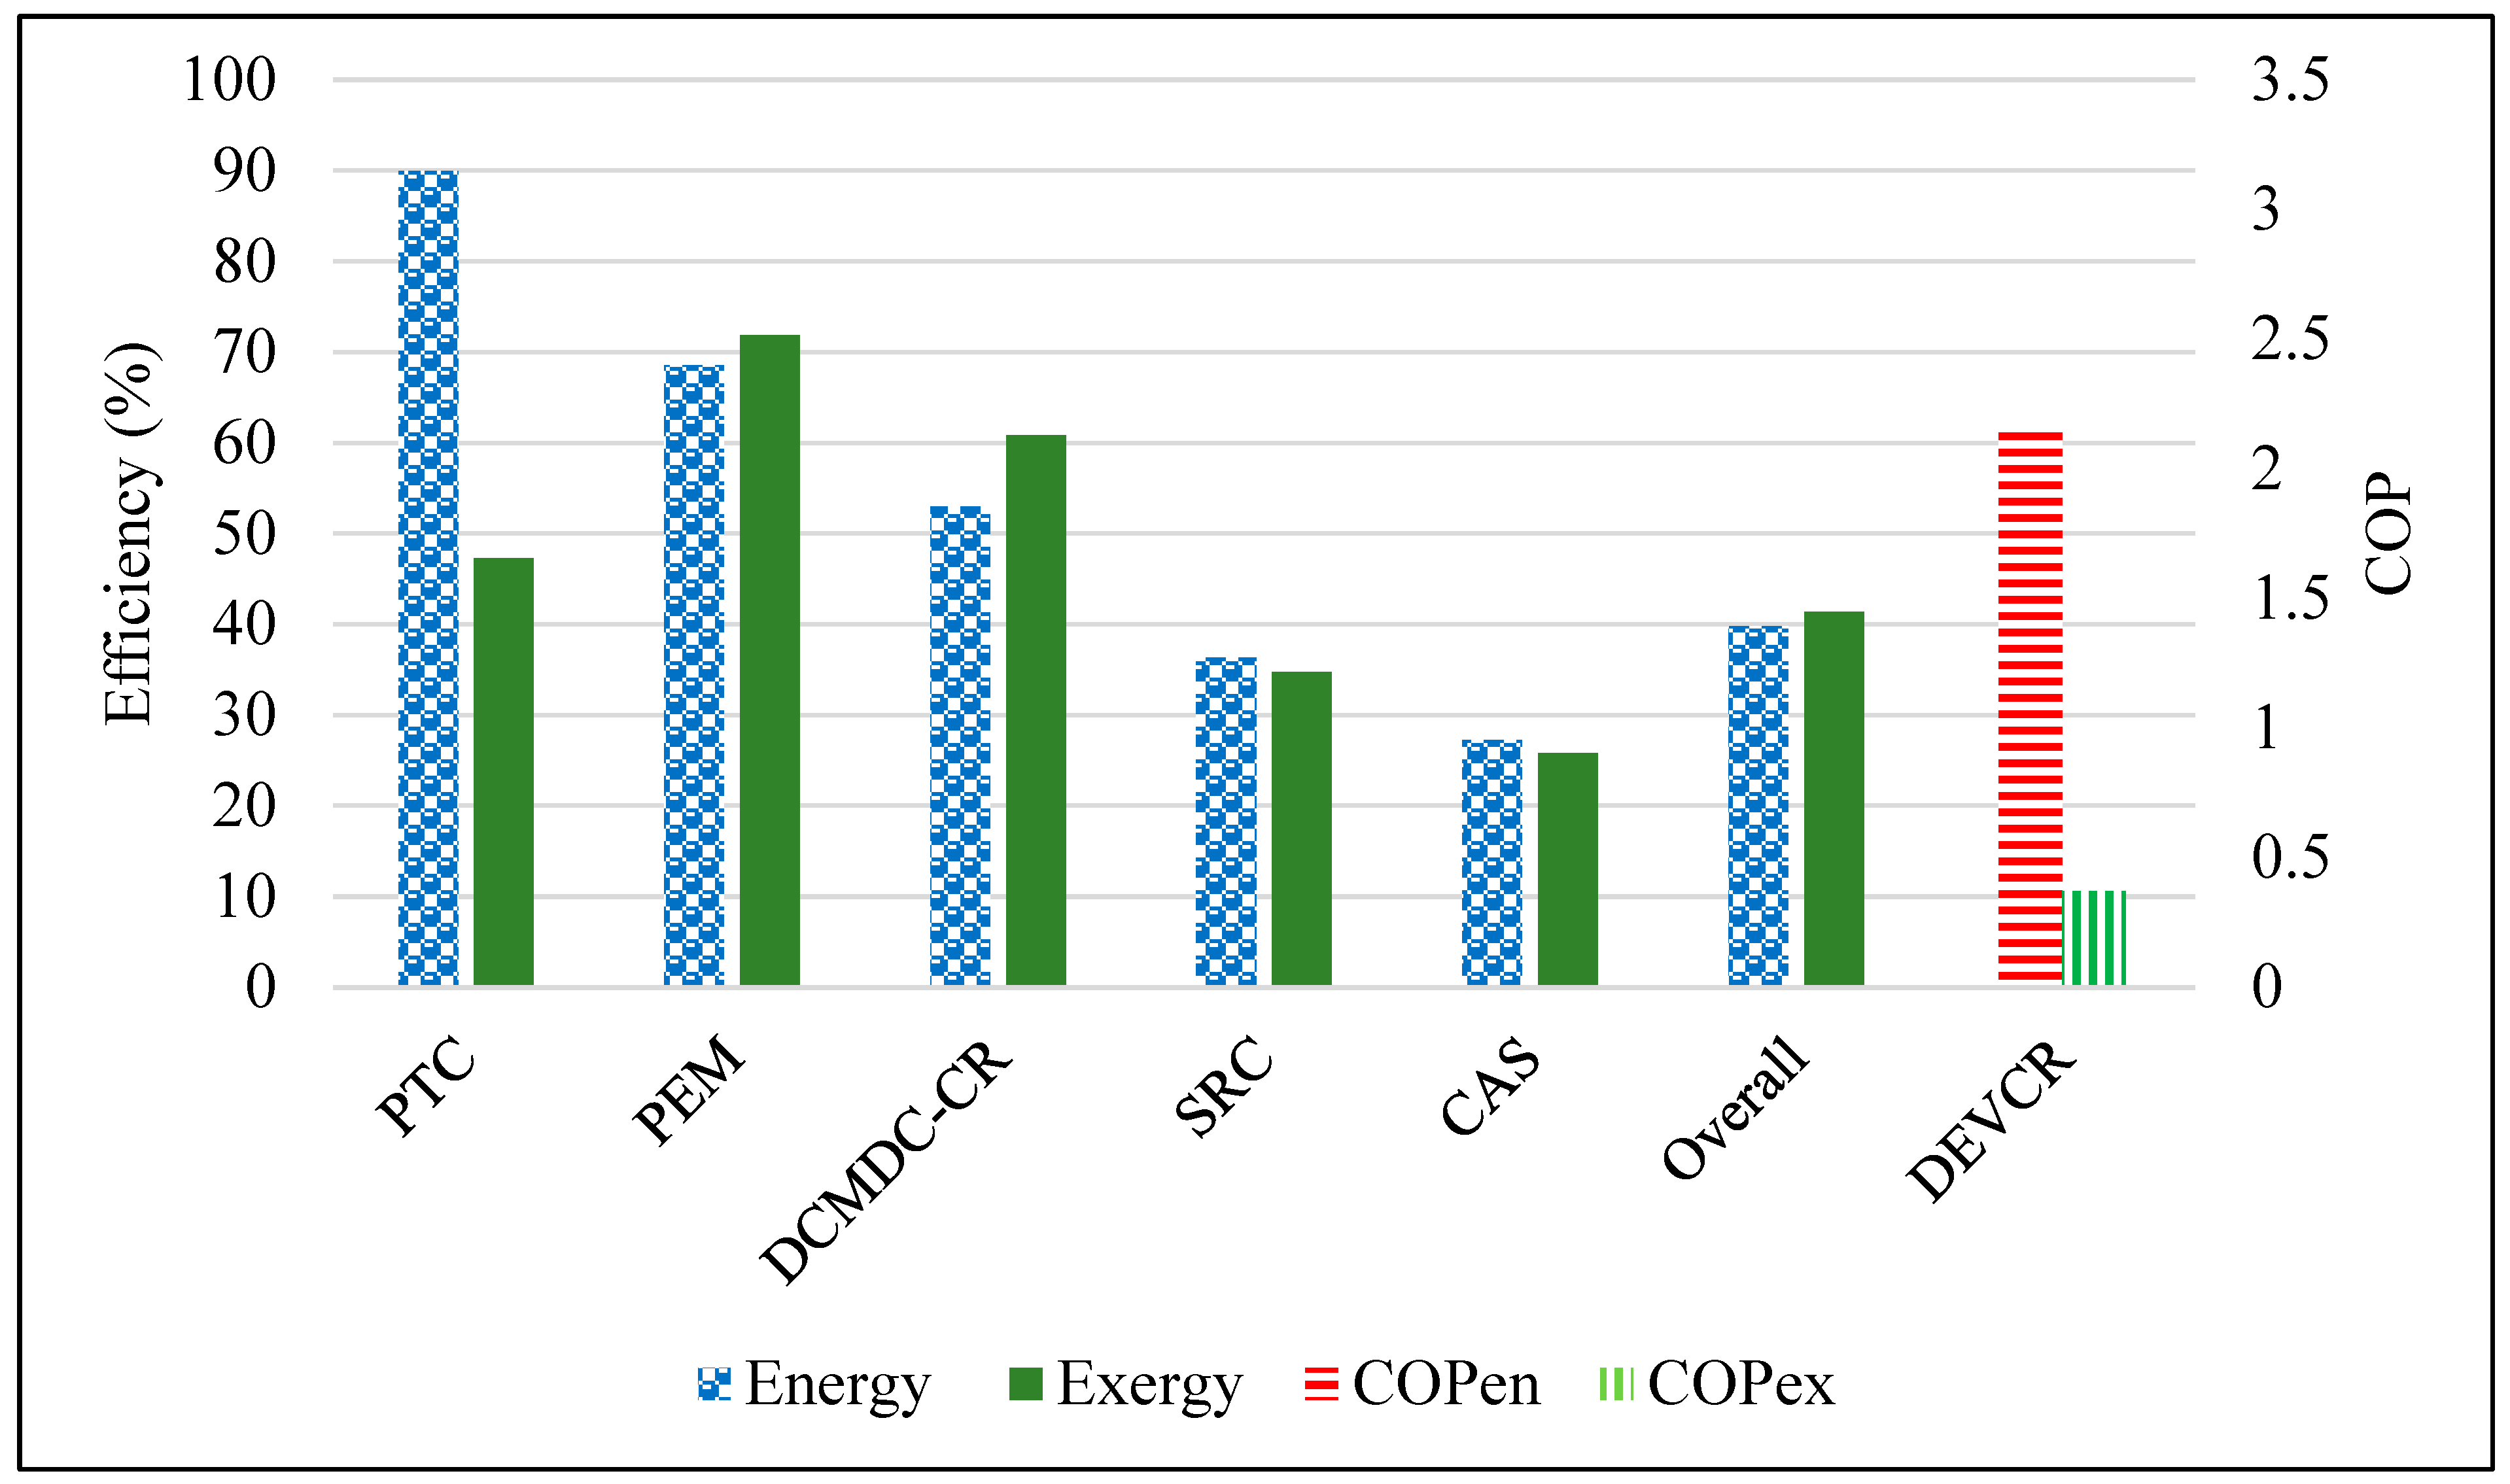
3.2.1. Results Validation and Efficiencies

Figure 3 shows each subsystem’s exergy and energy efficiency values and the overall system. For instance, the energy efficiency and exergy efficiency of the SRC system are 36.34% and 34.76%, respectively, and the SRC energy efficiency of the current study is lower than 46.07% and 43.87% of the mentioned energy efficiency values in [52,53], respectively. The SRC exergy efficiency of the current study is lower than 55.29% of the mentioned exergy efficiency mentioned by M. Pandey [52], and higher than 30.70% of the value mentioned by Oyedepo et al. [53]. This difference between the values of SRC exergy efficiency and energy efficiency of the current study and the literature values is because of the difference between the applied pressure and temperature of the turbine feed stream of this study with the literature values.
The energy efficiency and exergy efficiency of the DCMDC-CR system is 52.95% and 60.81%, respectively. According to the literature, the equations used to find the energy efficiency and exergy efficiency of the DCMDC system only consider the heat conservation process without considering the produced fresh water and the recovered ions, as shown in the following energy efficiency equation mentioned by Ullah et al. [54]:
η e n D C M D C = Q ˙ N Q ˙ N + Q ˙ C
where: η e n D C M D C (%) is the energy efficiency of the DCMDC system, Q ˙ N (kW) is the vapor flux heat transfer, and Q ˙ C (kW) is the heat loss.
The membrane distillation’s exergy efficiency equation mentioned by Cao et al. [55] is:
η e x D C M D C = E x ˙ p r o d u c t E x ˙ s o u r c e
where: η e x D C M D C (%) is the exergy efficiency of the DCMDC system, E x ˙ p r o d u c t (kW) is the exergy rate of outputs, and E x ˙ s o u r c e (kW) is the exergy rate of inputs.
The energy efficiency of the DCMDC without the CR unit in the current study, 93.3%, is larger than 70% of the maximum energy efficiency mentioned by Al-Obaidani et al. [56] and in the range of 70% to 95% energy efficiency values mentioned by Ullah et al. [54]. The exergy efficiency of the DCMDC without the CR unit in this study, 48.1%, is larger than 43.4% of the value mentioned by Cao et al. [55], and lower than 78% of the value mentioned by Ali [57], since the feed stream temperature of the DCMDC of this study and the feed stream temperature mentioned in the literature are different, wherefore the obtained exergy efficiency and energy efficiency of this study with the literature values are also different.
The energy efficiency and exergy efficiency of the PEMFC system is 68.52% and 71.83%, respectively, where the energy efficiency of the PEMFC in the current study is in the range of 60% to 90% of the energy efficiency values mentioned by İnci et al. [51] and Luo et al. [58]. The exergy efficiency of the PEMFC in this study is higher than 50.4% and 46.89% of the exergy efficiency values mentioned by Arshad et al. [59] and Montazerinejad et al. [60], respectively. This difference between the values of the current study and the literature values is because of the different percentages of the heat loss rate, the generated power, and the operating temperature.

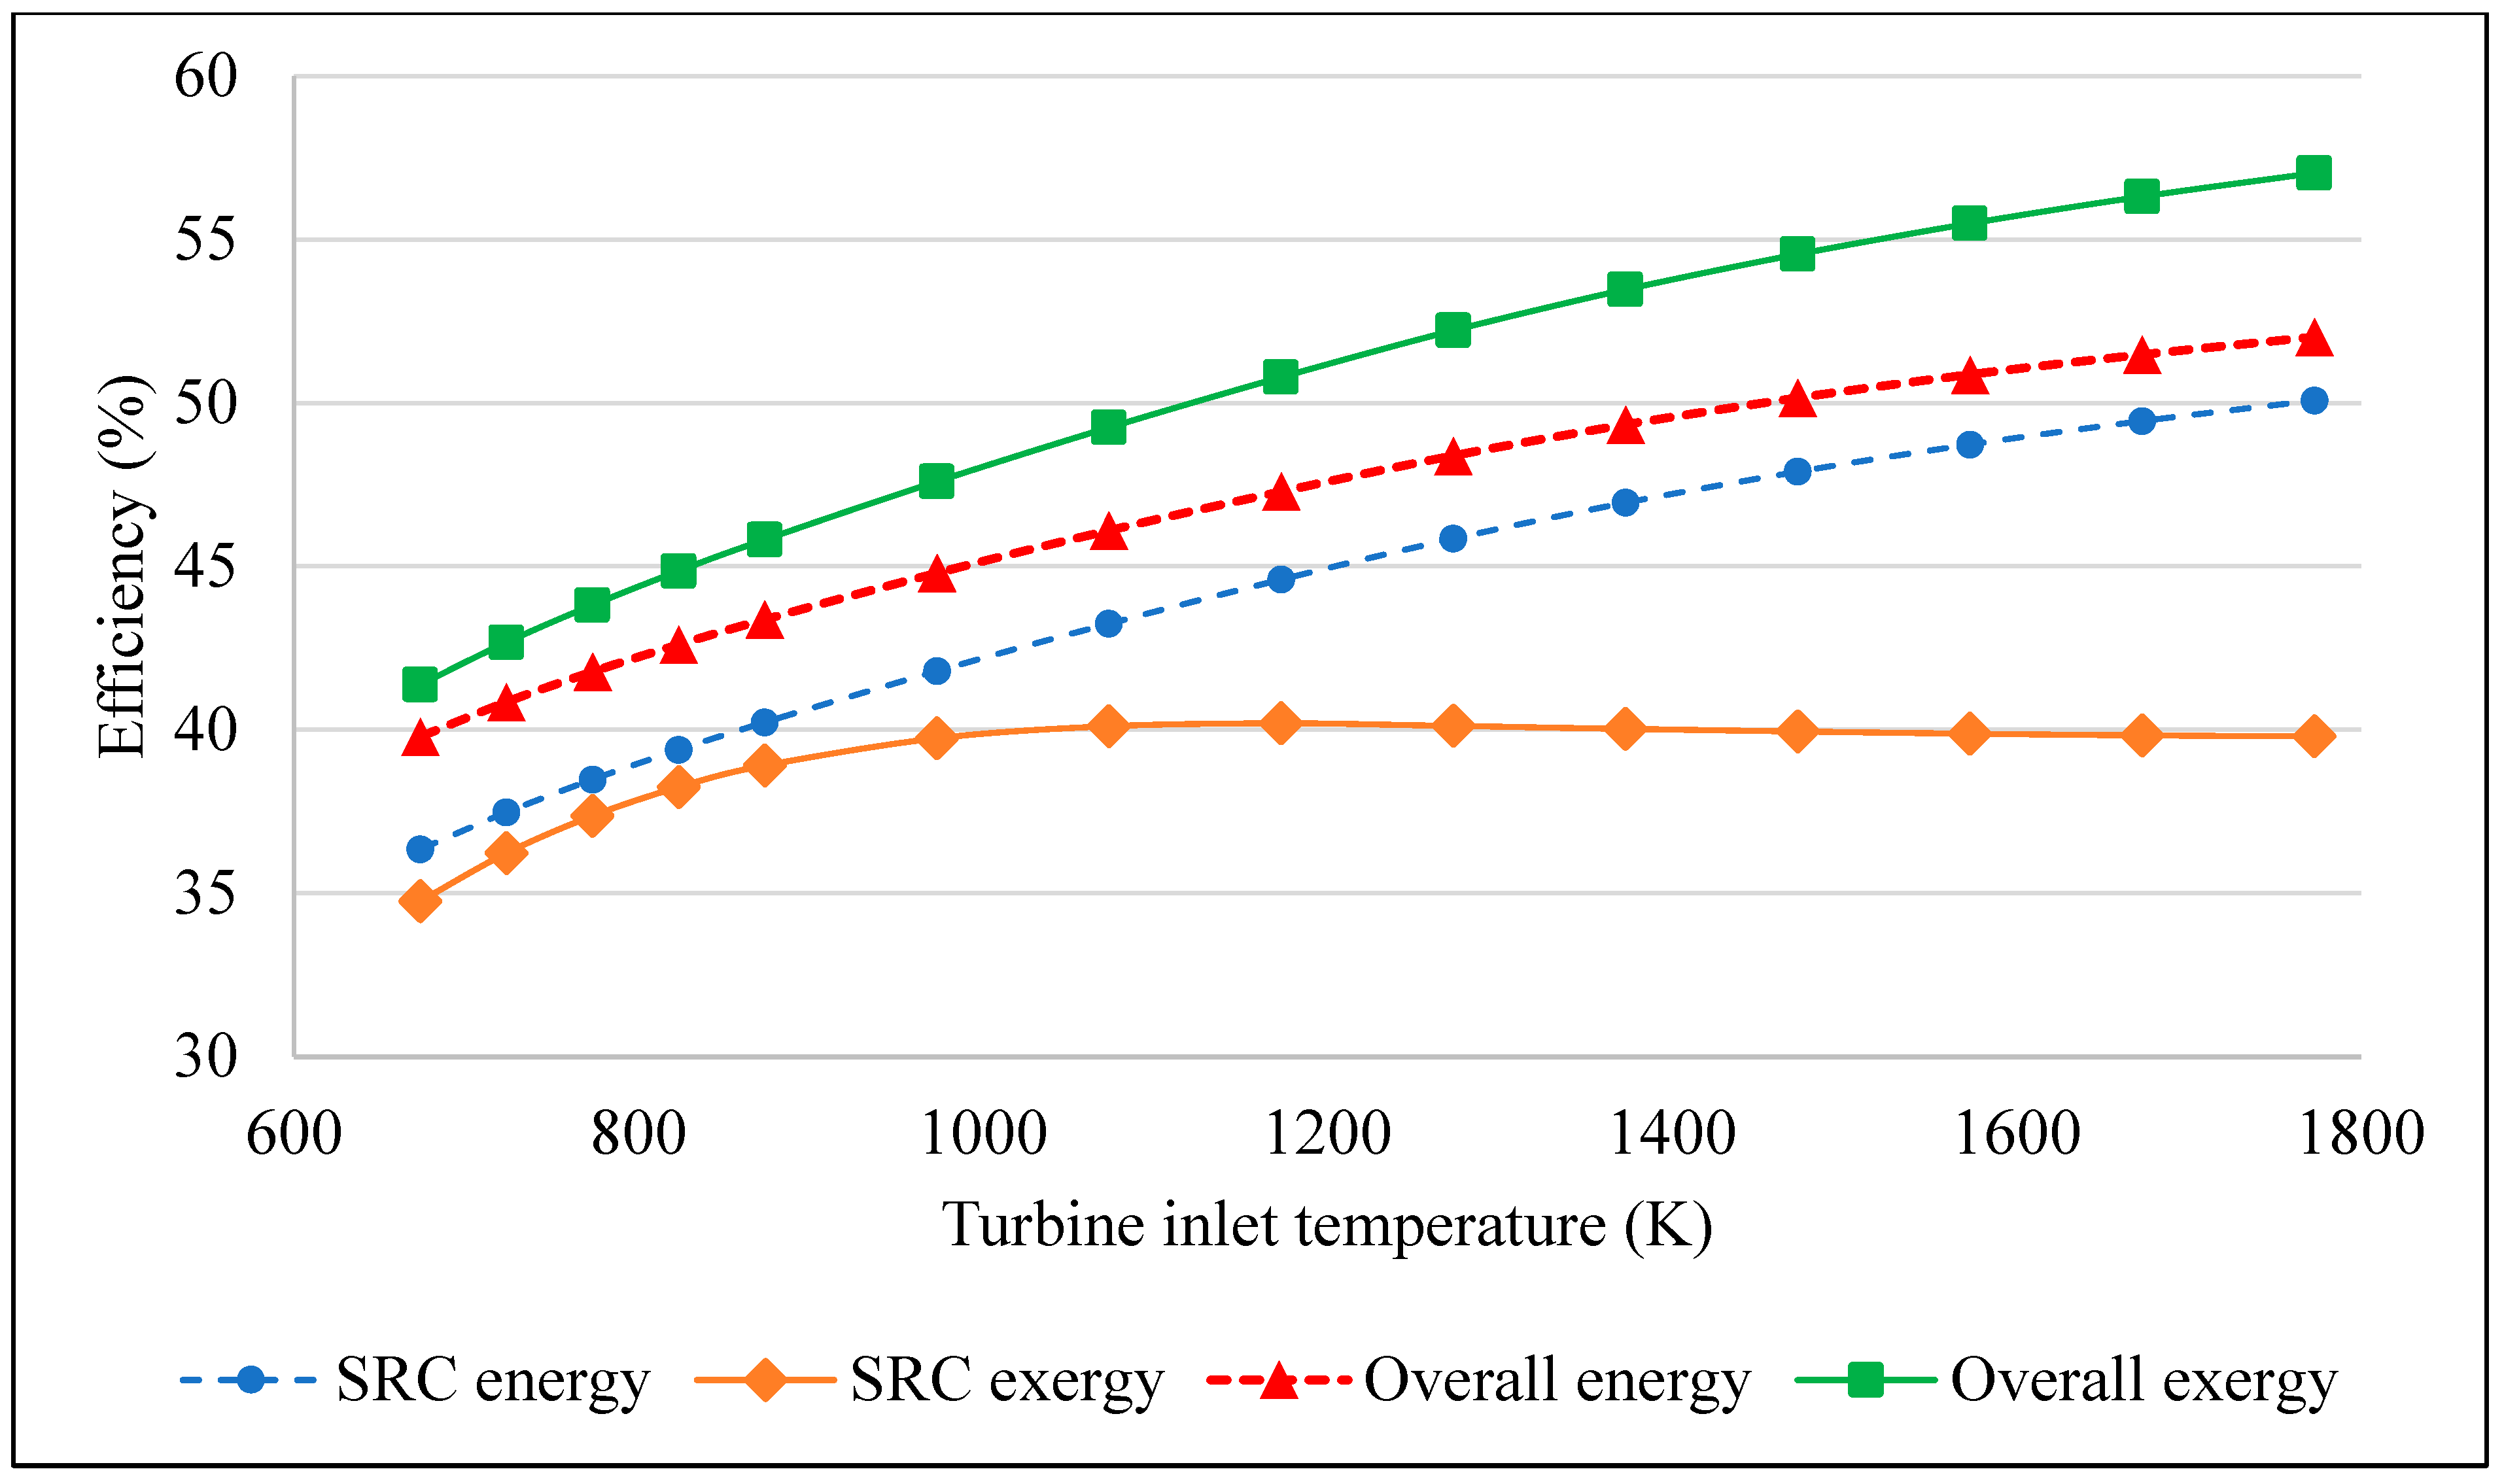
3.2.2. Steam Rankine Cycle (SRC)

Figure 4 presents the relation between the temperature of steam T9 at the inlet of the HPT unit and the energy efficiency and exergy efficiency of the SRC and the overall system at a constant maximum pressure of P9 = 15 MPa, and m ˙ 9 = 1.33 kg/s rate of mass flow. As shown in Figure 4, when the temperature increases from 673.15 K to 1773.15 K, the energy efficiency of the SRC unit increases from 36.35% to 50.08%, and the exergy efficiency of the SRC increases from 34.76% to 40.2% in the temperature range from 673.15 K to 1173 K, and after 1173 K it starts slightly decreasing to 39.8% at 1773 K, because when the temperature of the inlet feed increases, the internal energy and enthalpy increase, then the generated power from the turbines also increases. Furthermore, when the temperature increases from 673.15 K to 1773.15 K, the overall energy efficiency increases from 39.79% to 52.02%, and the overall exergy efficiency increases from 41.39% to 57.04%. These increases in the overall energy efficiency and overall exergy efficiency because of the increase in the output power of the SRC system with the constant input power of the whole system. Figure 4 concludes that when the turbine feed stream temperature increases, the energy efficiency and exergy efficiency of the SRC increase, and the whole system’s overall energy efficiency and exergy efficiency also increase.
Figure S1 presents the relation between the temperature of steam T9 at the inlet of the HPT unit and the output power from the HPT and LPT of the SRC system at a constant maximum pressure of P9 = 15 Mpa, and m ˙ 9 = 1.33 kg/s rate of mass flow. As shown in Figure S1, when the temperature increases from 673.15 K to 973.15 K, the output power from the HPT increases from 290.4 kW to its peak of 327.1 kW, and after 973.15 K, the HPT output power starts slightly decreasing to 302.1 kW at 1773 K. When the temperature increases from 673.15 K to 1073 K, the output power from the LPT decreases from 821.7 kW to 774.2 kW, and after 1073 K the LPT output power starts slightly increasing to 791.7 kW at 1773 K, because when the temperature of the inlet feed increases, the internal energy and enthalpy increase, then the generated power from the turbines increases.
Figure S2 presents the relation between the rate of mass flow of input seawater and the required rate of steam mass flow for the SRC system and its output power at a constant maximum pressure of P9 = 15 Mpa and a constant temperature of T9 = 673.15 K. As shown in Figure S2, when the rate of seawater mass flow increases, the required rate of steam mass flow of the SRC system also increases, which causes the output power of the SRC to also increase to satisfy the power requirement of the whole system, because when the rate of seawater mass flow is increased, the input power of the whole system is also increased. For instance, the desired rate of steam mass flow for the SRC system equals 0.75 kg/s when the rate of seawater mass flow equals 2 kg/s, with an output power of 609.1 kW, and when the rate of seawater mass flow increases to 8 kg/s, the required rate of steam mass flow for the SRC equals 1.84 kg/s with an output power of 1503 kW. When the rate of seawater mass flow increases, the generated power from the SRC system also rises.

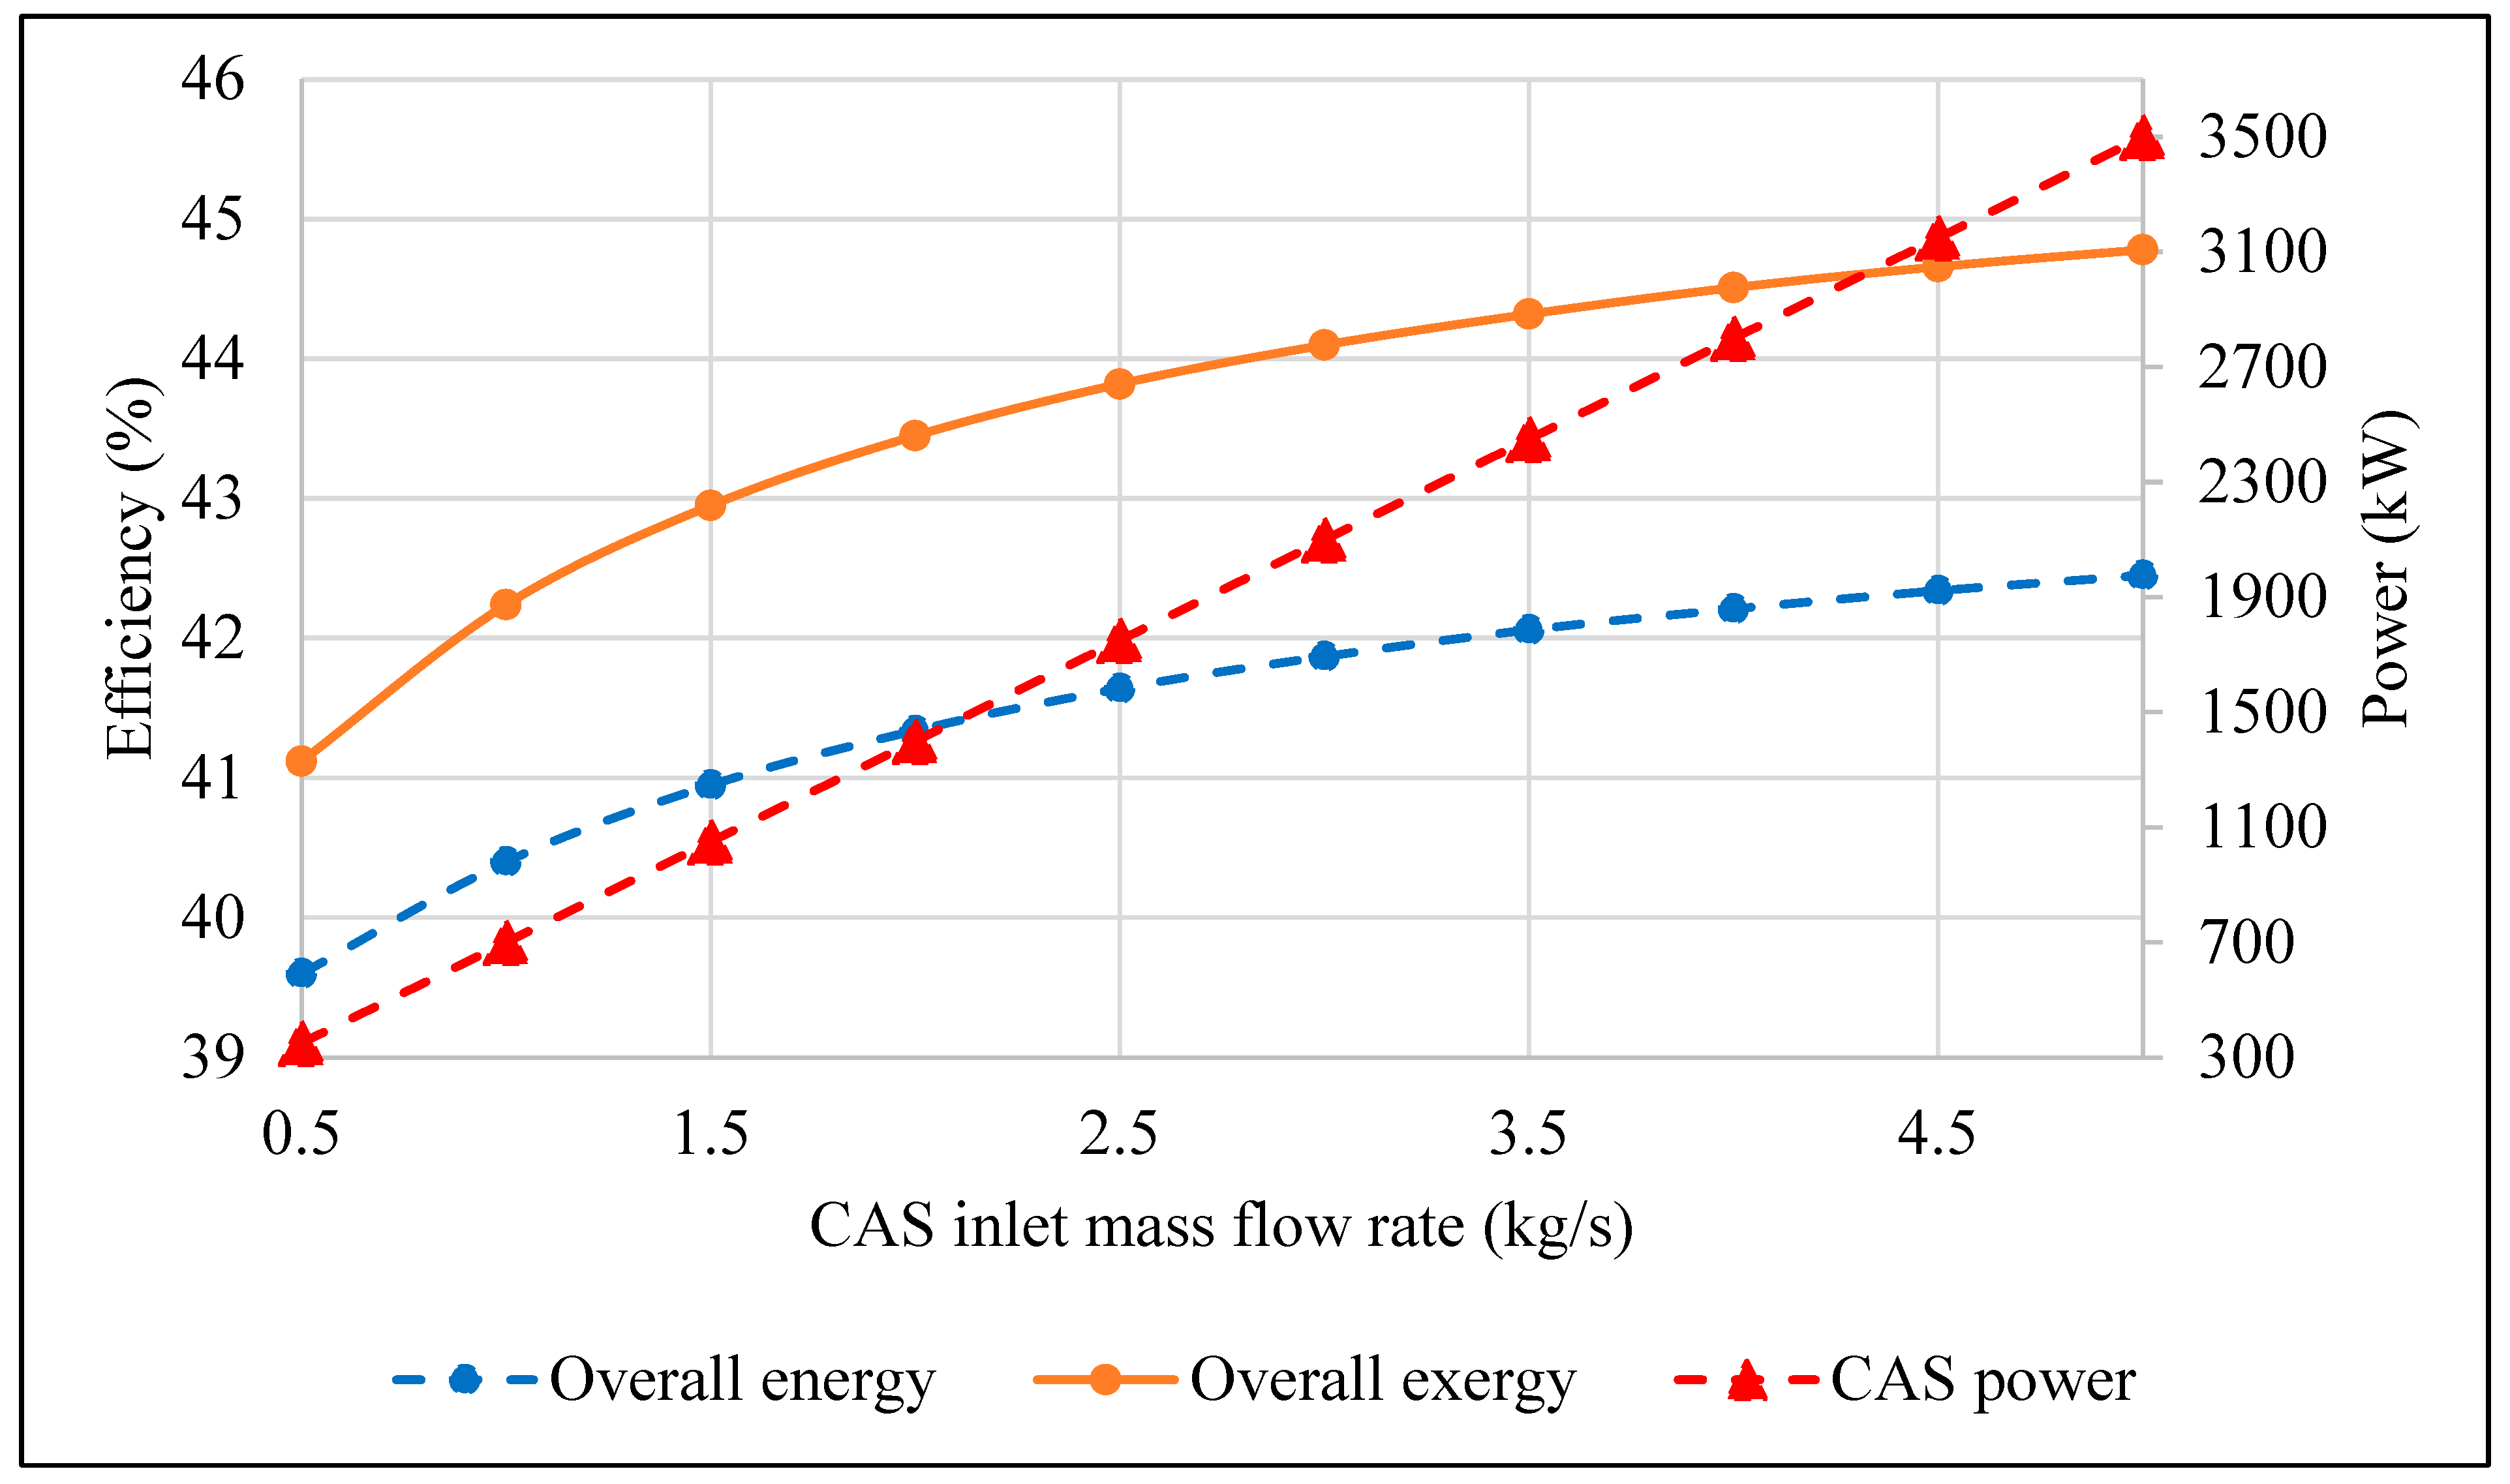
3.2.3. Chlor-Alkali System (CAS)

Figure 5 presents the relation between the CAS inlet mass flow rate and the CASs’ desired power and overall exergy efficiency and energy efficiency at a constant inlet temperature of T 35 = 283.2   K . As shown in Figure 5, when the rate of the CAS inlet mass flow increases, the CAS power, the overall exergy efficiency, and the overall energy efficiency increase. For instance, when the rate of inlet mass flow equals 0.5 kg/s, the CAS power and overall energy efficiency and exergy efficiency are 350 kW, 39.6%, and 41.12%, respectively, and when the mass flow rate increases to 4.5 kg/s, the CAS power, and the overall energy efficiency and exergy efficiency increase to 3150 kW, 42.34%, and 44.66%, respectively, because increasing the mass flow rate of the CAS feed stream requires more power to produce the required amount of hydrogen from the rejected brine.
Figure S3 presents the relation between the CAS inlet temperature and the CAS entropy generation and CAS exergy destruction rates at a constant rate of mass flow of m ˙ 35 = 0.6 kg/s. As shown in Figure S3, when the inlet temperature increases, the entropy generation and the exergy generation rates of the CAS decrease. For instance, when the inlet temperature equals 278.2 K, the entropy generation and exergy destruction rates are 0.1011 kW/K and 241.1 kW, respectively, and when the temperature increases to 335.2 K, the entropy generation and exergy destruction rates decrease to 0.0920 kW/K and 238.3 kW, respectively. It is noted that when the CAS feed stream temperature increases with constant output temperature, the difference between the input and output entropy and exergy values decreases, causing lower entropy generation and exergy destruction rates.
Figure S4 presents the relation between the CAS inlet temperature and exergy efficiency and energy efficiency, and the desired power for the CAS at a constant rate of mass flow of m ˙ 35 = 0.6 kg/s. As shown in Figure S4, when the inlet temperature increases, the required CAS power decreases, and the energy efficiency and exergy efficiency increase. For instance, when the inlet temperature equals 278.2 K, the CAS power is 420.2 kW. The CAS energy efficiency and exergy efficiency are 27.23% and 25.78%, respectively, and when the temperature increases to 335.2 K, the CAS power slightly decreases to 418.3 kW, and the CAS energy efficiency and exergy efficiency increase to 27.53% and 25.9%, respectively. Hence, if the CAS inlet temperature increases, the strength of the bonds between the feed stream atoms decreases, then the atoms are easily separated, causing a lower energy consumption due to less required power to break these atoms, and eventually, the CAS energy efficiency and exergy efficiency increase.
Figure S5 presents the relation between the mass flow rate of input seawater and the produced mass flow rate of hydrogen from the CAS for the PEMFC system and its output power, at a constant maximum pressure of P37 = 50 kPa and a constant temperature of T37 = 285.2 K. As shown in Figure S5, when the rate of seawater mass flow increases, the produced mass flow rate of hydrogen for the CAS system also increases, which causes the output power of the PEMFC to also increase to satisfy the power requirement of the needed systems, because when the mass flow rate of seawater is increased, the input power of the whole system and the produced hydrogen from the CAS are also increased. For instance, when the rate of seawater mass flow equals 2 kg/s, the produced mass flow rate of hydrogen equals 0.33 g/s and the output power from the PEMFC equals 28.25 kW, and when the mass flow rate of seawater increases to 8 kg/s, the produced mass flow rate of hydrogen equals 1.33 g/s and the output power from the PEMFC equals 113 kW. In summary, when the rate of seawater mass flow increases, the produced rate of mass flow of hydrogen and the PEMFC output power also increase.

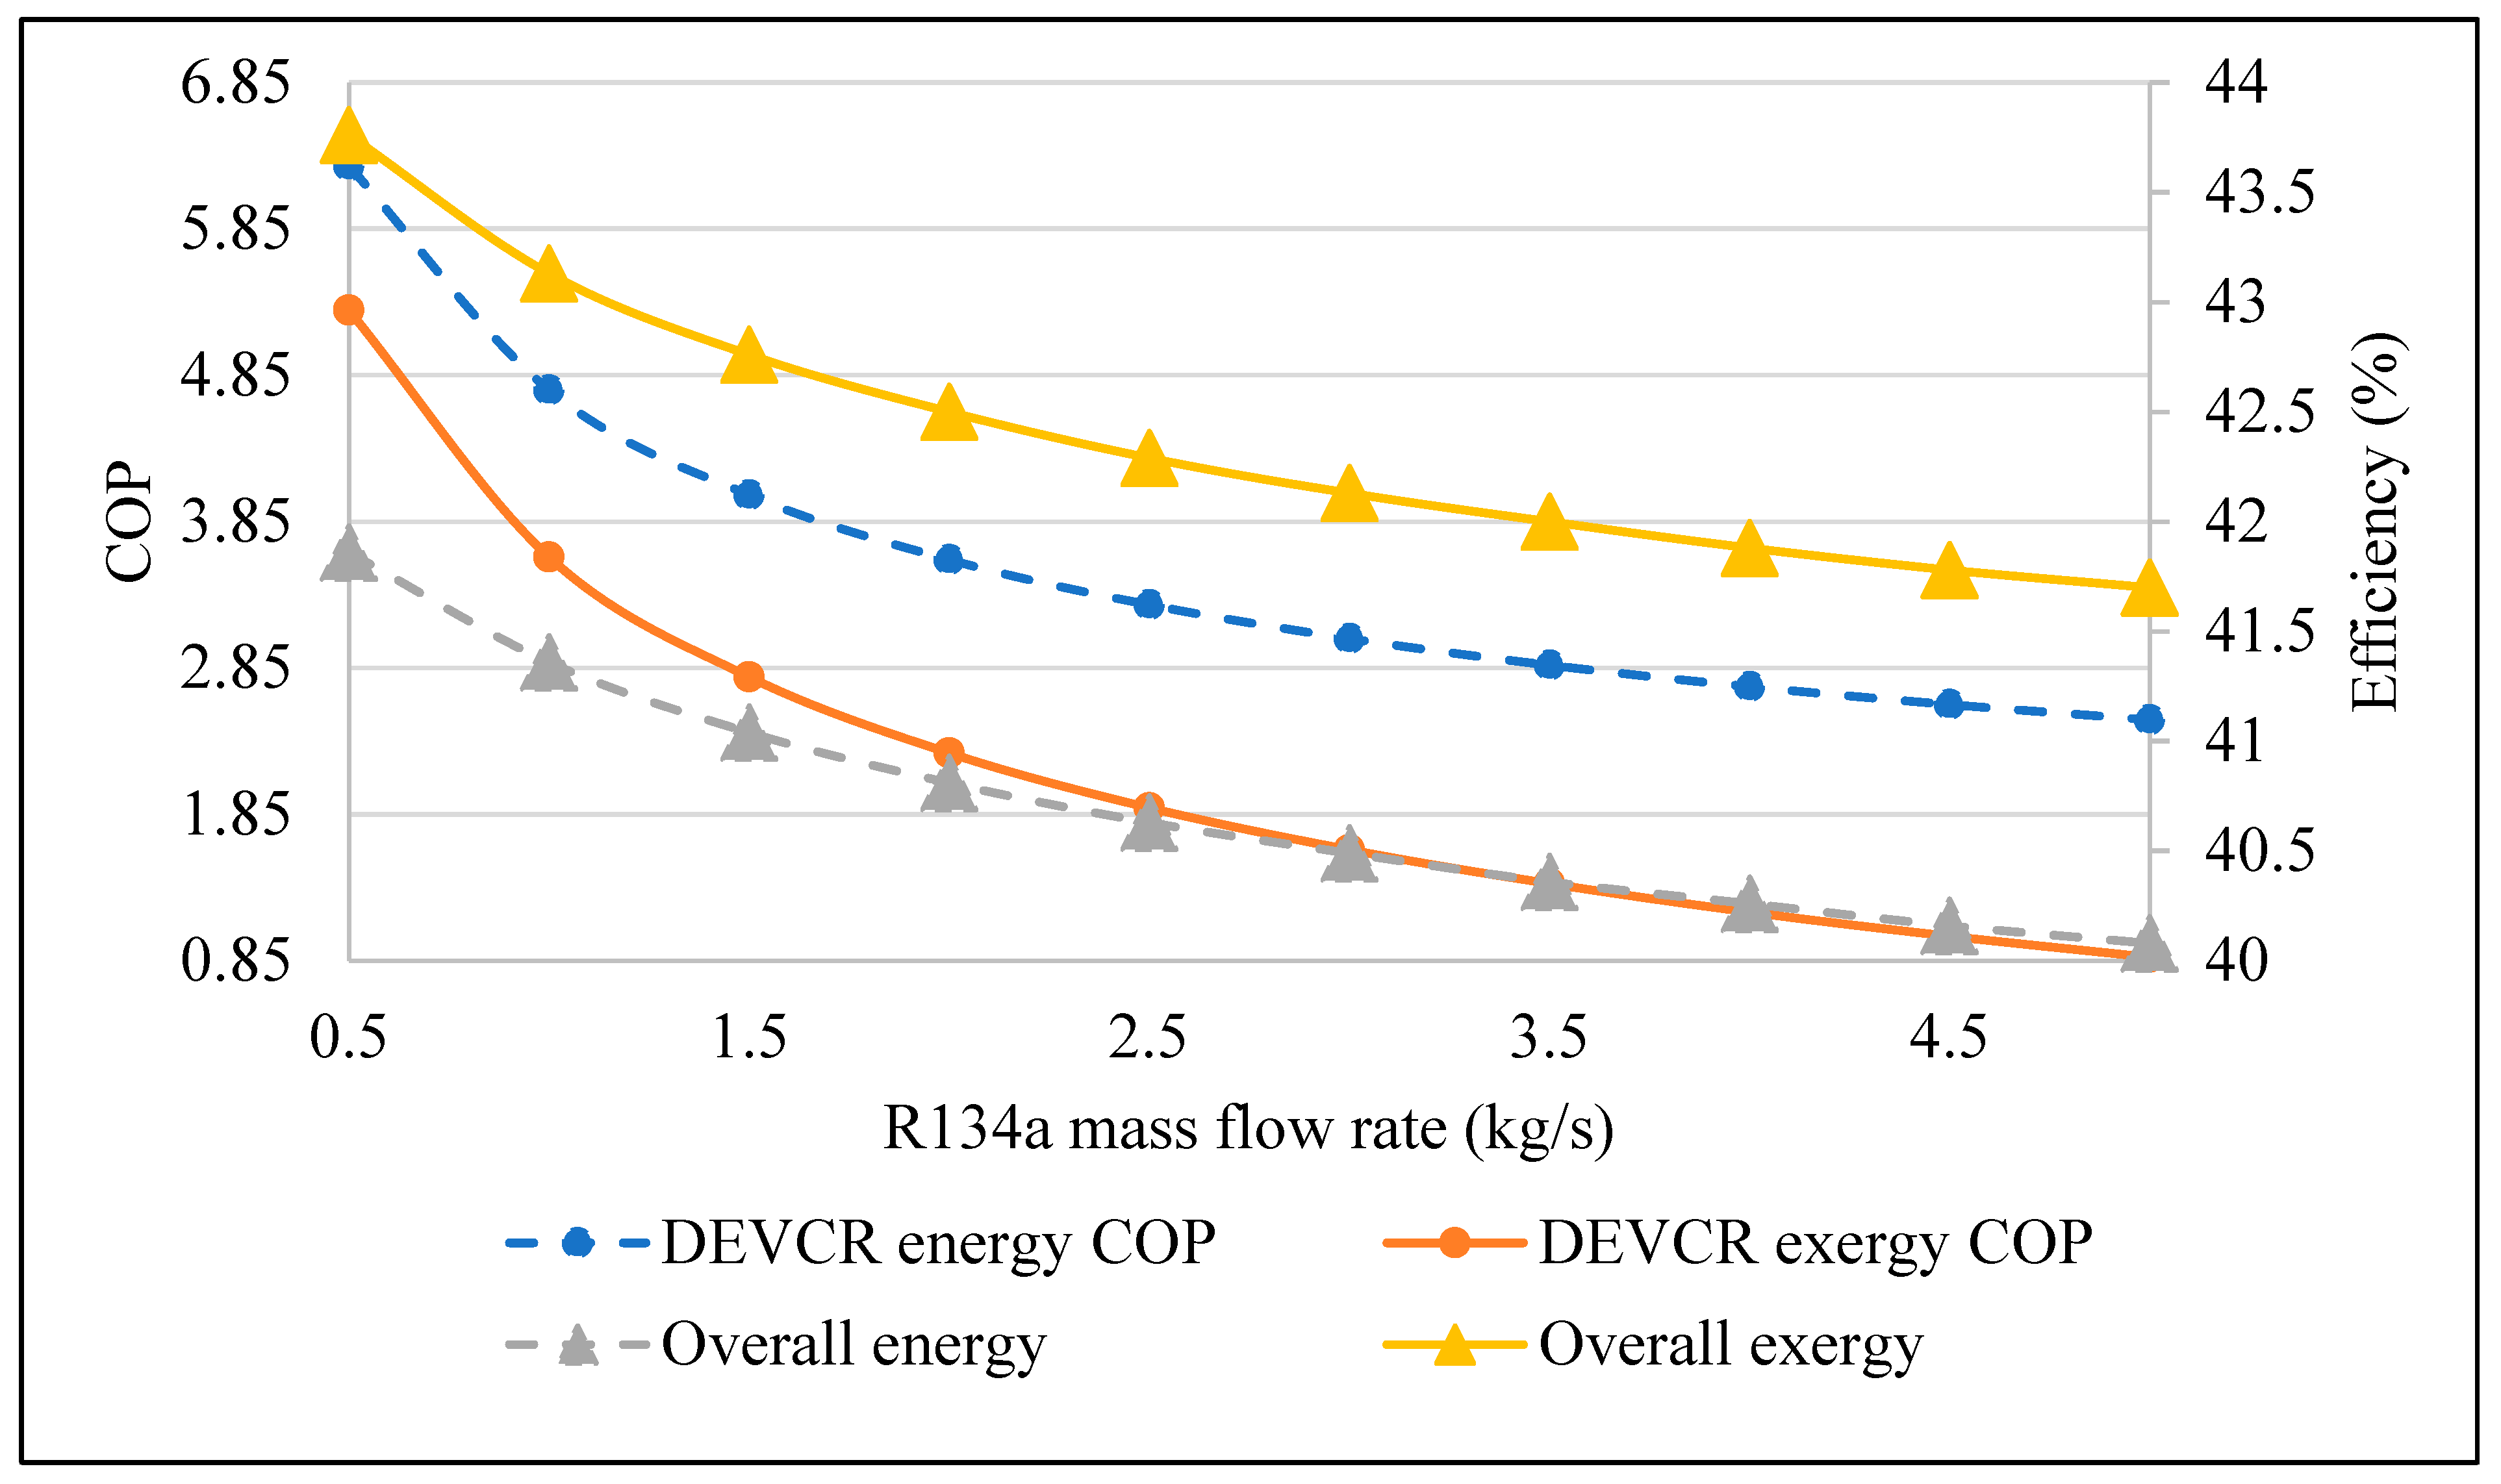
3.2.4. Dual Evaporator Vapor Compression Refrigeration (DEVCR)

Figure 6 presents the relation between the R134a mass flow rate, the energy, and the exergy coefficient of performance (COP) of the DEVCR system and the overall energy efficiency and exergy efficiency. As shown in Figure 6, when the R134a rate of mass flow increases, the exergy, energy COP, and overall efficiencies decrease. For instance, when the mass flow rate equals 1.5 kg/s, the energy COP, the exergy COP, and the overall exergy efficiency and overall energy efficiency are 4.032, 2.79, 42.76%, and 41.04%, respectively. When the mass flow rate increases to 5 kg/s, the energy COP, the exergy COP, and the overall exergy efficiency and energy efficiency decrease to 2.497, 0.875, 41.70%, and 40.08%, respectively. It is observed that when the refrigerant mass flow rate increases, the COP decreases since the power consumption rises.

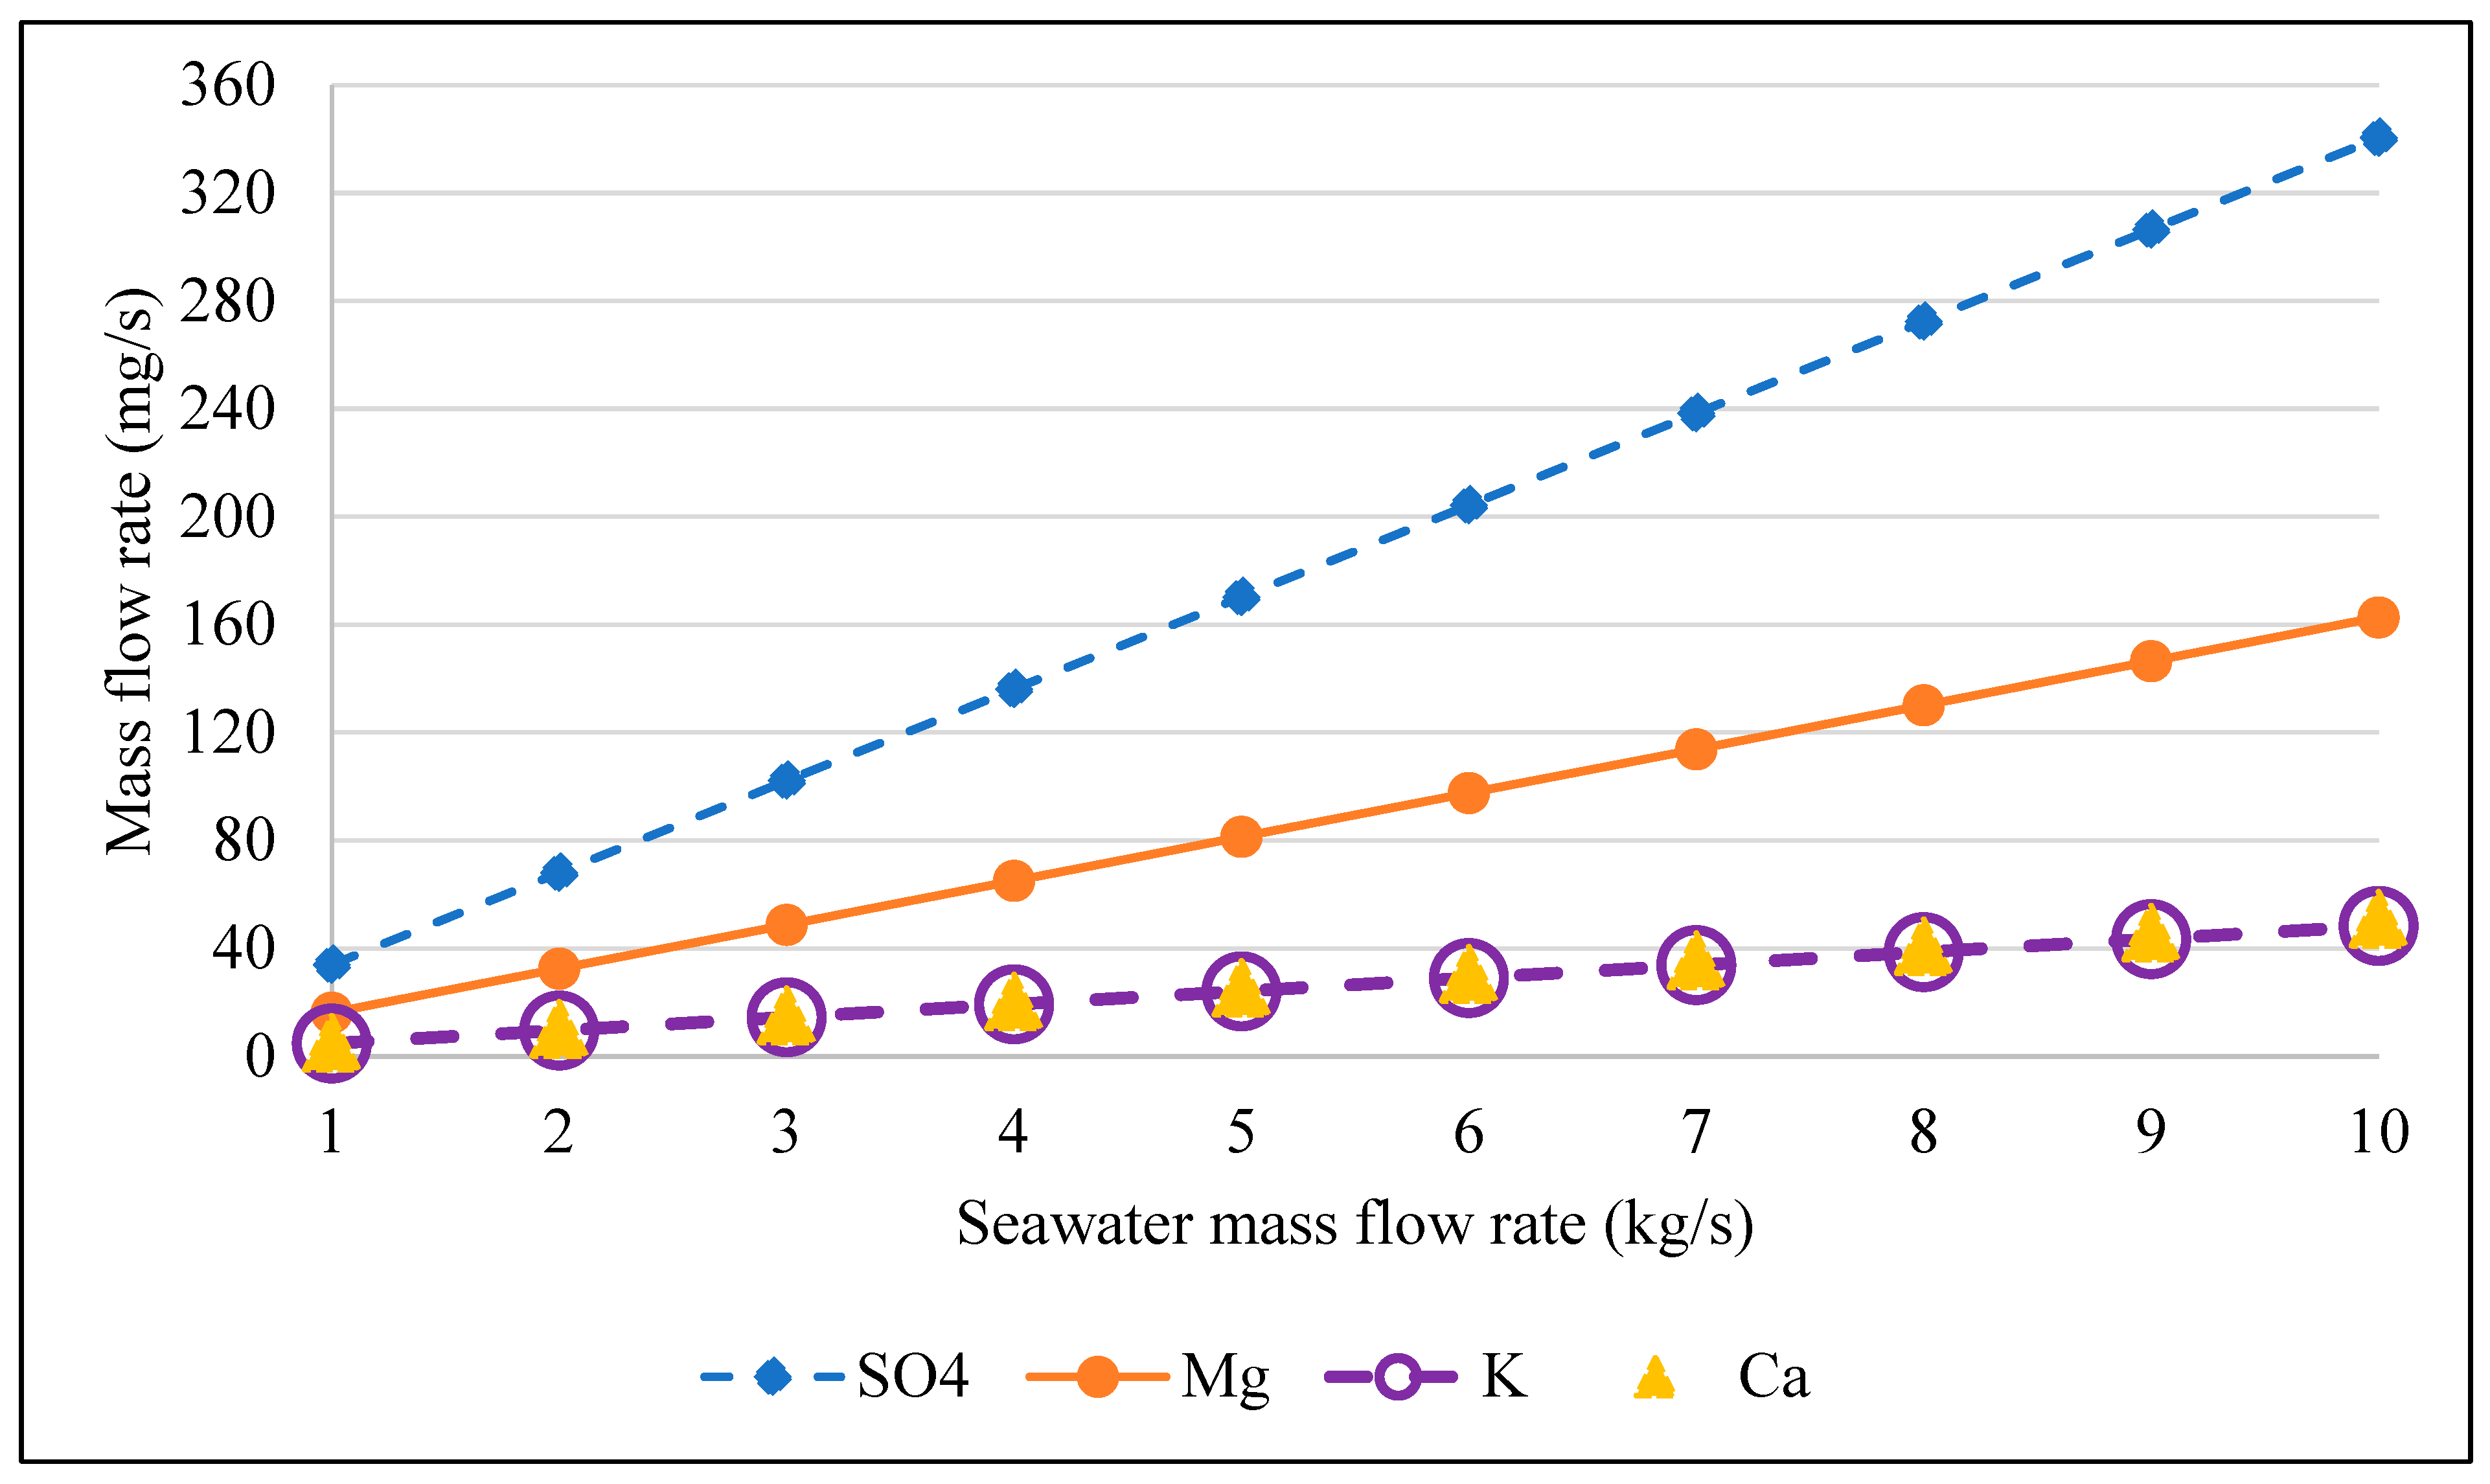
3.2.5. Direct Contact Membrane Distillation Crystallization (DCMDC-CR)

Figure S6 presents the relation between the seawater salinity and the DCMDC-CR exergy efficiency and energy efficiency at a constant mass flow rate of seawater of m ˙ 26 = 5 kg/s. As shown in Figure S6, when the seawater salinity increases, the DCMDC-CR energy efficiency increases, and the DCMDC-CR exergy efficiency decreases. For instance, when the salinity equals 4 g/kg, the DCMDC-CR energy efficiency and exergy efficiency are 63.23% and 73.84%, respectively, and when the salinity increases to 40 g/kg, the DCMDC-CR energy efficiency and exergy efficiency become 64.39% and 58.80%, respectively. The DCMDC energy efficiency and exergy efficiency should be decreased because when the feed concentration increases, the efficiency of seawater evaporation decreases due to the feed viscosity, and the penetration pressure increases, but when the CR unit is added to the DCMDC system, the recovered beneficial ions are considered in the efficiency calculations, then, when the feed salinity increases, more beneficial ions are recovered, and the DCMDC-CR energy efficiency also increases.
Figure S7 presents the relation between the CR inlet salinity and the CR cooling load at a constant rate of DCMDC-rejected brine mass flow of m ˙ 32 = 1.5 kg/s. As shown in Figure S7, when the salinity increases, the required cooling load for the CR unit decreases. For instance, when the salinity equals 35 g/kg, the required cooling load equals 334.3 kW, and when the salinity increases to 100 g/kg, the cooling load decreases to 305.6 kW. This implies that if the CR feed salinity is higher, the percentage of water atoms in the DCMDC-rejected brine is less, and the required cooling load to cool this percentage of water is lower, leading to a higher percentage of recovered ions.
Figure 7 presents the relation between the mass flow rates of recovered ions using the DCMDC-CR system and the mass flow rate of the input seawater, with a constant recovery ratio of 70% and a constant salinity of 35 g/kg. As shown in Figure 7, when input seawater’s rate of mass flow increases, recovered ions’ mass flow rate also increases. For instance, when the mass flow rate of input seawater is 2 kg/s, the rates of Magnesium, Sulfate, Potassium, and Calcium mass flow are 32.56 mg/s, 68.1 mg/s, 9.68 mg/s, and 10.21 mg/s, respectively. When the mass flow rate of input seawater is 8 kg/s, the rates of Magnesium, Sulfate, Potassium, and Calcium mass flow are 130.2 mg/s, 272.4 mg/s, 38.72 mg/s, and 40.83 mg/s, respectively, because when the salinity of seawater increases, the percentage of dissolved salts increases, and the mass flow rate of rejected brine and recovered ions also increase.
Figure S8 presents the relation between the DCMDC feed stream temperature and the DCMDC energy efficiency and exergy efficiency. When the temperature increases, the energy efficiency and exergy efficiency also increase. For instance, when the DCMDC feed temperature equals 333.15 K, the energy efficiency and exergy efficiency are 89.72% and 28.47%, respectively. When the DCMDC feed temperature increases to 351.15 K, the energy efficiency and exergy efficiency increase to 93.01% and 46.33%, respectively. Efficiencies increase because when the feed temperature increases; the seawater evaporation efficiency also increases.

4. Conclusions

This paper aims to perform thermodynamic analysis of a DCMDC-CR system to recover beneficial hydroponic ions from seawater using solar thermal energy and hydrogen-based fuel cell electricity. The DEVCR system works as an air ventilation and cooling system; the DCMDC-CR works as a fresh water and hydroponic fertilizers production system; and the CAS works as a brine management system. The primary goals of this paper are to design and investigate an integrated system for recovering advantageous hydroponic ions from the membrane distillation-rejected brine to supply the necessary nutrients for hydroponic farming as well as the other requirements, such as providing fresh water, a cooling ventilation system, and a hydroponic solution for hydroponic greenhouses. In addition, several sensitivity assessments are carried out to determine the impacts of various factors on the system, such as changing the rate of mass flow, recovery ratio, and salinity. The feasibility of supplying agricultural fertilizers, fresh water, and an air conditioning cooling system to hydroponic greenhouses with renewable energy resources is discussed in this paper. The following is a list of the main conclusions reached by this study:
  • The generated heat by a PTC solar collector is 2988 kW, with exergy efficiency and energy efficiency of 47.3% and 90%, respectively.
  • The SRC system’s generated power is 1086 kW, with exergy efficiency and energy efficiency of 34.76% and 36.34%, respectively.
  • The desired thermal and electrical powers for the DCMDC-CR subsystem to recover the following amounts of ions: SO4 = 170 mg/s, Mg = 81.28 mg/s, Ca = 25.48 mg/s, and K = 24.16 mg/s, from a seawater mass flow rate of 5 kg/s, are 2326 kW and 12.43 kW, with exergy efficiency and energy efficiency of 60.81% and 52.95%, respectively.
  • The hydrogen produced from the DCMDC-CR-rejected brine using the CAS is 0.93 g/s with an input power of 420 kW, and exergy efficiency and energy efficiency of 25.79% and 27.25%, respectively.
  • The total generated power using the SRC and PEMFC systems satisfies the total desired power of the overall system, which equals 1182.69 kW.
  • The overall exergy efficiency and energy efficiency are 41.39% and 39.80%, respectively.

Supplementary Materials

The following supporting information can be downloaded at: https://www.mdpi.com/article/10.3390/su15031876/s1, Figure S1: Turbine inlet temperature vs. HPT and LPT output power; Figure S2: Seawater mass flow rate vs. steam mass flow rate and SRC output power; Figure S3: CAS inlet temperature vs. CAS entropy generation and CAS exergy destruction rates; Figure S4: CAS inlet temperature vs. CAS power and efficiency; Figure S5: Seawater mass flow rate vs. Hydrogen mass flow rate and PEMFC output power; Figure S6: DCMDC-CR Feed stream salinity vs. DCMDC-CR energy and exergy efficiencies; Figure S7: CR inlet salinity vs. CR cooling load; Figure S8: DCMDC feed stream temperature vs. DCMDC energy and exergy efficiencies; Table S1: Balance mass and energy equations of each system; Table S2: Balance entropy and exergy balance equations for each system; Table S3: Energy and exergy efficiencies equations for each system; Table S4: Input parameters for the whole system; Table S5: Thermodynamics data for the state points; Table S6: Inputs and outputs of each and overall system.

Author Contributions

Conceptualization, Y.B.; methodology, Y.B. and R.F.A.; software, R.F.A. and Y.B.; supervision, Y.B.; writing—reviewing and editing, Y.B.; resources, Y.B.; formal analysis, R.F.A.; writing—original draft preparation, R.F.A.; investigation, R.F.A.; validation, R.F.A. and Y.B. All authors have read and agreed to the published version of the manuscript.

Funding

This research was funded by the Hamad Bin Khalifa University, Qatar Foundation, grant number (210043645). Open Access funding provided by the Qatar National Library.

Institutional Review Board Statement

Not applicable.

Informed Consent Statement

Not applicable.

Data Availability Statement

Data will be made available on request.

Conflicts of Interest

The authors declare that they have no known competing financial interests or personal relationships that could have appeared to influence the work reported in this paper.

Nomenclature

COPCoefficient of performanceCl2Chlorine
E x ˙ iExergy destruction rate (kW)
exiSpecific exergy (kJ/kg)DCMDCDirect contact membrane distillation crystallization
hiSpecific enthalpy (kJ/kg)DEVCRDual evaporator vapor compression refrigeration
IsunSolar irradiance (kW/m2)ExpV#Expansion valve
m ˙ iMass flow rate (kg/s)Evap#Evaporator
PiPressure (kPa)FWTFresh water tank
P0Ambient pressure (kPa)HSPHydroponic solution
Q ˙ iHeating rate (kW)HPTHigh-pressure turbine
ReRecovery RatioHTHeater
siSpecific entropy (kJ/kg.K)HSTHydrogen short storage tank
S ˙ gen,iEntropy generation rate (kW/K)H2Hydrogen
TiTemperature (K)KPotassium
T0Ambient temperature (K)LPTLow-pressure turbine
W ˙ iPower (kW)MC#Mixing chamber
MgMagnesium
Greek lettersN2Nitrogen
η Efficiency (%)NaOHSodium hydroxide
NaSodium
AcronymsNaClSodium chloride
BrBoilerO2Oxygen
CFWHClosed feed water heaterOFWHOpen feed water heater
Cond#CondenserP#Pump
CompCompressorPEMFCProton exchange membrane fuel cell
COCoolerPTCParabolic trough collectors
CASChlor-alkali systemPVFPolyvinylidene fluoride
CRCrystallizerRHReheating
CARChlor-alkali reactorSRCSteam Rankine cycle
CaCalciumSO4Sulfate

References

  1. Al-Thani, H.; Koç, M.; Isaifan, R.J.; Bicer, Y. A Review of the Integrated Renewable Energy Systems for Sustainable Urban Mobility. Sustainability 2022, 14, 10517. [Google Scholar] [CrossRef]
  2. Šare, A.; Krajačić, G.; Pukšec, T.; Duić, N. The Integration of Renewable Energy Sources and Electric Vehicles into the Power System of the Dubrovnik Region. Energy Sustain. Soc. 2015, 5, 27. [Google Scholar] [CrossRef] [Green Version]
  3. Abedrabboh, O.; Koç, M.; Biçer, Y. Modelling and Analysis of a Renewable Energy-Driven Climate-Controlled Sustainable Greenhouse for Hot and Arid Climates. Energy Convers. Manag. 2022, 273, 116412. [Google Scholar] [CrossRef]
  4. Méndez, C.; Bicer, Y. Integrated System Based on Solar Chimney and Wind Energy for Hybrid Desalination via Reverse Osmosis and Multi-Stage Flash with Brine Recovery. Sustain. Energy Technol. Assess. 2021, 44, 101080. [Google Scholar] [CrossRef]
  5. Security, C. on WF Sustainable Agricultural Development for Food Security and Nutrition: What Roles for Livestock? Available online: http://www.fao.org/3/am307e/am307e00.pdf (accessed on 31 August 2022).
  6. Zhang, J.; Chen, Q. The Impact of Farmland Tenure Security on China’s Agricultural Production Efficiency: A Perspective of Agricultural Production Factors. Sustainability 2022, 14, 16266. [Google Scholar] [CrossRef]
  7. Ma, L.; Long, H.; Tang, L.; Tu, S.; Zhang, Y.; Qu, Y. Analysis of the Spatial Variations of Determinants of Agricultural Production Efficiency in China. Comput. Electron. Agric. 2021, 180, 105890. [Google Scholar] [CrossRef]
  8. Gollin, D.; Parente, S.; Rogerson, R. The Role of Agriculture in Development. Am. Econ. Rev. 2002, 92, 160–164. [Google Scholar] [CrossRef] [Green Version]
  9. Jiang, X.; Chen, Y. The Potential of Absorbing Foreign Agricultural Investment to Improve Food Security in Developing Countries. Sustainability 2020, 12, 2481. [Google Scholar] [CrossRef] [Green Version]
  10. Asian Development Bank (ADB) Operational Plan for Agriculture and Natural Resources; Asian Development Bank: Mandaluyong, Philippines, 2015; Volume 3, ISBN 9789292571078.
  11. Viana, C.M.; Freire, D.; Abrantes, P.; Rocha, J.; Pereira, P. Agricultural Land Systems Importance for Supporting Food Security and Sustainable Development Goals: A Systematic Review. Sci. Total Environ. 2022, 806, 150718. [Google Scholar] [CrossRef]
  12. McNeill, K.; Macdonald, K.; Singh, A.; Binns, A.D. Food and Water Security: Analysis of Integrated Modeling Platforms. Agric. Water Manag. 2017, 194, 100–112. [Google Scholar] [CrossRef]
  13. Loganathan, P.; Naidu, G.; Vigneswaran, S. Mining Valuable Minerals from Seawater: A Critical Review. Environ. Sci. Water Res. Technol. 2017, 3, 37–53. [Google Scholar] [CrossRef] [Green Version]
  14. Yadav, A.; Labhasetwar, P.K.; Shahi, V.K. Membrane Distillation Crystallization Technology for Zero Liquid Discharge and Resource Recovery: Opportunities, Challenges and Futuristic Perspectives. Sci. Total Environ. 2022, 806, 143192. [Google Scholar] [CrossRef] [PubMed]
  15. Ali, A.; Tufa, R.A.; Macedonio, F.; Curcio, E.; Drioli, E. Membrane Technology in Renewable-Energy-Driven Desalination. Renew. Sustain. Energy Rev. 2018, 81, 1–21. [Google Scholar] [CrossRef]
  16. Li, Z.; Siddiqi, A.; Anadon, L.D.; Narayanamurti, V. Towards Sustainability in Water-Energy Nexus: Ocean Energy for Seawater Desalination. Renew. Sustain. Energy Rev. 2018, 82, 3833–3847. [Google Scholar] [CrossRef] [Green Version]
  17. Mavukkandy, M.O.; Chabib, C.M.; Mustafa, I.; Al Ghaferi, A.; AlMarzooqi, F. Brine Management in Desalination Industry: From Waste to Resources Generation. Desalination 2019, 472, 114187. [Google Scholar] [CrossRef]
  18. Ahmed, F.E.; Khalil, A.; Hilal, N. Emerging Desalination Technologies: Current Status, Challenges and Future Trends. Desalination 2021, 517, 115183. [Google Scholar] [CrossRef]
  19. González, D.; Amigo, J.; Suárez, F. Membrane Distillation: Perspectives for Sustainable and Improved Desalination. Renew. Sustain. Energy Rev. 2017, 80, 238–259. [Google Scholar] [CrossRef]
  20. Ravi, J.; Othman, M.H.D.; Matsuura, T.; Ro’il Bilad, M.; El-badawy, T.H.; Aziz, F.; Ismail, A.F.; Rahman, M.A.; Jaafar, J. Polymeric Membranes for Desalination Using Membrane Distillation: A Review. Desalination 2020, 490, 114530. [Google Scholar] [CrossRef]
  21. Wei, H.; Zhao, S.; Zhang, X.; Wen, B.; Su, Z. The Future of Freshwater Access: Functional Material-Based Nano-Membranes for Desalination. Mater. Today Energy 2021, 22, 100856. [Google Scholar] [CrossRef]
  22. Lu, Y.; Chen, J. Integration Design of Heat Exchanger Networks into Membrane Distillation Systems to Save Energy. Ind. Eng. Chem. Res. 2012, 51, 6798–6810. [Google Scholar] [CrossRef]
  23. Mohan, G.; Dahal, S.; Kumar, U.; Martin, A.; Kayal, H. Development of Natural Gas Fired Combined Cycle Plant for Tri-Generation of Power, Cooling and Clean Water Using Waste Heat Recovery: Techno-Economic Analysis. Energies 2014, 7, 6358–6381. [Google Scholar] [CrossRef] [Green Version]
  24. Bouguecha, S.; Hamrouni, B.; Dhahbi, M. Small Scale Desalination Pilots Powered by Renewable Energy Sources: Case Studies. Desalination 2005, 183, 151–165. [Google Scholar] [CrossRef]
  25. Drioli, E.; Ali, A.; Macedonio, F. Membrane Distillation: Recent Developments and Perspectives. Desalination 2015, 356, 56–84. [Google Scholar] [CrossRef]
  26. Crowe, A.T.; Davidson, M.J.; Nokes, R.I. Modified Reduced Buoyancy Flux Model for Desalination Discharges. Desalination 2016, 378, 53–59. [Google Scholar] [CrossRef]
  27. Missimer, T.M.; Maliva, R.G. Environmental Issues in Seawater Reverse Osmosis Desalination: Intakes and Outfalls. Desalination 2018, 434, 198–215. [Google Scholar] [CrossRef]
  28. Quist-Jensen, C.A.; Macedonio, F.; Drioli, E. Integrated Membrane Desalination Systems with Membrane Crystallization Units for Resource Recovery: A New Approach for Mining from the Sea. Crystals 2016, 6, 36. [Google Scholar] [CrossRef]
  29. Ye, Z.L.; Ghyselbrecht, K.; Monballiu, A.; Rottiers, T.; Sansen, B.; Pinoy, L.; Meesschaert, B. Fractionating Magnesium Ion from Seawater for Struvite Recovery Using Electrodialysis with Monovalent Selective Membranes. Chemosphere 2018, 210, 867–876. [Google Scholar] [CrossRef]
  30. Barros, L.B.M.; Andrade, L.H.; Drewes, J.E.; Amaral, M.C.S. Investigation of Electrodialysis Configurations for Vinasse Desalting and Potassium Recovery. Sep. Purif. Technol. 2019, 229, 115797. [Google Scholar] [CrossRef]
  31. Lu, K.J.; Cheng, Z.L.; Chang, J.; Luo, L.; Chung, T.S. Design of Zero Liquid Discharge Desalination (ZLDD) Systems Consisting of Freeze Desalination, Membrane Distillation, and Crystallization Powered by Green Energies. Desalination 2019, 458, 66–75. [Google Scholar] [CrossRef]
  32. Susanto, H. Towards Practical Implementations of Membrane Distillation. Chem. Eng. Process. Process Intensif. 2011, 50, 139–150. [Google Scholar] [CrossRef]
  33. Tunc, C.M.; Groth, A.M. Sustainable Integrated Membrane Contactor Process for Water Reclamation, Sodium Sulfate Salt and Energy Recovery from Industrial Effluent. Desalination 2011, 283, 187–192. [Google Scholar] [CrossRef]
  34. Lu, H.; Wang, J.; Wang, T.; Wang, N.; Bao, Y.; Hao, H. Crystallization Techniques in Wastewater Treatment: An Overview of Applications. Chemosphere 2017, 173, 474–484. [Google Scholar] [CrossRef] [PubMed]
  35. Quoilin, S.; Van Den Broek, M.; Declaye, S.; Dewallef, P.; Lemort, V. Techno-Economic Survey of Organic Rankine Cycle (ORC) Systems. Renew. Sustain. Energy Rev. 2013, 22, 168–186. [Google Scholar] [CrossRef] [Green Version]
  36. Faisal Ahmed, S.; Khalid, M.; Vaka, M.; Walvekar, R.; Numan, A.; Khaliq Rasheed, A.; Mujawar Mubarak, N. Recent Progress in Solar Water Heaters and Solar Collectors: A Comprehensive Review. Therm. Sci. Eng. Prog. 2021, 25, 100981. [Google Scholar] [CrossRef]
  37. Mir, N.; Bicer, Y. Thermodynamic Modeling of a Combined Photo-Electrodialysis-Chloralkali System for Sustainable Desalination. Desalination 2021, 499, 114822. [Google Scholar] [CrossRef]
  38. ChemicalSafetyFacts Uses, Benefits, and Safety of Chlorine|Chemical Safety Facts. Available online: https://www.chemicalsafetyfacts.org/chlorine/ (accessed on 12 February 2022).
  39. NIOSH Sodium Hydroxide|NIOSH|CDC. Available online: https://www.cdc.gov/niosh/topics/sodium-hydroxide/default.html (accessed on 9 February 2022).
  40. Das, H.S.; Chowdhury, M.F.F.; Li, S.; Tan, C.W. Fuel Cell and Hydrogen Power Plants. Hybrid Renew. Energy Syst. Microgrids 2021, 313–349. [Google Scholar] [CrossRef]
  41. F-Chart-Software EES: Engineering Equation Solver|F-Chart Software: Engineering Software. Available online: https://fchartsoftware.com/ees/mastering-ees.php%0Ahttp://fchartsoftware.com/ees/%0Ahttp://www.fchart.com/ees/ (accessed on 8 November 2021).
  42. Çengel, Y.A.; Boles, M.A. Thermodynamics: An Engineering Approach; McGraw-Hill: New York, NY, USA, 2015; ISBN 9780073398174. [Google Scholar]
  43. Pektezel, O.; Acar, H.I. Energy and Exergy Analysis of Combined Organic Rankine Cycle-Single and Dual Evaporator Vapor Compression Refrigeration Cycle. Appl. Sci. 2019, 9, 5028. [Google Scholar] [CrossRef] [Green Version]
  44. Kerme, E.D.; Orfi, J. Exergy-Based Thermodynamic Analysis of Solar Driven Organic Rankine Cycle. J. Therm. Eng. 2015, 1, 192–202. [Google Scholar] [CrossRef]
  45. Ali, A.; Quist-Jensen, C.A.; Macedonio, F.; Drioli, E. Application of Membrane Crystallization for Minerals’ Recovery from Produced Water. Membranes 2015, 5, 772–792. [Google Scholar] [CrossRef] [Green Version]
  46. HSC Chemistry. Available online: https://www.hsc-chemistry.com/webshop (accessed on 20 April 2022).
  47. Khan, S.A.; Bicer, Y.; Koç, M. Design and Analysis of a Multigeneration System with Concentrating Photovoltaic Thermal (CPV/T) and Hydrogen Storage. Int. J. Hydrogen Energy 2020, 45, 3484–3498. [Google Scholar] [CrossRef]
  48. NASA. NASA Salinity: Salinity Explained. Available online: https://salinity.oceansciences.org/science-salinity.htm (accessed on 9 December 2021).
  49. WA Government Understanding Salinity. Available online: https://www.water.wa.gov.au/water-topics/water-quality/managing-water-quality/understanding-salinity%0A (accessed on 8 February 2022).
  50. Altaee, A.; AlZainati, N. Novel Thermal Desalination Brine Reject-Sewage Effluent Salinity Gradient for Power Generation and Dilution of Brine Reject. Energies 2020, 13, 1756. [Google Scholar] [CrossRef] [Green Version]
  51. İnci, M.; Türksoy, Ö. Review of Fuel Cells to Grid Interface: Configurations, Technical Challenges and Trends. J. Clean. Prod. 2019, 213, 1353–1370. [Google Scholar] [CrossRef]
  52. Pandey, M.; Gogoi, T. Energy and Exergy Analysis of a Reheat Regenerative Vapor Power Cycle. Int. J. Emerg. Technol. Adv. Eng. 2013, 3, 427–434. [Google Scholar]
  53. Oyedepo, S.O.; Fakeye, B.A.; Mabinuori, B.; Babalola, P.O.; Leramo, R.O.; Kilanko, O.; Dirisu, J.O.; Udo, M.; Efemwenkiekie, U.K.; Oyebanji, J.A. Thermodynamics Analysis and Performance Optimization of a Reheat—Regenerative Steam Turbine Power Plant with Feed Water Heaters. Fuel 2020, 280, 118577. [Google Scholar] [CrossRef]
  54. Ullah, R.; Khraisheh, M.; Esteves, R.J.; McLeskey, J.T.; AlGhouti, M.; Gad-el-Hak, M.; Vahedi Tafreshi, H. Energy Efficiency of Direct Contact Membrane Distillation. Desalination 2018, 433, 56–67. [Google Scholar] [CrossRef]
  55. Cao, H.; Mao, Y.; Wang, W.; Gao, Y.; Zhang, M.; Zhao, X.; Sun, J.; Song, Z. Thermal-Exergy Efficiency Trade-off Optimization of Pressure Retarded Membrane Distillation Based on TOPSIS Model. Desalination 2022, 523, 115446. [Google Scholar] [CrossRef]
  56. Al-Obaidani, S.; Curcio, E.; Macedonio, F.; Di Profio, G.; Al-Hinai, H.; Drioli, E. Potential of Membrane Distillation in Seawater Desalination: Thermal Efficiency, Sensitivity Study and Cost Estimation. J. Memb. Sci. 2008, 323, 85–98. [Google Scholar] [CrossRef]
  57. Ali, E. Energy Efficient Configuration of Membrane Distillation Units for Brackish Water Desalination Using Exergy Analysis. Chem. Eng. Res. Des. 2017, 125, 245–256. [Google Scholar] [CrossRef]
  58. Luo, Y.; Shi, Y.; Cai, N. Bridging a Bi-Directional Connection between Electricity and Fuels in Hybrid Multienergy Systems. Hybrid Syst. Multi-Energy Netw. Futur. Energy Internet 2021, 41–84. [Google Scholar] [CrossRef]
  59. Arshad, A.; Ali, H.M.; Habib, A.; Bashir, M.A.; Jabbal, M.; Yan, Y. Energy and Exergy Analysis of Fuel Cells: A Review. Therm. Sci. Eng. Prog. 2019, 9, 308–321. [Google Scholar] [CrossRef]
  60. Montazerinejad, H.; Fakhimi, E.; Ghandehariun, S.; Ahmadi, P. Advanced Exergy Analysis of a PEM Fuel Cell with Hydrogen Energy Storage Integrated with Organic Rankine Cycle for Electricity Generation. Sustain. Energy Technol. Assess. 2022, 51, 101885. [Google Scholar] [CrossRef]
Figure 1. Study procedure flow chart.
Sustainability 15 01876 g001
Figure 2. Proposed integrated renewable energy system with ion recovery for hydroponic agriculture. (Refer to Table S5 for stream details).
Sustainability 15 01876 g002
Figure 3. Calculated efficiencies of the subsystems.
Sustainability 15 01876 g003
Figure 4. Turbine inlet temperature vs. SRC and overall energy and exergy efficiencies.
Sustainability 15 01876 g004
Figure 5. CAS inlet mass flow rate vs. CAS power and overall efficiency.
Sustainability 15 01876 g005
Figure 6. R134a mass flow rate vs. DEVCR and overall energy and exergy efficiencies.
Sustainability 15 01876 g006
Figure 7. Seawater mass flow rate vs. recovered ions mass flow rate.
Sustainability 15 01876 g007
Table 1. Recovered nutrients’ mass flow rate and salinity.
State # m ˙ SO4 (mg/s) m ˙ Mg (mg/s) m ˙ Ca (mg/s) m ˙ K (mg/s) Sal (g/kg)
3334.8316.655.224.950.5
3417081.2825.4824.160.5
39135.264.6320.2619.210.5
Table 2. Specifications and capacities of each unit.
UnitTypeCapacity
Power generationReheat-regenerative steam Rankine cycle (SRC)1.33 kg/s (Feed water mass flow rate)
1086 kW (Net power generated)
Fuel cellProton exchange membrane fuel cell (PEMFC)0.00083 kg/s (Feed Hydrogen mass flow rate)
0.0067 kg/s (Feed Oxygen mass flow rate)
70.62 kW (Power generated)
Desalination and ions recoveryDirect contact membrane distillation crystallization system (DCMDC-CR)5 kg/s (Feed seawater)
1235 kW (Operating cooling load)
1092 kW (Operating heating load)
Brine managementChlor-alkali system (CAS)420 kW (Operating power)
0.6 kg/s (Feed NaCl)
Solar energyParabolic trough collectors (PTC) solar collectors5976 m2 (Total surface area of PTC)
0.5 kW/m2 (Solar irradiance)
2988 kW (Thermal power generated)
Cooling and air conditioningDual evaporator vapor compression refrigeration system (DEVCR)1562.8 kW (Absorbed cooling load)
2.16 COP (Energy coefficient of performance)
7.4 kg/s (Feed R134a)
GreenhouseHydroponic farming10 × 20 × 3 m (Greenhouse dimensions)
4.4 kg/s (Feed hydroponic solution)
Disclaimer/Publisher’s Note: The statements, opinions and data contained in all publications are solely those of the individual author(s) and contributor(s) and not of MDPI and/or the editor(s). MDPI and/or the editor(s) disclaim responsibility for any injury to people or property resulting from any ideas, methods, instructions or products referred to in the content.

