Article

Statistical Modeling of Traffic Flow in Commercial Clusters Based on a Street Network

1
School of Architecture, South China University of Technology, Guangzhou 510640, China
2
College of Coastal Agricultural Sciences, Guangdong Ocean University, Zhanjiang 524000, China
*
Author to whom correspondence should be addressed.
Sustainability 2023, 15(3), 1832; https://doi.org/10.3390/su15031832
Submission received: 23 November 2022 / Revised: 12 January 2023 / Accepted: 16 January 2023 / Published: 18 January 2023

Abstract

:
Traffic flow characterizes vitality in commercial clusters, and the accurate prediction of traffic flow based on the street network has significant implications for street planning and vitality regulation in commercial clusters. However, existing studies are limited by certain problems, such as difficulty in obtaining traffic flow data and carrying out technical methods. The purpose of this study is to use urban physical data to study traffic flow so as to quickly and effectively estimate the traffic flow in commercial clusters. This study takes the street networks of 100 commercial clusters in China as the research objects and classifies them into three forms according to the theory of “A city is not a tree”. Taking typical commercial clusters in these three forms as the research unit, space syntax was used to study five metrics of street network connectivity, and integration (Dn) was selected as a proxy variable for street network connectivity. The results show that the traffic flow in the three forms of commercial clusters can be predicted using the multiple regression models established based on the three metrics of integration, the traffic level, and the operation cycle. This study establishes the connection between the street network form and the traffic flow, which enables the possibility of obtaining the traffic flow of commercial clusters quickly and effectively. For areas with poorly structured urban data, the results can help urban planning administrators to predict the potential economic attributes using easily accessible street network data in commercial clusters.

1. Introduction

A commercial cluster is an urban functional area that integrates commodity purchase, marketing display, entertainment experience, commercial offices, and regional logistics, rendering it the fifth generation of merchandising markets in China. Studies have shown that improving the number of visits to commercial stores, increasing the assortment of businesses, and balancing the homogeneity of commercial vitality can contribute to the effective operation of a commercial cluster [1,2,3]. The commercial vitality of a mature commercial cluster needs to be well-balanced, and store visits need to be evenly distributed among the commercial clusters [4,5]. Visits to stores are mainly dependent on traffic flow, and the higher the traffic flow is, the higher the number of shoppers and the more expeditious the turnover of merchandise on-site will be [6,7]. Therefore, the study of traffic flow in commercial clusters can help to achieve the stable and rapid development of commercial clusters.
Existing research on traffic flow mainly focuses on three aspects: the detection of traffic flow, analysis of traffic flow characteristics, and research on urban problems based on traffic flow. (1) Two main methods are applied to capture traffic flow patterns in order to establish predictive analysis models. The first method, based on ultrasonic and infrared sensing, GPS, etc., records the number of vehicles passing through a certain segment in unit time as the traffic flow of that segment by transmitting the driving signal to the terminal through the vehicle [8,9,10]. The other is the prediction of traffic flow statistics based on images. Since 2012, CNNs (convolutional neural networks) have been successful in the field of target detection, enabling traffic flow detection to enter the era of convolutional neural network methods. In recent years, the representative algorithms have become YOLO, SSD, the R-CNN target detection method and SORT, and DeepSort multi-target tracking algorithms [11,12]. (2) A large number of studies have been conducted on traffic flow based on four dimensions: stochasticity, periodicity, spatiotemporal characteristics, and environmental characteristics. The aim of this research was to explain the spatiotemporal variations in, and pattern of, traffic flow, to control the error rate, and to improve the accuracy of prediction results through empirical studies [13,14,15]. (3) Using the detection results of the traffic flow, including information on the traffic flow, vehicle travel speed, and urban spatial distribution, researchers aimed to study the problem of urban carbon emissions, urban traffic, and urban infrastructure services and facilities [16,17,18]. The abovementioned studies on traffic flow are limited in the following ways: (1) They require the completeness of the original data, making it difficult to obtain traffic information for a wide range of areas in locations with low data openness, resulting in prediction errors. (2) Although the study of the characteristics of traffic flow itself improves the accuracy of traffic flow prediction, the number of variables to be considered renders the calculation complicated and unsuitable for projects requiring fast prediction with low accuracy. (3) Due to the poor openness of urban big data and other factors, most studies only take into account the actual traffic flow factors to study urban problems, ignoring the study of the urban physical environment and socio-economic and time-space factors as variables.
The street network is the skeleton of the city and is one source of easily accessible data on the physical form of the city. Studies have been conducted to confirm the relevance of street networks to the development of cities and that street networks directly affect the behavior of people and vehicles, including the three following studies [19,20]. Firstly, street networks were analyzed using social network analysis and betweenness centrality [21,22]. The degree, closeness, and betweenness centrality were found to have a strong correlation with the population density and street density, and this was used to predict the co-ridership rate of online vehicles and evaluate the resilience of street networks [23,24]. Secondly, the social network analysis method was introduced to the investigation of buildings and physical spaces using space syntax, targeting building interior spaces in the early stage. It improved significantly after 2006, with the focus shifting to street networks. For example, some scholars used spatial syntax to predict the spread of the COVID virus phenomenon in Hong Kong and the touring paths of tourists in Chinese historical districts [25,26,27,28]. Thirdly, spatial design network analysis (sDNA) was used to adapt the calculation method and data structure of SNA and (space syntax) to develop two indicators of closeness and betweenness [29]. Notably, sDNA can analyze the accessibility of street networks and calculate the potential of streets for pedestrian, bicycle, motor vehicle, and public transport use. This approach has been applied to different spatial networks, such as transit rail, urban street, and 3D pedestrian spaces [30,31]. This suggests that the use of SNA street networks is suitable for the study of socioeconomic attributes and transportation on the urban scale, and space syntax is suitable for the study of behavior triggered by human perceptions of the city on the urban mesoscopic scale, while sDNA has better potential for the study of urban micro-scale, three-dimensional spaces.
Although a series of studies on street network connectivity and spatial perception have been conducted by many scholars using various methods, few studies have been conducted on the traffic flow and economic attributes of cities using their connectivity characteristic metrics. Thus, the purpose of this study is to explore the traffic flow of commercial clusters using easily accessible street network data in an attempt to provide urban planners with a simple and effective method that can be used to predict the traffic flow in the region at the early stage of planning and during the operation period and to adjust the street network according to the results in order to achieve the stable and rapid development of commercial clusters. Therefore, the main contents of this paper include the following: (1) taking commercial clusters as the research object, we studied street network connectivity characteristics based on the space syntax method to simplify its connectivity characteristic indicators and (2) using the simplified indicators and street network attributes, we constructed a multiple regression model to predict the traffic flow.

2. Research Methods

In this study, 100 business clusters in China were analyzed. Firstly, they were typed, and three kinds of representatives were identified as the study units. Secondly, the traffic flow in the region was measured, and data on the street network in the region were obtained. Furthermore, the street network connectivity was analyzed using the space syntax method, and the connectivity index was simplified. Finally, a prediction model was developed, and a multiple regression model (Figure 1) was constructed with the traffic flow as the dependent variable and the output of the indicator from the space syntax and the street network properties as the independent variables.

2.1. Research Unit

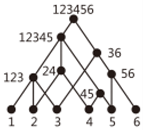
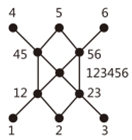
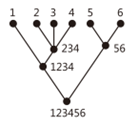
In his article “A City Is Not a Tree”, Professor Christopher Alexander applied mathematical aggregation models to analyze the structural characteristics of “natural cities” and “man-made cities” and then summarized two important types of cities, the “semi-grid” and “tree”, and highlighted that a city with vitality should take the shape of a semi-grid. Based on the abovementioned classical theories, the top 100 commercial clusters were studied in terms of their annual turnover using the China Commodity Market Statistical Yearbook 2021. Based on Christopher Alexander’s A New Theory of Urban Design, the street network development time sequence and topological graphic characteristics of the 100 commercial clusters were typified (see Appendix A, Table A1) and classified into semi-grid structures, grid structures, and tree-shaped structures [32].
The semi-grid structure is a commercial cluster based on the gradual expansion of the completed urban area, extending the original urban street network structure. The grid structure is a commercial cluster integrated into the urban master plan and developed according to the attributes of the urban planning site, relying on the existing urban planning street. The tree structure is similar to the grid cluster, which belongs to the same form of integrated planning, but its street system is self-contained and merges into the urban traffic through specific entrances and exits.
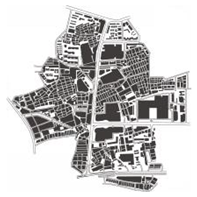
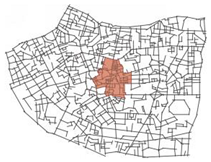
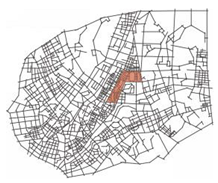
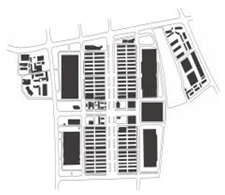
Samples with similar construction scales, relatively good operation and complete street network data were selected from the three forms of commercial clusters for the study. Considering the impact of the global system on the local system, local street network analysis generally focuses on the global street network system. Thus, with reference to the street network traveling time and coverage area in the “Code for Transport Planning on Urban street”, finally, it was determined that the study sample would be the center, and the model boundary and buffer area of the urban traffic axis within a 5 km radius were established as the street network analysis range (Table 1) [33].

2.2. Data

Street Network data were obtained from the Open Street map on 1 January 2021, the street medians were extracted using ArcGIS, and the extracted street medians were analyzed using space syntax [34].
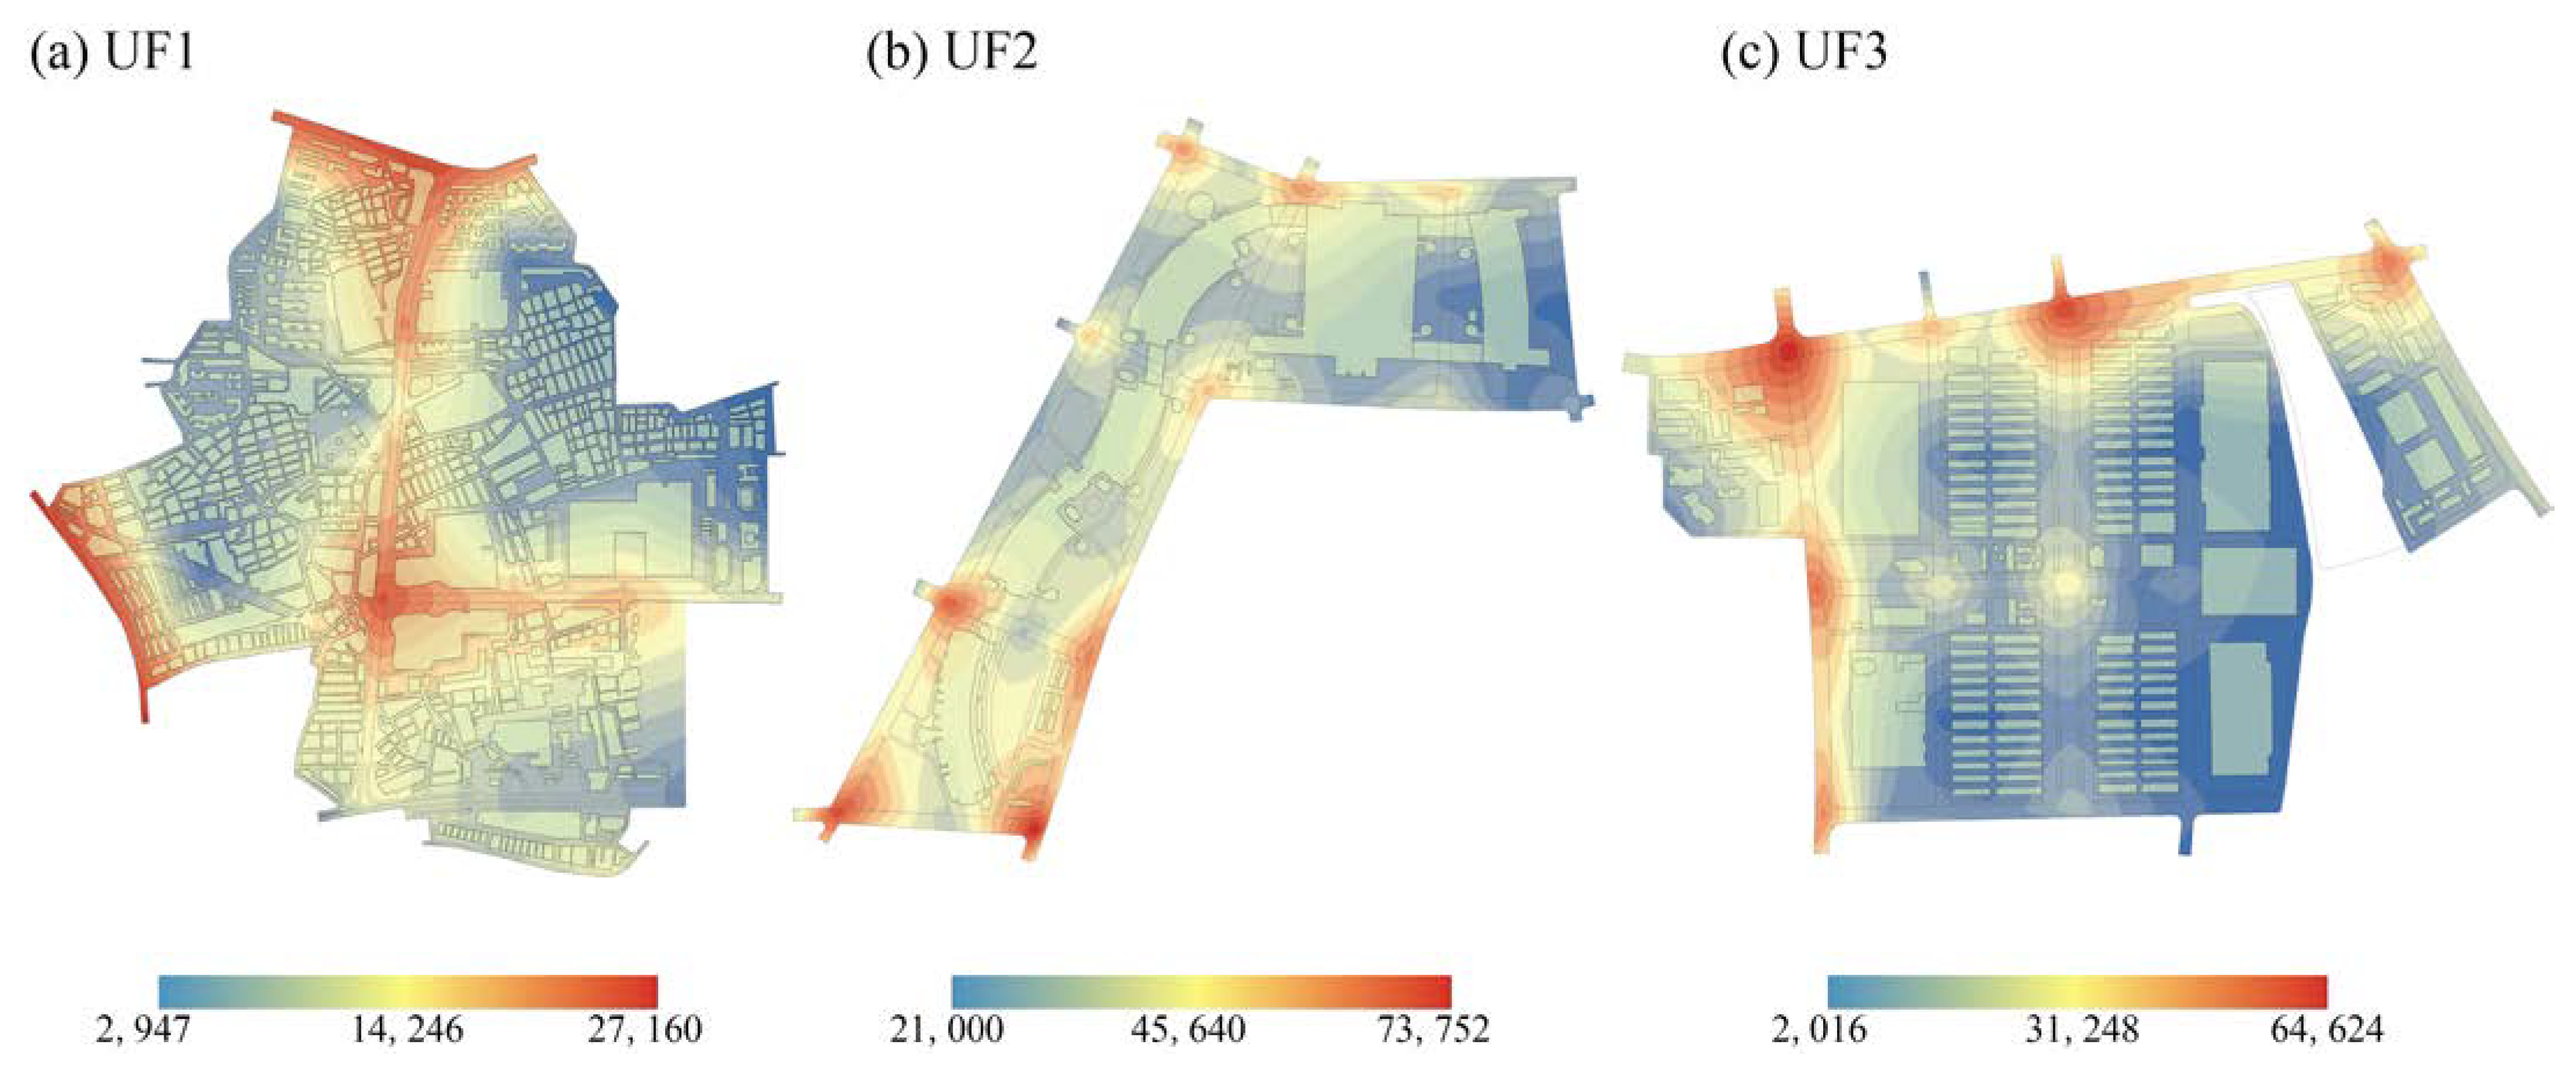
As for the actual measurement survey of the traffic flow, there were a total of 54 investigators who were divided into 3 groups and assigned to 18 street sections of UF1, 15 street sections of UF2, and 21 street sections of UF3 (the location of the surveyed street sections were as follows: the outer-circulation urban main and secondary arterial streets, and the inner-circulation cluster arterial and major feeder streets). From 18 January 2021 to 24 January 2021 (Monday to Sunday), we recorded video of the traffic flow on the corresponding roadway during business hours (9 am–2 am, 2 pm– pm) daily (8 times daily, including 4 times in the morning and 4 times in the afternoon, amounting to 8 business hours, with a single time duration of 15 min and a total of 120 min per day) (see Appendix B, Figure A1). The video was uploaded to OpenCV (a loading package), and the actual measured traffic flow of the three samples amounted to a total of 1,180,997. The traffic volume of the sub-sections was uploaded to Arc GIS to build a database of traffic information, and the distribution of the traffic volume in the region was simulated by spatial interpolation using the natural neighborhood method [35] (Figure 2).

3. Results

3.1. Descriptive Statistics Analysis

The spatial syntax covers the following four indicators of street network connectivity: depth, which is generally the topological grouping relationship of any one space with other spaces and is evaluated by the average depth value Mn; integration, where the global integration degree Dn is used to measure the integration degree of the study area, which reflects the closeness of the connection with other spaces centered on a certain space and its attractiveness with respect to traffic; accessibility, expressed by Rn, which reflects the ease of access of space in relation to other spaces, and connectivity, expressed by Cn, which is the number of other street sections linked to a certain street section, according to which the greater the number of linked sections is, the better the connectivity will be. Table 2 depicts the descriptive statistics of the abovementioned metrics, and it can be seen that there are differences in each characteristic between the different forms of clusters. These differences are as follows below.
The UF1 semi-grid cluster has average location conditions, being adjacent to the urban core (Dn_Average = 1.491) and closely connected to the traffic space (Mn_Average = 4.282), and has average connectivity (Cn_Average = 3.642), an excessive concentration of traffic diversion pressure, poor external and internal system circulation, and mainly pedestrian traffic supplemented with vehicular traffic. However, it has the best accessibility (Rn_Median = 0.862), and the commercial vitality radiates from the cluster center, which will gradually decrease its commercial value. The UF2 grid-shaped cluster has average location conditions, being adjacent to the urban core area (Dn_Average = 1.441) and containing the area with the closest traffic spatial linkage (Mn_Max = 6.93). The connectivity is average, (Cn_Average = 3.891), and the traffic diversion capacity is relatively balanced. The system works through both external circulation and internal circulation and is dominated by vehicular traffic and supplemented with pedestrian traffic. The accessibility is average (Rn_Median = 0.798), with a poor radiation ability in terms of its commercial vitality and a balanced distribution of commercial values. The UF3 tree cluster has homogeneous traffic spatial links and good locational conditions (Dn_Average = 2.054) and is located in the urban nucleus, but it has weak spatial links (Mn_Std Dev = 0.49, Mn_Average = 3.01), and the best connectivity (Cn_Average = 5.471), together with the best traffic dispersal capacity. The system is dominated by internal circulation and supplemented with external circulation, where vehicular traffic and pedestrian traffic operate together, but the accessibility is mediocre (Rn_Median = 0.721), the distribution of commercial vitality is uneven, and the conformity ability is poor.
Meanwhile, comprehensibility reflects users’ degree of difficulty in establishing the overall spatial structure through local spatial experience, i.e., the ability to perceive the place in a minor way. Comprehensibility influences the commercial traffic and pedestrian flow, enabling one to establish a cognitive map, quickly locate the location, and create efficient commercial radiation. The space syntax theory specifies that the comprehensibility index can be measured by the correlation between global and local variables. The Rn-Cn scatter plots (Figure 3) of the three samples were plotted separately to establish the fitting equation and obtain the regression coefficient R2, which reflects the degree of coupling between the global and local variables in each space of the whole system, i.e., the spatial comprehensibility. The theoretical definition of the comprehensibility range is as follows: the R2 < 0.5 local space fails to reflect the global space; the 0.5 < R2 < 0.7 local space reasonably reflects the global space, and the 0.7 < R2 < 1.0 local space relatively effectively reflects the global space. The UF1 semi-grid cluster and UF2 grid cluster space are simple to understand (UF1: R2 = 0.518, UF2: R2 = 0.582). Users can establish a global spatial cognitive map by traveling through the local space and clearly need to access the commercial area, where it is not easy to become lost during travel, which is conducive to the radiation of commercial vitality. The UF3 tree cluster space is more difficult to understand (R2 = 0.362), and it is difficult for travelers to comprehend the space in its entirety. It is difficult for travelers to perceive the space they inhabit, which causes confusion in terms of spatial perception. Therefore, it is easy to feel lost during travel, which is not conducive to the spread of commercial, the distribution of commercial vitality is uneven, and the conformity ability is poor.

3.2. Construct Mode

3.2.1. Correlation Analyses

Table 3 shows the correlations between the variables, and it can be seen that Dn, Rn, Mn, and Cn show strong correlations among the three forms. Thus, it is necessary to downscale these variables in the prediction model. Dn shows a significant negative correlation with Rn in UF1 and significant positive correlations with Mn and Cn. Dn shows significant positive correlations with Rn and Cn in UF2 and a significant negative correlation with Mn. Dn shows significant positive correlations with Rn and Cn in UF3 and a significant positive correlation with Cn in UF3. In UF2, Dn shows significant positive correlations with Rn and Cn and a significant negative correlation with Mn. In UF3, Dn shows a significant positive correlation with Rn, a weak positive correlation with Cn, and a significant negative correlation with Mn. In addition, compared to Rn, Mn, and Cn, Dn correlates more strongly with the traffic flow in all three forms. Therefore, Dn can be selected as a proxy variable to measure the street network connectivity, and because Dn is moderately correlated with the vehicle flowrate and is not considered significant, two variables, the traffic class and operational cycle, are introduced to improve the accuracy of the prediction in order to improve the reliability of the prediction.

3.2.2. Multiple Regression

According to the results of the correlation analysis, the street attribute metrics can be introduced as variables to build the regression model. According to the “Code for Transport Planning on Urban Roads” [33], there are four levels of UF1, with values ranging from 0 to 3, and three levels of UF2 and UF3, with values ranging from 0 to 2. The different retail outlets in the professional clusters have different operation cycles. Thus, their ability to attract consumers also varies greatly. The operation cycles of professional retail centers can be divided into four stages: the formation period, cultivation period, growth period, and maturity period. The operational cycle of the professional clusters is introduced to correct the integration values of the closely linked axes using the field research samples UF1, UF2, and UF3 to measure the commercial operations within the clusters and assign them values ranging from 0 to 3.
Based on the correlation analysis and the results of the proxy variable study, the three independent variables, the integration degree (X1), traffic level (X2), and operation period (X3) were selected to establish a multiple linear regression model based on the dependent variable, the traffic flow (Y). The regression models of the three forms show that the significant coefficient p-values are less than 0.05, and all of them have good statistical significance, among which the fit of samples UF1 and UF3 is higher, with R2 = 0.880 and R2 = 0.834, while the fit of sample UF2 is within a reasonable range, with R2 = 0.748. For the different types of business clusters, there are certain differences in the influence weight of the three independent variables. The influence weight of integration (4.273) is more significant in the semi-networked clusters, the influence weights of the traffic level (3.778) and operation period (3.619) are comparable and both are better than the integration degree in the grid clusters, and the influence weight of the operation period (3.698) is more significant in the tree clusters (Table 4).
The results of the multiple regression equation indicate that the space syntax global integration degree variable can be used as a proxy variable for the structure of the traffic system in the spatial study of the professional clusters and can be used for the effective prediction of the traffic volume on the regional scale by taking into account factors such as the road system level and commercial operating conditions.

4. Discussion

This paper reports on statistical modeling research on clustered commercial traffic flow based on urban road networks. In the study, we established a statistical traffic flow prediction model by introducing the global integration degree, traffic level, operation period, etc. This technical method has the characteristics of high efficiency, ideal accuracy, and easy implementation. Unlike road monitoring detection, CNN, and other big-data-driven traffic forecasting, the main differences of this research method are as follows: (1) In terms of the forecasting time, this statistical model is suitable for the forecasting of long-term traffic distribution trends, unlike short-term traffic forecasting, which relies on real-time traffic data acquisition in urban areas. (2) In terms of the forecasting application, it is applicable to pre-traffic planning and has positive effects. (3) In terms of the implementation difficulty, this research technique is suitable for non-traffic information disciplines and reduces the data barriers caused by the difficulty in obtaining diversified data.
This study has certain shortcomings. Firstly, the space syntax method is based on topological relationships that are used to calculate the variables related to road network connectivity, which does not fully reflect the actual traffic situation, while the real traffic aggregation problem is affected by the natural environment and weather elements, representing a complex problem. Therefore, the accuracy of this research method for short-term traffic flow prediction needs to be improved. Secondly, it is not only the global integration degree, traffic level, and operation cycle that determine the traffic flow of commercial clusters. Rather, the organic integration of various other elements and functions should be considered when planning commercial clusters. Furthermore, the data statistics reported in this paper are limited by the research scope, and it is not possible to obtain comprehensive statistics on the best domestic operation of 100 samples to verify the statistical model and further improve the prediction accuracy of the model.
This study focused only on traffic forecasting for commercial clusters, and the research’s accuracy could be improved by supplementing and verifying the research cases. To enhance the applicability of the study, future research could be extended to other functional clusters in the city so as to introduce more widely applicable parameters, allowing one to further control the research errors.

5. Conclusions

This paper established a typology with commercial clusters as the research object, explored the radiating capacity of the commercial vitality of each type based on easily accessible street network data, and used multiple regression models built with three indicators: the global integration degree, traffic level, and operation period. These provided relatively good prediction results for the traffic flow of three different forms of commercial clusters (UF1: R2 = 0.880; UF2: R2 = 0.748; UF3: R2 = 0.834). The main conclusions of the study are as follows:
(1)
The traffic flow of commercial clusters can be predicted using the following method: the study objectives are classified and matched according to the classification results in order to construct multiple regression models for the prediction using three easily accessible metrics: integration (Dn), the traffic class, and the operation cycle (Table 4).
(2)
Compared with the average depth, accessibility, and connectivity, global integration is more strongly correlated with traffic flow, while global integration shows a positive correlation with traffic flow.
(3)
Based on the comparison of street network connectivity indexes, the urban location conditions of the three types of commercial clusters are comparable, the semi-grid and grid types have better traffic accessibility, and the radiation energy of commercial vitality is better than that of the tree clusters. Moreover, it is easier to establish the spatial orientation of the customer flow.
The results of this paper offer the possibility of evaluating commercial cluster planning in countries or regions with unsound socio-economic data and have a certain guidance value for the planning of urban street networks and the layout of commercial areas. On the one hand, when carrying out commercial land use planning, consideration needs to be given to the selection of areas with high global integration so as to prioritize the commercial layout. Additionally, for areas with high structural attributes and low commercial vitality, the road networks or layouts of ancillary functions should be planned and adjusted in accordance with the actual situation. On the other hand, the spatial differences in traffic flow between different forms should be combined to improve the planning of the street network layout.

Author Contributions

Conceptualization, W.Z. and H.G.; methodology, W.Z., H.G. and L.Y.; software, W.Z.; investigation, W.Z.; data curation, W.Z. and H.G.; writing—original draft preparation, W.Z.; writing—review and editing, L.Y.; visualization, W.Z. and L.Y.; supervision, W.Z.; project administration, W.Z. All authors have read and agreed to the published version of the manuscript.

Funding

The 2022 project of the 14th Five-Year Plan for the Development of Philosophy and Social Sciences in Guangzhou City: 2022GZYB54.

Data Availability Statement

Not applicable.

Acknowledgments

We thank the 52 undergraduates from the School of Architecture and Urban and Rural Planning of Zhuhai College of Science and Technology who participated in the traffic flow survey.

Conflicts of Interest

The authors declare no conflict of interest.

Appendix A

Table A1. List of 100 commercial clusters in China.
Commercial ClusterForms
1Shanghai Jinsu ShichangSemilattice
2Zhangjiagang Jonglong yuanLattice
3Changshu Fuzhuang ChengSemilattice
4Suzhou Sichou ChengLattice
5Binzhou Heibai Tei chengSemilattice
6Yiwu Guoji ShangmaoTree
7Suzhou Huagong Jiaoyi ZhongxinLattice
8Dalian Shiyou Jiaoyi SuoTree
9Shaoxin Qingfang ChengTree
10Baoding Baigou ChengLattice
11Tianjin Xiyou Jinshu ShichangTree
12Nantong Zhihao ShichangLattice
13Chengduo Guoji ShangmaoTree
14Jinhua Keji Wujin JituanLattice
15Taian Gangcai ShichangSemilattice
16Ningbo Suliao ChengSemilattice
17Beijing Xingfa ZhongxinSemilattice
18Shanghai Shihua Jiaoyi ZhongxinSemilattice
19Wuxi Dongfang Gangcai ChengLattice
20Shijiazhuang Xinhua ShangmaoSemilattice
21Nantong Guoji Jiafang ChengTree
22Shanxin Qingfang ChengLattice
23Wuxi Gangkou Wuliu YuanSemilattice
24Anshan Xiliu Fuzhuang ChengLattice
25Zhengzhou Guoji Nongye ZhongxinTree
26Beijing Ershou Qiche ShichangLattice
27Wuxi Jinsu Cailiao ShichangSemilattice
28Tianjin Zhongchu Fazhan ShichangTree
29Shenyan Wuai Shangpin ShichangSemilattice
30Wuxi Nanfang Buxiugang ShichangLattice
31Shijiazhuang Santiao ShichangSemilattice
32Hefei Huishang Gangcai ShichangLattice
33Hangzhou Jinshu Cailiao ShichangSemilattice
34Yuncheng Yudu ShichangSemilattice
35Shanghai Shiyou Jiaoyi GongsiSemilattice
36Linyi Wangbao Gangcai ShichangSemilattice
37Huanan Kuangwu Wuliu ShichangLattice
38Wuxi Huadong Shihua ShichangTree
39Zhenjiang Guoji Gangtie ZhongxinLattice
40Suzhou Fangzhi Yuanliao ShichangSemilattice
41Chongqin Chaotianmen ShichangTree
42Dalian Shangpin ChengSemilattice
43Tianjin Konggang Qiche ShichangLattice
44Shanxin Qingfang Gongmao YuanLattice
45Nanchang Hongcheng ShichangLattice
46Changsha Gaoqiao ShichangLattice
47Nanjing Zhongcai Nongye ShichangLattice
48Anqing Guangcai ShichangLattice
49Langfang Xianghe Jiaju ChengTree
50Haozhou Zhongyao Jiaoyi ZhongxinLattice
51Changsha Hongxin Nongye ShichangLattice
52Beijing Nongfu Changpin ShichangLattice
53Xuchang Xinqu Gangcai ShichangSemilattice
54Chanzhou Lingjiatang ShichangLattice
55Guangzhou Zhongda ShichangSemilattice
56Hangzhou Xiaoshan Shangye ChengSemilattice
57Wuxi Zhaoshang Chengshi ShichangLattice
58Changsha Gangtie ShichangLattice
59Fuzhou Nanfang Gangcai ZhongxinTree
60Changzhou Fangzhi Touzhi ZhongxinLattice
61Guangzhou Guocai Pifa ShichangLattice
62Chongqin Guangyinqiao NongmaoSemilattice
63Hangzhou Chengbei Jinshu ShichangSemilattice
64Xingjiang Hengyuan Wuliu YuanTree
65Foshan Xiqiao Qingfang ChengSemilattice
66Changsha Sanxiang Nanhu ShichangSemilattice
67Beijing Jingxiu Nongye ShichangSemilattice
68Liuzhou Shengchang Zhiliao ShichangLattice
69Guangzhou Yuzhu Jiancai ChengLattice
70Qingdao Shucai Pifa ShichangSemilattice
71Shangqiu Nongchangpin ZhongxinTree
72Suzhou Nanhuan ShichangLattice
73Wuxi Guolian Jinsu Cailiao ShichangTree
74Tongxiang Yangmao ShichangSemilattice
75Liaocheng Dadong Gangguang ShichangLattice
76Shenzhen Haiji Nongmao ShichangLattice
77Ningbo Meitang Jiaoyi ShichangSemilattice
78Beijing Chengbei Shangpin ShichangLattice
79LuoYang Guanlin ShichangTree
80Xuzhou Bali Gangtie ShichangSemilattice
81Chongqin Julong Gangcai ShichangLattice
82Wuhan Baisha Nongmao ShichangLattice
83Kunming Luoshi Guoji ChengTree
84Shanghai Changqiao Gangcai ShichangSemilattice
85Shenzhen Huanan ChengLattice
86Shanghai Gaoqiao Zhongbiao ZhongxinTree
87Ningbo Haiye Huagong ShichangSemilattice
88Chongqin Lengchu Wuliu ZhongxinLattice
89Hefei Zhougu Du Nongmao ZhongxinLattice
90Tianjin Wangding Pifa ShichangLattice
91Jimo Fuzhuang Pifa ShichangTree
92Fuzhou Haixia Changpin ShichangLattice
93Xinjiang Jiuding Shenghe ShichangSemilattice
94Guanghou Shengdi Pige chengLattice
95Yantai Sanzhan ShichangSemilattice
96Xuzhou Xuanwu Jituan ShichangSemilattice
97Changsha Zhongnan Qiche ZhongxinLattice
98Changzhou Suliao Huagong ShichangTree
99Huzhou Jili Tongzhuang ShichangLattice
100Hangzhou Fangzhi Caigou ChengLattice

Appendix B

Figure A1. Traffic flow statistics.
Sustainability 15 01832 g0a1

References

  1. Nanditha, A.; Sanjay Kumar, V. Development of trip attraction models for the core area of thiruvananthapuram city. In Recent Advances in Civil Engineering; Springer: Berlin/Heidelberg, Germany, 2023; pp. 659–669. [Google Scholar]
  2. Wu, C.; Ye, Y.; Gao, F.; Ye, X. Using street view images to examine the association between human perceptions of locale and urban vitality in Shenzhen, China. Sustain. Cities Soc. 2023, 88, 104291. [Google Scholar] [CrossRef]
  3. Lin, J.; Zhuang, Y.; Zhao, Y.; Li, H.; He, X.; Lu, S. Measuring the non-linear relationship between three-dimensional built environment and urban vitality based on a random forest model. Int. J. Environ. Res. Public Health 2023, 20, 734. [Google Scholar] [CrossRef] [PubMed]
  4. Tang, S.; Ta, N. How the built environment affects the spatiotemporal pattern of urban vitality: A comparison among different urban functional areas. Comput. Urban Sci. 2022, 2, 39. [Google Scholar] [CrossRef] [PubMed]
  5. Xu, G.; Su, J.; Xia, C.; Li, X.; Xiao, R. Spatial mismatches between nighttime light intensity and building morphology in Shanghai, china. Sustain. Cities Soc. 2022, 81, 103851. [Google Scholar] [CrossRef]
  6. Pascucci, F.; Nardi, L.; Marinelli, L.; Paolanti, M.; Frontoni, E.; Gregori, G.L. Combining sell-out data with shopper behaviour data for category performance measurement: The role of category conversion power. J. Retail. Consum. Serv. 2022, 65, 102880. [Google Scholar] [CrossRef]
  7. Formánek, T.; Sokol, O. Location effects: Geo-spatial and socio-demographic determinants of sales dynamics in brick-and-mortar retail stores. J. Retail. Consum. Serv. 2022, 66, 102902. [Google Scholar] [CrossRef]
  8. Brown, M.J.; Scott, D.M.; Páez, A. A spatial modeling approach to estimating bike share traffic volume from gps data. Sustain. Cities Soc. 2022, 76, 103401. [Google Scholar] [CrossRef]
  9. Khattak, K.S.; Minallah, N.; Khan, Z.H.; Khan, M.A.; Khan, A.N.; Ayaz, S. Sensing technologies for traffic flow characterization: From heterogeneous traffic perspective. J. Appl. Eng. Sci. 2022, 20, 29–40. [Google Scholar]
  10. Singh, S.; Santhakumar, S.M. Platoon-based impact assessment of heavy-duty vehicles on traffic stream characteristics of highway lanes under mixed traffic environment. Int. J. Intell. Transp. Syst. Res. 2022, 20, 29–45. [Google Scholar] [CrossRef]
  11. Zhuang, W.; Cao, Y. Short-term traffic flow prediction based on cnn-bilstm with multicomponent information. Appl. Sci. 2022, 12, 8714. [Google Scholar] [CrossRef]
  12. Kuchkarov, T.; Hamzayev, J.; Allamuratova, Z. Tracking the Flow of Motor Vehicles on the Roads with Yolov5 and Deepsort Algorithms; Bguir: Minsk, Republic of Belarus, 2022. [Google Scholar]
  13. Cao, S.; Wu, L.; Wu, J.; Wu, D.; Li, Q. A spatio-temporal sequence-to-sequence network for traffic flow prediction. Inf. Sci. 2022, 610, 185–203. [Google Scholar] [CrossRef]
  14. Zhang, Y.; Cheng, Q.; Liu, Y.; Liu, Z. Full-scale spatio-temporal traffic flow estimation for city-wide networks: A transfer learning based approach. Transp. B Transp. Dyn. 2022, 1–27. [Google Scholar] [CrossRef]
  15. Wang, P.; Zhang, Y.; Hu, T.; Zhang, T. Urban traffic flow prediction: A dynamic temporal graph network considering missing values. Int. J. Geogr. Inf. Sci. 2022, 1–28. [Google Scholar] [CrossRef]
  16. Dong, Y.; Xu, J.; Liu, X.; Gao, C.; Ru, H.; Duan, Z. Carbon emissions and expressway traffic flow patterns in China. Sustainability 2019, 11, 2824. [Google Scholar] [CrossRef] [Green Version]
  17. Yao, Z.; Wang, Y.; Liu, B.; Zhao, B.; Jiang, Y. Fuel consumption and transportation emissions evaluation of mixed traffic flow with connected automated vehicles and human-driven vehicles on expressway. Energy 2021, 230, 120766. [Google Scholar] [CrossRef]
  18. Yang, J.; Han, Y.; Wang, Y.; Jiang, B.; Lv, Z.; Song, H. Optimization of real-time traffic network assignment based on iot data using dbn and clustering model in smart city. Future Gener. Comput. Syst. 2020, 108, 976–986. [Google Scholar] [CrossRef]
  19. Li, S. One-way traffic organization optimization method of microcirculation road network in handan city. In Advances in Urban Engineering and Management Science Volume 1; CRC Press: Boca Raton, FL, USA, 2023; pp. 637–643. [Google Scholar]
  20. Prakash, C.; Navandar, Y.V.; Golakiya, H.D.; Dhamaniya, A. Analysis of the impact of pedestrian crossing activity on the traffic characteristics at urban midblock sections using simulation technique. In Recent Advances in Transportation Systems Engineering and Management; Springer: Berlin/Heidelberg, Germany, 2023; pp. 569–584. [Google Scholar]
  21. Wang, M.; Chen, Z.; Mu, L.; Zhang, X. Road network structure and ride-sharing accessibility: A network science perspective. Comput. Environ. Urban Syst. 2020, 80, 101430. [Google Scholar] [CrossRef]
  22. Jayasinghe, A.; Sano, K.; Abenayake, C.C.; Mahanama, P. A novel approach to model traffic on road segments of large-scale urban road networks. MethodsX 2019, 6, 1147–1163. [Google Scholar] [CrossRef]
  23. Al-Saaidy, H.J.; Alobaydi, D. Studying street centrality and human density in different urban forms in Baghdad, Iraq. Ain Shams Eng. J. 2021, 12, 1111–1121. [Google Scholar] [CrossRef]
  24. Sharifi, A. Resilient urban forms: A review of literature on streets and street networks. Build. Environ. 2019, 147, 171–187. [Google Scholar] [CrossRef]
  25. Huang, B.-X.; Chiou, S.-C.; Li, W.-Y. Accessibility and street network characteristics of urban public facility spaces: Equity research on parks in fuzhou city based on gis and space syntax model. Sustainability 2020, 12, 3618. [Google Scholar] [CrossRef]
  26. Yao, Y.; Shi, W.; Zhang, A.; Liu, Z.; Luo, S. Examining the diffusion of coronavirus disease 2019 cases in a metropolis: A space syntax approach. Int. J. Health Geogr. 2021, 20, 17. [Google Scholar] [CrossRef] [PubMed]
  27. Xu, Y.; Rollo, J.; Jones, D.S.; Esteban, Y.; Tong, H.; Mu, Q. Towards sustainable heritage tourism: A space syntax-based analysis method to improve tourists’ spatial cognition in chinese historic districts. Buildings 2020, 10, 29. [Google Scholar] [CrossRef] [Green Version]
  28. Yang, C.; Qian, Z. Street network or functional attractors? Capturing pedestrian movement patterns and urban form with the integration of space syntax and MCDA. Urban Des. Int. 2022, 1–16. [Google Scholar] [CrossRef]
  29. Cooper, C.H.; Chiaradia, A.J. Sdna: 3-d spatial network analysis for gis, cad, command line & python. SoftwareX 2020, 12, 100525. [Google Scholar]
  30. Zhang, L.; Chiaradia, A. How to design the metro network for maximal accessibility potential? A comparative analysis of shanghai. In 24th ISUF International Conference, Valencia, Spain, 27–29 Spetember 2017; Book of Papers; Editorial Universitat Politècnica de València: Valencia, Spain, 2018; pp. 1223–1231. [Google Scholar]
  31. Zhang, L.; Chiaradia, A.; Zhuang, Y. A configurational accessibility study of road and metro network in Shanghai, China. In Recent Developments in Chinese Urban Planning; Springer: Berlin/Heidelberg, Germany, 2015; pp. 219–245. [Google Scholar]
  32. Alexander, C. A city is not a tree. In The Urban Design Reader; Routledge: Abingdon, UK, 2013; pp. 172–186. [Google Scholar]
  33. Ministry of Housing and Urban-Rural Development of the People’s Republic of China. Code for Transport Planning on Urban Road; Ministry of Housing and Urban-Rural Development of the People’s Republic of China: Beijing, China, 1995.
  34. Chang, D.; Penn, A. Integrated multilevel circulation in dense urban areas: The effect of multiple interacting constraints on the use of complex urban areas. Environ. Plan. B Plan. Des. 1998, 25, 507–538. [Google Scholar] [CrossRef] [Green Version]
  35. Wu, Z.; Huang, M.; Zhao, A. In Urban traffic planning and traffic flow prediction based on ulchis gravity model and dijkstra algorithm. J. Phys. Conf. Ser. 2021, 1972, 012080. [Google Scholar] [CrossRef]
Figure 1. Study Design.
Sustainability 15 01832 g001
Figure 2. Interpolation analysis of traffic flow.
Sustainability 15 01832 g002
Figure 3. Rn-Cn scatter coordinates.
Sustainability 15 01832 g003
Table 1. Topology forms and study sample.
FormsTopology GraphicsSampleStreet Network(5 km Buffer)
Semilattice Sustainability 15 01832 i001Sustainability 15 01832 i002
UF1, Guangzhou Zhongda
Sustainability 15 01832 i003
Lattice Sustainability 15 01832 i004Sustainability 15 01832 i005
UF2, Yiwu Guoji Shangmao
Sustainability 15 01832 i006
TreeSustainability 15 01832 i007Sustainability 15 01832 i008
UF3, Shenzhen Huanan Cheng
Sustainability 15 01832 i009
Table 2. Central tendency and statistical dispersion of the metrics.
Forms (Street Segments)MetricsMinMaxAverageStd DevMedian
UF1 (n = 145)Mn2.471 6.155 4.282 0.734 4.313
Dn0.901 3.162 1.491 0.363 1.427
Rn0.142 7.603 1.007 0.831 0.862
Cn1.000 27.00 3.6422.643 3.000
UF2 (n = 123)Mn2.601 6.932 4.231 0.713 4.414
Dn0.757 2.752 1.441 0.335 1.412
Rn0.144 4.381 1.002 0.663 0.798
Cn1.000 18.000 3.891 2.312 3.000
UF3 (n = 84)Mn2.021 4.872 3.014 0.492 3.015
Dn1.012 3.813 2.054 0.525 1.962
Rn0.112 7.903 1.008 1.582 0.721
Cn1.000 31.0005.471 5.752 4.000
Table 3. Correlation analysis of each metric.
FormsMetricsDnRnMnCnTraffic Flow
UF1Dn1−0.884 **0.973 ***0.994 **0.407
Rn−0.884 **1−0.949 **−0.907 **−0.109
Mn0.973 ***−0.949 **10.9870.079
Cn0.994 **−0.907 **0.98710.062
Traffic Flow0.407−0.1090.0790.0621
UF2Dn10.898 ***−0.979 **0.721 *0.510
Rn0.898 ***1−0.4060.900 **0.344
Mn−0.979 **−0.4061−0.600−0.504
Cn0.721 *0.900 **−0.60010.279
Traffic Flow0.5100.344−0.5040.2791
UF3Dn10.783 *−0.916 ***0.3580.613 *
Rn0.783 *10.3690.910 **−0.577
Mn−0.916 ***0.3691−0.4510.112
Cn0.3580.910 **−0.4511−0.652 *
Traffic Flow0.613 *−0.5770.112−0.652 *1
* p < 0.05, ** p < 0.01, *** p < 0.001
Table 4. Multiple regression results.
VariableCoefficientWeightpInterceptR2
UF1X117.6174.2730.001−14.4280.880
X22.2362.7030.017
X33.0513.5170.003
UF2X120.9962.4120.03360.2140.748
X27.5823.7780.003
X36.7553.6190.004
UF3X136.1552.3160.033−35.5900.834
X24.3722.3850.280
X35.0853.6980.002
Disclaimer/Publisher’s Note: The statements, opinions and data contained in all publications are solely those of the individual author(s) and contributor(s) and not of MDPI and/or the editor(s). MDPI and/or the editor(s) disclaim responsibility for any injury to people or property resulting from any ideas, methods, instructions or products referred to in the content.