1. Introduction
Hydraulic conductivity function (HCF), which defines the relationship between hydraulic conductivity and soil suction, is commonly used as the input information for seepage analysis [
1]. Different researchers have proposed various models for the estimation of the HCF from a soil-water characteristic curve (SWCC). Leong and Rahardjo [
2] indicated that, among those models, the theorical background of the statistical method was most rigorous. As a result, the statistical method has been widely used for the estimation of the HCF from a SWCC by different researchers (Childs and Collis-George [
3], Mualem [
4], Fredlund et al. [
5,
6], Zhai and Rahardjo [
7], and Zhai et al. [
8]). Popa et al. [
9], Zelenakova et al. [
10,
11], and Elewa et al. [
12] have studied the spatial distribution of groundwater and the surface runoff in the rural area. A correct SWCC and HCF are crucial for the evaluation of the groundwater table and surface runoff.
It is known that the water content and hydraulic conductivity (HC) corresponding to the suction in the drying process are higher than those in the wetting process; this phenomenon is commonly referred to as “hysteresis”. The measurement of wetting HCF is more difficult than the measurement of wetting SWCC. Therefore, the wetting HCF is commonly estimated rather than directly measured. As the statistical method has been widely used for the estimation of the drying HCF from the drying SWCC, this method is also adopted to estimate the wetting HCF from the wetting SWCC (HCFswcc,w). However, the accuracy of this approach has not been verified in past studies. In this note, the limitations of the statistical method in the estimation of the wetting HCF from the wetting SWCC are explained. Subsequently, both HCFswcc,w and wetting HCFPSDF, which define the estimated wetting HCF based on the concept of the pore-size distribution function (PSDF), were adopted in the numerical simulation for the one-dimensional (1D) infiltration into the soil column. The results from the models with both HCFswcc,w and wetting HCFPSDF are compared with the measurement data from a soil column test.
2. Materials and Methods
Childs and Collis-George [
3] were the first to propose the statistical method for the estimation of HCF from SWCC. Zhai et al. [
13] indicated that there were four major assumptions adopted in the statistical method: (i) the SWCC is analogous to the pore-size distribution function (PSDF); (ii) the pores in the soil are simplified as a series of capillary tubes with different sizes; (iii) the capillary tubes are randomly distributed in soil; and (iv) the capillary tubes are randomly connected with each other. Zhai and Rahardjo [
7] proposed a general equation for the statistical method, as shown in Equation (1), for the estimation of the HCF from SWCC. Substituting the SWCC equation, the HCF can be calculated directly from the fitting parameters of those SWCC equations.
where
k(ψx) = calculated the HC with given suction of
ψx;
k(ψref) = HC at the reference point(i.e.,
ψ = ψref);
ψref = the suction corresponding to the reference point;
S(ψref) = degree of saturation corresponding to the reference point,
ψx;
ψi = the soil suction in the drying process,
S(ψx);
S(ψi)= degree of saturation corresponding to the soil suctions of
ψx and
ψi, respectively; and
N = the total number of the divided SWCC segments.
Zhai and Rahardjo and Zhai et al. [
7,
13] indicated that the first assumption was most crucial for the application of the statistical method. Fredlund and Xing [
5,
6] indicated that the SWCC could be integrated from the PSDF only when the soil did not undergo volume change. In addition, the probability of the connection between the pores with different sizes is computed from the pore-size density. The pore-size density can be obtained from PSDF, which can be estimated from the drying SWCC. As a result, the accuracy in the representation of the PSDF is crucial in the estimation of the HCF by using the statistical method. Zhai et al. [
14] indicated that wetting SWCC could not represent PSDF and that drying SWCC could represent the PSDF. The differences between drying and wetting SWCCs are the results of the “ink-bottle” and “rain-drop” effects but are not due to different PSDFs. Therefore, the wetting HCF should not be estimated from the wetting SWCC using the statistical method.
3. Results and Discussions
Klute [
15] and Zhai et al. [
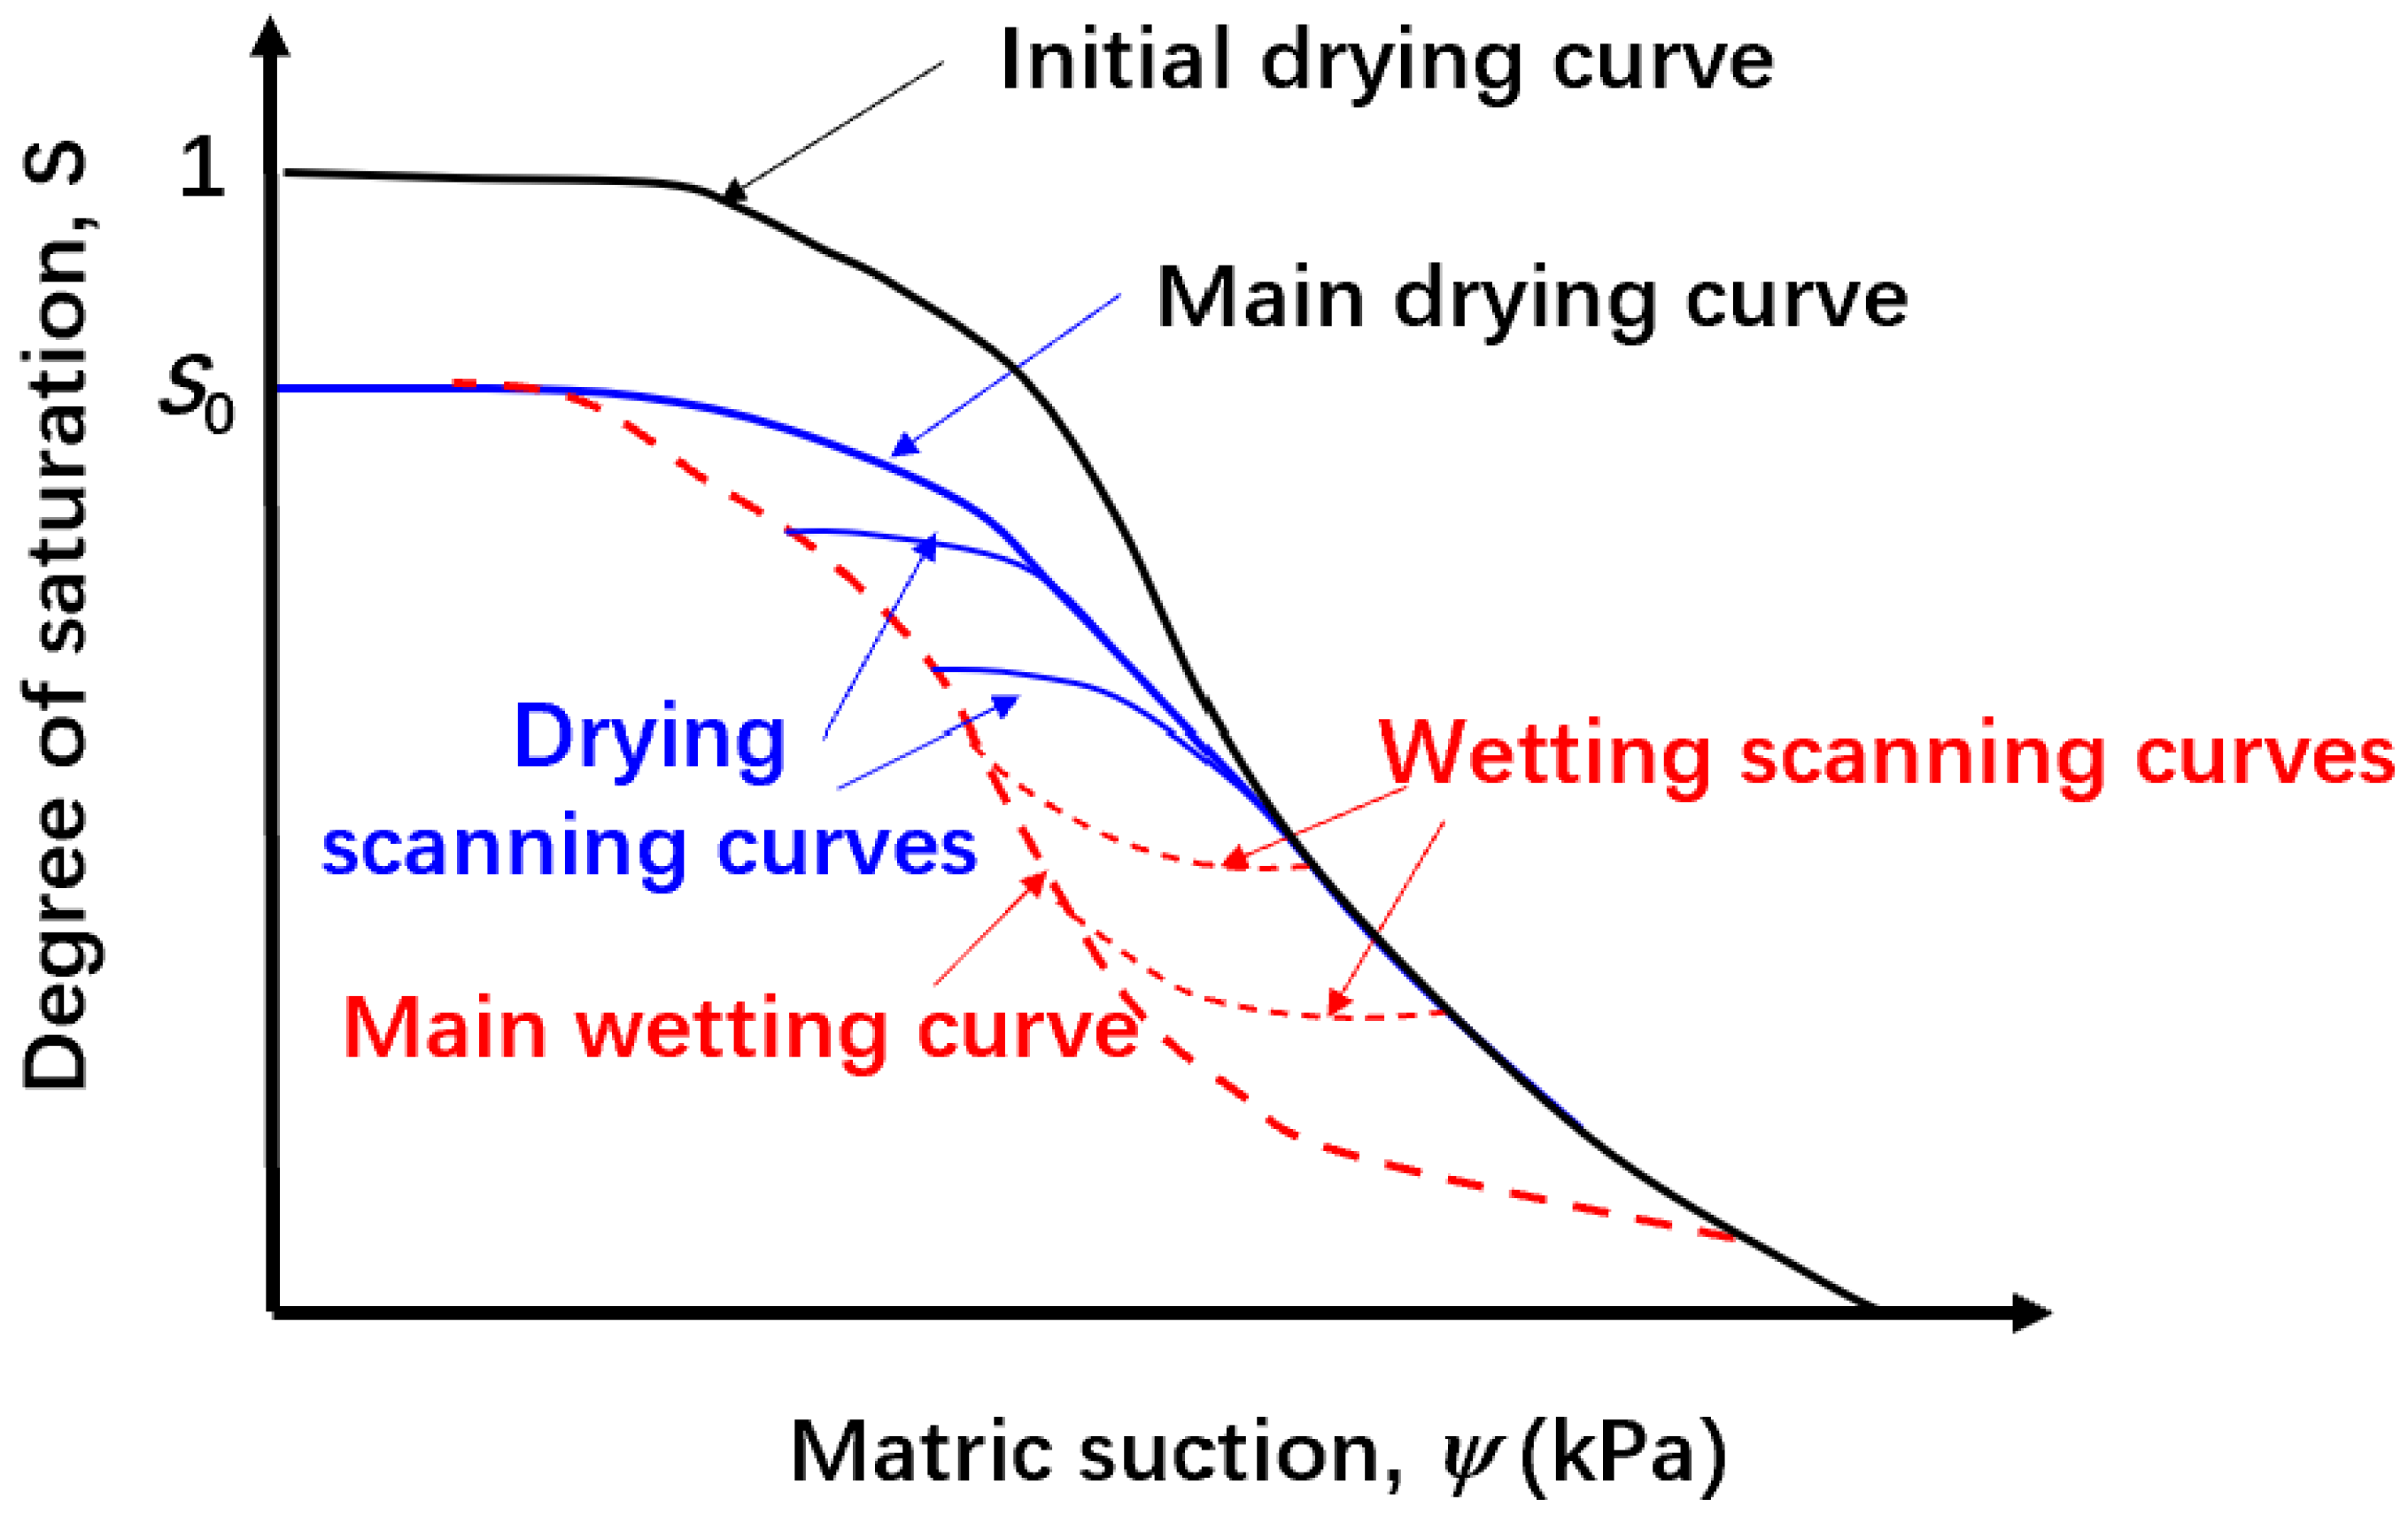
14] demonstrated the schematic diagram of SWCCs in both the drying and wetting processes. Due to the entrapped air, the soil cannot be fully saturated after the wetting process, resulting in an open loop as shown in
Figure 1. If the soil is re-desaturated again after the wetting process, the main drying curve is obtained. If the soil is saturated or desaturated at any point on the main drying curve (or on the main wetting curve), then the scanning curve is obtained.
It is known that when water drains out from soil, it does so progressively from the largest pores to the smallest pores. When the radius of the meniscus is larger than the pore radius, water cannot drain out of the pore and the pore remains wet. On the other hand, when the radius of the meniscus is smaller than the pore radius, water drains out the pore and the pore becomes dry. Therefore, the measured initial drying SWCC can reflect the pore-size distribution correctly in soil.
If the entrapped air is uniformly distributed from the largest pores to the smallest pores, then the main drying curve can be scaled from the initial drying curve (or the primary drying curve). It is noted that the main wetting curve has a different shape to the primary drying curve. Zhai et al. [
14] indicated that the different shape in the wetting SWCC is mainly due to the entrapped air, the “rain-drop” effect, and the “ink-bottle” effect. As a result, the wetting SWCC is not analogous to the PSDF, which renders the major assumption adopted in the statistical method invalid for the wetting process. Therefore, it was concluded that the wetting HCF should not be estimated from the wetting SWCC using the statistical method.
Zhai et al. [
16] adopted the starting point in the wetting process as the reference and proposed Equation (2) for the estimation of the wetting HCF by incorporating the “ink-bottle” and “rain-drop” effects.
where
k(ψx,w) is the hydraulic conductivity with respect to the suction of
ψx,w in the wetting process;
k(ψx,w) is the reference hydraulic conductivity (the hydraulic conductivity of the soil when it starts to be saturated);
k is the parameter in Zhai et al.’s model [
14];
ψref,
w is the suction (which is corresponding to
k(ψref,w)) when the soil starts to be saturated;
ψx,w,ψi and
ψj are the soil suctions;
S(kψx,w),
S(kψj),S(ψref,w), and
S(ψi) are the degrees of saturation on the drying SWCC with respect to the soil suctions of
kψx,w,
kψj,
ψref,w, and
ψi, respectively; and
N is the total number of SWCC segments.
As shown in Equation (2), in the wetting process the suction range of [0, ψref,w] is divided into two zones such as [0, ψref,w/k) and [ψref,w/k, ψref,w]. In the suction zone of [ψref,w/k, ψref,w], the water distribution in pores was not significantly changed. The contact angle changed from the receding contact angle to the advancing contact angle when the suction decreased from ψref,w to ψref,w/k. When the suction decreased to a value less than ψref,w/k, water started to fill the pores and the water distribution in the pores changed. However, because of the blocking of the larger dry pores, some of the small pores could not be filled, which is commonly referred to as “ink-bottle” phenomenon. S(ψj) was applied in the computation of the wetting HCF as shown in Equation (2). The wetting HCF computed from Equation (2) was based on the concept of PSDF and that is why the wetting HCF estimated from Equation (2) is named as the wetting HCFPSDF in this note.
To evaluate the accuracy of the numerical model by using HCF
swcc,w and the wetting HCFPSDF, numerical analyses for water infiltration into a soil column following the column set up from Ng et al. [
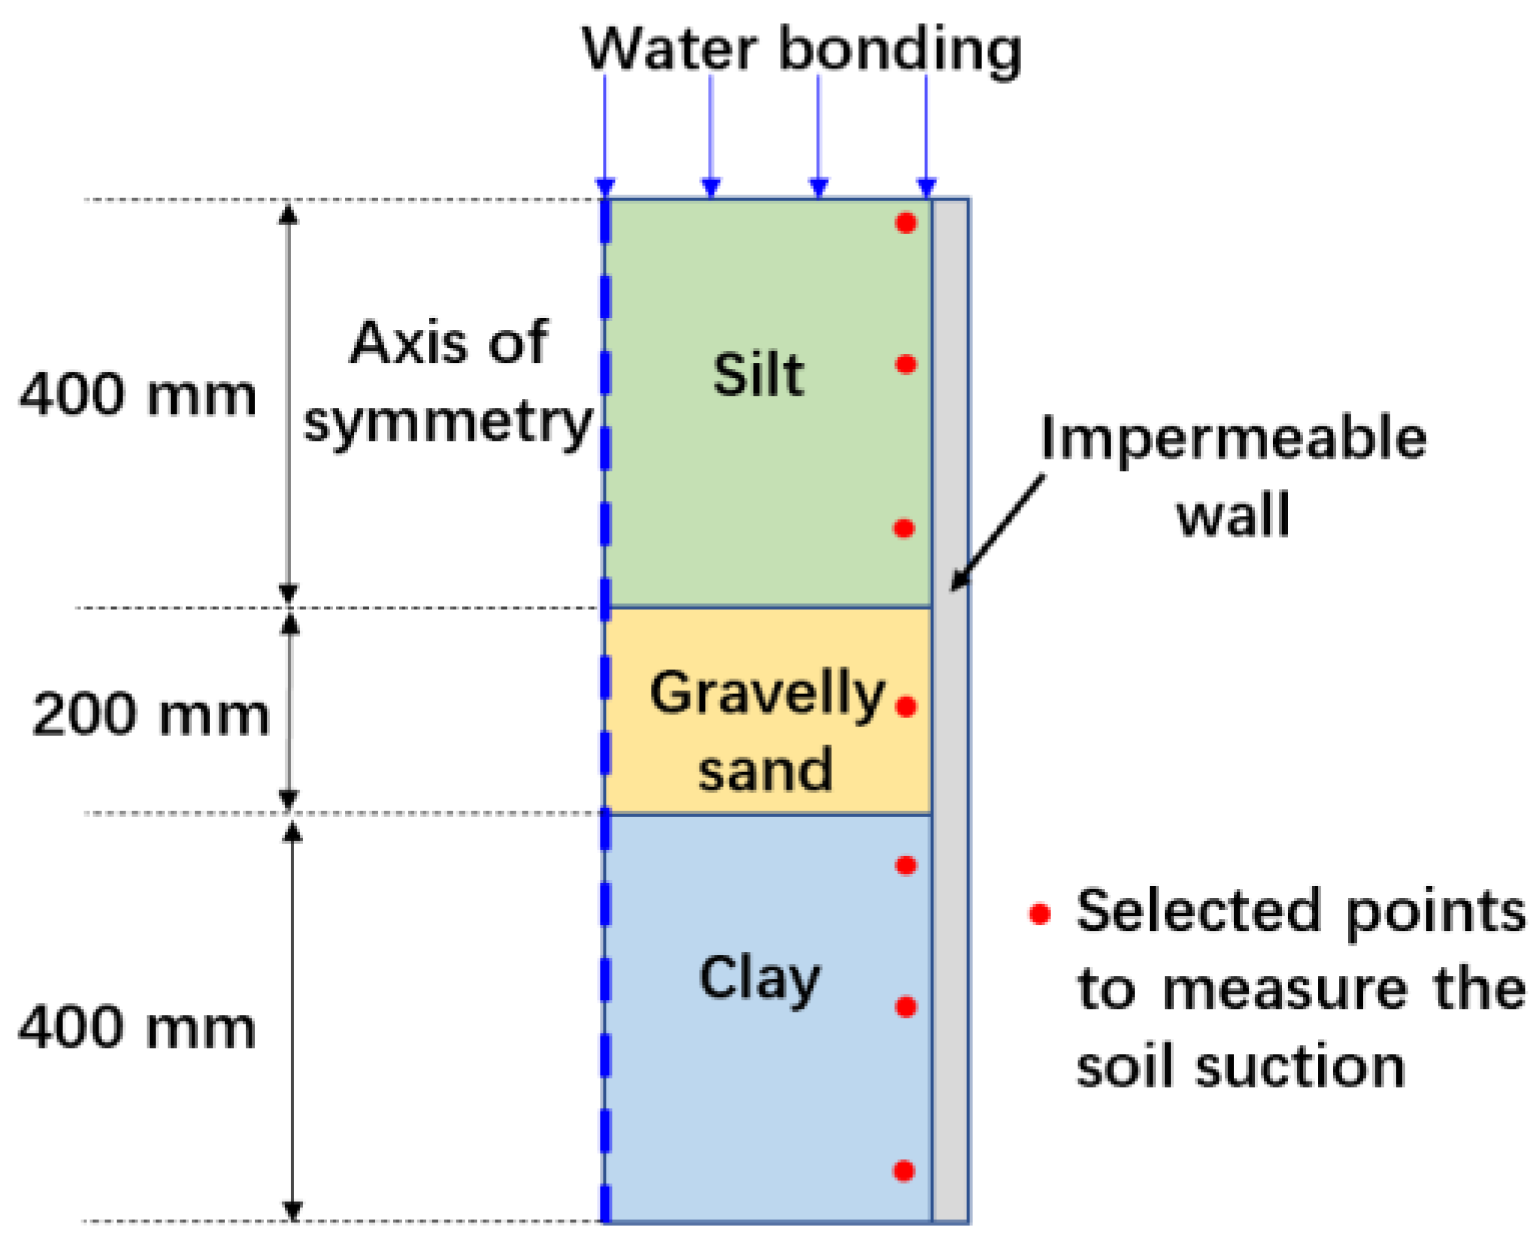
17] were conducted. The measured suction profiles at different time stages can be used to verify the results from the numerical analyses. The column had an inner diameter of 140 mm and a height of 1 m. There were three layers of soil: 400 mm-thick Silt, 200 mm-thick Gravelly Sand, and 400 mm-thick Clay. These were stacked from the top to the bottom of the column, as shown in
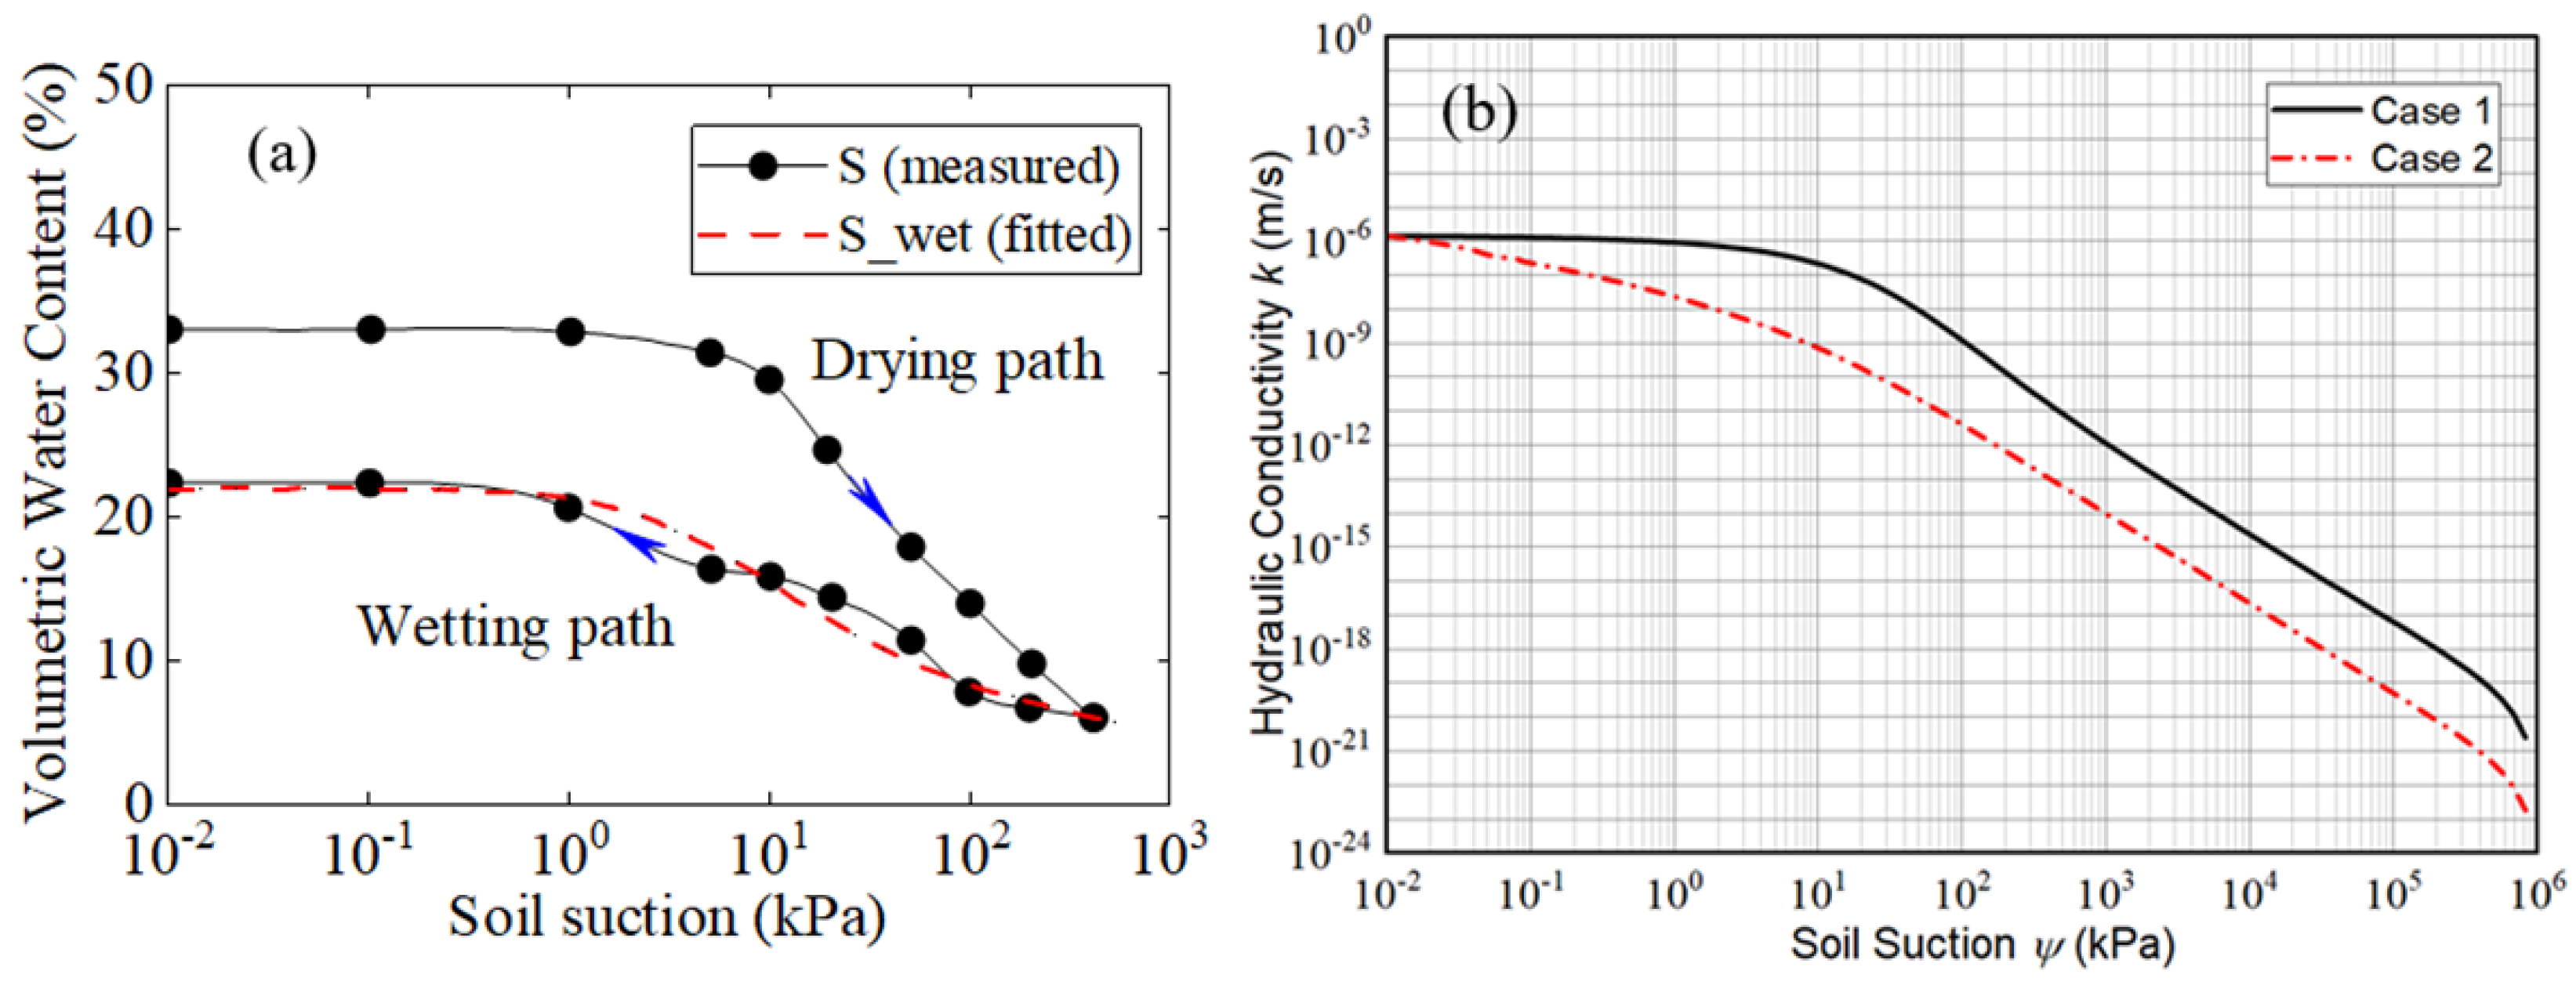
Figure 2. Both the measured drying and wetting SWCCs for the Silt are illustrated in
Figure 3a. The measured saturated HC for Silt was 1.4 × 10
−6 m/s. Subsequently, both the drying SWCC and the saturated HC were adopted to estimate the drying HCF by using Equation (1); the obtained result was named as HCF
swcc,d, as illustrated in
Figure 3b. Meanwhile, both the wetting SWCC and the saturated HC were adopted to estimate the drying HCF by using Equation (1); the obtained result was named as HCF
swcc,w, as illustrated in
Figure 3b.
Zhai et al. [
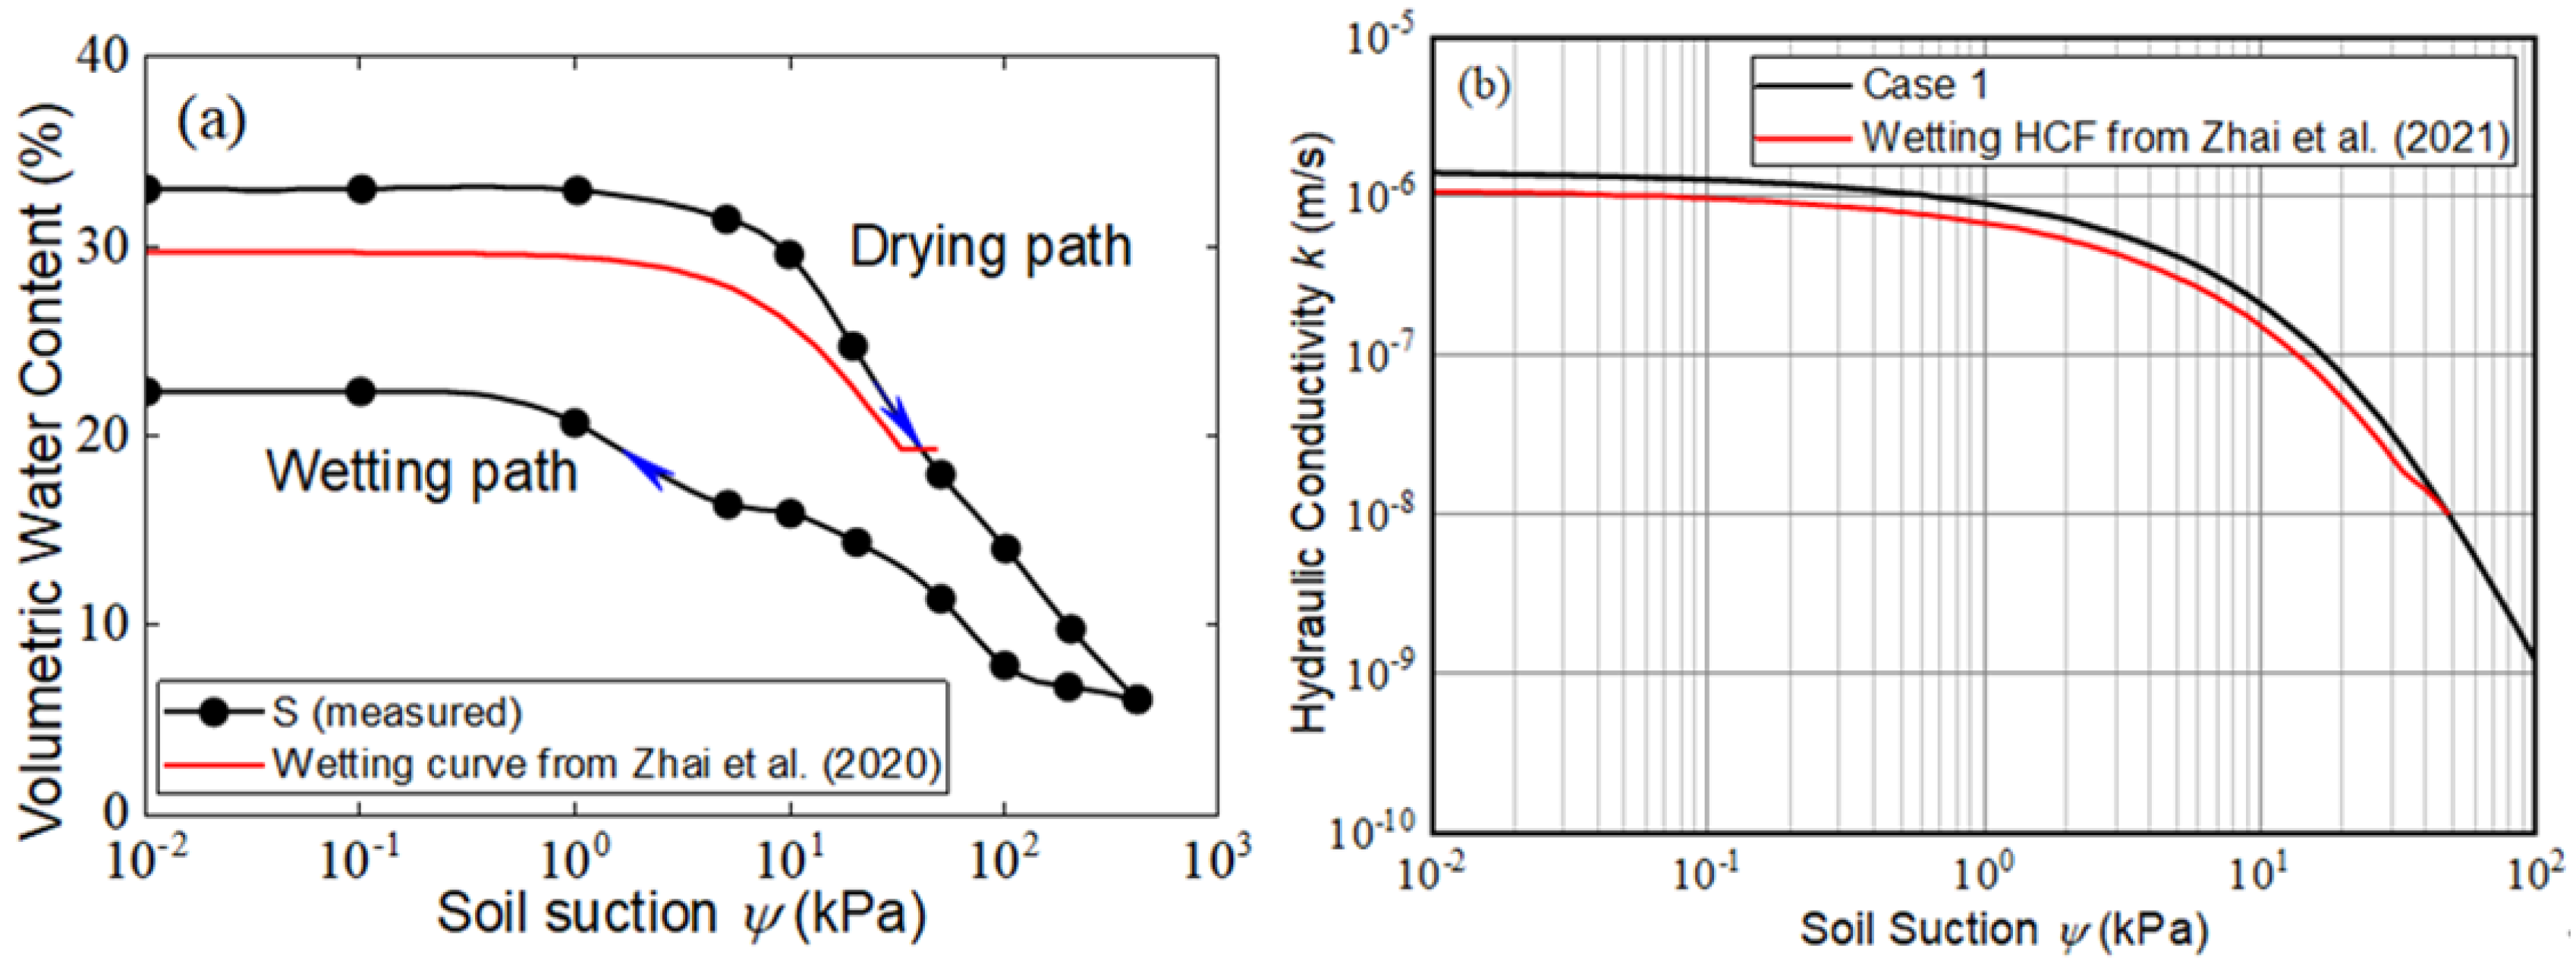
14] indicated that the shape of the wetting SWCC is a function of the initial suction when the soil starts to be saturated. In other words, different wetting SWCCs can be obtained if the soil was saturated at different suction levels. It was observed that initial suction in the Silt layer was around 45 kPa, which is different to the wetting SWCC as measured (initial suction of 500 kPa). To be consistent with the infiltration test, the scanning wetting SWCC with an initial suction of 45 kPa was estimated using the method from Zhai et al. [
14]. Subsequently, the wetting HCF
PSDF was estimated using Equation (2). Both the scanning wetting SWCC and the wetting HCF
PSDF are illustrated in
Figure 4a,b, respectively.
There was a total of three cases considered in the simulation: Case 1 refers to the numerical model incorporating both drying SWCC and HCF
swcc,d, ignoring hysteresis of the hydraulic properties of soil; Case 2 refers to the numerical model incorporating both wetting SWCC and HCF
swcc,w, which is the method adopted by most engineers including the hysteresis of hydraulic properties in the seepage analysis; Case 3 refers to the numerical model incorporating both scanning wetting SWCC and wetting HCF
PSDF, which considers the initial suction in the soil to be infiltrated. As water infiltration into the Silt layer is the main objective of this note, the hydraulic properties of Gravelly sand and Clay from the study by Ng et al. [
17] were adopted for the seepage analyses, but they are not illustrated in this note. Both the measured and the computed suction profiles after 4 h and 6 h water infiltration were compared; these are illustrated in
Figure 5.
Figure 5a indicates that the Silt in the numerical simulation was fully saturated after 4 h and 6 h water infiltration, while Silt in the 1-D infiltration column test (based on the instrumentation data) had a suction of around 20–30 kPa. It indicates that Case 1 (ignoring the hysteresis of the hydraulic properties) overestimates water infiltration. Therefore, it can be deduced that the hysteresis of the hydraulic properties should be incorporated in the seepage analysis for water infiltration. However, there are no past studies indicating a proper method to incorporate the hysteresis of the hydraulic properties in the seepage analysis.
Figure 5b indicates that the suction profiles in Silt after 4 h of water infiltration as computed from Case 2 agree well with the measured data. However, the suction profiles in Silt after 6 h water infiltration as computed from Case 2 show obvious deviation from the measured data. This indicates that Case 2 is not a reliable model for the simulation of 1-D water infiltration.
Figure 5c illustrates that the suction profiles in Silt after 4 h and 6 h water infiltration as computed from Case 3 agree well with the measured data. It seems that Case 3 provides the most reliable results of the column infiltration test.
Figure 5 indicates that measured wetting SWCC cannot be directly used for seepage analysis of water infiltration. The wetting scanning curve should be estimated from both the measured wetting SWCC and the initial suction in the soil to be infiltrated. The wetting HCF
PSDF estimated on the concept of PSDF provided the best performance in the simulation of water infiltration compared with the performances of HCF
swcc,d and HCF
swcc,w.


