Article

Intelligent Demand Side Management for Exhaustive Techno-Economic Analysis of Microgrid System

by
Bishwajit Dey
1,
Soham Dutta
2 and
Fausto Pedro Garcia Marquez
3,*
1
Department of Electrical and Electronics Engineering, GIET University, Gunupur 765022, India
2
Department of Electrical and Electronics Engineering, Manipal Institute of Technology, Manipal Academy of Higher Education, Manipal 576104, India
3
Ingenium Research Group, Universidad Castilla-La Mancha, 13071 Ciudad Real, Spain
*
Author to whom correspondence should be addressed.
Sustainability 2023, 15(3), 1795; https://doi.org/10.3390/su15031795
Submission received: 22 September 2022 / Revised: 25 November 2022 / Accepted: 11 January 2023 / Published: 17 January 2023

Abstract

:
In a typical microgrid (MG) structure, the requisite of load varies from hour to hour. On the basis of the rise and fall of the load demand curve, the power system utilities fix the rate of electric power at different times of the day. This process is known as time-of-usage (TOU)-based pricing of electricity. The hourly basis load demand can be categorized into elastic hourly load demand and inelastic hourly load demand. For the duration of the peak hours, when the utility charges more, the elastic loads are shifted to low demand hours by the demand side management (DSM) to save the cost. This rebuilds the total demand model on the pillars of demand price elasticity. Keeping in view the fact that the total load in an hour in an MG structure consists of 10% to 40% of elastic loads, the paper proposes an intelligence-technique-based DSM to achieve reduction in the overall cost of using loads in an MG structure. Seven different cases are studied which cover diverse grid participation and electricity market pricing strategies, including DSM programs. The results obtained for all the MGs showcase the applicability and appropriateness of using the proposed DSM strategy in terms of cost savings.

1. Introduction

With the advent of renewable energy technologies, they are being increasingly used in economic load dispatch (ELD). The concept of ELD reflects that the different generating units connected to a distributed system do not share and supply the same amount of load. Instead, the sharing of loads depends on their individual cost functions so as to add up to the minimum generation cost for the system. At the same time, the proper working of any grid necessitates the total energy demand to be equal to the total energy production [1]. On the basis of load demand, the concept of ELD can be broadly categorized into static ELD (StELD) and dynamic ELD (DyELD). StELD refers to the ELD scenarios where the load demand does not change for a given duration of time, whereas DyELD refers to the ELD scenarios where the load demand changes for a given duration of time. StELD is relatively simple owing to a relatively less restricted number of constraints, such as ramp rates, prohibited operating zones, etc., [2,3], while DyELD is a more intricate optimization problem. This is because DyELD has to handle constraints related to distributed energy resources (DERs) and time periods, besides the constraints of StELD [4]. The greatest challenge in finding the optimal solution of DyELD issues is the initiation/termination time of DERs along with the charging and discharging of energy storage devices.

1.1. Related Work

A plethora of research work has been done to attain the judicious production and distribution of renewable power which can ensure a positive transformative effect in the power generation economy paradigm. It is also essential due to ever-increasing fuel prices and environmental concerns. In view of this, a detailed investigation on ELD can be considered a pressing issue in the power sector. In case of smooth, continuous and non-convex cost functions, the customary computational methods are easily applicable [5]. However, due to the incorporation of confirmed physical constraints, the ELD problem is rendered with a non-smooth and convex nature, leading to complexity and hence failure of the customary methods [6]. To solve the smooth ELD problems, classical approaches of optimization such as iterative lambda, gradient method and dynamic programming are generally employed [7]. However, the modelling of ELD issues in practical environments effectively needs tremendous amounts of precision and painstaking handling of numerous constraints. This renders the objective function with more complexity which derails the pre-established approaches for producing the optimal solution [8]. One of the biggest hindrances to the application of these approaches is the nature of the cost curve. The cost curve does not affect the dynamic programming, unlike the system dimensionality which governs the dynamic programming to a huge extent. Moreover, the dynamic programming possess a large computational time in case of large systems [9,10]. Keeping in view all the drawbacks of the classical techniques, the employability of meta-heuristic methods has gained importance in recent times in the field of handling the nonlinearity issue in ELD [11]. Gradually, numerous evolutionary methods came into existence in the ELD problem research field. These evolutionary methods were devised by taking the motivation from evolution of life [12]. For example, genetic algorithm (GA) [13] is a classic evolutionary method applied to ELD problem that is based on the theory of cell reproduction process and its acquainted genetics.
DERs incorporate fossil fuel generators as well as renewable energy sources (RES) such as fuel cells, battery and flywheel, micro-turbines, solar generators, etc., [14]. Microgrids (MGs) can be thought of an example of DERs with the load demand points across a limited geographical area. MGs can function in islanded mode or grid-connected mode. However, the grid-connected mode is preferred due to the availability of buy or sell options to or from the utility. The utility-connected DER has the option to take electrical support from the grid in case of unplanned failure of the network. This has sparked a huge interest among researchers in the area of energy management of MG. To reduce the cost of generation of an on-grid mode MG, an imperialist competitive algorithm (ICA) and matrix real-coded-based GA is proposed in [15,16]. Different case studies were undertaken by the authors to verify the capability of the algorithm for handling the narrow range of operation of DERs, intermittent pricing of electrical power and load variation. Cuckoo search algorithm has been employed in [17] which showcases better performance with respect to differential evolution (DE) and particle swarm optimization (PSO) techniques. A DyELD problem is being established on the basis of wind speed in an islanded MG having two wind generators. An adaptive modified PSO has been presented in [18] for obtaining an ELD solution in an on-grid-mode MG. A modified ICA method is used by authors in [19] for analysis of economic objectives as well as those relating to emission dispatch.
Modified harmony search algorithm, interior search algorithm and whale optimization algorithm are employed respectively for economic dispatch, emission dispatch and combined economic emission dispatch (CEED) for a three-unit islanded MG having photovoltaic (PV) and wind generation in [20,21,22]. For CEED, various price penalty factors are evaluated and the optimum value is selected. Modified personal best PSO, artificial fish swarm algorithm and memory-based GA are used in [23,24,25] for an islanded MG system incorporating 2 PVs, 3 wind turbines (WTs) and 1 combined heat and power (CHP). The MPBPSO displayed the best result in terms of minimization of the cost. A study of unilateral power flow is carried out for dual cases of an MG connected with utility and energy storage devices in [26] through the increment of the load demand by 10% of the principal amount. The cost of electrical power generation is minimized in [27] through the application of PSO, direct search method, Lambda Iteration Technique and Lambda logic technique. Similar work is executed in [28] where the demand response on a grid-connected MG is considered and network reconfiguration algorithm is applied. In [29], Hong’s K × m point estimation and PSO is applied for the minimization of the cost of generation in a renewable energy-based MG with reconfigured network and demand response based on incentive. An autonomous hybrid power system incorporating fuel cells, diesel generators, aqua-electrolysis, and wind turbines is studied in [30] and a PID controller is employed for the minimization of the steady-state frequency deviation. A memory-based gravitational search algorithm (mGSA) is applied in [31] for the cost minimization of power generation of a cohesive renewable system incorporating both small as well as large MGs. From the study, it is established that the performance of mGSA is best among the meta-heuristics methods when applied to the cost minimization problem of MGs. A novel algorithm inspired from the hunting pattern of the grey wolves is proposed in [32]. A modified version of the same is proposed in [33]. The applicability of cosine and sine functions in the optimization problem is discussed in [34]. CSA, for evaluating intricate optimization problems, is discussed in [35]. CEC2011, for testing the sturdiness of evolutionary algorithms, is utilized in [36]. The chaotic approach is merged into a CSA algorithm in [37] for the enhancement of the performance. A detailed research study is carried out in [38] concerning the day-ahead scheduling in an energy storage system and an MG. A quasi-oppositional swine influenza model-based optimization [39] and grey wolf optimizer [40] is applied for optimal scheduling of ESS and DERs with the chief objective of minimizing generation cost applying. An alternating direction method of multipliers method is employed in [41] to compute a demand management model.

1.2. Motivation and Contribution

Every day numerous new articles are being published in reputed journals which report a diverse range of fitness functions evaluating economic energy management of microgrid systems. The complexity in these publications remains confined to the constraints of various DERs used, including electric vehicles and combined heat and power systems, but in some way or other, ignore the easiest yet standard economization strategies, such as demand side management. Most of the papers discussed the diverse intricacies introduced due to the intricate operating principles of electric vehicles (EV), ESS, etc. However, the papers fail to look into the vital factors that necessarily ensure the reduction in generation cost besides reduction of the ejection of pollutants up to a certain extent. Demand side management (DSM) should be an inevitable section of any research that deals with economic energy management as the main objective. The forecasted load must be restructured in order to reduce or transfer the elastic loads to the part of the curve where the unit price of electricity is less. This is necessary not only to economize the power generation process but also to reduce the reliance on the utility services. The presented work aims to bridge the research gap of the articles mentioned in the previous section by employing DSM participations at different levels in an on-grid MG structure. To incorporate a more complicated constraint scenario, unit commitment of DERs is also considered in order to abide by the stand-by time of the generators.

1.3. Arrangement of the Proposed Paper

The rest of the paper is arranged as follows. The fitness function that needs to be minimized is considered in Section 2. The equality and inequality constraints of the DSM-based MG energy management for the test systems are also discussed in this section. Three residential and rural low voltage on-grid MG structures considered as case studies are presented in Section 3. The proposed work is inferred in Section 4. Future works are proposed in the last section of the paper.

2. Mathematics of Fitness Function and its Formulation

The mathematical function denoting the electricity production cost spent by the DERs and the energy market rate charged by the power utilities can be represented as in (1) [42,43], where genr is the generator unit, tm is the time, CCG is the cost coefficients of the generator, PG is the power output of the generators, IG denotes the status of the generator (i.e., 1 if the generator is ON and 0 if OFF), S U C is the startup cost, SDC is the shutdown cost, mpgrid is the time of usage (TOU)-based electricity market price charged by the grid and PCGrid is the electrical power consumed or delivered by the grid. For cases when the grid implements separate hourly price tags to buy and sell power from the MG, the price is evaluated as the net micro grid cost,   C n g , that depends on the sum of the cost of buying power from the utility and the cost of selling power to the utility as represented by (2) [42]. The cost of buying power, C b u y , and the selling, C s e l l , is governed by Equations (3) and (4). The tax levied is decided by the utility and depends on the percentage of mpgrid.
E C D = M i n t m g e n r C C G g e n r P G g e n r t m I G g e n r t m + S U C g e n r t m + S D C g e n r t m + t m C n g t m P C g r i d t m
C n g = C b u y + C s e l l
C b u y = t m m p g r i d t m P C g r i d t m   if   P C g r i d t m > 0
C s e l l = t m 1 t a x m p g r i d t m P C g r i d t m   if   P C g r i d t m < 0
The grid implements three different methodologies to buy and sell electricity to and from the MG system. The first method is with the same electricity market price (mpgrid), the second is different charges for buying and selling power, and the third method is where the selling price is a taxable percentage of the cost price. This is represented by (3) and (4). All the three methods are studied in this paper.
The formulated objective function under the constraints of generating unit and load is represented as per (5) to (9) [42,43]. These equations represent the equality constraints (5), the operating limits of DERs (6) and grid (7), and the ON/OFF status of DERs (8) and (9) [42,43].
t m g e n r P G g e n r t m + P C g r i d t m = d t m L d t m
P G g e n r m i n P C g r i d t m P G g e n r m a x
P G g e n r m i n P G g r i d t m P G g e n r m a x
T g e n o n ,   t m O N T g r i d I g r i d t m I g r i d t m 1
T g e n o f f ,   t m O F F T g r i d I g r i d t m I g r i d t m 1
The hourly wind power of jth generator, w p j t m can be related to the hourly wind speed with a linear mathematical model as per (10), where s is the wind speed, s j i , s j r and s j o is the cut-in, rated and cut-out wind speed respectively, and w p j r is the rated wind power for the jth wind generator unit.
w p j t m = w p j r s s j i s j r s j i if   s j i s s j r w p j r if   s j r s s j o 0 if   0 s s j i
The intermittent and stochastic characteristics of the wind power necessitate the inclusion of uncertainty in their forecasted values. The mathematical model of the uncertainty can be expressed as per (11), where w p u n t m is the wind power incorporating uncertainty, d w p is the standard deviation of the wind power as per (12), w p f c t m is the forecasted wind power, and ξ 1 and ξ 2 are random normal distribution functions having 1 standard deviation and a mean value of 0.
w p u n t m = d w p ξ 1 + w p f c t m
d w p = 0.8 w p f c t m

2.1. Strategy Incorporated in DSM

MG energy management with a focus on economic actions has become increasingly popular in the research domain over the past few years. However, the discussion on the economic operation for an MG structure lacks flavor without incorporating the concept of DSM. Most of the research papers discussed in the related work section can be more economical with the integration of the DSM strategy. The DSM strategy recognizes the elastic loads and transfers them optimally to the part of the load curve where the utility charge of electricity is less. This reduces the peak demand. Thus, though the overall load demand remains unaltered at the completion of a scheduling duration (i.e., a day in most of the utilities), the load factor of the utility is improved. Load shifting, valley filling, peak clipping, flexible load shape, strategic conversion, strategic growth, etc. are some of the load shaping approaches of DSM [44,45] showed in Figure 1. The first three methods are basic-level types. The other three ways, which are advanced-level kinds, regulate the total load demand shape by either extending or decreasing it with the aid of system planning and operation. The most preferred way among all load management techniques is the load shifting method, which combines peak clipping and valley filling. Controllable loads on the consumer side can be used to implement the load shifting method. The controllable loads are moved from peak slots to off-peak slots using the load shifting method, with no change in energy usage. The processes of implementing the DSM are discussed in detail as follows:

2.2. Procedure to Attain a Restructured Load Model by Means of DSM Approach

Step 1: The dynamic load data for the duration of T hours is entered.
Step 2: The electricity market rate on time of usage (TOU) is entered for the duration of T hours.
Step 3: The DSM percentage participation is entered (in case the elastic loads are not defined in advance).
Step 4: The amount of elastic loads,   L D e l t m are identified on the basis of the DSM percentage participation. As an example, P percent DSM participation implies that P percent of the hourly load demand is elastic load. Remaining (100−P) percent is inelastic load,   L D e l t m . After the calculation, optimum scheduling of the elastic loads is carried out.
Step 5: The minimum, maximum and sum of the inelastic loads are calculated.
Step 6: The optimization method is applied in the next step as represented in (13), subject to the constraints of (14), (15), where C g r i d t m means TOU-based electricity price at time t m , L D i n t m is the inelastic load at time t m , and L D e l m a x is the maximum permissible elastic load.
Step 7: The aggregate of hourly inelastic load demand with the elastic load values that are optimized are considered as the restructured load demand model integrating the DSM approach.
M i n C g r i d t m L D i n t m + L D e l t m
0 L D e l t m L D e l m a x
T o t a l   D e m a n d = t m = 1 T L D i n t m + L D e l t m

2.3. Differential Evolution Algorithm

DE is a popular optimization technique that employs a population of unique solutions for multidimensional real-valued functions. The optimization problem does not have to be differentiable because the method does not require gradient information. The algorithm explores the design space by keeping track of a population of potential solutions (individuals), and by combining potential solutions in accordance with a predetermined method, it generates new solutions. The candidates with the best objective values are retained in the algorithm’s subsequent iteration in order to improve each candidate’s new objective value and include it in the population; otherwise, the new objective value is discarded. Until a specified termination criterion is met, the process is repeated.
The main advantage of DE is the fact that it has only three control parameters that the user of the algorithm needs to adjust. These include the population size NP, where NP ≥ 4, the mutation factor (or differential weight, or scaling factor) F ∈ [0, 2], and the crossover probability (or crossover control parameter) CR ∈ [0, 1]. In the standard DE, these control parameters were kept fixed for the entirety of the optimization process. The population size has a significant influence on the ability of the algorithm to explore. In cases of problems with a large number of dimensions, the population size also needs to be large to make the algorithm capable of searching in the multi-dimensional design space. Figure 2 below gives a brief idea about the implementation of DE for solving the microgrid energy management problem.

3. Descriptive Techno-Economic Analysis of a Subject Test System

3.1. Description of the Subject Test System and Simulation Environment

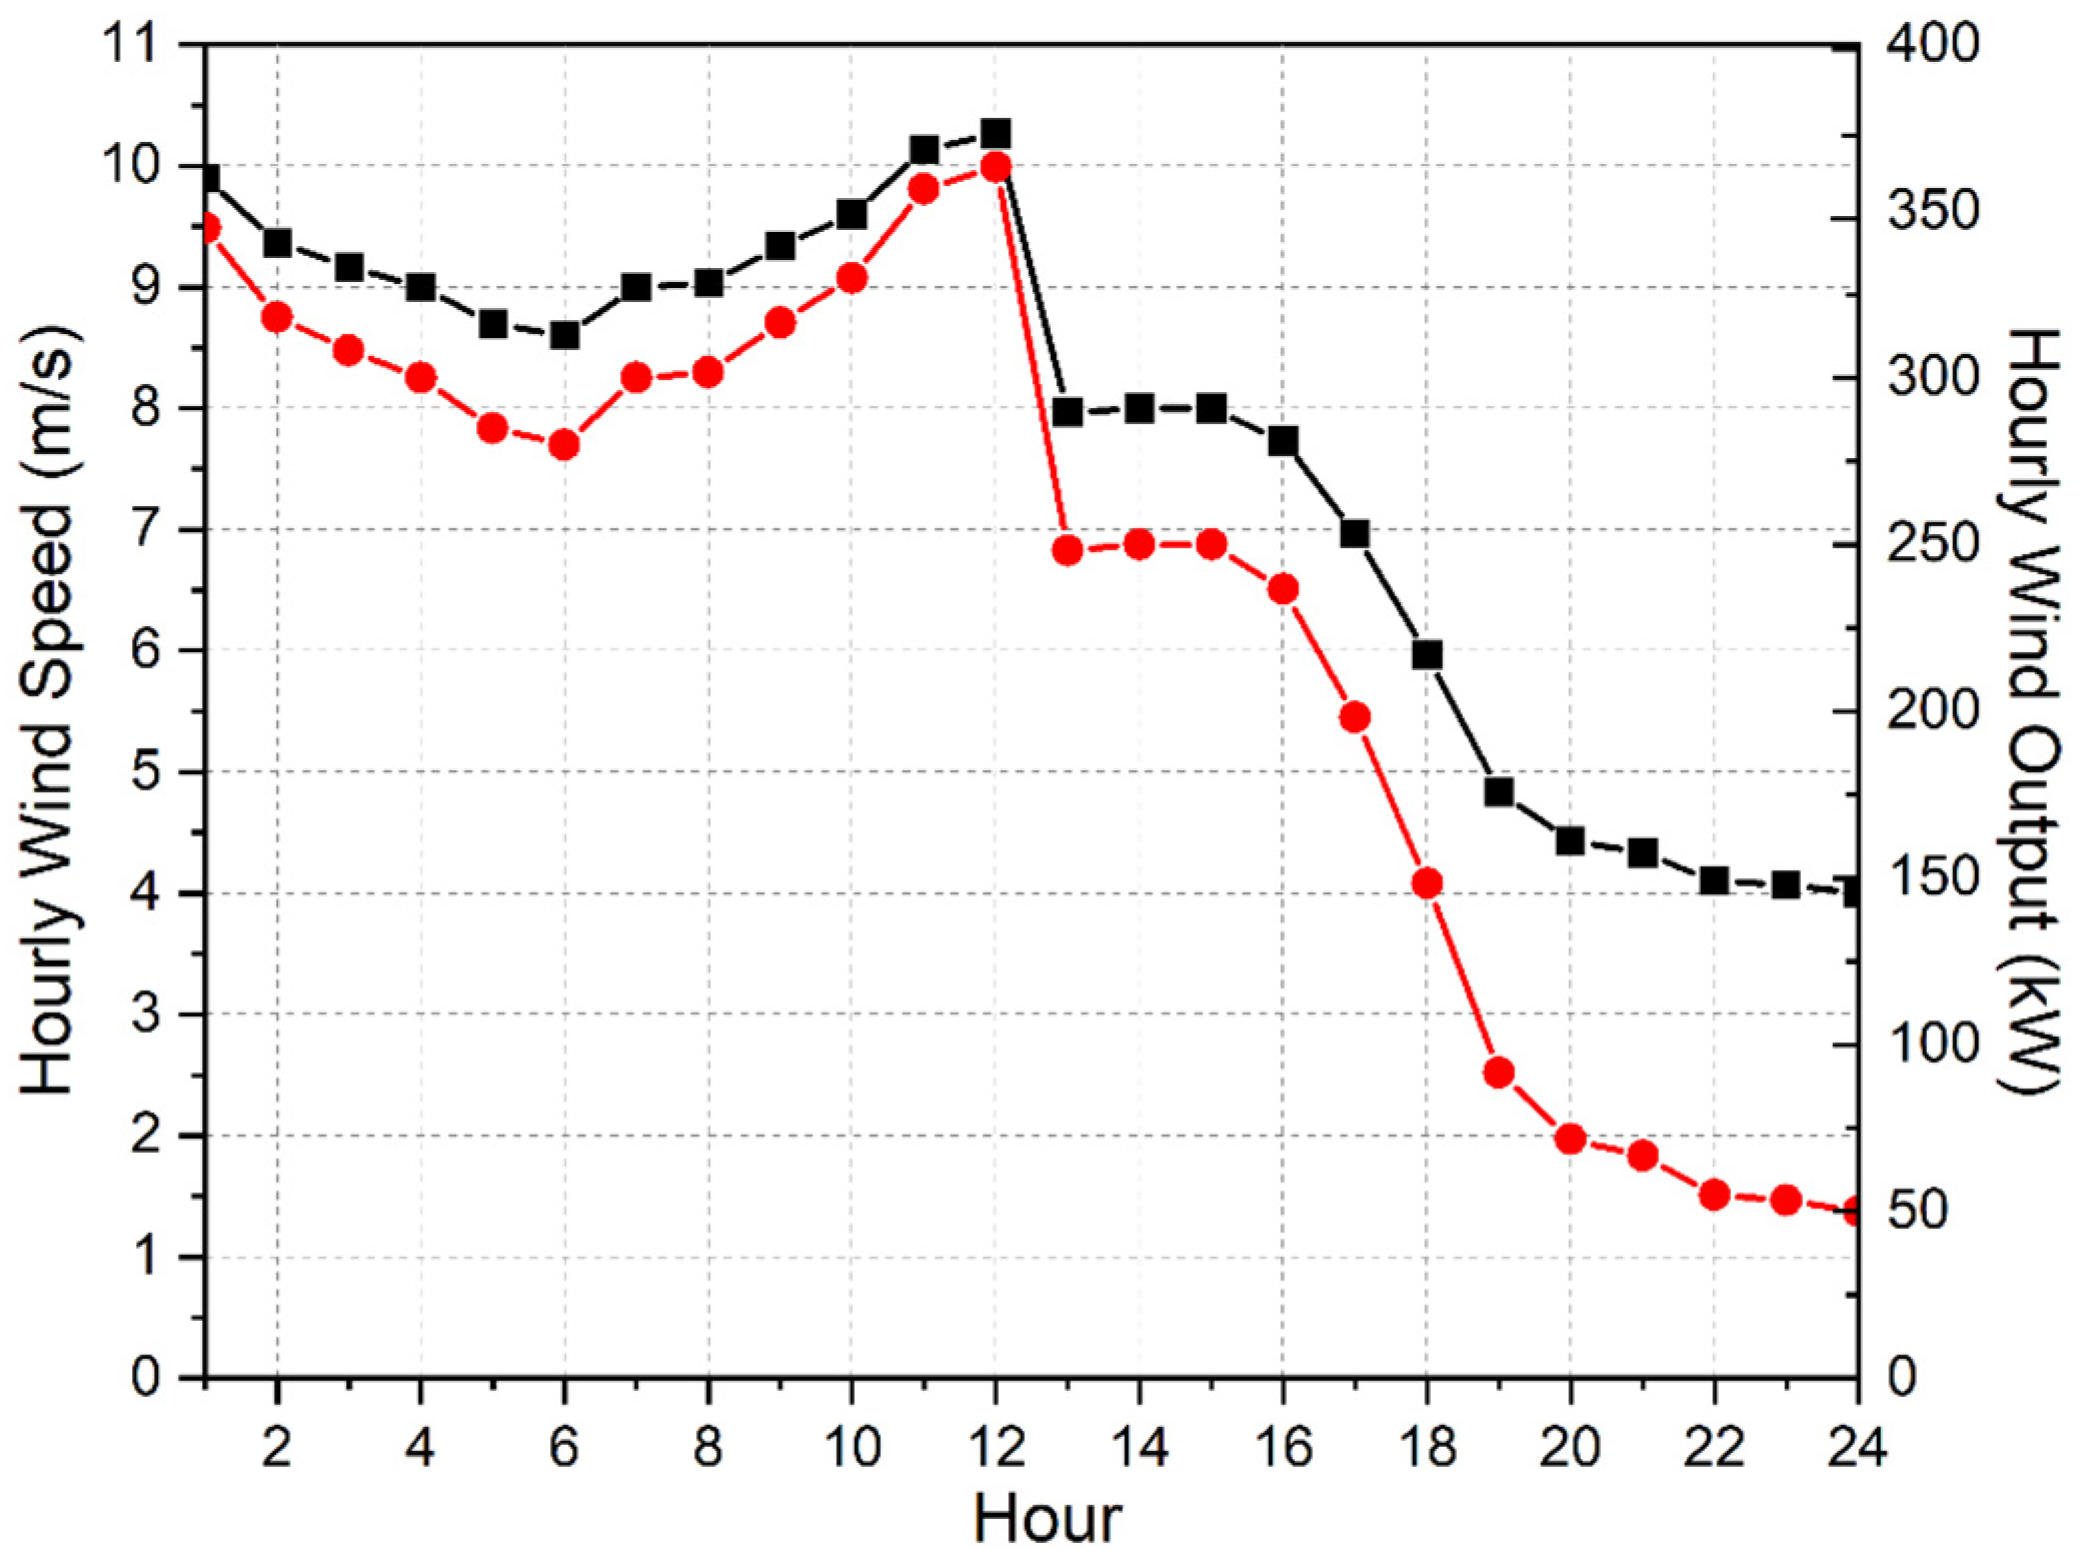
The objective of the work is to attain a balanced compromised solution between minimum values of generation cost and pollutant emissions. The work is divided into three stages. The first stage emphasizes the positive effects of DSM implementation on the dynamic distribution system—in this case, the MG system. In the second stage, a detailed and exhaustive techno-economic analysis for various grid pricing and participation strategies is studied for seven different scenarios and a comparative analysis is made. Finally, in the third stage, a comparative study is performed between two different methods of combined economic emission dispatch to sort out the method which yields the minimum compromised value for generation cost and emission value. The test system considered for the study is a grid-connected MG system powered with micro-turbine (MT), CHP system, fuel cell (FC), biomass and WT as gathered from [46] and is shown in Figure 3 below. The scalars pertaining to these DERs are provided in Table 1. The peak demand of the MG system is 3715 kW. The ratio of hourly loads with respect to the peak is shown in Figure 4. The rated capacity of the wind turbine is 500 kW. The cut-in, rated and cut-out wind speed are considered as 3 m/s, 13 m/s and 25 m/s respectively. The forecasted hourly wind speed is shown in Figure 5. Figure 5 also shows the hourly power extracted from the wind speed using the mathematical Equation (13). Figure 6 shows the dynamic TOU-based electricity market price bid with which the grid performs power transaction with the MG system. Table 2 explains the seven scenarios that are analyzed for an exhaustive techno-economic operation of the MG system.
DE algorithm is used as the optimization tool for the study which was coded and executed in MATLAB R2017a environment installed in a laptop with an Intel Core i5 8th Gen processor and 8 GB RAM. The tuning parameters for the algorithm are Crossover Ratio: 0.25 and Mutation Factor: 0.75. The population size and maximum number of iterations were 80 and 1000 throughout the study.

3.1.1. Stage 1: Effects of DSM Implementation

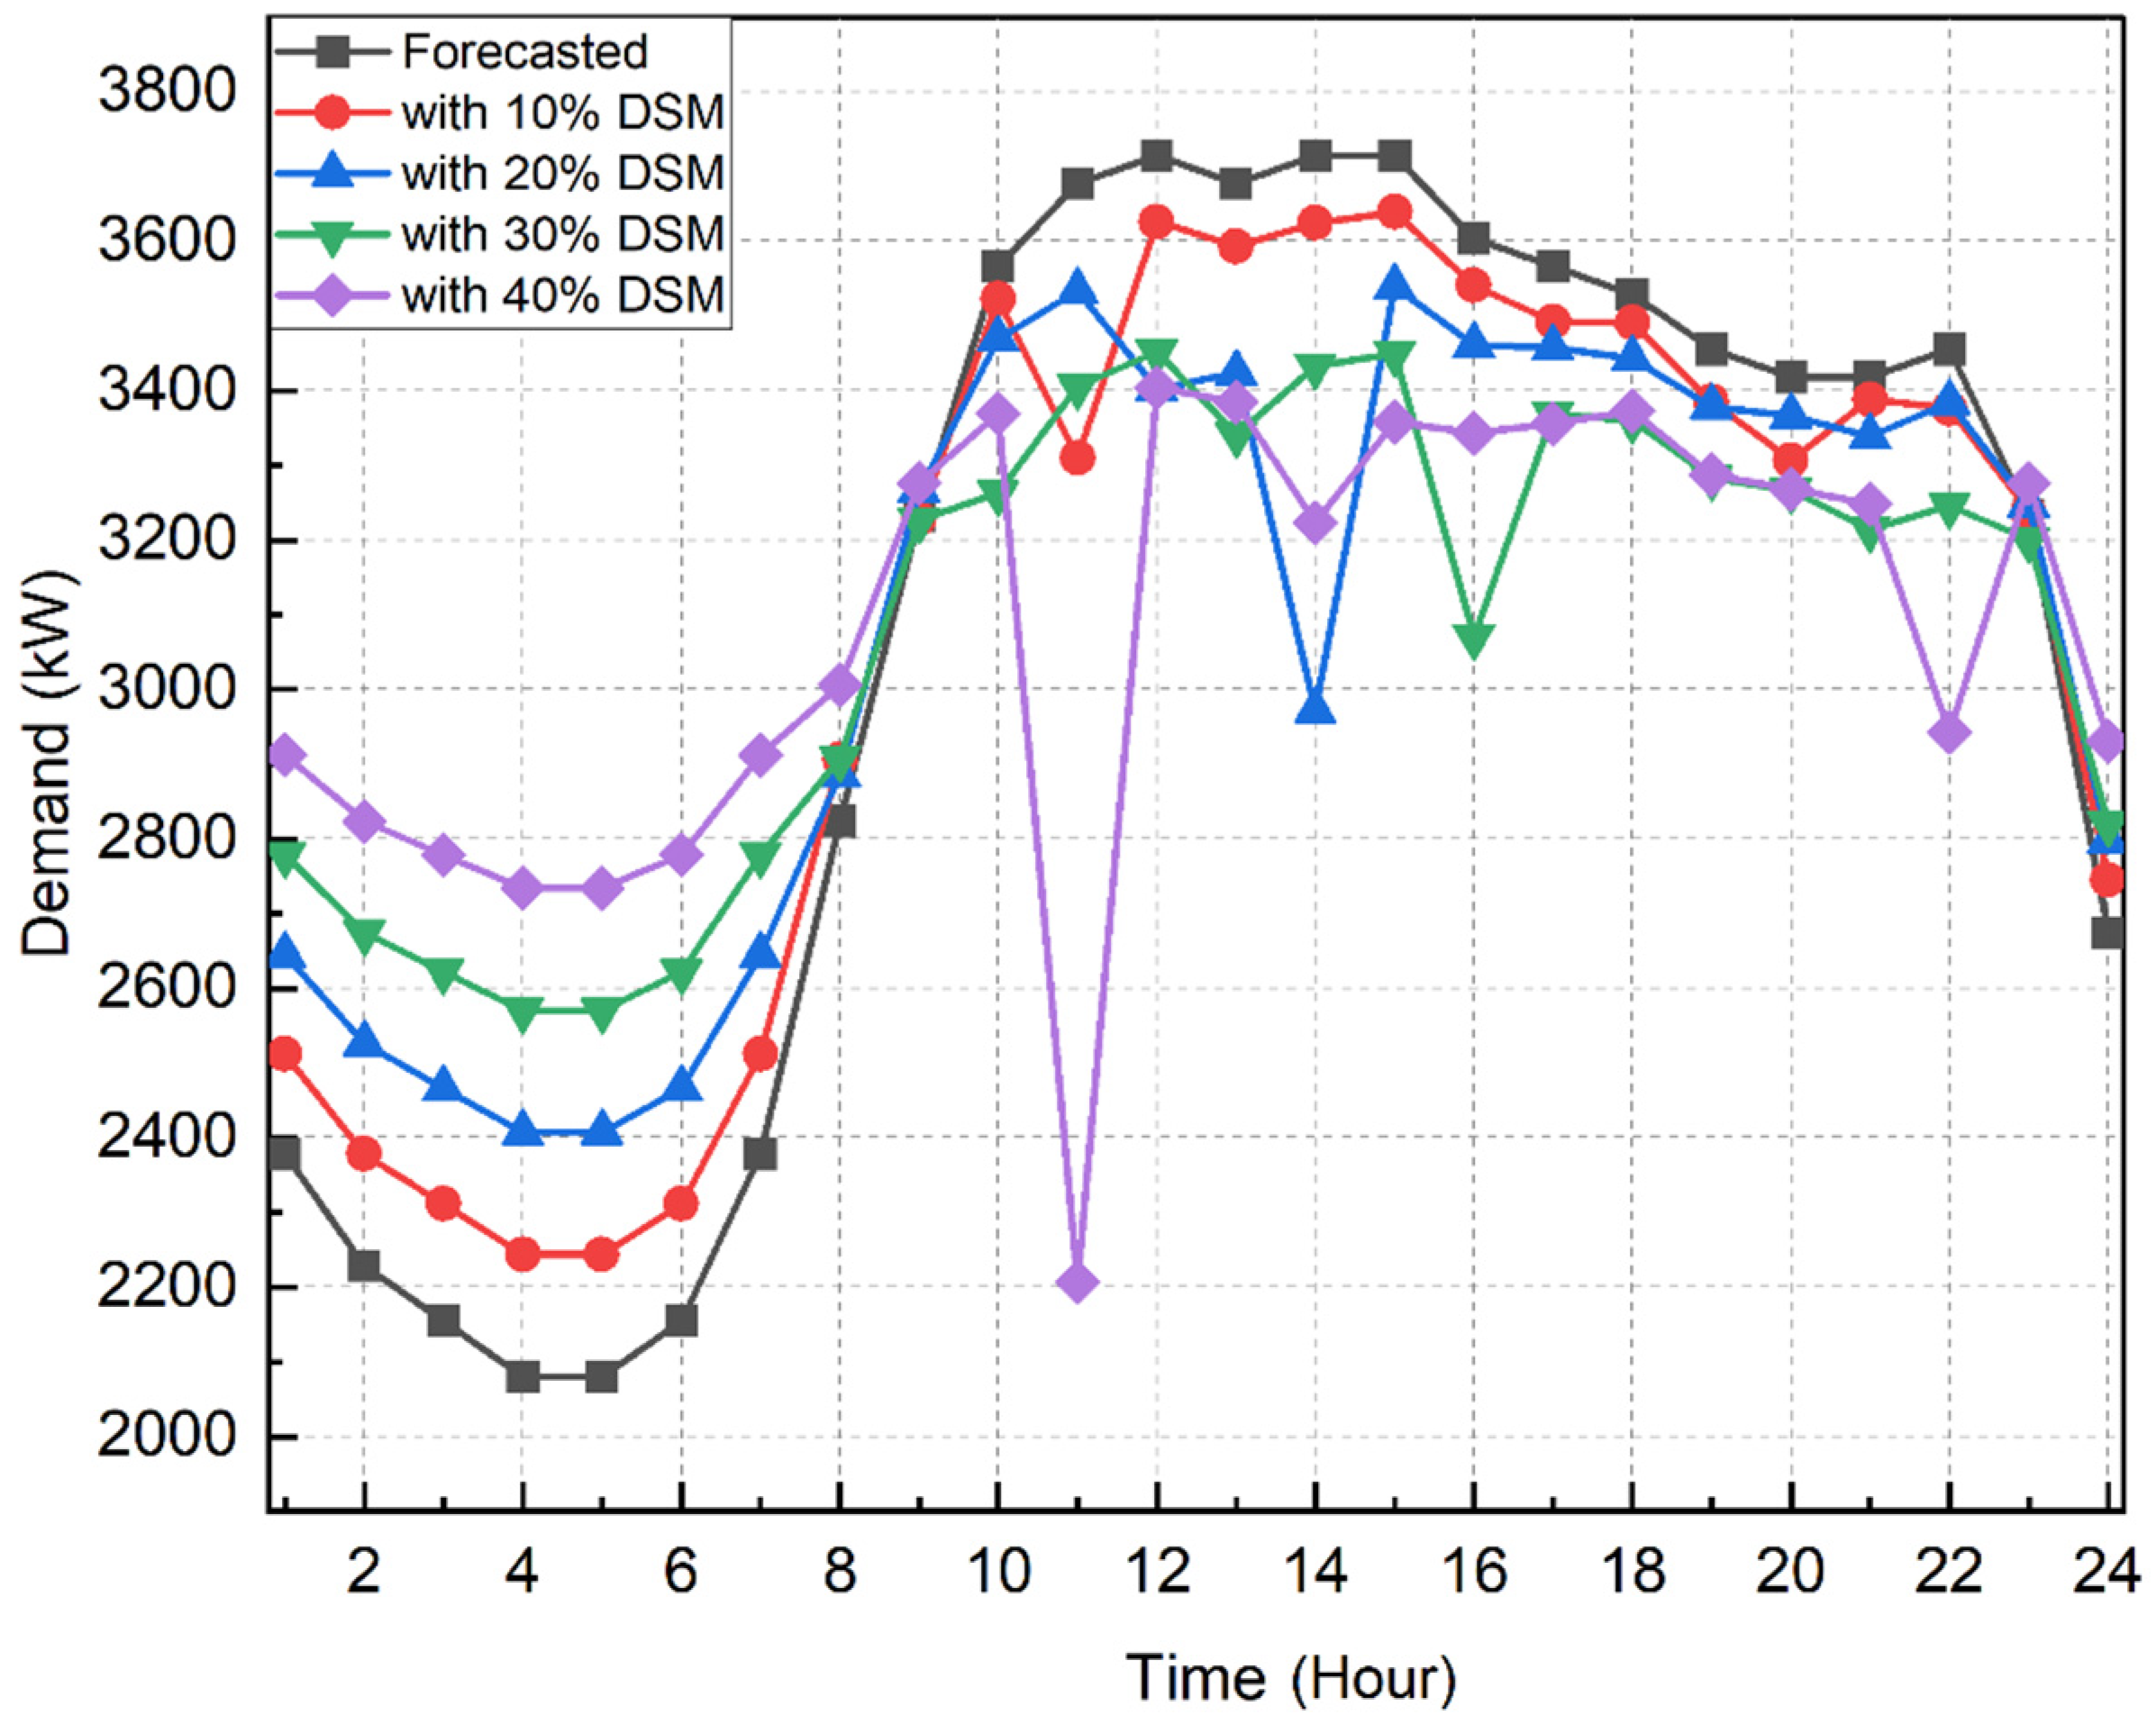
The forecasted load demand model was restructured for various levels of DSM participation ranging from 10–40%. The restructuring was done by optimally shifting the elastic loads using DE algorithm as explained in Section 2.1. For every participation level, the total load demand, average demand, peak demand and load factor were noted. It can be seen from Table 3 that the peak demand decreased from 2–8% as the DSM participation level increased. Similarly, the load factor improved from 0.82 to 0.90 upon increasing the participation of elastic loads. These are the positive effects of involvement of DSM strategy for efficient operation of any distribution system. It is also important to note that the overall load demand and average load demand remained unaltered for all the levels of DSM participation. Figure 7 shows the restructured load model for different levels of DSM participation.

3.1.2. Stage 2: Exhaustive Techno-Economic Analysis

As mentioned in Table 2, seven scenarios were analyzed to evaluate the minimized generation cost of the MG system. This stage discusses those scenarios in depth and performs a comparative analysis with the ideal case. The generation costs for various scenarios are displayed in Table 4 and are explained below:
Case 1Without DERs: it is assumed that the grid supplies the entire load demand of the MG system and there is no DER, neither RES nor fossil-fueled DERs are present. In that case, the generation cost of the MG system per day was $23,203 for forecasted load demand, which reduced gradually to $22,095 when DSM participation was increased up to 40%.
Case 2Ideal Case: As hinted by the name of the scenario, this is the ideal case of MG operation, meaning all the DERs are actively participating to share the load demands every hour. In this case, the grid buys and sells power to and from the MG at the same price (denoted by CP in Figure 6). The generation cost in this case was found to be $8326, which is a 64% reduction from the previous case. This signifies the benefits of an MG system where DERs share the load demand, instead of being solely dependent on the grid. Moreover, the generation cost dropped to $7311 when the restructured load demand with 40% DSM participation level was considered. Figure 8 displays the load sharing model of the DERs for this case when generation cost was minimized to $7311. The grid actively buying and selling power can be clearly seen from Figure 6. Since this is considered to be the ideal case, the rest of the cases shall be compared with this.
Case 3Without RES: The contribution of the WT was not considered in this scenario. The total output of the WT as shown in Figure 5 was 5525 kW, which is 7% of the total load demand of the MG system. The generation cost in this case was found to be $9857, which is an approximate 18% increase over the ideal case.
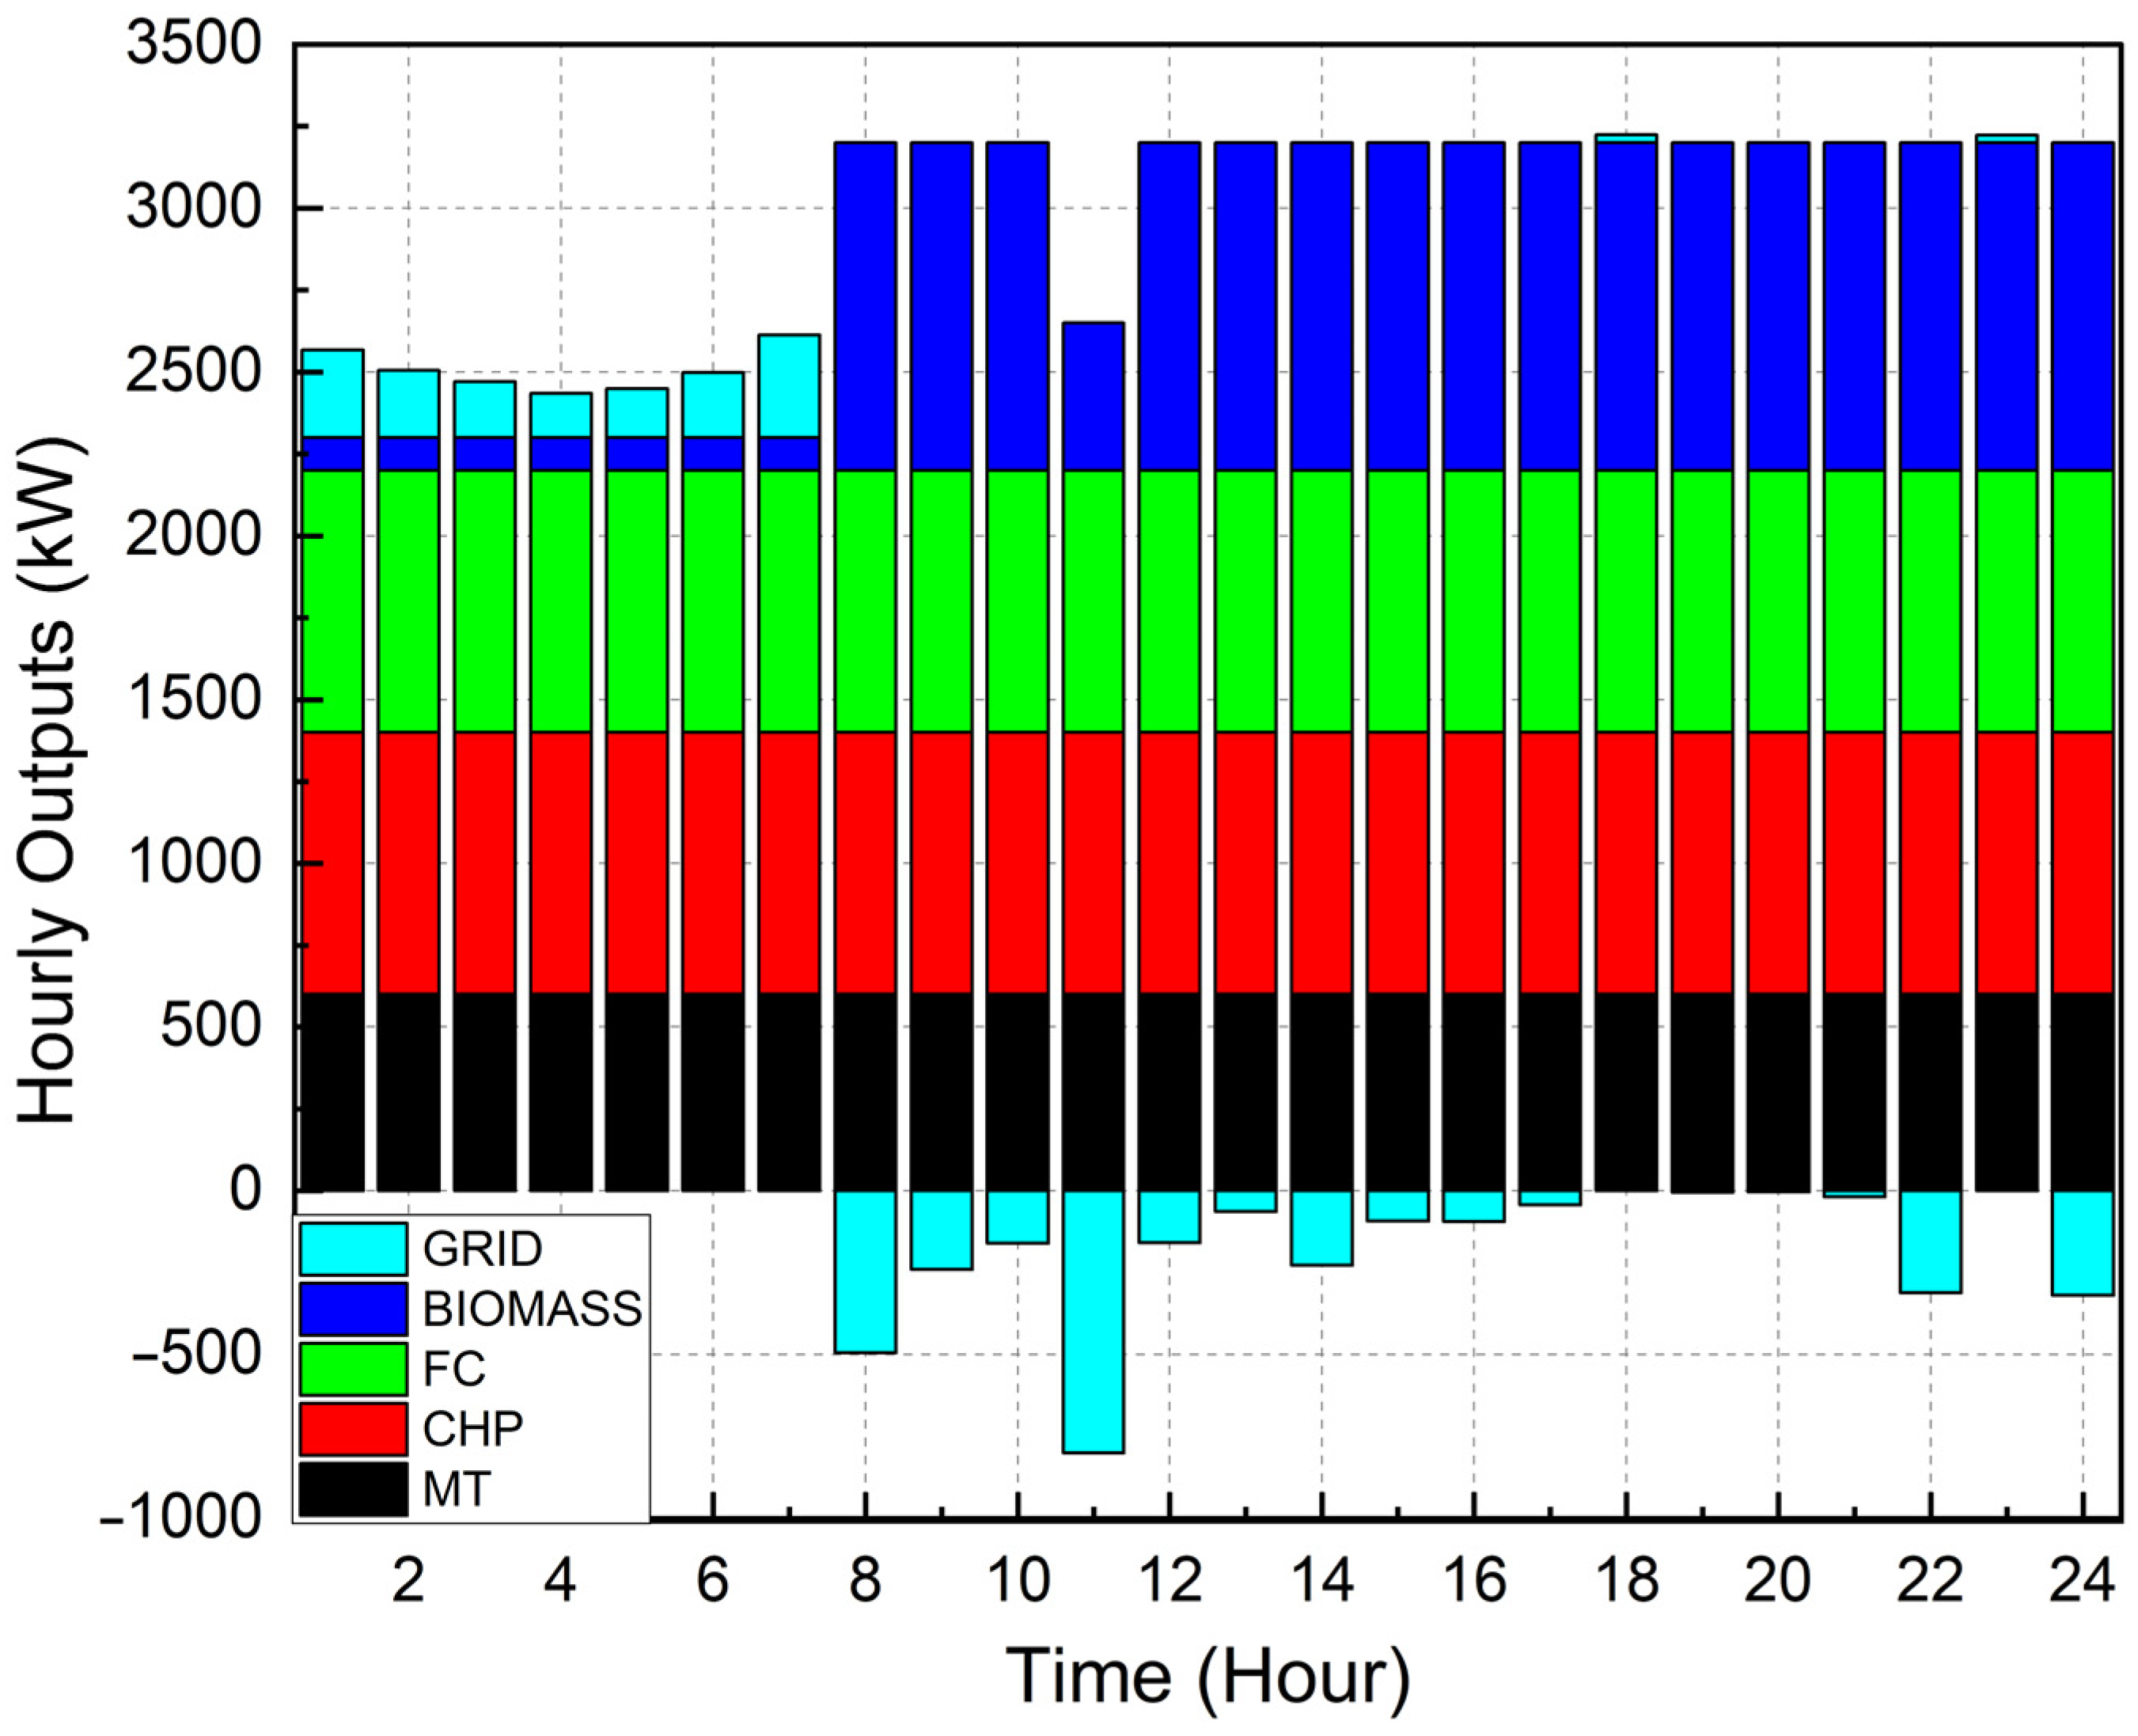
Case 4Passive Grid: In this case, the participation of the grid is demand-centric. This means that the grid will only supply power if the load demand is not being met by the rest of the DERs. For the rest of the time, the grid will be in stand-by mode. Mathematically, this scenario can be achieved by fixing the lower limit of the grid to zero. Since the grid is not actively participating in buying and selling the power, it is quite obvious that the generation cost in this case ($8571) will be more than the ideal case ($8326). Figure 9 shows the hourly output of DERs when the generation cost was minimized for Case 4 with 40% DSM. It can be seen that the grid is supplying power from hours 1 through 7 and 23. There is no negative value of the grid in the figure, unlike Figure 8.
Case 5 & Case 6Taxable SP: The grid buys and sells power with different amounts and the same was mathematically modelled in (3) and (4) above. The tax was 20% for Case 5 and 50% for Case 6. The generation cost with 20% tax was found to be $8475 and with 50% tax was found to be $8562. In either of the cases, the generation cost was found to be more than the ideal case both with and without DSM.
Case 7Different SP/CP: The electricity market price in this case is followed as shown in Figure 6. Here, the generation cost is more than the ideal case too.
Overall observation
  • Ideal case is the best case with lowest generation cost among all the scenarios studied.
  • The generation cost during all the cases decreased with increase in DSM-level participation, which means that load restructuring using DSM strategy is a positive cost-effective approach for MG operation.
  • The aforementioned points and a pictorial display of Table 3 can be seen in Figure 10.
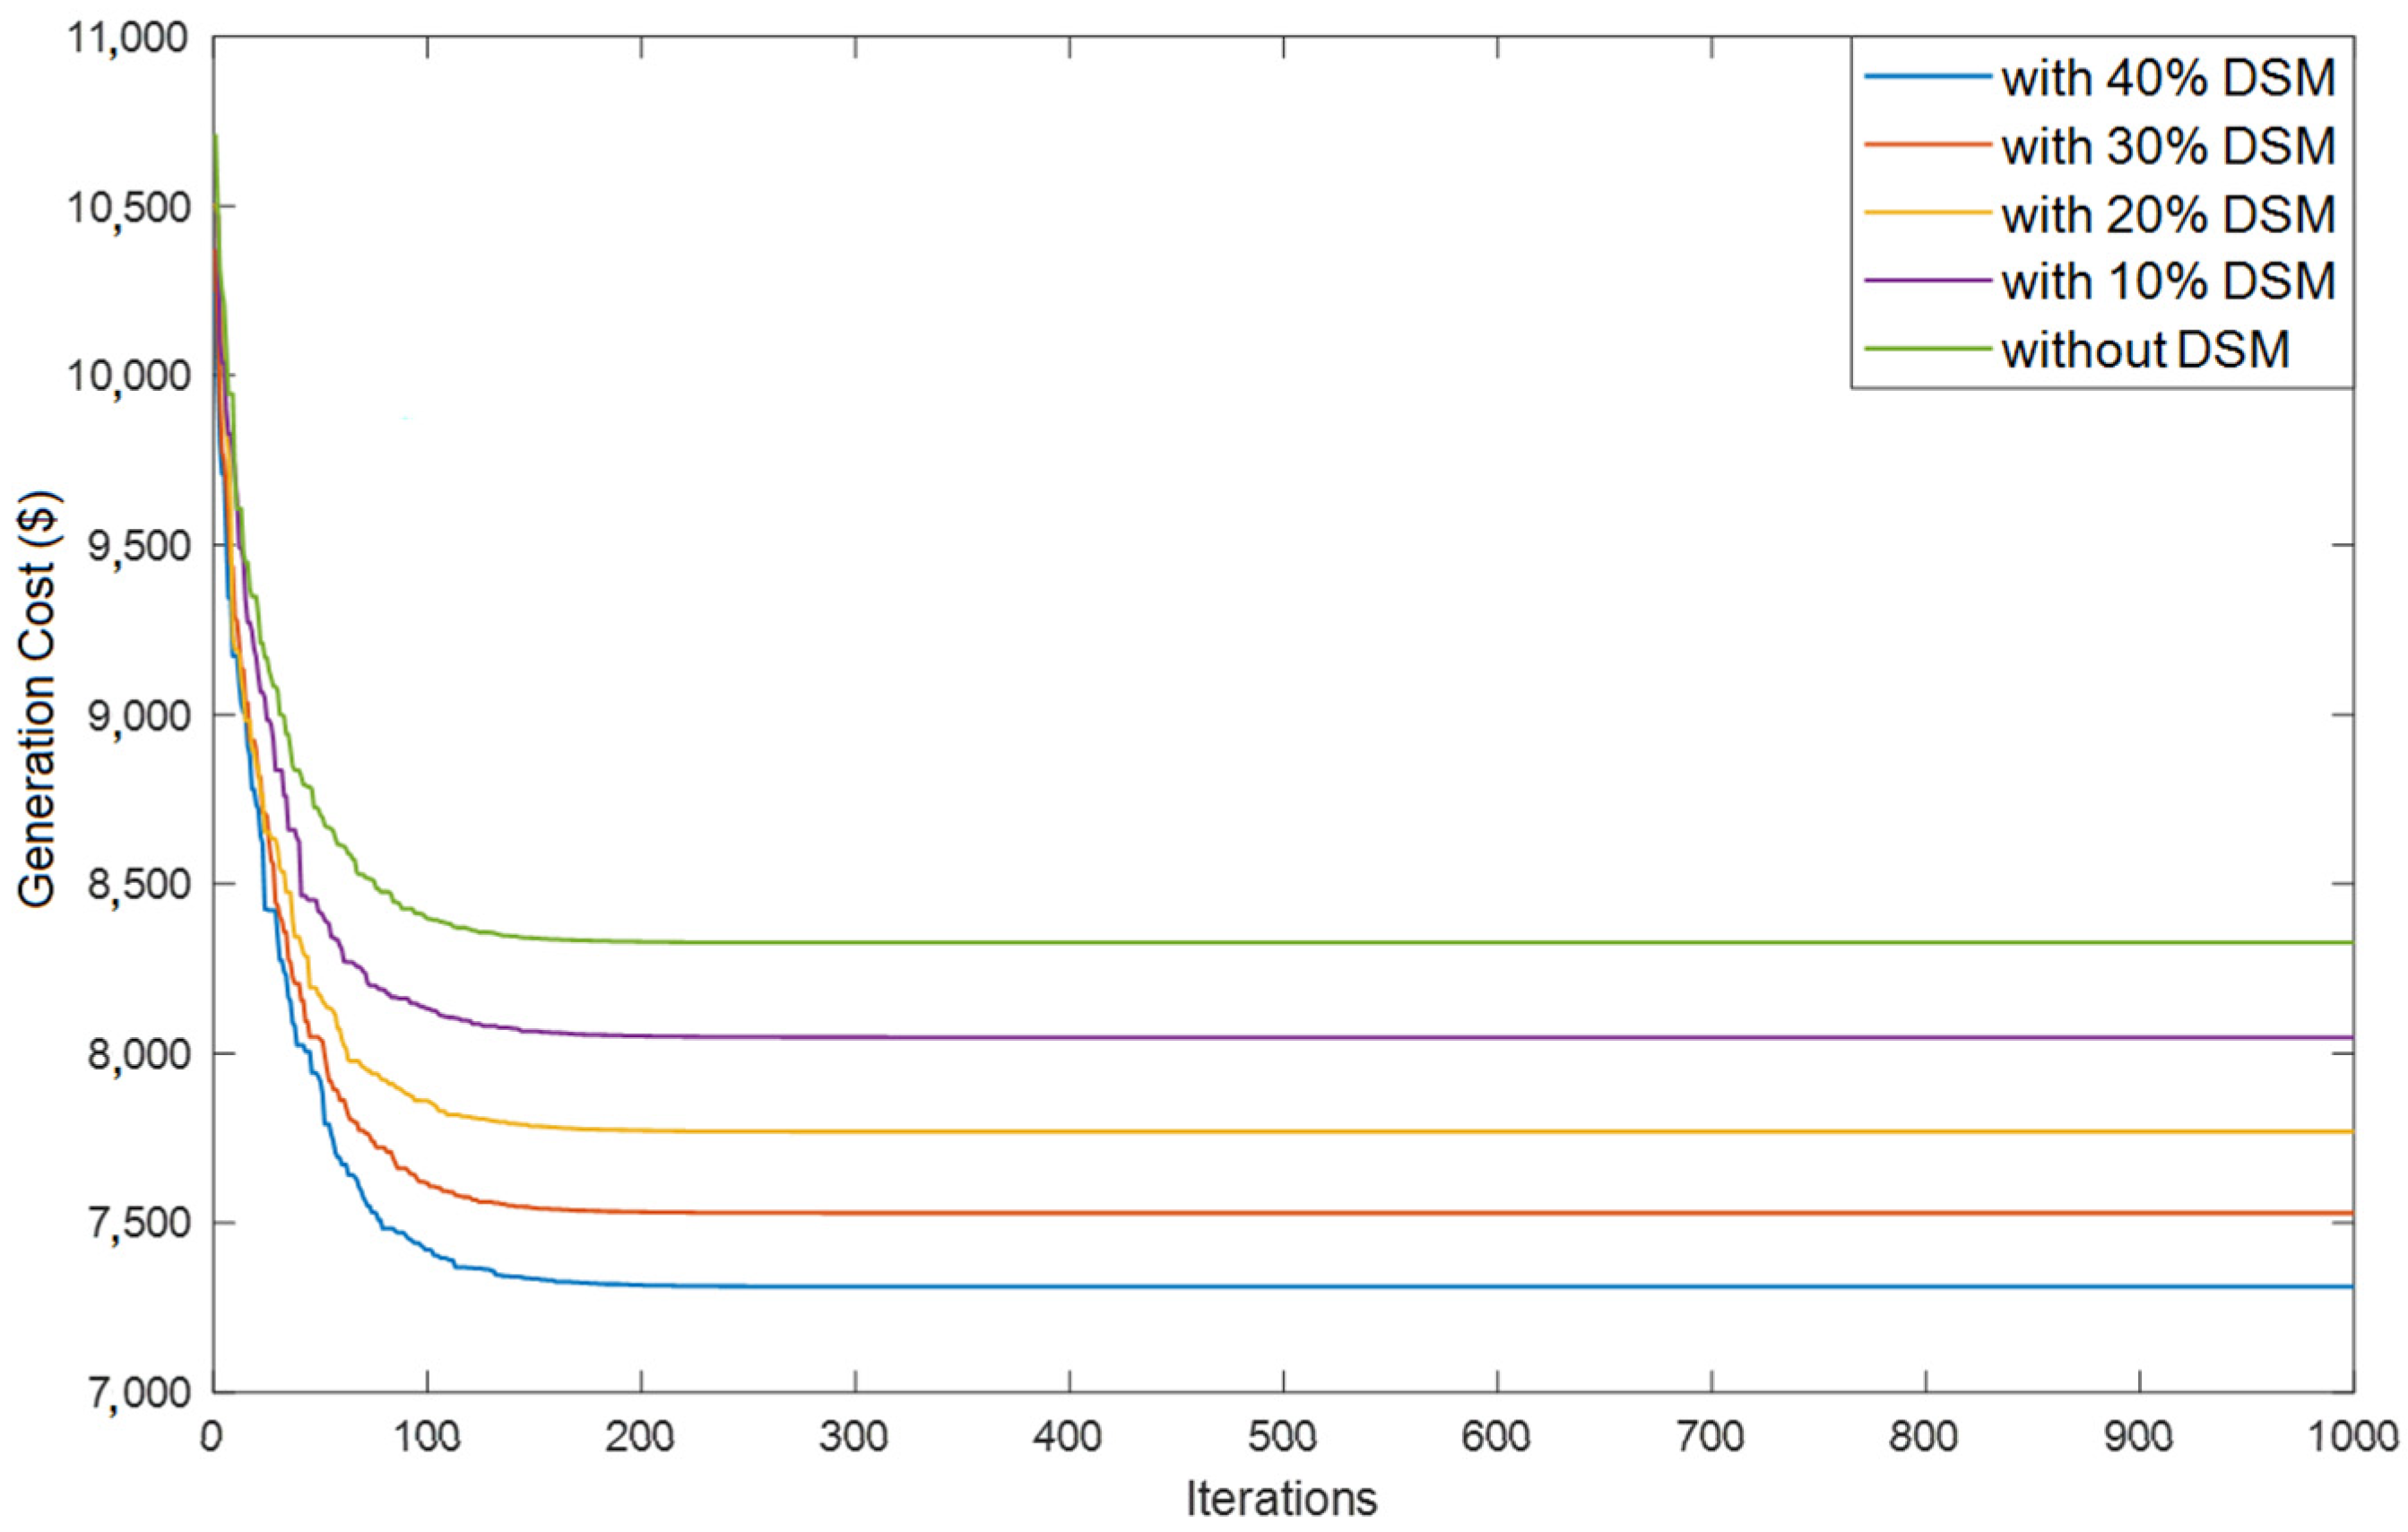
The convergence curve characteristics for the optimization algorithm for various levels of DSM participation on the ideal case of MG operation are shown in Figure 11.
Discussion on results obtained: Numerical results obtained after performing exhaustive techno-economic analysis of a LV microgrid system for seven different cases point towards various major findings, along with the vital role of DSM. The importance of an actively-participating grid in buying and selling power to and from the microgrid system is unavoidable for the efficient, reliable and economic operation of a microgrid system. Furthermore, the grid needs to charge the power transacted with the microgrid system on a dynamic time-of-usage (TOU) basis. An efficient economic strategy called DSM is applicable only when the electricity market price is dynamic and TOU–based, and not if a fixed price is charged by the grid. These aforementioned findings that conclude the study have also been affirmed by recently-published articles [42,43].

4. Conclusions

Seven different cases were studied in this research, all of which aimed to minimize the generation cost of the low voltage grid-connected MG system. The results and findings lead to the following conclusions:
  • The generation cost is minimized when the grid actively buys and sells power to and from the MG system. Passive participation of the grid may act as back-up to supply deficit power but have no role in decreasing the MG cost.
  • TOU-based electricity market pricing strategy where the grid buys and sells power with the same price incurs the least generation cost compared to any other electricity market pricing strategies.
  • DSM plays a significant role in minimizing the generation cost of the MG system. Additionally, it also improves the load factor of the system and reduces the peak demand, as observed by the results obtained.

5. Future Works

In order to expand the horizon of research in the field of clean and economic MG operation using DSM, incorporation of practical challenges such as charging and discharging allocation of electric vehicles, and solving reliability issues such as the probability of power supply loss, may seek to raise the complexity of the current work and attend to the practical issues trending in the pertaining area.

Author Contributions

Conceptualization, B.D. and S.D.; methodology, B.D.; software, B.D.; validation, B.D. and S.D.; formal analysis, B.D.; investigation, S.D.; writing—original draft preparation, S.D.; writing—review and editing, F.P.G.M.; supervision, F.P.G.M. All authors have read and agreed to the published version of the manuscript.

Funding

The work reported herewith has been financially by the Dirección General de Universidades, Investigación e Innovación of Castilla-La Mancha (Spain) and the European Regional Development Fund, under Research Grant ProSeaWind project (Ref.: SBPLY/19/180501/000102).

Data Availability Statement

Data is available only on request.

Conflicts of Interest

The authors declare no conflict of interest.

References

  1. Ghosh, B.; Dey, B.; Bhattacharya, A. Solving economic load dispatch problem using hybrid Krill Herd algorithm. In Proceedings of the 2015 International Conference on Energy, Power and Environment: Towards Sustainable Growth (ICEPE), Shillong, India, 12–13 June 2015. [Google Scholar]
  2. Yalcinoz, T.; Short, M.J. Neural networks approach for solving economic dispatch problem with transmission capacity constraints. IEEE Tran. on Pow. Sys. 1998, 13, 307–313. [Google Scholar] [CrossRef]
  3. Dhillon, J.; Parti, S.C.; Kothari, D.P. Stochastic economic emission load dispatch. Elect. Pow. Sys. Res. 1993, 26, 179–186. [Google Scholar] [CrossRef]
  4. Wang, C.; Shahidehpour, S.M. Ramp-rate limits in unit commitment and economic dispatch incorporating rotor fatigue effect. IEEE Tran. on Pow. Sys 1994, 9, 1539–1545. [Google Scholar] [CrossRef]
  5. Kai, S.; Qing, L.; Jizhen, L.; Yuguang, N.; Ruifeng, S.; Yang, B. New combination strategy of genetic and tabu algorithm an economic load dispatching case study. In Proceedings of the 2011 Chinese Control and Decision Conference (CCDC), Mianyang, China, 23–25 May 2011. [Google Scholar]
  6. Bhattacharya, A.; Chattopadhyay, P.K. Solving complex economic load dispatch problems using biogeography-based optimization. Exp. Sys. with App. 2010, 37, 3605–3615. [Google Scholar] [CrossRef]
  7. Sinha, N.; Chakrabarti, R.; Chattopadhyay, P.K. Evolutionary programming techniques for economic load dispatch. IEEE Trans. Evol. Comp. 2003, 7, 83–94. [Google Scholar] [CrossRef]
  8. Daniel, L.; Chaturvedi, K.T.; Kolhe, M.L. Dynamic Economic Load Dispatch using Levenberg Marquardt Algorithm. Energy Procedia 2018, 144, 95–103. [Google Scholar] [CrossRef]
  9. Hosseinnezhad, V.; Babaei, E. Economic load dispatch using θ-PSO. Int. J. Electr. Pow. Energy Syst. 2013, 49, 160–169. [Google Scholar] [CrossRef]
  10. Yang, X.; Leng, Z.; Xu, S.; Yang, C.; Yang, L.; Liu, K.; Zhang, L. Multi-objective optimal scheduling for CCHP microgrids considering peak-load reduction by augmented ε-constraint method. Renew. Energy 2021, 172, 408–423. [Google Scholar] [CrossRef]
  11. Nwulu, N.I.; Xia, X. Optimal dispatch for a microgrid incorporating renewables and demand response. Renew. Energy 2017, 101, 16–28. [Google Scholar] [CrossRef]
  12. Coelho, V.N.; Coelho, I.M.; Coelho, B.N.; Cohen, M.W.; Reis, A.J.; Silva, S.M.; Souza, M.J.; Fleming, P.J.; Guimarães, F.G. Multi-objective energy storage power dispatching using plug-in vehicles in a smart-microgrid. Renew. Energy 2016, 89, 730–742. [Google Scholar] [CrossRef]
  13. Grefenstette, J.J. Genetic algorithms and machine learning. In Proceedings of the Sixth Annual Conference on Computational Learning Theory, Santa Cruz, CA, USA, 26–28 July 1993. [Google Scholar]
  14. Dutta, S.; Reddy, M.J.B.; Mohanta, D.K.; Kushwah, M.S.; Sadhu, P.K. μPMU-based intelligent island detection–the first crucial step toward enhancing grid resilience with MG. IET Sma. Gri. 2020, 3, 162–173. [Google Scholar] [CrossRef]
  15. Chen, C.; Duan, S.; Cai, T.; Liu, B.; Hu, G. Smart energy management system for optimal microgrid economic operation. IET Renew. Power Gener. 2011, 5, 258–267. [Google Scholar] [CrossRef]
  16. Kasaei, M.J. Energy and operational management of virtual power plant using imperialist competitive algorithm. Int. Trans. Electr. Energy Syst. 2018, 28, e2617. [Google Scholar] [CrossRef]
  17. Basu, M.A.; Chowdhury, A. Cuckoo search algorithm for economic dispatch. Energy 2013, 60, 99–108. [Google Scholar] [CrossRef]
  18. Moghaddam, A.A.; Seifi, A.; Niknam, T.; Pahlavani, M.R.A. Multi-objective operation management of a renewable MG (micro-grid) with back-up micro-turbine/fuel cell/battery hybrid power source. Energy 2011, 36, 6490–6507. [Google Scholar] [CrossRef]
  19. Rabiee, A.; Sadeghi, M.; Aghaei, J. Modified imperialist competitive algorithm for environmental constrained energy management of microgrids. J. Clean. Prod. 2018, 202, 273–292. [Google Scholar] [CrossRef]
  20. Trivedi, I.N.; Jangir, P.; Bhoye, M.; Jangir, N. An economic load dispatch and multiple environmental dispatch problem so-lution with microgrids using interior search algorithm. Neur. Comp. App. 2018, 30, 2173–2189. [Google Scholar] [CrossRef]
  21. Elattar, E.E. Modified harmony search algorithm for combined economic emission dispatch of microgrid incorporating renewable sources. Energy 2018, 159, 496–507. [Google Scholar] [CrossRef]
  22. Faseela, C.K.; Vennila, H. Economic and emission dispatch using Whale Optimization Algorithm (WOA). Int. J. Electr. Comput. Eng. 2018, 8, 1297. [Google Scholar] [CrossRef]
  23. Kumar, K.P.; Saravanan, B.; Swarup, K.S. Optimization of Renewable Energy Sources in a Microgrid Using Artificial Fish Swarm Algorithm. Energy Procedia 2016, 90, 107–113. [Google Scholar] [CrossRef]
  24. Gholami, K.; Dehnavi, E. A modified particle swarm optimization algorithm for scheduling renewable generation in a mi-cro-grid under load uncertainty. Appl. Soft Comp. 2019, 78, 496–514. [Google Scholar] [CrossRef]
  25. Askarzadeh, A. A Memory-Based Genetic Algorithm for Optimization of Power Generation in a Microgrid. IEEE Trans. Sustain. Energy 2017, 9, 1081–1089. [Google Scholar] [CrossRef]
  26. Ramli, M.A.; Bouchekara, H.R.E.H.; Alghamdi, A.S. Efficient Energy Management in a Microgrid with Intermittent Renewable Energy and Storage Sources. Sustainability 2019, 11, 3839. [Google Scholar] [CrossRef] [Green Version]
  27. Maulik, A.; Das, D. Optimal operation of microgrid using four different optimization techniques. Sustain. Energy Technol. Assessments 2017, 21, 100–120. [Google Scholar] [CrossRef]
  28. Nayak, A.; Maulik, A.; Das, D. An integrated optimal operating strategy for a grid-connected AC microgrid under load and renewable generation uncertainty considering demand response. Sustain. Energy Technol. Assess. 2021, 45, 101169. [Google Scholar] [CrossRef]
  29. Harsh, P.; Das, D. Energy management in microgrid using incentive-based demand response and reconfigured network considering uncertainties in renewable energy sources. Sustain. Energy Technol. Assess. 2021, 46, 101225. [Google Scholar] [CrossRef]
  30. Tah, A.; Das, D. Operation of small hybrid autonomous power generation system in isolated, interconnected and grid connected modes. Sustain. Energy Technol. Assess. 2016, 17, 11–25. [Google Scholar] [CrossRef]
  31. Younes, Z.; Alhamrouni, I.; Mekhilef, S.; Reyasudin, M. A memory-based gravitational search algorithm for solving economic dispatch problem in micro-grid. Ain Shams Eng. J. 2021, 12, 1985–1994. [Google Scholar] [CrossRef]
  32. Mirjalili, S.; Mirjalili, S.M.; Lewis, A. Grey wolf optimizer. Adv. Eng. Soft. 2014, 69, 46–61. [Google Scholar] [CrossRef] [Green Version]
  33. Khandelwal, A.; Bhargava, A.; Sharma, A.; Sharma, H. Modified Grey Wolf Optimization Algorithm for Transmission Network Expansion Planning Problem. Arab. J. Sci. Eng. 2018, 43, 2899–2908. [Google Scholar] [CrossRef]
  34. Mirjalili, S. SCA: A Sine Cosine Algorithm for solving optimization problems. Knowl. Based Syst. 2016, 96, 120–133. [Google Scholar] [CrossRef]
  35. Askarzadeh, A. A novel metaheuristic method for solving constrained engineering optimization problems: Crow search algorithm. Comput. Struct. 2016, 169, 1–12. [Google Scholar] [CrossRef]
  36. Das, S.; Suganthan, P.N. Problem Definitions and Evaluation Criteria for CEC 2011 Competition on Testing Evolutionary Algorithms on Real World Optimization Problems; Jadavpur University, Nanyang Technological University: Kolkata, India, 2010. [Google Scholar]
  37. Rizk-Allah, R.M.; Hassanien, A.E.; Bhattacharyya, S. Chaotic crow search algorithm for fractional optimization problems. Appl. Soft Comput. 2018, 71, 1161–1175. [Google Scholar] [CrossRef]
  38. Kumar, K.P.; Saravanan, B. Day ahead scheduling of generation and storage in a microgrid considering demand Side man-agement. J. Energy Storage 2019, 21, 78–86. [Google Scholar] [CrossRef]
  39. Sharma, S.; Bhattacharjee, S.; Bhattacharya, A. Operation cost minimization of a Micro-Grid using Quasi-Oppositional Swine Influenza Model Based Optimization with Quarantine. Ain Shams Eng. J. 2018, 9, 45–63. [Google Scholar] [CrossRef] [Green Version]
  40. Sharma, S.; Bhattacharjee, S.; Bhattacharya, A. Grey wolf optimisation for optimal sizing of battery energy storage device to minimise operation cost of microgrid. IET Gener. Transm. Distrib. 2016, 10, 625–637. [Google Scholar] [CrossRef]
  41. Wei, J.; Zhang, Y.; Wang, J.; Wu, L.; Zhao, P.; Jiang, Z. Decentralized Demand Management Based on Alternating Direction Method of Multipliers Algorithm for Industrial Park with CHP Units and Thermal Storage. J. Mod. Power Syst. Clean Energy 2022, 10, 120–130. [Google Scholar] [CrossRef]
  42. Dey, B.; Raj, S.; Mahapatra, S.; Márquez, F.P.G. Optimal scheduling of distributed energy resources in microgrid systems based on electricity market pricing strategies by a novel hybrid optimization technique. Int. J. Electr. Power Energy Syst. 2021, 134, 107419. [Google Scholar] [CrossRef]
  43. Dey, B.; Bhattacharyya, B.; Devarapalli, R. A novel hybrid algorithm for solving emerging electricity market pricing problem of microgrid. Int. J. Intell. Syst. 2021, 36, 919–961. [Google Scholar] [CrossRef]
  44. Lokeshgupta, B.; Sivasubramani, S. Multi-objective harmony search algorithm for dynamic optimal power flow with demand side management. Electr. Power Comp. Syst. 2019, 47, 692–702. [Google Scholar]
  45. Lokeshgupta, B.; Sivasubramani, S. Multi-objective dynamic economic and emission dispatch with demand side management. Int. J. Electr. Power Energy Syst. 2018, 97, 334–343. [Google Scholar] [CrossRef]
  46. Datta, J.; Das, D. Stochastic Energy Management of grid-connected microgrid considering battery degradation cost and re-newables penetration. In Proceedings of the 2020 IEEE International Conference on Power Systems Technology, Bangalore, India, 14–16 September 2020. [Google Scholar]
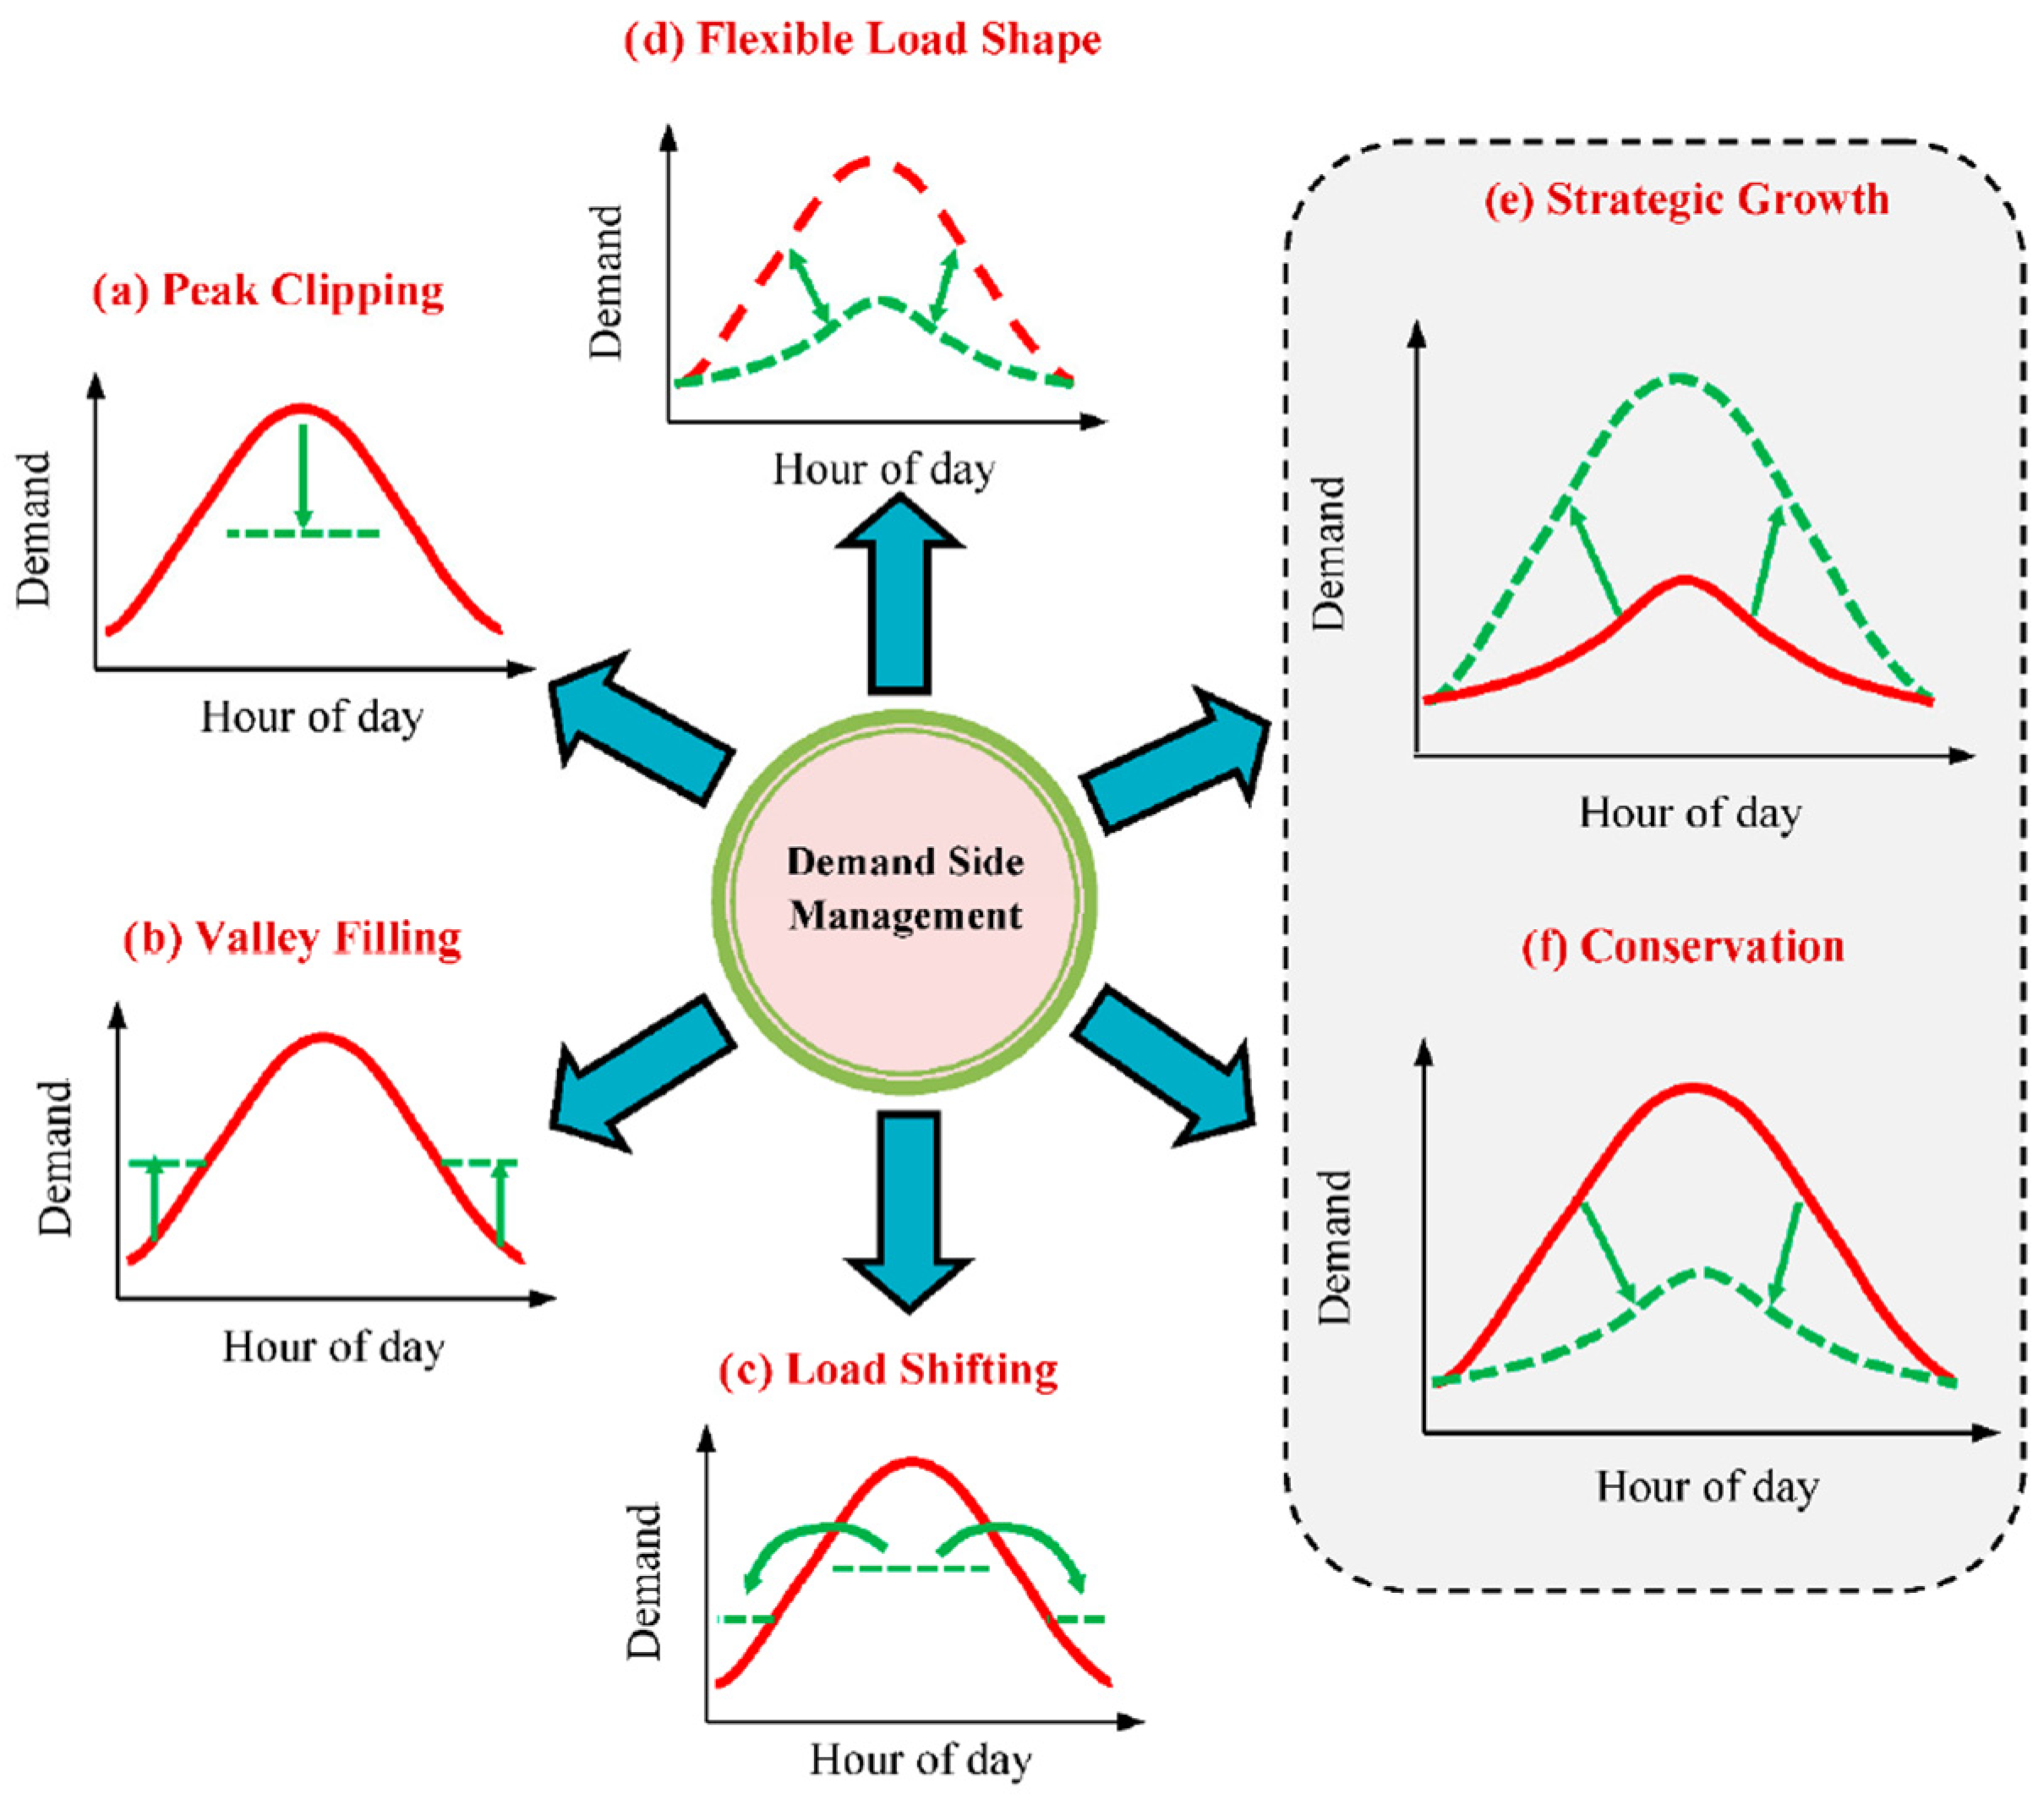
Figure 1. Load shaping methods of DSM [45].
Sustainability 15 01795 g001
Figure 2. Flowchart of DE implementation for microgrid energy management problem.
Sustainability 15 01795 g002
Figure 3. Single-line diagram of the test system.
Sustainability 15 01795 g003
Figure 4. Load demand ratio for the system with respect to peak demand.
Sustainability 15 01795 g004
Figure 5. Hourly forecasted wind power corresponding to the speed (the square is hourly wind speed and the circle is hourly wind output power).
Sustainability 15 01795 g005
Figure 6. Hourly electricity market price (the square is the price of energy purchased and the circle is the price of energy sold).
Sustainability 15 01795 g006
Figure 7. Restructured load demand without and with various level of DSM participation.
Sustainability 15 01795 g007
Figure 8. Hourly load sharing among DERs for ideal case with 40% DSM.
Sustainability 15 01795 g008
Figure 9. Hourly load sharing among DERs for passive grid case with 40% DSM.
Sustainability 15 01795 g009
Figure 10. Exhaustive techno-economic analysis.
Sustainability 15 01795 g010
Figure 11. Convergence curve characteristics of the optimization tool for ideal case.
Sustainability 15 01795 g011
Table 1. DER parameters [46].
Distributed Generation UnitsMicro TurbineCombined Heat and PowerNatural Gas Fuel CellBiomassGrid
Pmin (kW)100100100100−800
Pmax (kW)6008008001000800
Fuel Cost ($/kWh)0.0210.0270.0270.063Figure 6
Operational and Maintenance Cost ($/kWh)0.005870.004190.004190.01258NA
Efficiency0.30.350.350.29NA
Emission (kg/kWh)0.7240.4080.3360.0030.547
Table 2. Detailed techno-economic analysis.
CaseBrief NomenclatureDetailed Description
1Without DEROnly grid will supply power and fulfill demand of the MG
2Ideal CaseAll the DERs and grid will participate actively to share demand. Grid will buy and sell electricity with the same price.
3Without RESSame as scenario 2 excluding the contribution wind system
4Passive GridGrid acts as back up to supply (sell) power only [42].
520% taxable priceCost function of grid follows (3) and (4); tax = 20% [42,46]
650% taxable priceCost function of grid follows (3) and (4); tax = 50% [42,46]
7Different CP/SPElectricity price followed as Figure 6 [42].
Table 3. Loads demand analysis for various levels of DSM participation.
Without DSM10% DSM20% DSM30% DSM40% DSM
Total Demand (kW)73,928.573,928.499373,928.499673,928.500173,928.5
Peak Demand (kW)37153639.07853539.74083452.6023404.255
Average Demand (kW)3080.35413080.35413080.35413080.3563080.354
Peak Reduction (%)Ref2.044.737.078.371
Load Factor0.82910.84640.87020.89210.9048
Table 4. Detailed generation costs ($) obtained for diverse scenarios and DSM levels.
Case 1Case 2Case 3Case 4Case 5Case 6Case 7
Without DSM23,203832698578571847585628475
10% DSM22,924804795788264817982578179
20% DSM22,646776992998000790879967908
30% DSM22,405752890597771767977717679
40% DSM22,095731187817744751376907513
Disclaimer/Publisher’s Note: The statements, opinions and data contained in all publications are solely those of the individual author(s) and contributor(s) and not of MDPI and/or the editor(s). MDPI and/or the editor(s) disclaim responsibility for any injury to people or property resulting from any ideas, methods, instructions or products referred to in the content.