Article

Classroom Quantitative Evaluation: A Method of Both Formative and Summative Evaluation

1
Key Laboratory of Complex Systems and Intelligent Optimization of Guizhou Province, Duyun 558000, China
2
School of Mathematics and Statistics, Qiannan Normal University for Nationalities, Duyun 558000, China
3
School of Mathematical Sciences, East China Normal University, Shanghai 200241, China
4
College of Education, Xinjiang Normal University, Urumqi 830013, China
5
School of Computer and Information, Qiannan Normal University for Nationalities, Duyun 558000, China
*
Author to whom correspondence should be addressed.
Sustainability 2023, 15(3), 1783; https://doi.org/10.3390/su15031783
Submission received: 18 October 2022 / Revised: 9 January 2023 / Accepted: 12 January 2023 / Published: 17 January 2023

Abstract

:
As the most important carrier of education and teaching, the quality of classroom teaching directly affects the quality of formal school education. Traditional classroom teaching evaluation is usually based on expert experience, which can only give sporadic and one-sided evaluation results, and it is difficult for teachers to obtain systematic and operational improvement schemes, which has caused great obstacles to teachers’ sustainable development. Based on the concept of teachers’ sustainable development and Flanders Interactive Analysis System (FIAS), this study evaluates classroom teaching from two aspects: formative evaluation and summative evaluation. From the perspective of formative evaluation, a quantitative comprehensive analysis framework of classroom teaching language is constructed from two aspects of matrix analysis and dynamic curve analysis. The matrix analysis makes an in-depth analysis of classroom teaching from five aspects: classroom teaching structure, teaching style, classroom atmosphere, variable analysis, and question innovation degree. The dynamic curve of the classroom is analyzed from three aspects: teacher talk, student talk, as well as silence and confusion. From the perspective of summative evaluation, this paper combines the projection pursuit of entropy (PPE) model to form a class teaching grade evaluation model. On the basis of the above model, this study selects 5 + 5 (five expert teachers and five novice teachers) lessons that have heterogeneous forms for the same subject with Chinese high school math teachers as the research objects. Based on this framework, the verbal information of classroom teaching is encoded and a thorough analysis is carried on from the perspective of formative assessment, while at the same time, the level of classroom teaching evaluation is given from the perspective of formative evaluation. The results show that expert teachers use indirect discourse more, they also pay more attention to blank space and have a more harmonious classroom atmosphere as well as ask more innovative questions compared to novice teachers. Under the PPE model, expert teachers have higher scores than novice teachers. This study provides a systematic and comprehensive analysis scheme for the comprehensive evaluation of classroom teaching, which not only provides comprehensive and operational information for teachers to improve their classroom teaching, but also guarantees the sustainable development of teachers’ specialization, and provides a solution for the summative evaluation of classroom teaching.

1. Introduction

In 1997, the United Kingdom took the lead in proposing the term “sustainable development education” to replace the two terms “environmental education” and “development education” in formal education. The United Nations Educational, Scientific and Cultural Organization (UNESCO) pointed out the connotation of sustainable development education, which emphasized that the ways and methods of education are carried out through the educational activities jointly participated by teachers and students [1]. This makes us pay more attention to the teaching activities of students and teachers in the classroom. In 2015, the United Nations adopted the 2030 Agenda for Sustainable Development, in which the macro goal of sustainable development related to education was defined as “ensuring inclusive and equitable quality education and providing lifelong learning opportunities for all” [2]. Therefore, education faces the problem of sustainable development at all levels. As the most basic and lowest field of education, classroom teaching should pay more attention to sustainable issues. The formative evaluation of classroom teaching can provide more constructive and operable improvement measures for teachers. It also increased the continuous development of classroom teaching and improved the sustainability of teachers’ professional development [3]. The sustainability of education evaluation needs new evaluation methods and tools. This study starts from the concept of teachers’ sustainable development, and based on the Flanders Interactive Analysis System [4], evaluates classroom teaching from two aspects: formative evaluation and summative evaluation. It provides a sustainable evaluation system and comprehensive analysis scheme for the comprehensive evaluation of classroom teaching, which not only provides comprehensive and operable information for the improvement of classroom teaching, but also guarantees the sustainable development of teachers’ specialization, and provides a solution for the summative evaluation of classroom teaching.
Under the influence of big data, great changes have taken place in all walks of life. In the field of education, the data still imply rich application value, but our data mining and application are far from enough. Anthony G. Picciano claimed that “the application of big data analysis in teaching is in the initial stage, especially the use of data in classroom teaching to objectively evaluate the classroom is still rare” [5]. Data in classroom teaching generally come from systematic classroom observation. It is defined by Reynolds et al. that observation is a kind of behavior that needs close attention to discover the qualities, attributes, and characteristics of students, which is the best way to evaluate students’ cognition, psychological movement, emotional characteristics, and some other characteristics, especially to focus on students’ personal behaviors in a specific environment [6]. Using systematic observation to study teaching helps to increase our understanding of effective teaching practice [7].
In 1959, Flanders developed a class interaction analysis system (FIAS) at the University of Minnesota [4], which has a profound impact on the classroom verbal behaviors of education [8,9]. FIAS is a method of quantitative analysis of classroom teaching behaviors. As an observation system, it captures the verbal behaviors of teachers and students, which are directly related to the social emotional atmosphere in the classroom. It is developed on the basis of the social psychology theory to test the influence of social emotional atmosphere on students’ attitudes and learning. The theoretical hypothesis of interaction analysis is that in the normal classroom situation, verbal communication is predominant; the teacher exerts a great deal of influence on the students and their behaviors are affected to a great extent by this type of teacher behavior [10]. Since its development, FIAS has been highly valued and widely applied by educators. Ibrahim conducted a study aiming at identifying and assessing common patterns of verbal interactions between teachers and students in Arabic classrooms [11]. The purpose of this study is to identify the advantages and disadvantages of teacher–student interactions, and to provide suggestions for the development of teacher performance. FIAS is used to analyze the language of teachers in the classroom. The results show that the predominant type of teacher’s verbal interactions in class is teacher’s conversation and silence. In addition, the percentage of the initial components of students’ conversation is significantly lower [12]. Qatami and Qatami used FIAS to train teachers on classroom verbal interactions. The results showed that teachers who had received training on classroom verbal interactions used effective teaching methods [10]. These teachers had been encouraging students’ initiative, accepting their ideas, and developing new ideas based on the students. In addition, students in the class with indirect verbal interactions of teachers exhibited significantly better performance and expressed more positive views than those in the class with direct verbal interactions of teachers. Nurmasitah examined the characteristics of classroom verbal interactions in geography class [13]. FIAS was used to analyze the prevalent interactions patterns in the classroom. The results showed that most of the time, in the classroom, the teaching process was spent on teachers’ questions and lectures, which accounted for 57.43%, and that the students’ discourse rate was 22.20%. In addition, it indicated that students were rather active in classroom verbal interactions, which presented in different forms between teacher–student and student–student. Sharma used FIAS to study the nature of verbal interactions in a mathematics classroom [14]. Two groups of ninth-grade students from urban and rural schools were collected as the research sample. It was found that the main characteristics of classroom interactions in urban schools were explanation, students’ response to teachers’ questions, and students’ initiative to ask questions or put forward ideas. It can be seen that different types of classes have great differences in verbal language, and that their features reflect the quality of classroom teaching to a certain extent.
Since the FIAS was proposed, different scholars have improved it in different aspects to obtain continuous application value. By using the adapted FIAS, Lyon Jr et al. intervened with the medical teachers in two German schools, and improved teaching behaviors through structured feedback from observers [15]. The result showed that teachers in the intervention group had significant improvement in teaching behaviors. Robson creatively adapted the Flanders system, and the instrument emphasized the basic assumptions of the language learning theory, such as the importance of practice and the effect of learning from simple language stimuli [16,17]. The instrument focuses on measuring the extent to which teacher talk has been modified to fit children’s comprehension. Based on FIAS, Gwimbi and Monk developed the science classroom observation schedule (SCOS), which is an ideal classification system consisting of 26 projects for collecting information about the extent to which teachers provide students with opportunities to build knowledge through discussion and debate. SCOS is used to determine the type and degree of verbal and non-verbal interactions between teachers and students in science classes [18].
In recent years, more and more educators have begun to pay attention to classroom observation as a means to achieve several goals, including teacher development, teacher evaluation, and impact evaluation of classroom-based interventions. Although educational practitioners and researchers have developed many observational instruments for these purposes, many developers fail to specify important criteria for instrument use [19]. Classroom interactions between teachers and students are an important part of the teaching process. The degree and quality of these interactions determine the effectiveness of the educational situation, the nature of the educational trend, and some characteristics of the educational environment [20]. Classroom management should not be limited to the use of rules and regulations as well as to the supervision of students in the educational environment, but should focus more on the management of teacher–student interactions, which involves accepting students’ ideas and exchanging experiences [21].
Educators believe that verbal interactions can be measured, recorded, and controlled. Measuring verbal interactions can help teachers better understand their classroom activities, help them obtain detailed visual representations of classroom activities, and make teachers aware of the characteristics of their classroom teaching practice. Understanding the characteristics of teachers’ classroom teaching practice can train them to objectively understand their performance and develop conscious plans to help students adapt to the concept that students should be active practitioners in the teaching process and the fact that modern teachers are indirect teachers [22]. Verbal interactions in the classroom are highly valued by educators. Classroom verbal interactions are an important part of the educational learning process, which can strengthen the social relationship between teachers and students, while it can also promote the exchange of thoughts and emotions between teachers and students, as well as among students, and can help teachers achieve the ideal educational goals [10].
According to Wragg, the main advantage of FIAS is that it is a simple system, which has been widely used in its original version as well as modification forms for multiple purposes [23]. FIAS is universal rather than topic-specific, and more importantly, it focuses more on the behaviors of teachers than those of students. It serves two purposes: as an instrument for research and as a tool for teachers training, which is used to modify classroom interactions by observation, recording, and analysis. Although FIAS has been widely applied to the existing studies and obtained different research results in respective fields, there are still some deficiencies in the deep-seated data mining of these studies. There are few comprehensive investigations on the data generated by FIAS matrix tables, especially lacking a more scientific evaluation level for the classroom.
Projection pursuit is an exploratory data-analytic method in multivariate (MV) analysis [24]. The PPE (projection pursuit of entropy) model is a technique for projecting high-dimensional space to low-dimensional space. The projection index function is used to describe the possibility of exposing a certain structure of the original system by projection, so as to find the optimal projection value of the projection index function, and then according to the scatter plot between the projection value and the actual output value of the research system, an appropriate mathematical model is constructed to simulate the system output. Generally speaking, it can synthesize changes in many aspects into a summary conclusion through the model, which is often made in the form of grade evaluation [25,26]. Zhang, X. Q. et al. applied the PPE model to project decision, turned multi-dimension data into low dimension space, so the value of projection function can be calculated by way of seeking the optimal projection direction, thereby, according to the value, project decision can be processed. The outcome from concrete application indicates that it is very reasonable [27].
Starting from the comprehensive analysis and the in-depth data mining, this study constructs a comprehensive quantitative analysis framework of classroom teaching language, analyzes the language characteristics and differences of novice teachers and expert teachers’ cases in detail, and tries to identify the general rules of the development of teaching verbal language in the process of the development from novice to expert teachers. The study uses the PPE model to make a grade evaluation of the classroom.

2. Materials and Methods

2.1. Setting and Participants

Ten lessons from 10 teachers (5 expert teachers and 5 novice teachers) in Gansu Province of China served as the participants in this study. In order to eliminate the interference caused by the course content, 10 teachers were divided into 5 groups. In each group, each expert teacher corresponds to a novice teacher and attends the same course. The expert teachers (ETs) were selected from the Longyuan Famous Teachers of Gansu Province in China, who were voted by Gansu province as scholar and expert teachers from primary and secondary school in Gansu with noble morality, excellent quality, and outstanding teaching ability as well as educational research ability. The novice teachers (NTs) were selected from postgraduate students who have worked for 3 years as newcomers to the school. Among the five groups of teachers, 3 groups took “the concept of function” as the topic, 1 group took “the solution of one variable quadratic” as the topic, and 1 group took “definition of derivative” as the topic. Each topic took one lesson and each lesson lasted 40 min. Students were all from ordinary high school (grade 1 when we collected the data) in Gansu Province, and each class had the same or similar mathematics academic achievement and performance. Moreover, each class was almost similar in size: around 40 students. In order to obtain a more general rule, the coding results of the five groups of teachers were averaged and analyzed.

2.2. Data Collection and Analysis

The discourse of teachers and students in classroom teaching was analyzed quantitatively. As a mature instrument for the analysis of classroom verbal interactions behaviors, FIAS has become the main tool for data collection and analysis. It divides classroom verbal interactions into three categories: teacher talk, student talk, and silence or confusion. There are 10 coding items, which are represented by codes 1–10, respectively [7,28] (See Table 1 for details).
In the classroom coding, FIAS takes samples every 3 s and makes a selection of classroom teaching behaviors every 3 s according to Table 1 as an observation record. These codes constitute small segments of the classroom in chronological order, which is equivalent to a “slicing” operation for the classroom. These small segments represent a series of behavioral events of the teacher and students. Each event is connected into a time sequence according to their sequence. Through the analysis of the data, the rules of classroom teaching structure, classroom atmosphere, teaching style, etc. could be obtained. FIAS is used to assist coding software in this paper.
A 10 × 10 matrix (a table of 10 rows and 10 columns) was used to draw the FIAS matrix so as to record the sequence of observations. After coding, 10 was added at the beginning and the end of the coding sequence, and then the first sequence and the last sequence were paired in turn. Each sequence was used twice. For example, sequence pairs could be generated as follows: 10, 6, 10, 5, 5, 5, 7, 5, 5, 10, which could be encoded for the sequence of (1, 6) (6, 10) (10, 5) (5, 5) (5, 5) (5, 7) (5, 5) (5, 10). The occurrence of sequence pairs (m, n) represented that the frequency of m rows and n columns in the matrix increased by 1. After the complete sequence pairs were counted and filled in the table, the FIAS matrix of one class was generated [8,17,25,29].
In Table 2, Areas A, B, C, and D could be used to identify the percentage of time that teachers and students spent on talking, as well as the percentage of time spent on pausing, silence, and confusion. The comparation between Area A and B showed the percentage of indirect and direct teacher statements. Indirect influence tended to expand students’ freedom of participation, while direct influence tended to restrict this freedom. Area E, which was called as positive integration block, was a nine-cell block that indicated the continuous use of acceptance and praise as well as the conversion between these categories during the teacher’s lecture. The 3-3 cells in this block indicated that the teacher could accept and clarify students’ ideas. Area F was called defect block. The larger the number in this area was, the more estranged the emotional communication between teachers and students [25,29,30].

2.3. Matrix Analysis Framework

In order to further explore the hidden factors behind the classroom teaching language, this paper uses Flanders interactive analysis system (FIAS) to build a quantitative comprehensive analysis framework, which includes two dimensions: matrix analysis and dynamic curve analysis. The matrix analysis is divided into five sub-dimensions: classroom teaching structure, teaching style, classroom atmosphere, variable analysis, and question innovation degree. The dynamic curve is divided into three sub dimensions: teacher talk, student talk, silence and confusion. The quantitative comprehensive analysis system of classroom teaching language is shown in Table 3 below.
The above quantitative observation data could provide effective and accurate feedback for teachers. The discussion on the use of observation tools indicated the importance of using quantitative achievement data, and these indicators should replace the “intuitive concept of good teaching” [31]. In addition, many studies had discussed the problems of using inadequate or unscientific criteria to discuss teacher effectiveness [32,33,34]. It was also claimed that teaching observation and feedback of teachers should be linked to students’ achievements [35,36]; the so-called value-added model (VAM) [37]. However, it had been proved that student’s achievement was rarely a driving indicator of teacher evaluation [38]. Observation-based teaching evaluation in classroom was regarded as the key to understand the linkage mechanism between the classroom process and the expected improvement of students’ performance, and also as the key to develop classroom feedback to guide teachers in improving teaching [39]. It could be seen that the logic of classroom teaching shifted from focusing on static value-added model to emphasizing the observations of generated classroom practicing.

3. Case statistics and Analysis

3.1. FIAS Matrix Analysis

In order to make the coding more consistent, this study adopted the method of video analysis, and the coding was encoded separately by two well-known FIAS coding systems. The coding consistency rate was 86.7% (consistency rate refers to the coding item divided by the total coding item). The coding had good consistency. By averaging the data in the corresponding matrix tables of the expert and novice teachers, two matrices were obtained, as shown in Table 4 and Table 5 below.

3.1.1. Classroom Teaching Structure

The classroom verbal interaction behaviors were divided into three categories by FIAS: teacher talk, student talk, and silence or confusion. The proportion of these three types of behaviors in the classroom could reflect the structure of the classroom [7,8]. According to Table 4 and Table 5, teacher talk of ET accounted for 59.31% of the classroom verbal language (46.76% of teachers’ direct influence and 12.37% of teachers’ indirect influence). The cumulative time was about 24 min, including teachers’ guidance, teaching, questioning, encouragement, praise, etc., which was the sum of all teachers’ verbal behaviors. The student talk accounted for 17.6% of the whole class, and the accumulated time was 7 min, which mainly included students asking and answering questions, expressing their own opinions, etc. The behaviors of silence and confusion accounted for 23.32% of the whole class, and the cumulative time was about 9 min. During this period, students mainly conducted activities such as practice, discussion, record thinking, exploration, and operation. In the classroom of NTs, the teachers’ verbal behaviors accounted for 63.7% (52.30% of teachers’ direct influence and 11.43% of teachers’ indirect influence), the cumulative duration was about 25 min, and the teacher talk was dominant. The student talk accounted for 13.4%, and the cumulative duration was only about 5 min, including the time when they passively answered questions. Silence and confusion accounted for 22.9% with a cumulative duration of more than 9 min, which was equivalent to the ETs’.
In comparison, the proportion of teacher talk of ETs was less than that of NTs, which indicated that ETs had given more rights of discourse to students. In class, the main right of discourse was dominated by students, and their dominant position in class was highlighted. In terms of student talk, ETs presented more than NTs. It could be clearly seen from the videos that in the NTs’ classes, students had more passive answers to questions, which occupied most of the discourse of students and resulted in fewer opportunities to express themselves actively. However, in the classrooms of the ETs, there were more opportunities for students to actively express their opinions. In addition to the students’ passive response, they could actively dominate the classroom, raise questions, and express their opinions. In the behaviors of silence and confusion, the proportion of the ETs was higher than that of the NTs. ETs gave students enough time to practice, to explore, and to discuss; thus, students had more time and space to acquire knowledge independently, and the dominance of students had also been greatly brought into play. In this respect, ETs were unquestionably better than NTs. In general, in the ETs’ classrooms, the participation time of students was longer than that of students with NTs. Students, as the main body, were in the dominant position in the classroom. Students were given a lot of time to think, to practice, and to express their opinions. This kind of classroom moved toward a democratic and harmonious “dialogue-centered” classroom. However, in the NTs’ classrooms, there was too much teacher talk, and essentially monotonous teaching. Teachers had an obvious tendency of discourse hegemony and the characteristics of classroom indoctrination were evident. NTs generally had a high proportion of discourse, which was also confirmed by Al-Farra’s research [22]. He conducted a study that examined the levels of classroom verbal interactions between teachers and students in Palestinian schools, and it was found out that the proportion of teacher talk in the classroom was high, reflected in “giving directions” and “criticism of students’ behaviors”.

3.1.2. Teaching Style

FIAS divides teacher talk into direct influence and indirect influence according to teachers’ control of teaching. The verbal language behaviors of teachers represented by codes 1–4 are indirect ones, mainly including the influence on students’ attitudes and emotions, through encouraging praise, emotional expression, communication, affirming students and asking questions, etc. Codes 5–7 mainly refer to teachers’ lecture, instruction, authority maintenance, and criticism, which belong to direct discourse [28]. According to Table 4 and Table 5, the direct discourse of the ETs accounted for 23.9%, and the indirect discourse of the ETs accounted for 35.2%. The indirect discourse of the teachers accounted for 59.6%. The direct discourse of the NTs accounted for 29.9%, and the indirect discourse of the NTs accounted for 33.8%. The teachers’ indirect discourse accounted for 52.1%. Comparatively speaking, in terms of teacher talk, more indirect discourse was used by ETs to affect students in an indirect way, while NTs tended to use more direct discourse relatively through direct instruction and control. Based on the research of Flanders, Nate Gage drew the conclusion that “indirect teaching can promote the development of students’ ability more than direct teaching. Indirect teaching has obvious effects on stimulating students’ motivation, encouraging their participation, reducing anxiety, improving performance and promoting active innovation [40,41]”. It could be seen that evident differences existed in teaching tendencies between the two teachers. ETs exhibited a higher quality, wisdom, and level of teaching, whose indirect influence rate was also higher than that of NTs. However, in general classroom teaching, it was a common problem that teacher’s direct discourse was on the high side, which was also confirmed by the study of Al-Amiri [42]. He analyzed classroom verbal interactions, in which the research sample was teachers from the department of social services in Hadlemat City, the Republic of Yemen, and the teacher groups from training institutions. The results indicated that the proportion of the direct influence component of teacher talk was high.

3.1.3. Classroom Emotional Atmosphere

In the FIAS matrix, the area where 1st–3rd rows intersect with the 1st–3rd columns was the positive integration block (Area E). The larger the data located in this area, the more harmonious the emotion between teachers and students. The area where 8th–9th rows intersected with the 7th–8th columns was called the defect block (Area F), and the larger the data located in the area were, the more estranged the emotional communication between teachers and the students. Therefore, the analysis of the data intensity degree of positive conformity and defect block could reflect the emotional atmosphere in the classroom [25,29]. It could be seen from Table 2 and Table 3 that the data intensity degree of ETs in the positive integration block was 24, accounting for 2.83% of the total number of times, and the data intensity degree of NTs located in the positive integration block was 22, accounting for 2.59% of the total number. In terms of positive integration, the two teachers performed rather well, both of them paid more attention to the emotional harmony with the students and showed positive integration. The data intensity degree of ETs in the defect block was 47, accounting for 5.41% of the total number of times, and that of NTs in the defect block was 30, accounting for 3.53% of the total number of times. The data intensity degree of ETs was larger than that of NTs, which indicated that in the whole process of classroom teaching, the emotional communication gap between ETs and students was relatively larger than that between NTs and students.
Overall, in terms of the emotional atmosphere of the classroom, ETs and NTs performed basically the same, both of them focused on the emotional experience of students in the classroom, and much emphasis was placed on achieving the teaching goals about emotions, attitudes, and values. It was claimed by research that the emotional relationship between teachers and students had an even greater influence on students’ academic achievement than cognitive methods. According to this conclusion, it was an essential quality for teachers to pay full attention to students’ emotion [43,44].

3.1.4. Variable Analysis

In the theory of FIAS, in order to further explore the statistical data, 12 indicators were proposed to explain the deep meaning behind the teaching behaviors. Flanders referred to these indicators as variables in classroom teaching. The computational formulas, data, and norm statistics of each variable are shown in Table 6 [7]. For the convenience of presentation, the data of the row-i and the column-j in the matrix table were recorded as cell (i, j); therefore, the sum of row-i was:
R o w i = j = 1 10 c e l l i , j , t h e   s u m   o f   t h e   c o l u m n j   c o u l d   b e   r e c o r d e d   a s   C o l j = i = 1 10 c e l l i , j a n d   t h e   s u m   o f   a l l   t h e   t a l l i e s   c a n   b e   r e c o r d e d   a s   T o t a l = i = 1 10 j = 1 10 c e l l i , j .
Table 6 shows the statistical results of each variable. TRR indicates the ratio of teacher’s discourse time in response to students’ opinions and emotions to the discourse time which is not directly related to teaching (that is, the teacher’s discourse time minus the time of questioning and teaching). The higher the ratio is, the more the teacher responds to students’ perceptions and emotions [7]. The statistics results of TPP illustrate that ETs can respond to students’ opinions and emotions actively and rapidly, while NTs are relatively slow in responding to students’ emotions and opinions. TQR indicates the ratio of teacher’s questioning time to the time directly related to teacher’s teaching. The higher the ratio is, the more often the teacher uses questioning to teach during class [29]. It shows that in terms of teacher’s active questioning, ETs are more accustomed to using questions to guide students to think. Relatively speaking, NTs use questions less than ETs. PIR indicates the ratio of students’ active discourse time to their whole discourse time. The higher the ratio is, the more actively students express their opinions [7]. It shows that the proportion of students who are active in speaking in an ET’s class is higher than for those in an NT’s class. In terms of answering questions actively, students in an ET’s class exhibit more motivation than students in an NT’s class, which means their interest in answering questions has been effectively stimulated, while in an NT’s class the students are relatively deficient in this aspect. TRR89 indicates that when students stop talking, the ratio of teacher’s discourse time of immediately praising or adopting students’ ideas and accepting students’ emotions to the discourse time that the teacher does not respond to this situation immediately. The higher the ratio is, the better the teacher can immediately respond to the student’s words [7]. The data of TRR89 show that when students stop talking, an ET is more inclined to immediately praise or adopt the concept of students, and provide timely feedback; however, an NT will give students more time to think, experience, and feel, and then respond to the students’ acceptance. It can be concluded that an ET is more proactive than an NT in questioning. CCR indicates the ratio of time that teachers use words directly related to teaching to repeat the previous discourse or to connect the later discourse to the total teaching time. The higher the ratio is, the more teacher–student interactions can focus on the content of the textbook [7]. This group of data reflects that in terms of focusing on the content of the text, ETs and NTs have similar performances in terms of the verbal interactions. They are basically the same in spreading, broadening, and extending the class. The SSR indicates the ratio of the time when teachers and students stay in the same discourse category for more than 3 s to the total teaching time [29]. The higher the ratio is, the more stable the interaction conversations between teachers and students. The level of data represents the degree of stability of student conversations, which reflects that NTs and ETs are consistent in the stability of the classroom. PSSR indicates the ratio of students’ speaking time lasting for more than 3 s to the total time of students’ speaking [7]. The higher the ratio is, the more stable the student’s speaking style is. According to Table 6, students in an NT’s class are relatively stable in verbal style, while students in an ET’s class have diverse discourses.

3.1.5. Innovation Degree of Questioning

According to FIAS, some special-order pairs can represent the ask-and-answer mode of teachers and students and the degree of innovation of teachers’ questions. These sequence pairs are listed in Table 7 below.
According to the statistics in Table 7, on the whole, the frequency of each ET sequence pair is higher than that of each NT, which is related to the fact that more problem-driven approaches are used by ETs. From the comparison of sequence pair structure, the frequency distribution of the ET pairs is relatively uniform, as different question and answer modes are used alternately in the classroom. Through the transformation of questions and answers, it can better attract the attention of students, stimulate students’ interest in answering questions, and further increase the appeal of the classroom. The question-and-answer mode of ETs is diversified. In the question-and-answer mode of NTs, the frequency of sequence pair (8, 4) is relatively lesser. In FIAS, the sequence pair (8, 4) means that “teachers ask questions immediately after the students have answered the questions, and the teacher may ask new questions or questions about students’ previous topics [19]”. It can be seen that ETs do not perform well in asking students in time. In comparison, the question-and-answer mode of ETs is more abundant, while that of NTs is more singular or has a more evident trend, which cannot be effectively changed.
In the creative inquiry mode, the frequency of ET sequence pairs occurring is higher than that of NT. Except for sequence pair (3, 9), whose frequency is 0, other sequence pairs appear with their frequency increasing. The creative inquiry mode is based on the degree of innovation in questioning, and its sequence pairs show different meanings. On the whole, the higher the frequency of sequence pairs is, the more creative questioning mode is used, to a certain extent, which shows that ETs have solid language skills and rich teaching wisdom.
Sequence pair (3, 9) indicates that “after the teacher accepts or deepens students’ view, the students actively continue to speak [14]”. The frequency of sequence pair (3, 9) occurring for ETs and NTs is 0, indicating that both two teachers actively guide students to express themselves, but they relatively lack positive encouragement after the students’ expressions.

3.2. Comparative Analysis of Dynamic Curves

In FIAS’ dynamic curves, the abscissa represents the time and the ordinate represents the percentage of a certain discourse. The dynamic curve is drawn by connecting each coordinate point (representing the percentage of a certain discourse per minute) [25].

3.2.1. Teacher Talk Analysis

Figure 1 shows the discourse distribution characteristics of the two types of teachers. In general, it can be seen clearly that the figure of NT is above that of ET, and the statistical value of NT is higher than 50% 32 times, while that of ET is only 25 times up to more than 50%. In terms of the fluctuating trend of the curve, the discourse of the whole class of ET fluctuates greatly, and almost every time it fluctuates across the 50% line, which indicates that the time for teachers to leave blanks in class is relatively uniform, and a certain time will be left for students to discuss or independently think after a teacher’s discourse. The language of NTs is essentially above 50% in the first 20 min, and although it shows small fluctuations, the range is not large. It shows that it is mainly dominated by the discourse of teachers, and students have less time to think and discuss. Furthermore, big fluctuations can be seen in the last 20 min with three consecutive troughs. However, combining with the video, it is known that students are practicing under the guidance of teachers at that time, from which it can be inferred that NTs tend to have discourse hegemony.
In comparison, an ET is more scientific and reasonable in the language organization. Without large-scale, long-term monotonous teaching and continuous practice for students, the whole class is more fluent and active. However, the arrangement of lectures first and exercises later in the NT’s class is relatively inflexible, which may make students be tired of having class.

3.2.2. Student Talk Analysis

Figure 2 shows that the student talk in both classes experienced multiple fluctuations, but the amplitude of ETs is more evident, which is greater than that of NTs. The large fluctuation indicates that the student talk is rich and has a long duration, while when the fluctuation is small, especially at a low level, this indicates that the students have a single discourse and a short duration. To a large extent, students passively respond to the closed questions raised by the teacher. The NT curve has 10 statistical ratios as low as 0, and there are six consecutive occurrences, indicating that students have no discourse behaviors for a long time. Combined with the video, students were practicing independently during this period. However, although ET reached 0% only five times, almost all of them appeared at intervals. Additionally, there are two big peaks, indicating that students had the opportunity to express themselves freely.
In comparison, students in the class of the ETs exhibited more positive linguistic features which were evenly distributed throughout the class, and students were proactive. Students in the class of the NTs had relatively fewer discourses, and there was no student speaking for a long time. There is the possibility of organizational fault, and most of the student discourses are passive responses.

3.2.3. Silence or Confusion Analysis

Silence and confusion are an organic part of the classroom. Due to the complexity of the classroom, it is impossible for any phenomena to be analyzed by discourse. Therefore, the analysis of silence and confusion can make up for the lack of discourse analysis to a certain extent. Figure 3 reflects that in the aspect of silence and confusion, the ET curve fluctuates five times in succession, which shows that students have relatively enough time to think and to explore. However, the NT curve exhibits a small fluctuation in the first 27 min, almost all of which are close to 0, indicating that during this period of time, students have little time to think independently but were exposed to the teaching and expressions of the teacher. In the last 10 min, silence and confusion reach a high proportion, reflecting that in these times, neither teacher’s guiding behaviors nor students’ communication and expression behaviors occurred, and the classroom atmosphere was relatively dull.
In comparison, the teaching arrangement of ETs is more reasonable in terms of the blank space in the classroom, as students can think and explore independently after expressing and listening, and they can analyze and discuss problems more deeply. Nevertheless, students in the class of NTs have no time to think and discuss, which may lead to students’ lack of understanding of the problem, or teachers’ indoctrination of knowledge.

4. PPE Classroom Language Rating

Classroom teaching is a complex system. FIAS makes a comprehensive analysis of classroom teaching from the perspective of verbal interactions in class. However, sometimes it is necessary to give a summative assessment to teaching. For example, in many kinds of teaching competitions in China, a certain score shall be provided. At present, FIAS does not have this function. As far as the current Chinese classroom teaching evaluation is concerned, it is essentially based on the evaluation given by experience. Such evaluation usually has personal will and it is difficult to obtain a systematic, objective, and scientific evaluation, in which stability and consistency are lower [38,45]. On the basis of integrating a number of classroom teaching verbal language factors, the PPE model makes a comprehensive evaluation of the classroom, which is more operational and feasible. Therefore, based on the FIAS data, this study constructs a summative evaluation model and seeks the solution of it.

4.1. PPE Classroom Language Evaluation Model

4.1.1. The Construction of Index System

In this study, classroom teaching verbal language is expressed by the subordinate degree y of evaluation grade, and the value y is divided into five grades, that is, according to (0, 0.55], (0.55, 0.65), (0.65, 0.75], (0.75, 0.85], and (0.85, 1], they are judged as bad, average, medium, good, and excellent, respectively. The 10 indicators in FIAS are used as the indicators for constructing classroom teaching grade evaluation, and the subordinate degree y ( i ) of teaching language in the class of each indicator is shown in Table 8. The values 1.0, 0.9, 0.8, 0.7, 0.6, 0.5, 0.4, 0.3, 0.2, and 0.1 are taken for the equidistant sites on the interval [0, 1], and the corresponding evaluation index value is defined as x * ( i , j ) , where i = 1 ~ m ( m is the number of standard division points of the “classroom teaching language” subordinate degree, m = 10 ) and j = 1 ~ n ( n is the number of evaluation indicators, n = 10 ).

4.1.2. PPE Evaluation Model Establishment

In order to balance the differences caused by different units of each evaluation index in the statistical data, to unify the variation range of each index so as to make the model more universal, dimensionless processing was carried out on the evaluation index x * ( i , j ) to obtain the standard value x ( i , j ) [46].
x ( i , j ) = 1 x * ( i , j ) x * ( 1 , j ) x * ( i , j ) x * ( m , j ) x * ( 1 , j ) x * ( m , j ) x * ( m , j ) < x * ( i , j ) < x * ( 1 , j ) 0.1 x * ( i , j ) x * ( m , j )
The PPE model was established according to the standard value, and n -dimensional data { x ( i , j ) j = 1 , 2 , , n } were integrated into the one-dimensional projected value a = { a ( 1 ) , a ( 2 ) , a ( n ) } with z ( i ) as the projection direction:
z ( i ) = j = 1 m a j x ( i , j ) ( i = 1 , 2 , n )
where a in (2) is the projection vector of unit length a ( j ) > 0 , j = 1 n a 2 ( j ) = 1 .
Q ( a ) = S Z D Z
where S Z is the standard deviation of projected value z ( i ) and D Z is the local density of projected value z ( i ) [47], namely:
S z = i = 1 n z ( i ) E ( z ) 2 n 1
D z = i = 1 n j = 1 m R r ( i , j ) × u R r ( i , j )

4.1.3. Optimize Projection Index Function

Considering that the optimal projection direction can better reflect the structural characteristics of the original data, the optimal projection direction can be estimated according to the maximization of the function [48].
max Q ( a ) = S Z D Z
s . t . a ( j ) > 0 j = 1 n a 2 ( j ) = 1

4.1.4. Rating Model of Classroom Teaching Language

The projection value z * ( i ) of the first standard segmentation point can be obtained by substituting the optimal projection direction a * of the optimization index function into Equation (2). According to the scatter diagram of z * ( i ) ~ y ( i ) , the corresponding mathematical model of the grade evaluation of classroom teaching language can be established. The regression equation can be obtained by polynomial fitting, which is the comprehensive evaluation model.
y * ( i ) = f ( z * ( i ) )
According to the specific situation wherein y * ( i ) falls in the five sub-intervals, the quality level of the teacher’s classroom teaching language in the whole class can be judged.

4.2. Model Solving

According to the statistical results in Table 4 and Table 5, the original data x * ( i , j ) of the two types of teachers are shown in Table 9.
According to the coding value x * ( i , j ) ( i = 1 , 2 , , m = 10 ; j = 1 , 2 , n = 10 ) in Table 9, the standard value x ( i , j ) is obtained by dimensionless processing according to formula (1). Then, the projection index value { z ( i ) } can be obtained from x ( i , j ) , combining { a ( j ) } with the projection index function Q ( a ) and max Q ( a ) = 3.12 can be calculated; then, the best projection direction can be calculated as { a ( j ) } = {0.351214, 0.356412, 0.353214, 0.349126, 0.361214, 0.342143, 0.351965, 0.339647, 0.342571, 0.356421}. By substituting the obtained { a ( j ) } in the formula (2) a projection of 10 standard dividing points is obtained as follows: { z ( i ) } = {3.1245212, 3.741237, 2.961741, 4.152461, 3.961413, 4.123478, 5.012451, 3.124192, 4.814236, 3.963748}. The current value of the evaluation indicators of the teacher’s classroom teaching language x * ( j ) is dimensionless according to formula (1), and the standardized value is { x j } = {0.924824, 1.124352, 0.876543, 0.914761, 1.021753, 0.854127, 1.231491, 0.791453, 1.143174, 0.742159}. Then, the ET’s subordinate degree of classroom teaching language evaluation level is obtained as y = 0.852143 . According to the classification of classroom teaching language evaluation grades, the classroom teaching language level of the ET is excellent. By using the same method, according to the NT’s subordinate degree of classroom teaching language evaluation level y = 0.749417 , the classroom teaching language level of the NT is medium, which still needs to be improved [25].

5. Conclusions and Discussion

The research above comprehensively analyzes the differences between ETs and NTs in classroom teaching, and the different teaching effects caused by these differences are explained. In the ET’s classrooms, there were more opportunities for students to actively express their opinions. The teachers had more indirect influence on students, paid more attention to classroom blank space, and asked more innovative questions. ETs and NTs both focused on the emotional experience of students in the classroom, and had a harmonious classroom atmosphere. According to the PPE model analysis, the ET’s classroom teaching language level is excellent while the NT’s is medium. ETs have better scores than NTs. In conclusion, in the process of growing from NT to ET, the teachers’ classroom teaching verbal language presents the following trends [25]:
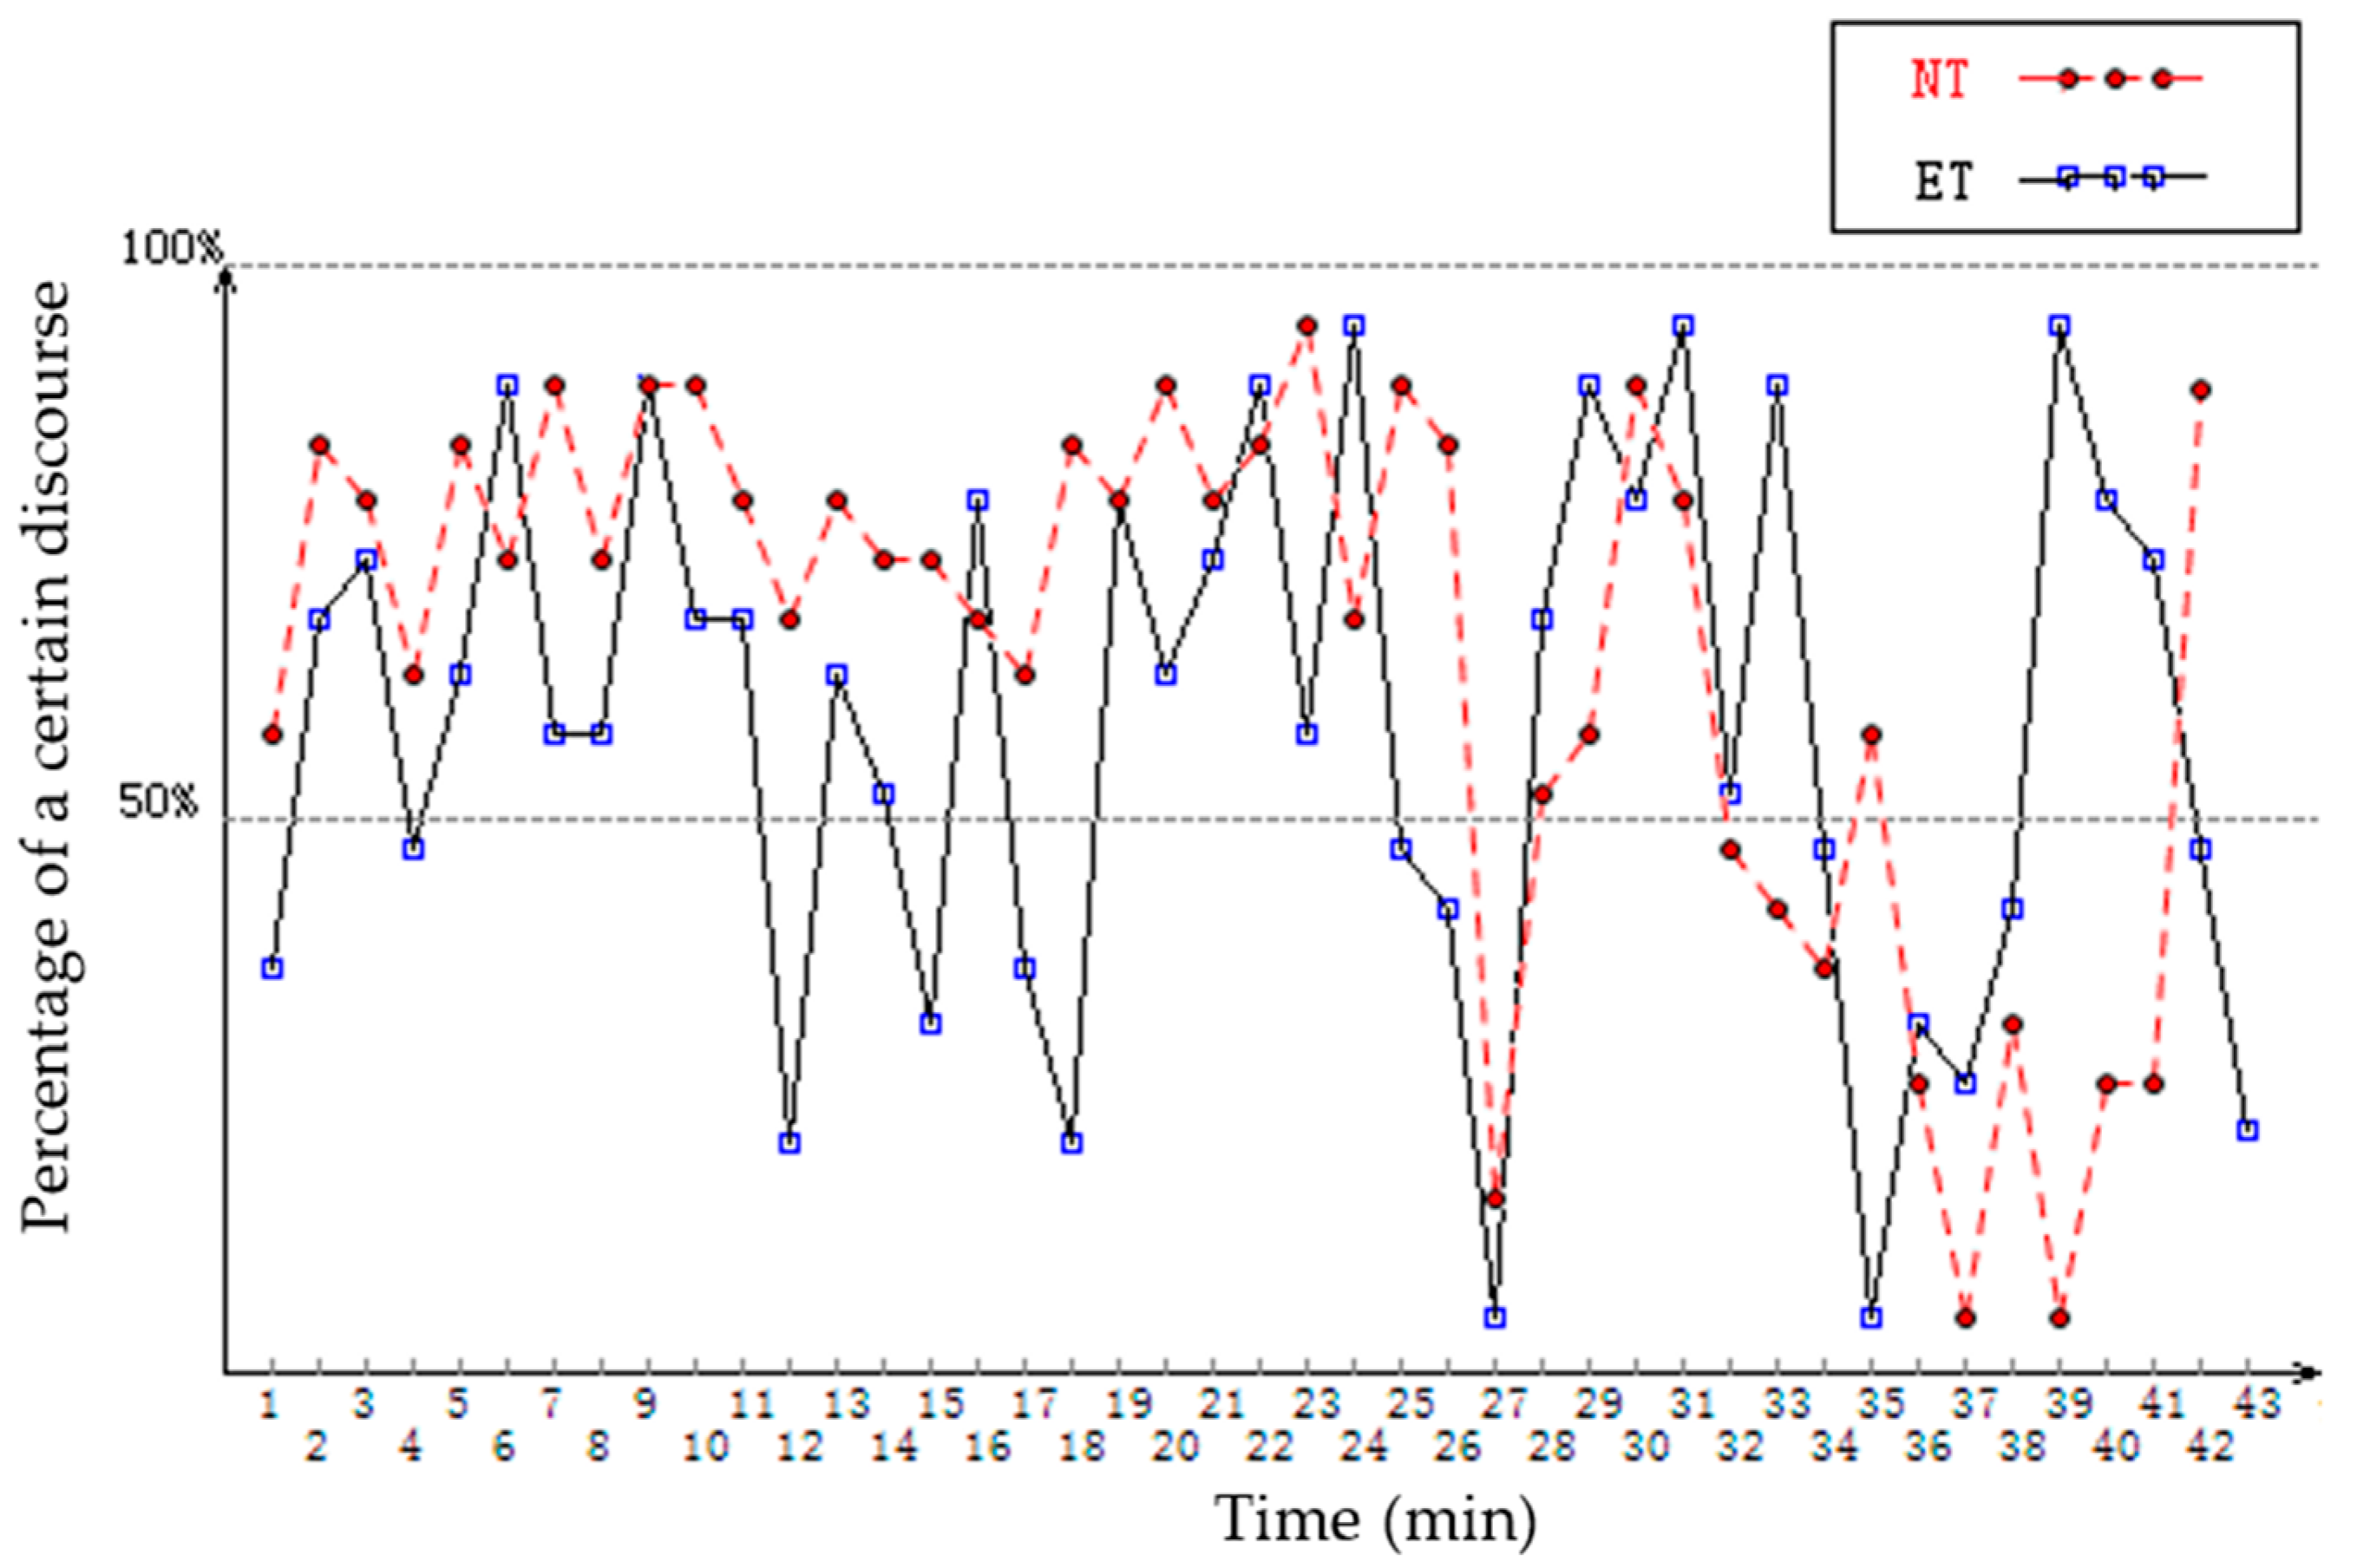
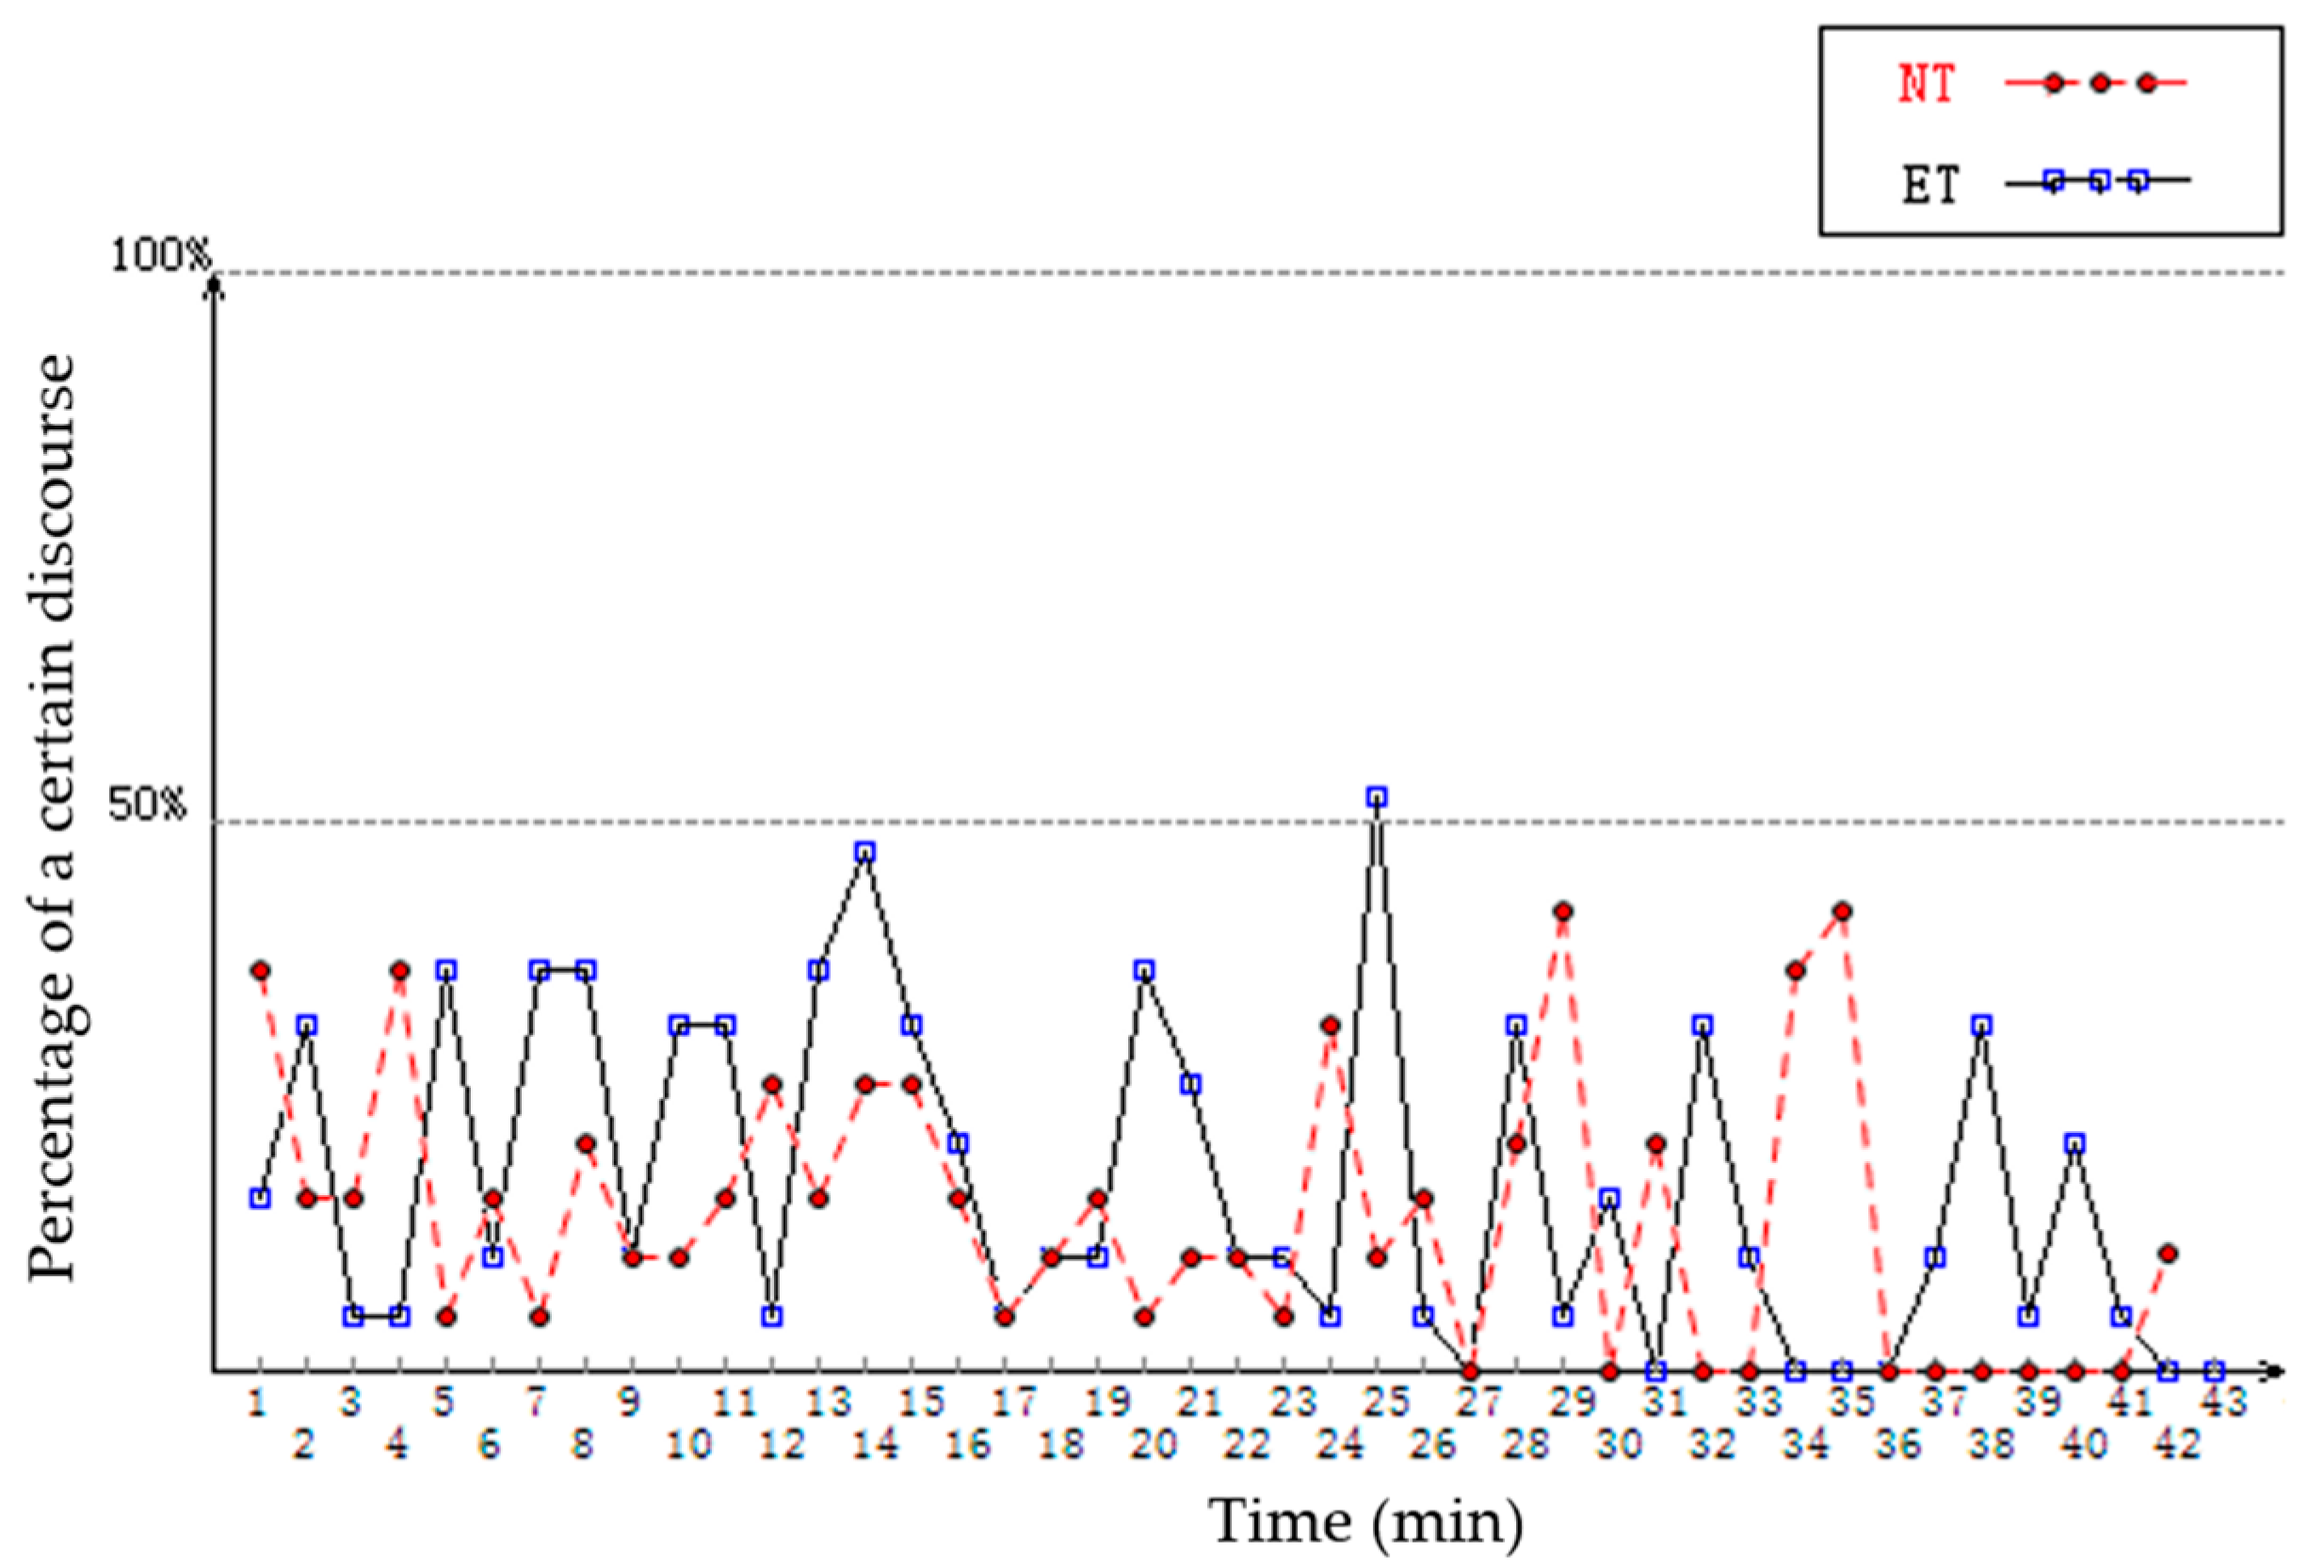
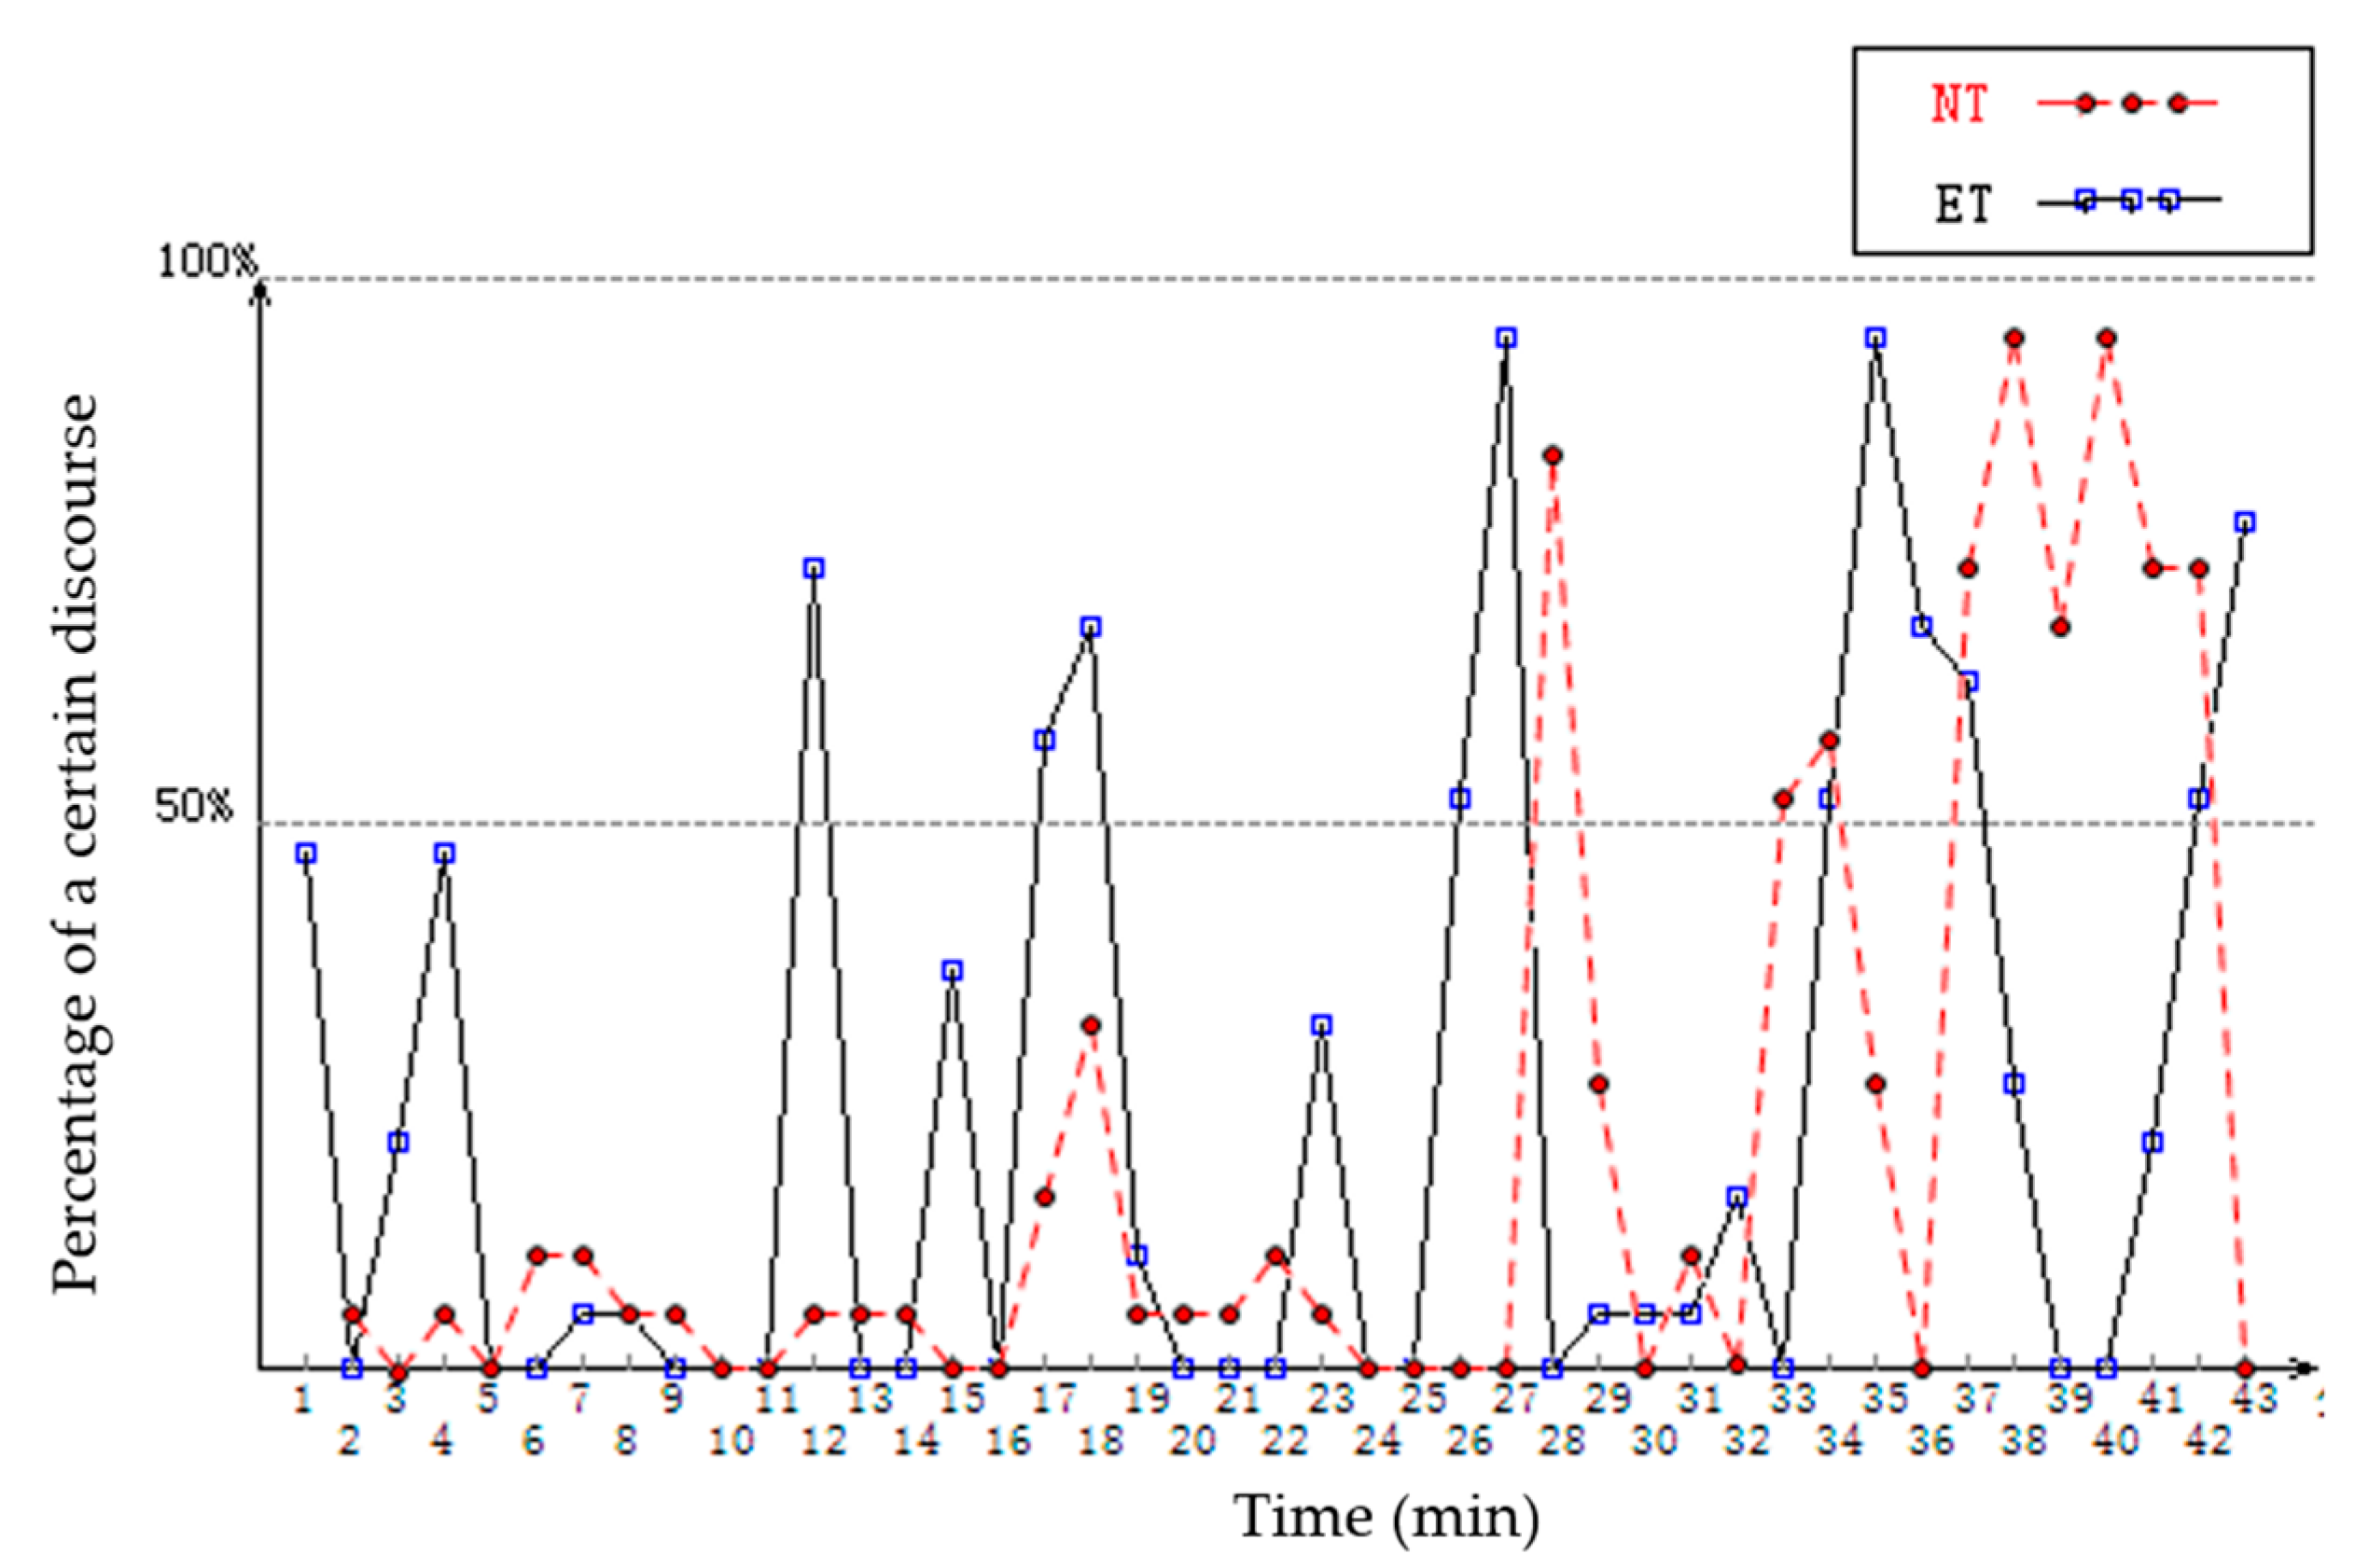
Based on the statistics, it is found that in the general teaching process of NTs, the verbal language of teachers and students is essentially distributed in a form of “T (teacher)-P (student)-T-P-T-P”, which belongs to “inculcation-centered teaching”, characterized by the one-way transfer of knowledge from teachers to students and the passive acceptance of knowledge by students [49]. The disadvantages of it lie in that “first of all, teachers regard students as the objective existence of passive acceptance of knowledge, as a kind of container or a piece of pure paper. The result of one-sided pursuit of inculcation of knowledge makes the subjective initiative of students be exhausted. Secondly, teachers make students lose the original purpose of learning. The learning process is just memorizing the ready-made knowledge, and students’ thoughts has not been developed, their emotions, attitudes and values have not been properly reflected”, while the teaching process of ETs is mostly represented by the “T-P-P-P-P-T-P-P-T-P-P-P-T” mode, which belongs to “dialogue-centered teaching”. The characteristic of it is that “the process of learning is embodied in the repeated dialogues between teachers and students, as well as in the process of exploring and discovering truth [50]”. In this teaching process, direct-experience learning has been highly valued.
The role of teachers’ verbal language is to guide and help students to acquire knowledge. The verbal language of teachers should be a dynamic generation process, rather than a prescribed template. Through practical teaching, teachers should adjust their language expression flexibly according to students’ emotions, reactions, and problems encountered in teaching. When teachers face students’ various verbal language information and flexible ways of thinking, they should pay attention to students’ response and respond to students in a timely manner and accurately. Meanwhile, teaching verbal language should be expanded and supplemented according to the cognitive differences of students, and the students should be taken care of as much as possible, instead of hurting students or setting off their negative emotions. The cognitive level of the students is in its critical development period. Therefore, teachers must learn to treat students as knowledge seekers, attach great importance to their thinking and ideas, encourage students to explore independently as much as possible, protect their courage to explore, and motivate students to find enthusiasm.
NTs tend to pay more attention to the control of the classroom without letting students discuss freely, and they have less confidence in the generation process of the classroom. In the classroom, teachers play an absolute leading role, and students are not allowed to have inappropriate behaviors and incomplete views, which is mainly manifested in the aspects that the teachers give lectures and the students listen quietly; the teachers write something down on the blackboard and the students take notes; the teachers make a decision and the students obey it.
NTs require students to follow their own pre-designed mode. Although sometimes they will spend some time on discussion, they are often formalistic. The discussion process does not solve practical problems, nor provide students with substantive thinking space. In this state of teaching, teachers are too nervous to provide students with a comfortable learning environment. The learning process is a process of teaching which can benefit teachers and students, and they need to build a learning community. The teachers’ talking behavior should be an equal dialogue, instead of the teacher being regarded as the authority of knowledge. A democratic and peaceful mentality is supposed to come first. Democracy can make students share their own ideas freely, and students will not be afraid of saying wrong things by keeping silence; democracy can make students show their true ideas freely, so as to expose their biases in understanding and shortcomings in the process of thinking; democracy can arouse students’ creative enthusiasm, and make them feel relaxed and happy in the process of learning. Promoting positive teacher–student interactions will ensure that students and teachers are always active practitioners in the process of education. It is necessary to establish a healthy social relationship between teachers and students. Teachers should be organizers of teaching activities and guides to help students make decisions, not controllers of the educational process [51].
Teaching verbal language should not only be limited to the simple inculcation of knowledge, but also guide students to construct the meaning of knowledge through discussion, thinking, and dialogues. The interaction of classroom verbal language should be a process of constructing knowledge and ability. Some studies believe that “dialogic communication transcends the simple meaning of transmitting information, which has the function of reconstructing and generating meaning. In the dialogue with others, it is precisely due to the emergence of completely different views of others that new meanings can be created [52,53]”. Only when the new knowledge and the existing knowledge are connected and understood in the framework can the students understand deeply and thoroughly. It is shown that high-level teachers focus on stimulating students’ learning potential, often use highly praised and positively enhanced models, and emphasize the construction of meaning in the learning process [26,54].
From the comparison of the two types of teachers, NTs’ classrooms are mostly knowledge-based and belong to the “knowledge-oriented” classroom. The core of teaching is to transfer knowledge to students. The whole class is organized around the content of the textbook, and it is complete and cautious [55,56]. However, there is a lack when it comes to developing the thinking of students and there is not enough time for students to think. The phenomenon of students passively accepting knowledge is more evident, and the expression of teachers’ emotions is rare. The teaching goal of students’ emotions, attitudes, and values being achieved is not satisfactory, while the overall feeling of an ET’s class is ups and downs, which is different from the stable and orderly class of an NT. However, it can be found from the analysis that the class of the ET is constructed by the cooperation of teachers and students, in which students have a relatively free voice in the classroom, and teachers lay emphasis on guiding students to think and cultivating their mathematical thinking. Teachers take the students’ thinking as the main line, find the growth point of knowledge, and work through their doubts [57,58]. At the same time, the classroom is relaxed, teachers integrate their own emotions and inspire students’ interest in learning. In conclusion, NTs taught the students the knowledge of the lesson, which is complete and comprehensive; ETs triggered thinking about knowledge, which is deep and inspired. As it is suggested, it is necessary to improve classroom language interaction by encouraging teachers to engage in dialogues with students, by encouraging students to participate in classroom activities and discussion, and by encouraging students to express and share ideas and opinions in the classroom [20].
There are some limitations to this study. First of all, the conclusions may not be applicable to any classroom, because the context and culture of the countries and how the teachers are trained and prepared to teach are different. Furthermore, there are also many non-verbal interactions in the classroom, such as the posture of the teacher and students, which is yet another kind of language. However, this kind of language was not analyzed in this study, and further study is needed.

Author Contributions

Y.Z. constructed the model and completed the manuscript writing; X.W. collected and analyzed the data and corrected the language of the article; C.Z. conducted the classroom coding, corrected, and analyzed the corresponding data; J.Z. put forward valuable opinions and provided financial support for the article. All authors have read and agreed to the published version of the manuscript.

Funding

This work was support by 2021 Humanities and Social Science Research project of Ministry of Education of China under Grant No. (21YJC880102); the National Natural Science Foundation of China (No. 61862051); the Top-Notch Talent Program of Guizhou province (No. KY[2018]080); the Guizhou Educational Science Planning Project under Grant Nos. (2021B201, 2021C046); the Educational Department of Guizhou under Grant (KY[2019]067); the Qianan Educational Science Planning Project under Grant (No. 2021B001); the Program of Qiannan Normal University for Nationalities under Grant Nos. (qnsy2019005, qnsy2019006, qnsyxk201807, 2021gh19).

Institutional Review Board Statement

This study does not contain identifying information, so it does not require ethical approval. Committee on Human Research Protection of ECNU. http://life.ecnu.edu.cn/_upload/article/files/de/d9/250ac9ff4d2eb27003ff30bb0269/c4ab83b2-ac10-454d-a352-715b70bb92e4.pdf (accessed on 3 April 2022). No animal studies are presented in this manuscript. No potentially identifiable human images or data are presented in this study.

Informed Consent Statement

Informed consent was obtained from all persons involved in this study.

Data Availability Statement

The datasets used and/or analyzed during the current study are available from the corresponding author upon reasonable request.

Conflicts of Interest

The authors declare no conflict of interest.

References

  1. Xu, J. Research on Education for Sustainable Development Permeated in Primary Science Education. Curric. Teach. Mater. Method 2013, 33, 72–76. [Google Scholar] [CrossRef]
  2. United Nations Educational, Scientific and Cultural Organization (UNESCO). UNESCO Roadmap for Implementing the Global Action Programme on Education for Sustainable Development; UNESCO: Paris, France, 2014. [Google Scholar]
  3. Naidu, S. Building resilience in education systems post-COVID-19. Distance Educ. 2021, 42, 1–4. [Google Scholar] [CrossRef]
  4. Flanders, N.A. Analyzing Teacher Behavior; Addison-Wesley Pub. Co.: London, UK, 1970. [Google Scholar]
  5. Picciano, A.G. Beyond student perceptions: Issues of interaction, presence, and performance in an online course. J. Asynchronous Learn. Netw. 2002, 6, 21–40. [Google Scholar] [CrossRef] [Green Version]
  6. Reynolds, C.R.; Livingston, R.B.; Willson, V.L.; Willson, V. Measurement and Assessment in Education; Allyn & Bacon/Pearson Education: Boston, MA, USA, 2006. [Google Scholar]
  7. Silverman, S.; Buschner, C. Validity of Cheffers adaptation of Flanders interaction analysis system. J. Classr. Interact. 1990, 25, 23–28. Available online: https://www.jstor.org/stable/23870577 (accessed on 12 May 2022).
  8. Amatari, V.O. The instructional process: A review of Flanders’ interaction analysis in a classroom setting. Int. J. Second. Educ. 2015, 3, 43–49. [Google Scholar] [CrossRef]
  9. Mardiana, F.; Zainuddin, Z.; Gultom, J.J. Verbal interaction in English classroom using Flanders interaction analysis categories system (FIACS). Genre 2019, 7, 1–9. [Google Scholar] [CrossRef]
  10. Al-Badri, T. Management of Classroom Verbal Interaction “Principles and Procedures”; Dar Al Thaqafa: Amman, Jordan, 2005. [Google Scholar]
  11. Zakaria, Z.M.; Atan, A.; Yusuf, R.; Mei, S.Y. Content Knowledge Competency of Arabic Language Teacher Trainees during Teaching Practice. Int. J. Acad. Res. Bus. Soc. Sci. 2019, 9, 307–319. [Google Scholar] [CrossRef] [PubMed] [Green Version]
  12. Kapoe, S. Analysis of classroom interaction using Flander interaction analysis categories system (FIACS) in English class-unkriswina sumba. J. Engl. Lang. Learn. 2021, 5, 1–7. [Google Scholar] [CrossRef]
  13. Nurmasitah, S. A study of classroom interaction characteristics in a geography class conducted in English: The case at year ten of an immersion class in SMA N 2 Semarang. Doctoral Dissertation, Universitas Diponegoro, Semarang, Indonesia, 2010. [Google Scholar]
  14. Sharma, S. A Study of Classroom Interaction Characteristics Using Flanders’ Classroom Interaction Analysis Ina Math Class of Rural and Urban Schools. Sch. Res. J. Humanit. Sci. Engl. Lang. 2016, 15, 3770–3776. [Google Scholar]
  15. Lyon, H.C., Jr.; Holzer, M.; Reincke, M.; Brendel, T.; Ring, J.; Weindl, A.; Fischer, M.R. Improvements in teaching behavior at two German medical schools resulting from a modified Flanders interaction analysis feedback intervention process. Med. Teach. 2014, 36, 903–911. [Google Scholar] [CrossRef]
  16. Bochner, S. Observing teaching and learning: Principles and practice. J. Intellect. Dev. Disabil. 1999, 24, 356. [Google Scholar]
  17. Tilstone, C. Observing Teaching and Learning: Principles and Practice; Routledge: Oxford, UK, 2013. [Google Scholar]
  18. Gwimbi, E.; Monk, M. A study of the association between classroom practice and philosophy science amongst A-level biology teachers in Harare, Zimbabwe. Afr. J. Res. Math. Sci. Technol. Educ. 2002, 6, 51–67. [Google Scholar] [CrossRef]
  19. Joe-Kinanee, J.N.B. Measurement of The Effectiveness of Flanders Interactive Analysis Categories (FIAC). Int. J. Arts Sci. 2017, 10, 1–16. [Google Scholar]
  20. Al-Hasanat, H.A.; Ma’an, J.; Omar, R.A.A.; Aljazi, S.F. A study of the Extent and Nature of Classroom Verbal Interaction in Tenth-Grade, Arabic Language Class in Jordan Using Flanders Interaction Analysis Category System (FIACS). Int. J. Learn. Dev. 2017, 7, 68–86. [Google Scholar] [CrossRef]
  21. Bernstein, D.A.; Goss-Lucas, S. Teaching Psychology: A Step by Step Guide; Psychology Press: New York, NY, USA, 2004. [Google Scholar]
  22. Bichi, A.A. Evaluation of teacher performance in schools: Implication for sustainable development goals. Northwest J. Educ. Stud. 2017, 2, 103–113. Available online: https://www.researchgate.net/publication/330117286 (accessed on 5 September 2022).
  23. Wragg, T. An Introduction to Classroom Observation (Classic Edition); Routledge: Oxford, UK, 2013. [Google Scholar]
  24. Nason, G.P. Entropy in multivariate analysis: Projection pursuit. Anal. Proc. 1992, 29, 430–435. [Google Scholar]
  25. Wu, X.; Zhang, Y.; Peng, N. Research on Classroom Teaching Evaluation Based on FIAS and PPE Theories. E-Educ. Res. 2016, 37, 93–99. (In Chinese) [Google Scholar] [CrossRef]
  26. Martina, F.; Utari, I.R.; Riza, S. An analysis on Teacher Talk using Flanders Interaction Analysis Categories (FIAC). Int. J. Innov. Educ. Res. 2021, 1, 31–52. [Google Scholar]
  27. Zhang, X.Q.; Feng, W.H.; Li, N.N. A Projection Pursuit Evaluating Model of Project Investment Decision-Making. Appl. Mech. Mater. 2010, 29–32, 2449. [Google Scholar] [CrossRef]
  28. Ning, H.; Wu, J.H. Establishment of Links between Quantitative Structure and Meaning Comprehension. Educ. Res. 2003, 5, 23–27. (In Chinese) [Google Scholar]
  29. Flanders, N.A. Interaction Analysis: A Technique for Quantifying Teacher Influence: Bureau of Educational Research; College of Education, University of Minnesota: Minneapolis, MN, USA, 1961. [Google Scholar]
  30. Septiningtyas, M. A Study of Interaction in Teaching English to Young Learner (TEYL) Classroom Using Flanders’ Interaction Analysis System. Yogyakarta: The Graduate Program in English Language Studies Sanata Dharma University. Skripsi Thesis, Sanata Dharma University, Depok, Indonesia, 2016. Available online: https://repository.usd.ac.id/6553/2/146332016_full.pdf (accessed on 7 July 2022).
  31. Borich, G.; Klinzing, G. Some assumptions in the observation of classroom process with suggestions for improving low inference measurement. J. Classr. Interact. 1984, 20, 36–44. Available online: https://www.jstor.org/stable/43997867 (accessed on 7 July 2022).
  32. Evertson, C.M.; Green, J.L. Observation as Physical Education. In Handboook of Research on Teaching, 3rd ed.; Wittrock, M.C., Ed.; Macmillan: New York, NY, USA, 1986. [Google Scholar]
  33. Gage, N.L.; Needels, M.C. Process-product research on teaching: A review of criticisms. Elem. Sch. J. 1989, 89, 253–300. [Google Scholar] [CrossRef]
  34. Medley, D.M. Teacher Competence and Teacher Effectiveness. Rev. Process-Prod. Res. 1977. Available online: https://files.eric.ed.gov/fulltext/ED143629.pdf (accessed on 9 July 2022).
  35. Cross, K.P.; Steadman, M.H. Classroom Research: Implementing the Scholarship of Teaching; Jossey-Bass: San Francisco, CA, USA, 1996. [Google Scholar]
  36. Snell, L.; Tallett, S.; Haist, S.; Hays, R.; Norcini, J.; Prince, K.; Rowe, R. A review of the evaluation of clinical teaching: New perspectives and challenges. Med. Educ. 2000, 34, 862–870. [Google Scholar] [CrossRef] [PubMed]
  37. Pullin, D. Legal issues in the use of student test scores and ValueAdded Models (VAM) to determine educational quality. Educ. Policy Anal. Arch./Arch. Analíticos Políticas Educ. 2013, 21, 1–24. Available online: http://epaa.asu.edu/ojs/article/view/1160 (accessed on 10 August 2022).
  38. Martinez, F.; Taut, S.; Schaaf, K. Classroom observation for evaluating and improving teaching: An international perspective. Stud. Educ. Eval. 2016, 49, 15–29. [Google Scholar] [CrossRef]
  39. Phelps, R.P. Synergies for better learning: An international perspective on evaluation and assessment. Assess. Educ. Princ. Policy Pract. 2014, 21, 481–493. [Google Scholar] [CrossRef]
  40. Eisner, E. Is ‘the Art of Teaching’ A Metaphor? In Changing Research and Practice; Routledge: Oxford, UK, 2020; pp. 9–19. [Google Scholar]
  41. Aimah, S.; Purwanto, B. Evaluating teachers’ performance: A need for effective teaching. J. Cult. Engl. Lang. Teach. Lit. 2019, 19, 158–170. [Google Scholar] [CrossRef] [Green Version]
  42. Al-Amiri, M. Analysis of Verbal Interaction of Students of The Department of Social Studies in the Institute of Preparation and Training of Teachers During Service in Hadramout in light of Flanders System. Al-Andal. J. Humanit. Soc. Sci. 2016, 13, 99–127. [Google Scholar]
  43. Hannula, M.S. Attitude towards mathematics: Emotions, expectations and values. Educ. Stud. Math. 2002, 49, 25–46. [Google Scholar] [CrossRef]
  44. Mulligan, K. From appropriate emotions to values. Monist 1998, 81, 161–188. Available online: https://www.jstor.org/stable/27903576 (accessed on 10 August 2022). [CrossRef]
  45. Arifaj, S. Contemporary Educational Administration; Dar Al-Fikr: Cairo, Egypt, 2007. [Google Scholar]
  46. Geng, X.; Ma, Z. PPC: A novel approach of Chinese text mining based on Projection pursuit model. Adv. Res. Technol. Ind. Appl. 2014, 12, 950–952. [Google Scholar] [CrossRef]
  47. Jian, W.; Li, J.L.; Zhi, Q.T. Evaluation on Independent Innovation Ability of High-Tech Industry Based on Rough Set and Projection Pursuit Model. Key Eng. Mater. 2011, 480, 821–826. [Google Scholar] [CrossRef]
  48. Friedman, J.H.; Tukey, J.W. A projection pursuit algorithm for exploratory data analysis. IEEE Trans. Comput. 1974, 100, 881–890. [Google Scholar] [CrossRef]
  49. Goronga, P. The nature and quality of classroom verbal interaction: Implications for primary school teachers in Zimbabwe. Acad. Res. Int. 2013, 4, 431–444. Available online: http://www.savap.org.pk/journals/ARInt./Vol.4/2013(4.2-45).pdf (accessed on 12 August 2022).
  50. Zhong, Q. Discussion on the Study of “Classroom Interaction”. Educ. Res. 2010, 31, 73–80. (In Chinese) [Google Scholar]
  51. Reynolds, W.M.; Miller, G.E. Educational psychology: Contemporary perspectives. In Handbook of Psychology: Educational Psychology; Reynolds, W.M., Miller, G.E., Weiner, I.B., Eds.; John Wiley & Sons, Inc.: Hoboken, NJ, USA, 2013; pp. 2–22. [Google Scholar] [CrossRef]
  52. Zhong, Q. Teacher Research and Learning: New Patterns and Challenges. In Autobiography and Teacher Development in China. Curriculum Studies Worldwide; Hua, Z., Pinar, W.F., Eds.; Palgrave Macmillan: New York, NY, USA, 2015. [Google Scholar] [CrossRef]
  53. Hiebert, J.; Stigler, J.W.; Jacobs, J.K.; Givvin, K.B.; Garnier, H.; Smith, M.; Hollingsworth, H.; Manaster, A.; Wearne, D.; Gallimore, R. Mathematics Teaching in the United States Today (and Tomorrow): Results from the TIMSS 1999 Video Study. Educ. Eval. Policy Anal. 2005, 27, 111–132. [Google Scholar] [CrossRef]
  54. Zhao, K.; Boonyaprakob, K. A Case Study of Chinese Students Learning Thai as a Foreign Language: Flanders Interaction Analysis Category System. Int. J. Tesol. Educ. 2022, 2, 145–169. [Google Scholar] [CrossRef]
  55. Rosenshine, B. Teaching Behaviours and Student Achievement; National Foundation for Educational Research London: New York, NY, USA, 1971. [Google Scholar]
  56. Schulman, L. Paradigms and research programs in the study of teaching. In Handbook of Research on Teaching; Macmillan: New York, NY, USA, 1986; pp. 3–36. [Google Scholar]
  57. Brophy, J.E.; Good, T.L. Teacher Behaviour and Student Achievement; Macmillan: New York, NY, USA, 1986. [Google Scholar]
  58. Lindgren, H.C.; Suter, W.N. Educational Psychology in the Classroom; Wiley: New York, NY, USA, 1967. [Google Scholar]
Figure 1. Dynamic comparison of teacher talking ratios.
Sustainability 15 01783 g001
Figure 2. Dynamic comparison of student talking ratios.
Sustainability 15 01783 g002
Figure 3. Dynamic comparison of silence or confusion language ratios.
Sustainability 15 01783 g003
Table 1. FIAS coding system and its explanation.
ClassificationNo.ContentSimple Explanation
Teacher talkII1Accepts feelingsIncorporate into the emotions of students, express their emotions, and affect students’ attitudes.
2Praises or encouragesTeachers use language information to ease the atmosphere or express humor, praise, or encourage students.
3Accepts or uses ideas of studentsAdopt the opinions of the students, repeat the correct views of the students, which teachers do further expand and extend on.
4Asks questionsTeachers ask students questions about the content of the course, arouse their thinking, and expect their answers.
DI5Gives lecturesState facts and ideas, and explain and quote examples, passing information through a single line of language.
6Gives directionsThe teacher asks the student to adopt certain behaviors through the language and issue instructions that the student can follow.
7Criticizes or justifies authorityCriticize students for correcting or improving their classroom behaviors, maintain authority, and change students’ behaviors.
Student talk8Response to teacherThe student makes a targeted answer to the teacher’s question and closes the answer question within a limited scope.
9Student-initiated talkStudents are free to submit comments and ideas on a question, and the content is not necessarily limited.
Silence or confusion10Silence or confusionStudent discussion, student record, student exercise, student meditation, teacher demonstration, invalid status.
Table 2. FIAS matrix coding and analysis.
ClassificationNo.12345678910Total
Accepts feelingsII1Area E
Praises or encourages2
Accepts or uses ideas of students3
Asks questions4
Gives lecturesDI5
Gives directions6
Criticizes or justifies authority7
Response to teacherStudent talk8 Area F
Student initiated talk9
Silence or confusionSilence10
TotalArea AArea BArea CArea D
Indirect teacher talkDirect teacher talkStudent talkSilence
Table 3. Quantitative comprehensive analysis system of classroom teaching language.
DimensionSub-DimensionSub-Dimension Description
Matrix AnalysisClass structureThe ratio of teachers’ language, students’ language, and silence or confusion behaviors in the classroom can reflect the classroom structure.
Teaching styleThe ratio of direct influence and indirect influence in classroom teaching can show the teacher’s teaching style and tendency.
Emotional atmosphereThe proportion of language in positive integration and defect lattice can reflect the degree of emotional integration between teachers and students.
Variable analysisVariable analysis can explore the invisible factors of teachers and students’ positive response, questioning, adoption, and teaching materials as the center.
Question formulationThis dimension reflects the teacher’s question answering pattern and the degree of innovation in the teacher’s questioning, and whether it can cultivate students’ creative thinking.
Dynamic Curve AnalysisTeacher TalkThe classroom dynamic curve can accurately reflect the classroom behaviors of teachers and students in the entire time series. The number and duration of the occurrence of “peak” and “low valley” further illustrate the changing characteristics of the classroom, just like the “electrocardiogram” of the classroom.
Student Talk
Silence or confusion
Table 4. ET average matrix analysis.
No.12345678910Total
1220750070528
24551483071451
30061121040226
452035745604738194
594354775013012177
6130573020526
700000000000
841463017204756131
9023401008018
1031012165041156198
Total28512619417726013118198849
%3.3%6.0%3.1%22.9%20.9%3.1%0.0%15.4%2.1%23.3%100%
35.2%23.9%17.6%23.3%100%
TotalTeacher talkStudent talkSilence
Table 5. NT average matrix analysis.
No.12345678910Total
101041100007
2186112010051870
3024751000120
4320342291204026157
5152501031711707203
60101214240902383
700010000001
802141718703031101
9131100006012
10190121311010148195
Total7702015720383110212194849
%0.8%8.2%2.4%18.5%23.9%9.8%0.1%12.0%1.4%22.9%100%
29.9%33.8%13.4%22.9%100%
TotalTeacher talkStudent talkSilence
Table 6. FIAS variable calculation formula and data.
VariableComputational FormulaET%NT%Norm
Teacher response ratio (TRR) [ j = 1 3 C o l ( j ) ] × 100 ÷ [ j = 1 3 C o l ( j ) + j = 6 7 C o l ( j ) ] 80.1553.5942
Teacher question ratio (TQR) C o l ( 4 ) × 100 ÷ j = 4 5 C o l ( j ) 52.2943.6126
Pupil inquiry ratio (PIR) C o l ( 9 ) × 100 ÷ j = 8 9 C o l ( j ) 12.0810.6234
Teacher response ratio (TRR89) i = 8 9 j = 1 3 c e l l ( i , j ) × 100 ÷ [ i = 8 9 j = 1 3 c e l l i , j + i = 8 9 j = 6 7 c e l l ( i , j ) ] 90.6381.0960
Teacher question ratio (TQR89) i = 8 9 c e l l ( i , 4 ) × 100 ÷ [ i = 8 9 j = 4 5 c e l l i , j ] 66.6750.0044
Content cross (CCR) [ j = 4 5 C o l j + i = 4 5 R o w i i = 4 5 j = 4 5 c e l l i , j ] × 100 ÷ T o t a l 59.9558.4255
Stable state ratio (SSR) i = j = 1 10 c e l l ( i , j ) × 100 ÷ T o t a l 42.5242.9950
Pupil stable state ratio (PSSR) i = j = 8 9 c e l l ( i , j ) × 100 ÷ j = 8 9 C o l ( j ) 36.9131.8635 or 40
Table 7. Statistics of questioning patterns.
Question and Answer ModeCreative Inquiry Mode
(4, 4)(4, 8)(8, 4)(8, 8)(9, 9)(3, 3)(3, 9)(8, 3)(8, 9)(9, 3)(4, 9)(4, 3)
ET5544304686065333
NT4140173154043123
Table 8. Classroom teaching language evaluation level membership degree.
Split Point10.90.80.70.60.50.40.30.20.1
110987654321
22018161412108642
32018161412108642
45045403530252015105
550100150200250300350400450500
612345678910
712345678910
85045403530252015105
910987654321
10200190180170160150140130120110
Table 9. Teacher classroom teaching language evaluation index code value.
Coding12345678910
ET28512619417726013118198
NT7702015720383110212194
Disclaimer/Publisher’s Note: The statements, opinions and data contained in all publications are solely those of the individual author(s) and contributor(s) and not of MDPI and/or the editor(s). MDPI and/or the editor(s) disclaim responsibility for any injury to people or property resulting from any ideas, methods, instructions or products referred to in the content.

