
Taiga Landscape Degradation Evidenced by Indigenous Observations and Remote Sensing


Abstract
1. Introduction
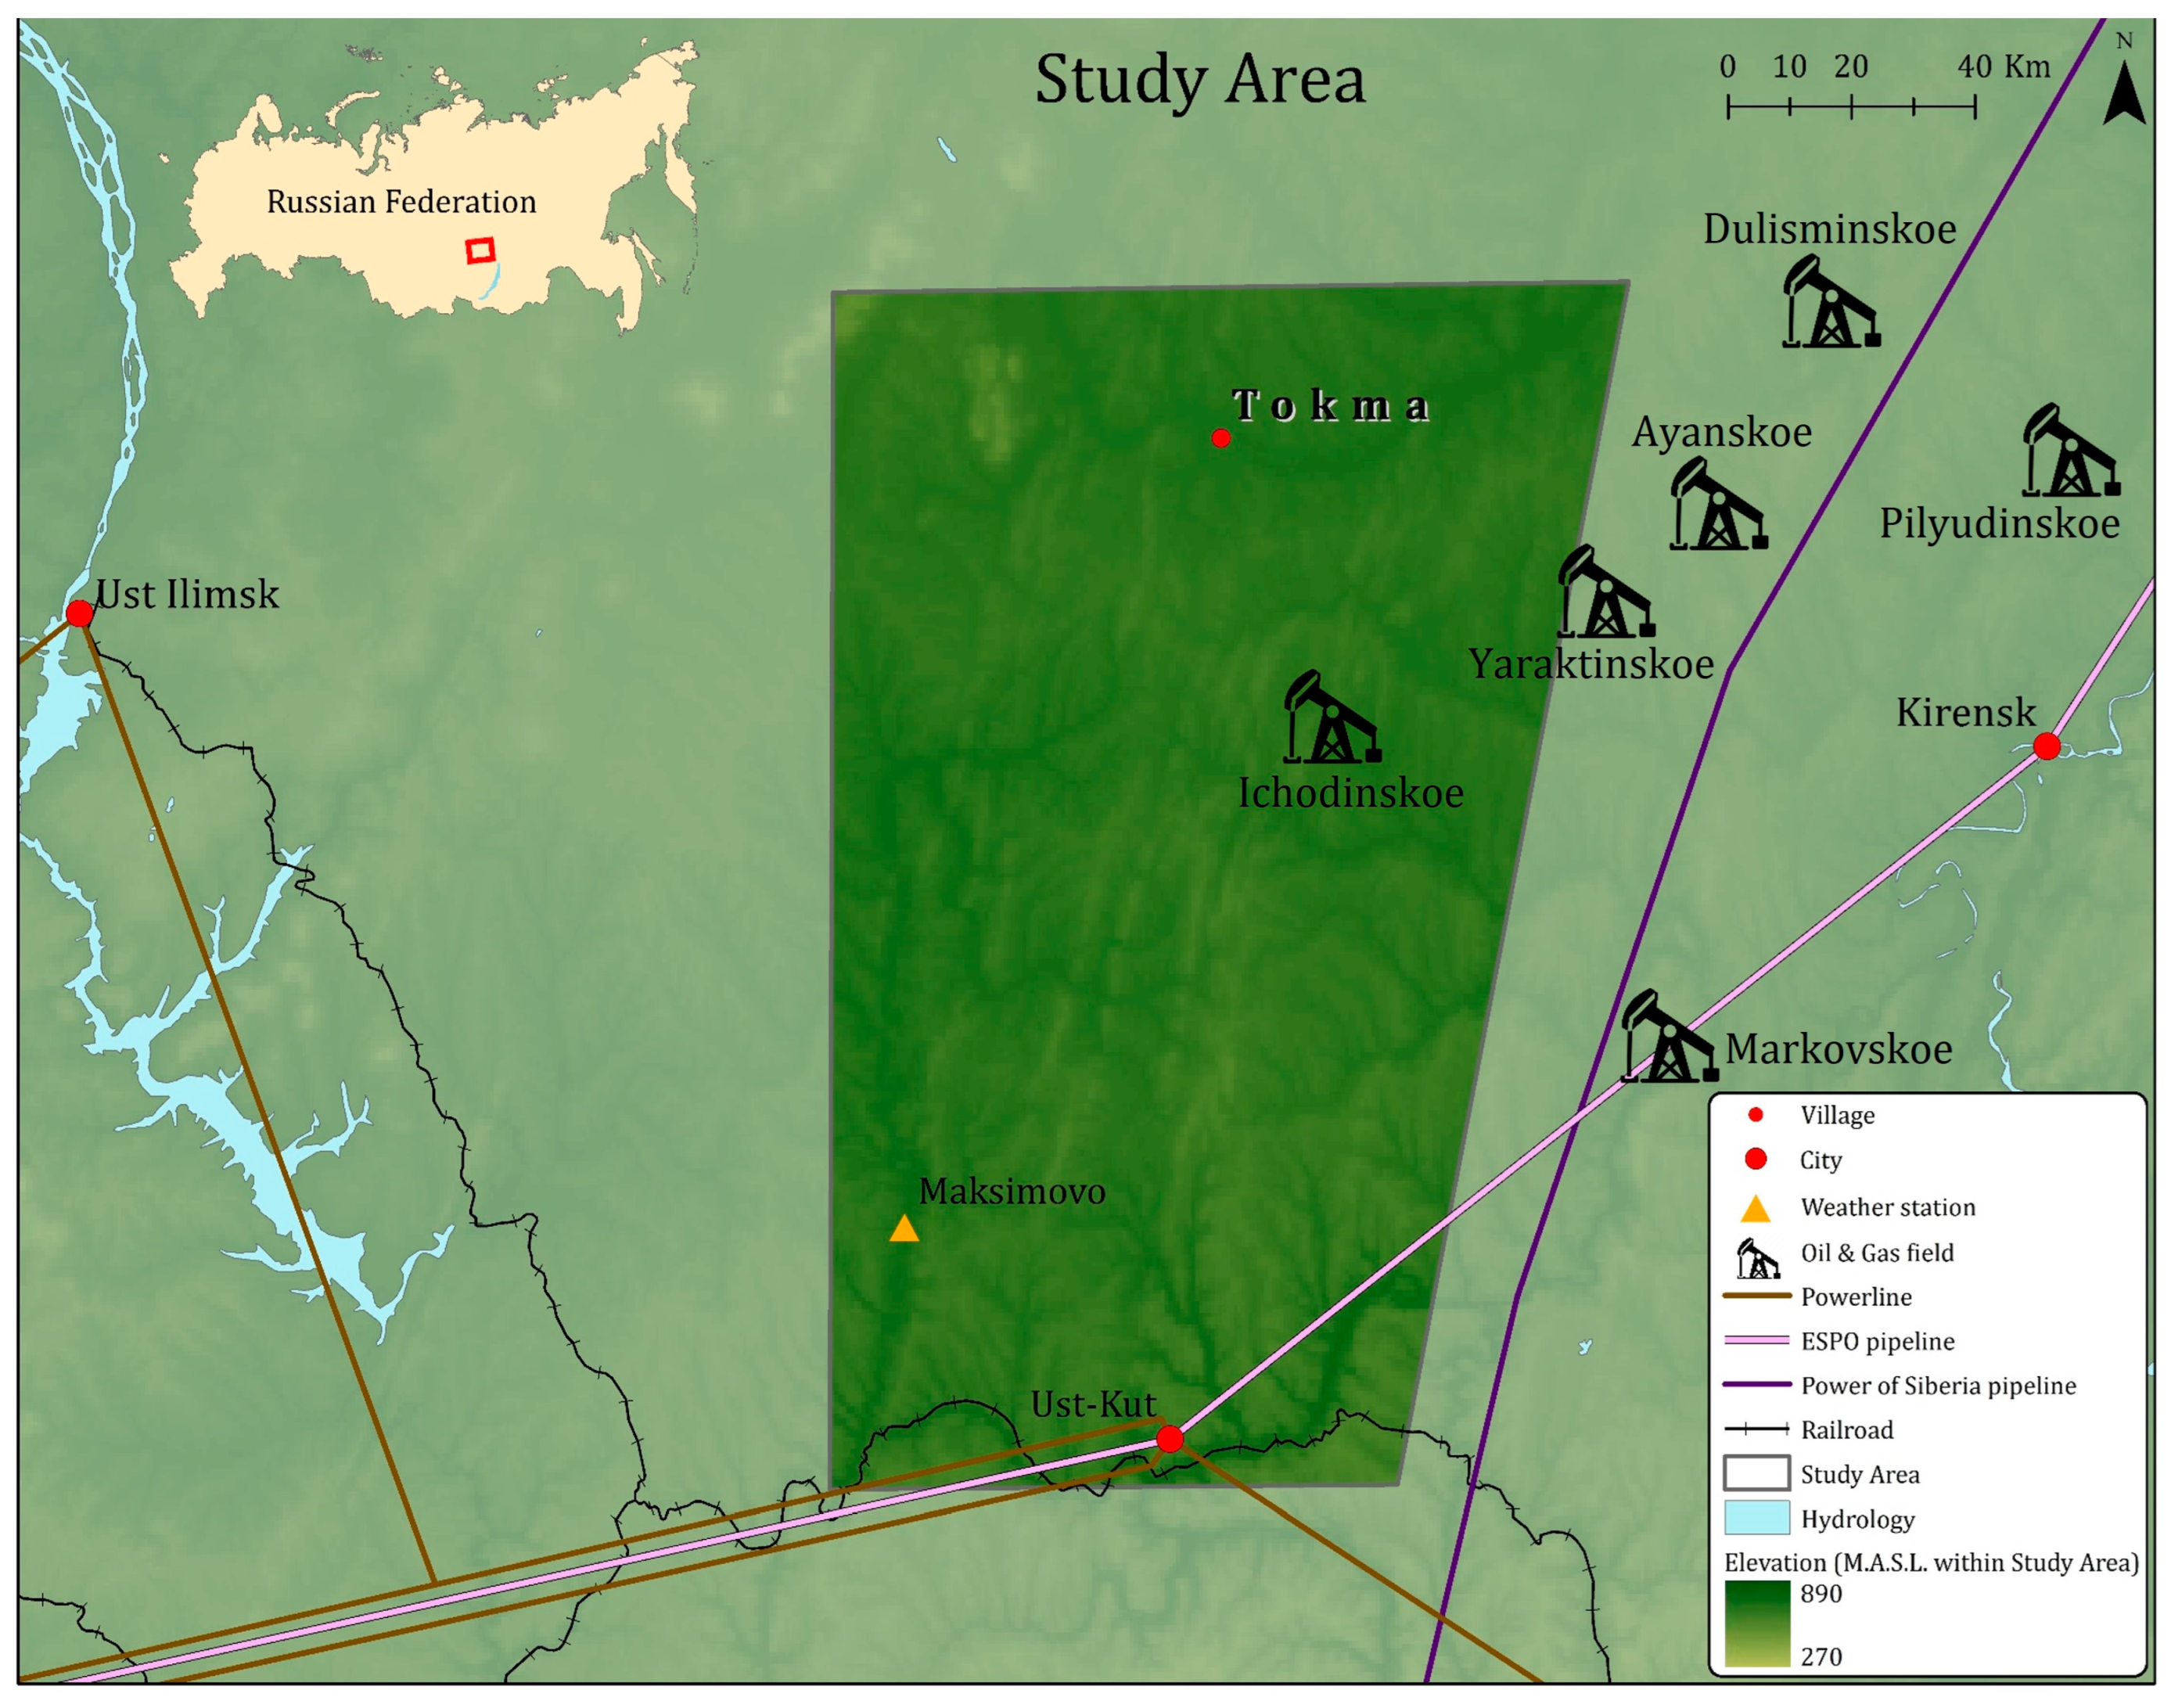
2. Study Area
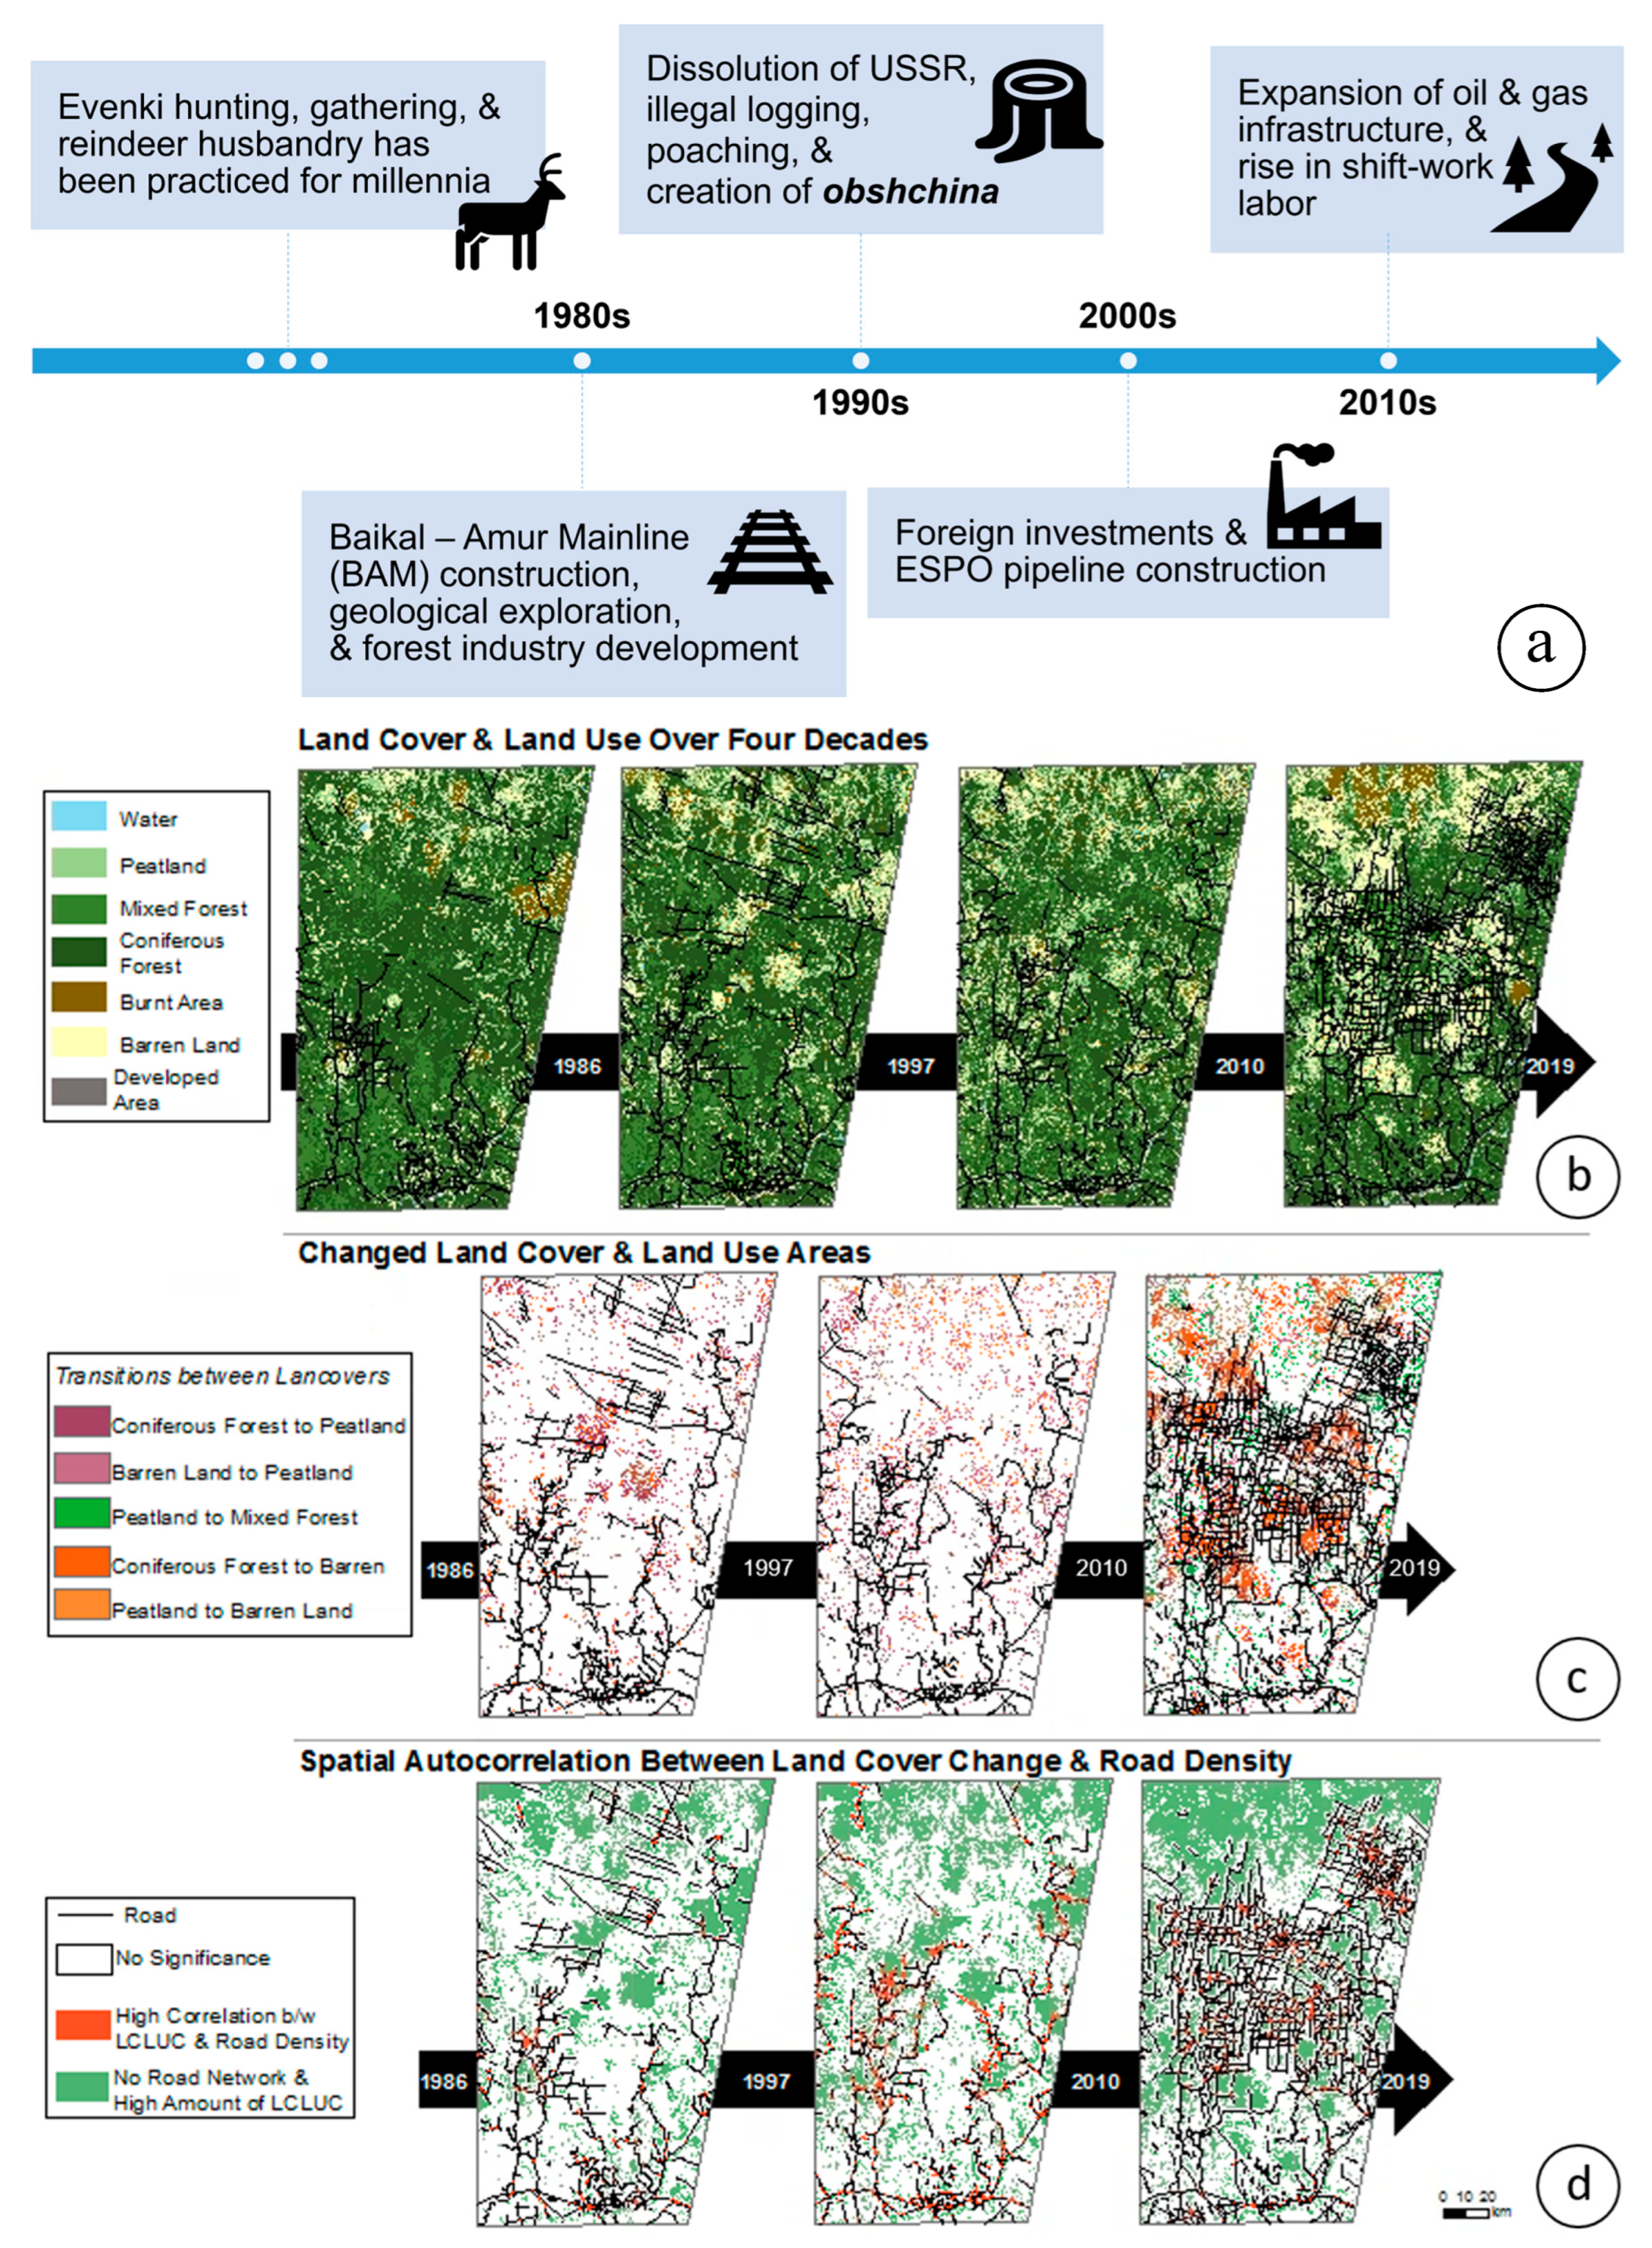
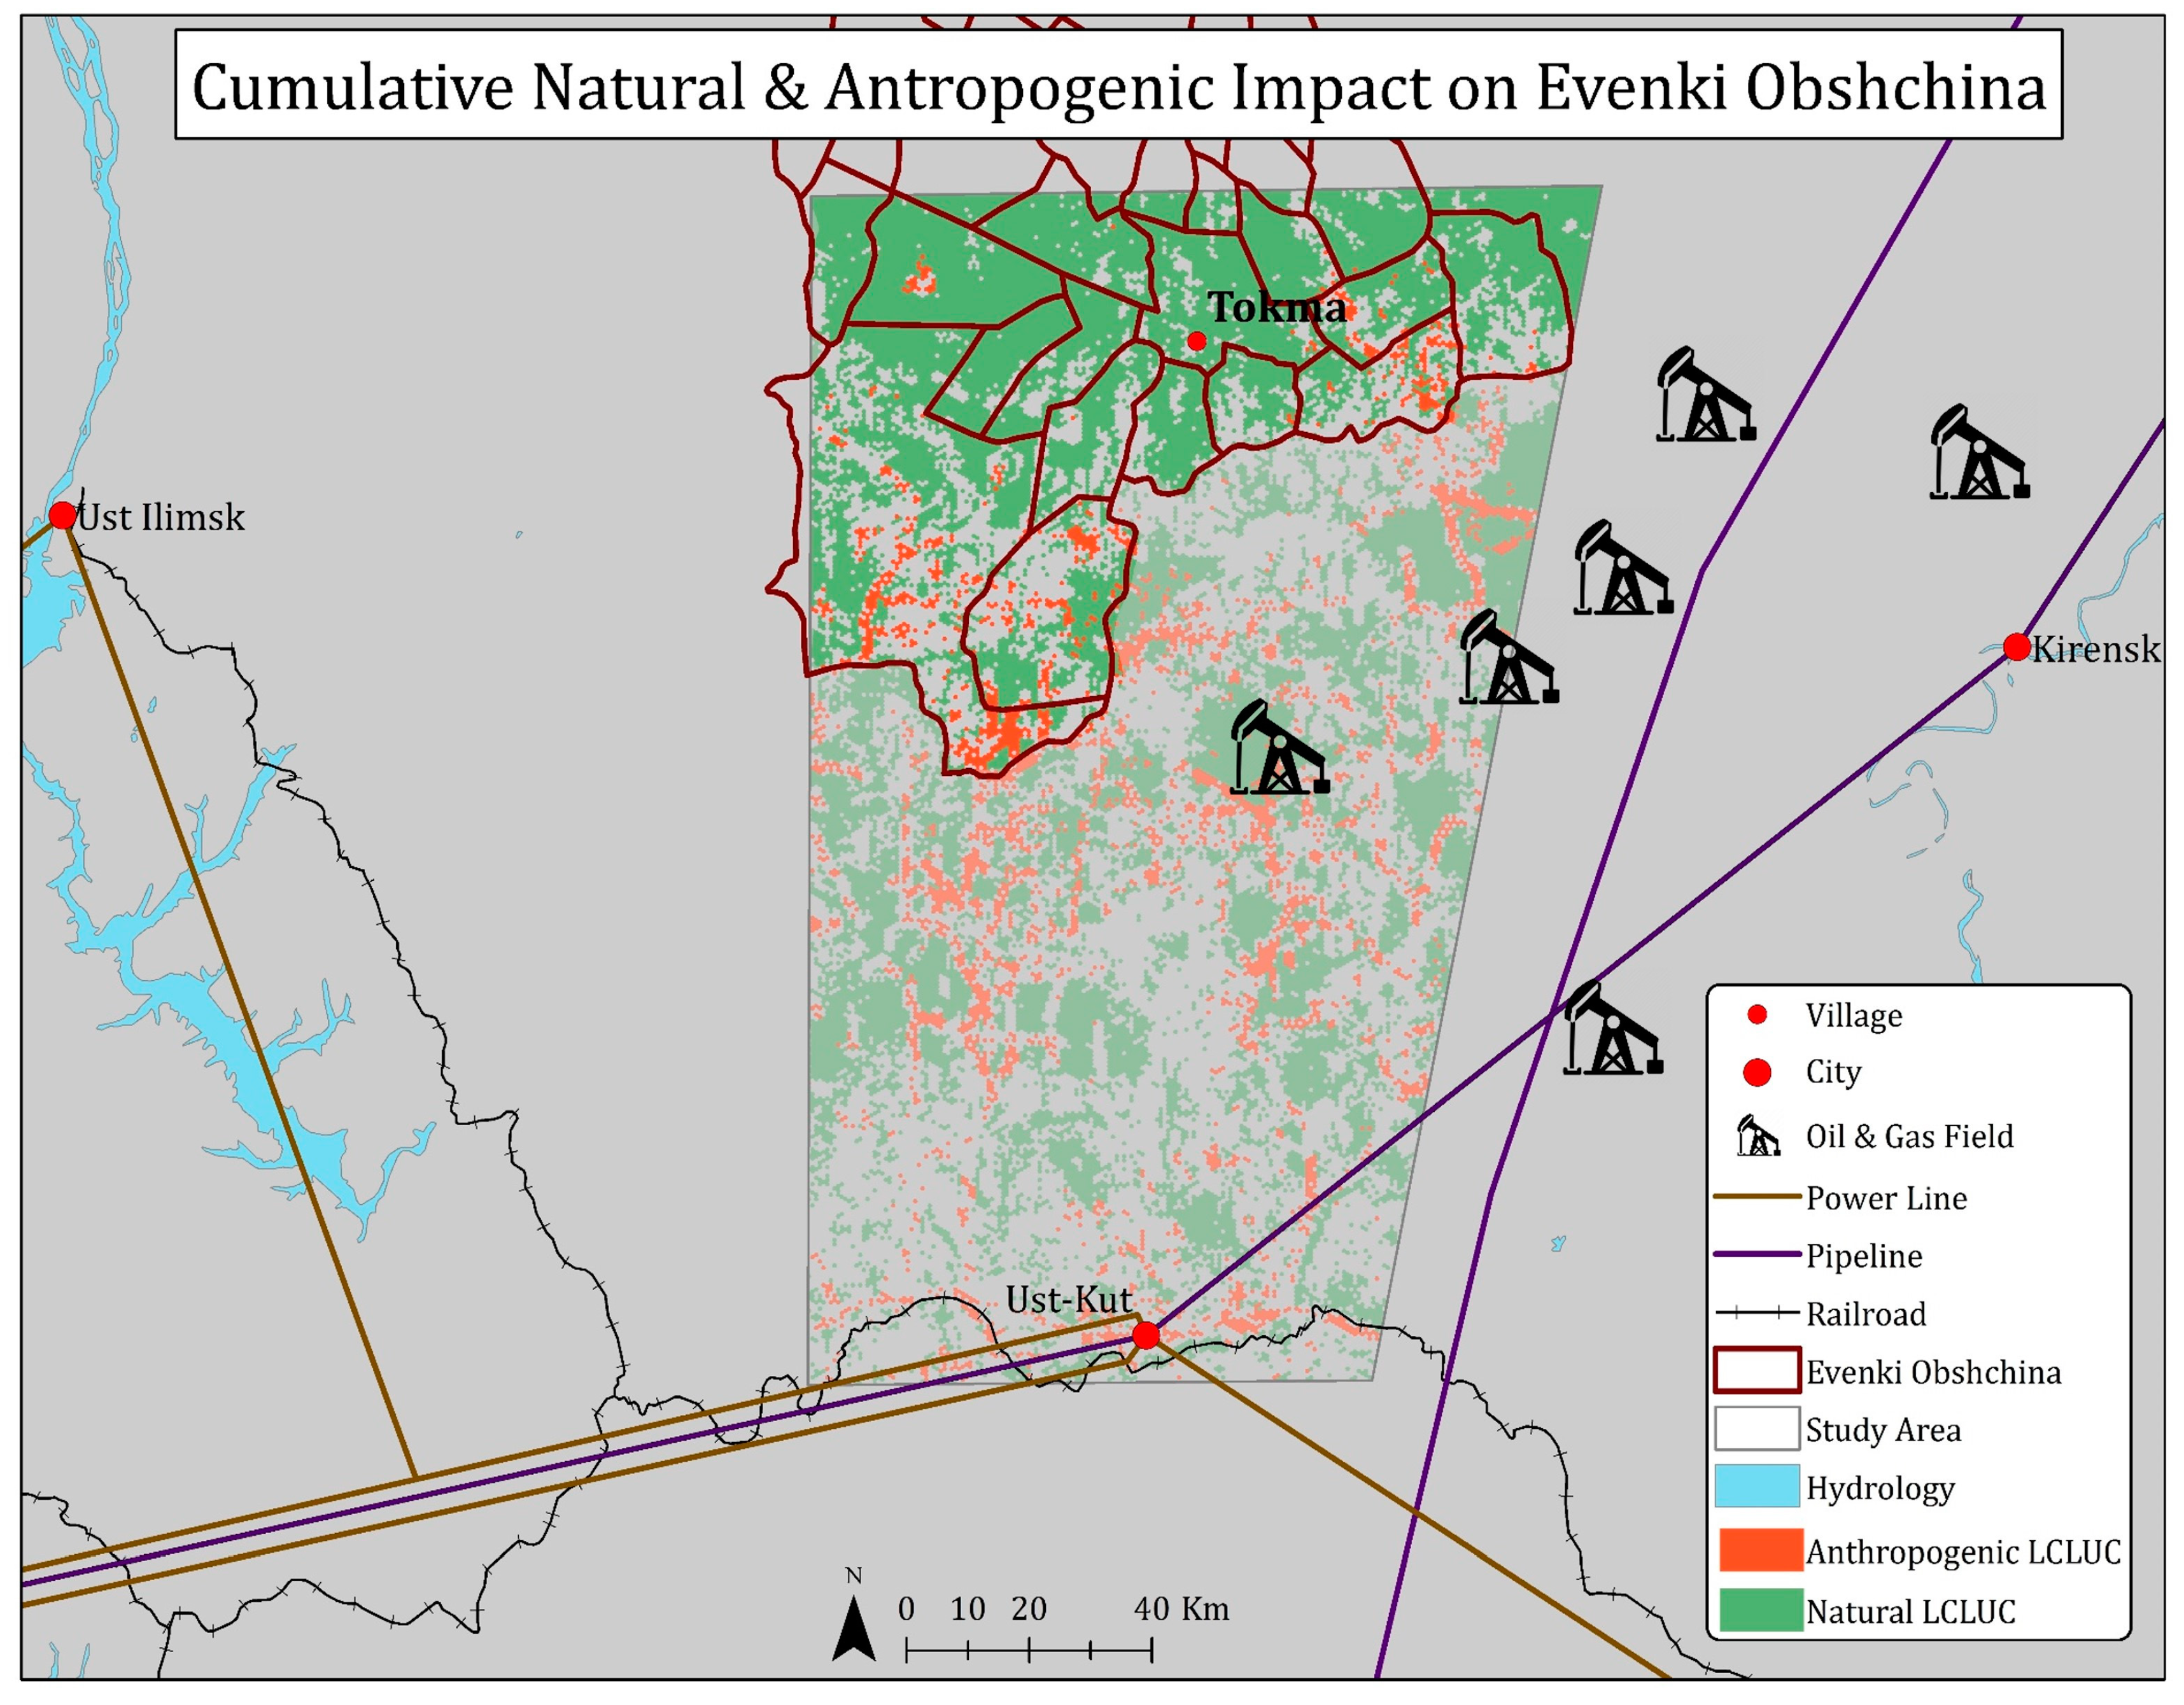
2.1. Background on Evenki Obhschinas and Industrial Development
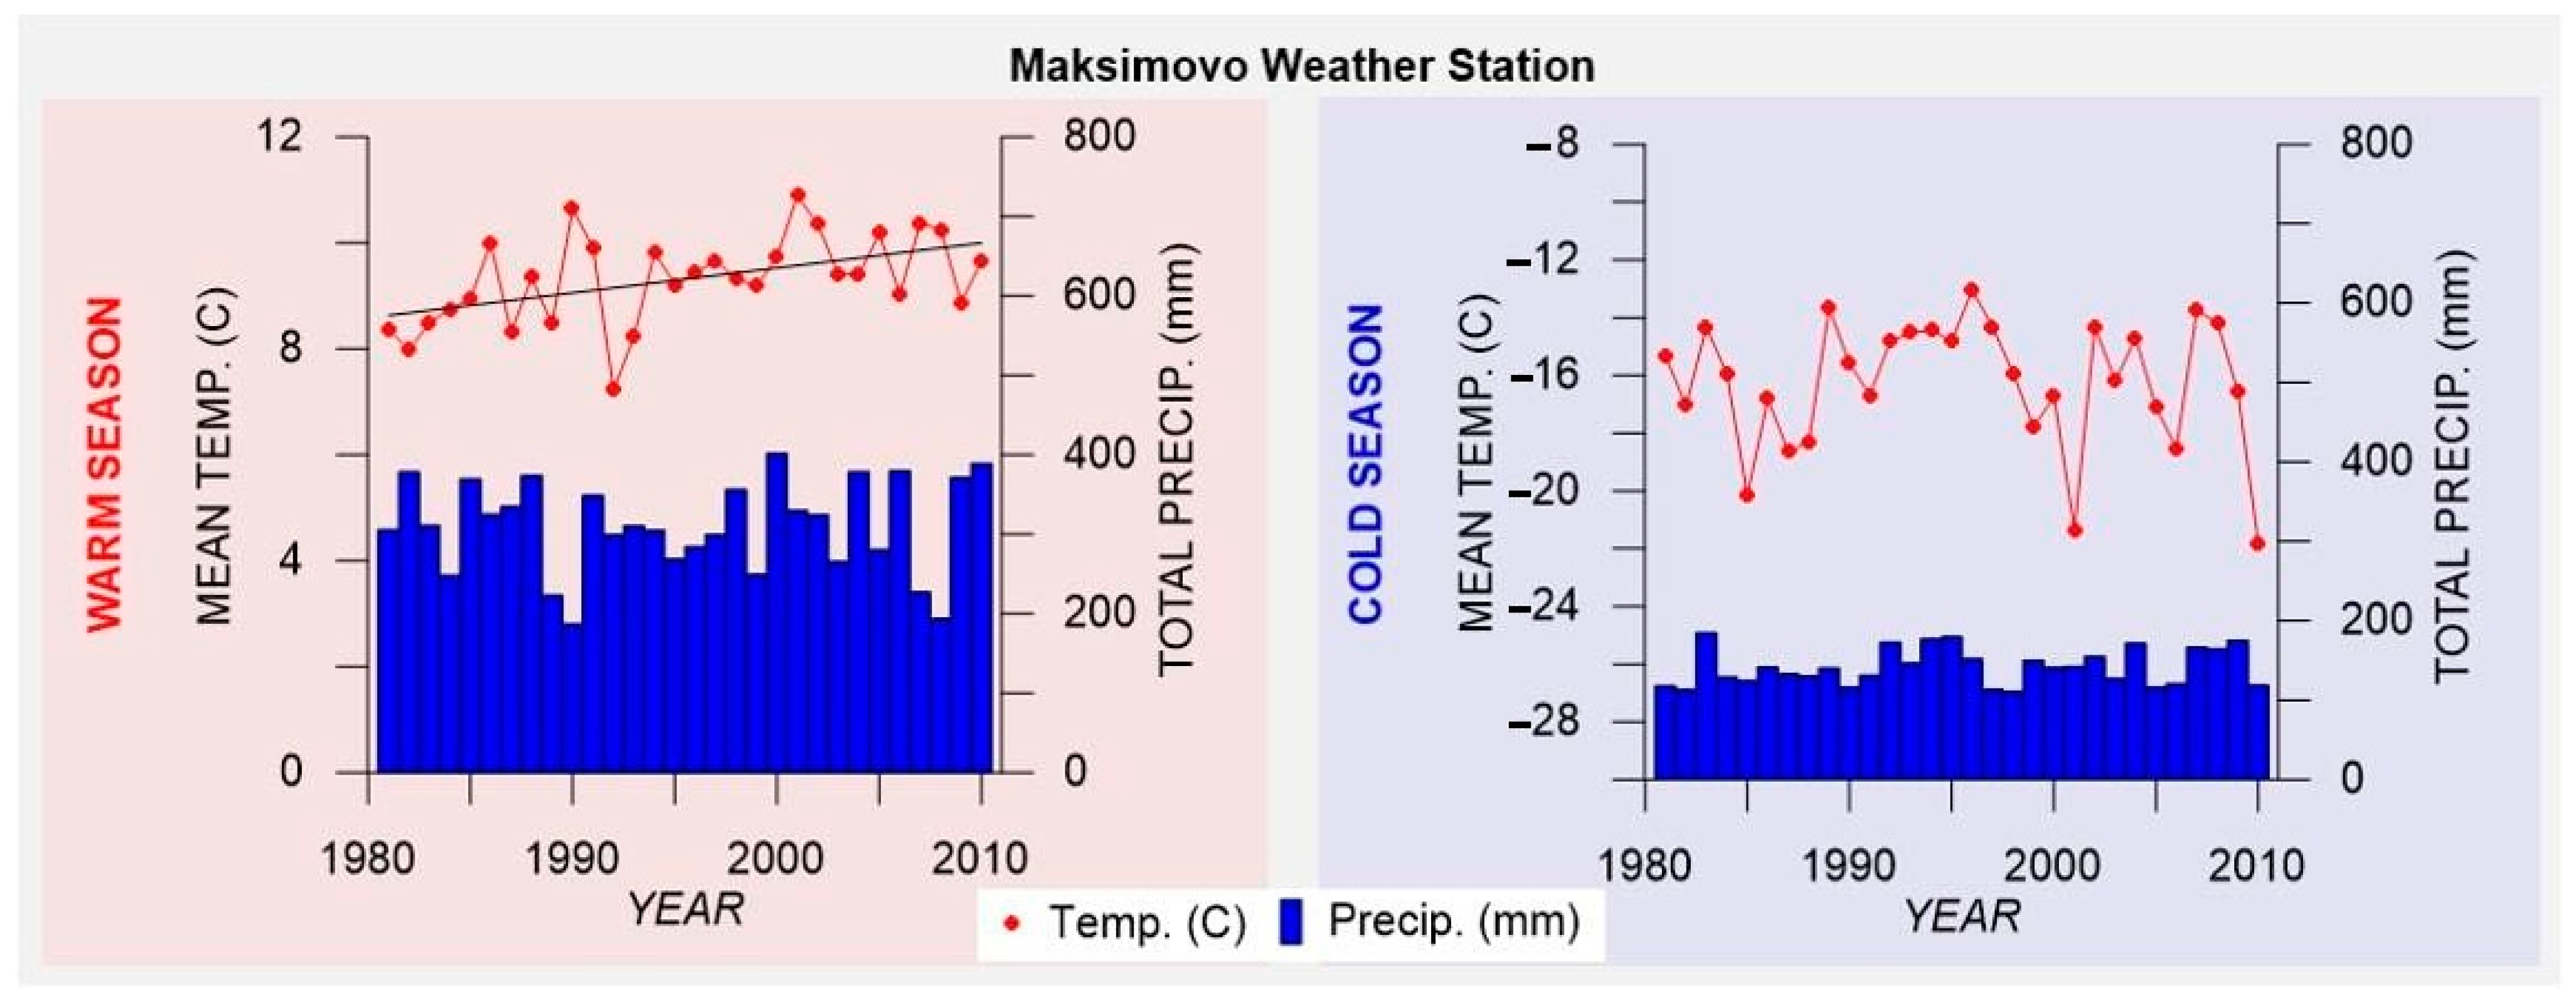
2.2. Observed Climate Change
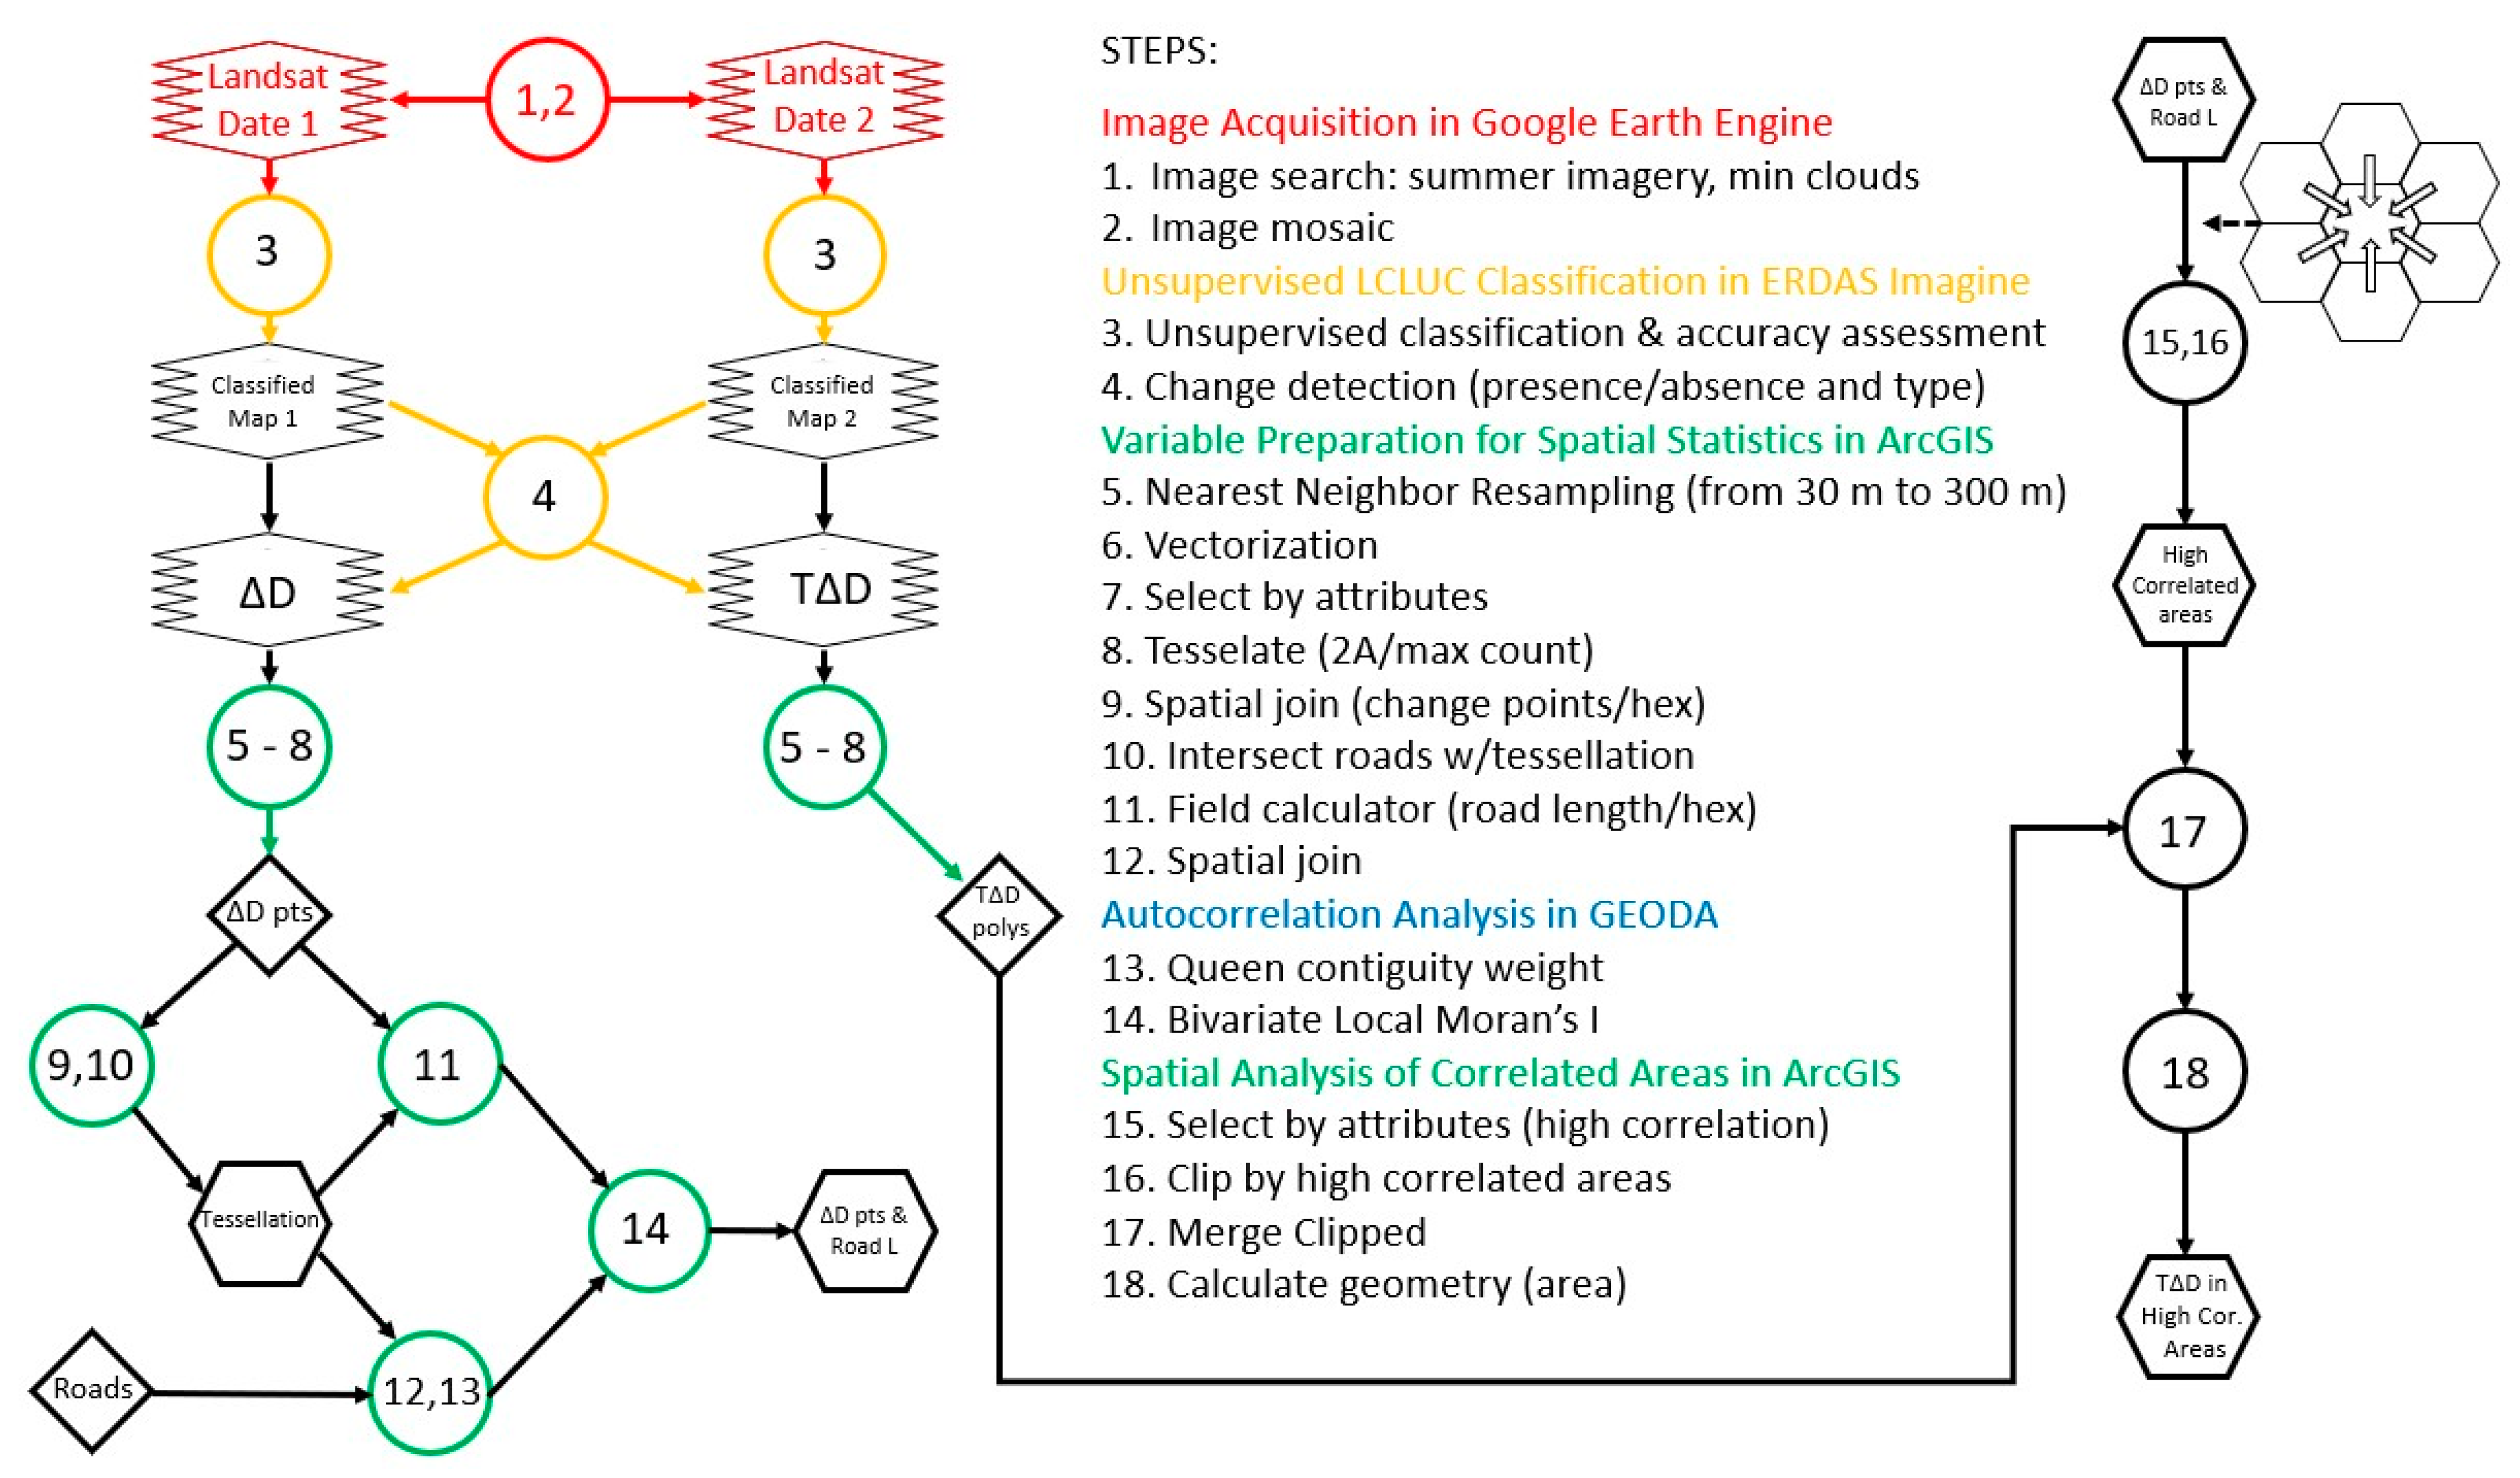
3. Methods
3.1. Land Cover Classification and Accuracy Assessment
3.2. Informal Road Digitization
3.3. Spatial Autocorrelation Analysis between Land Cover Change and Road Network Density
3.4. Interviews with Local and Indigenous Residents
4. Results
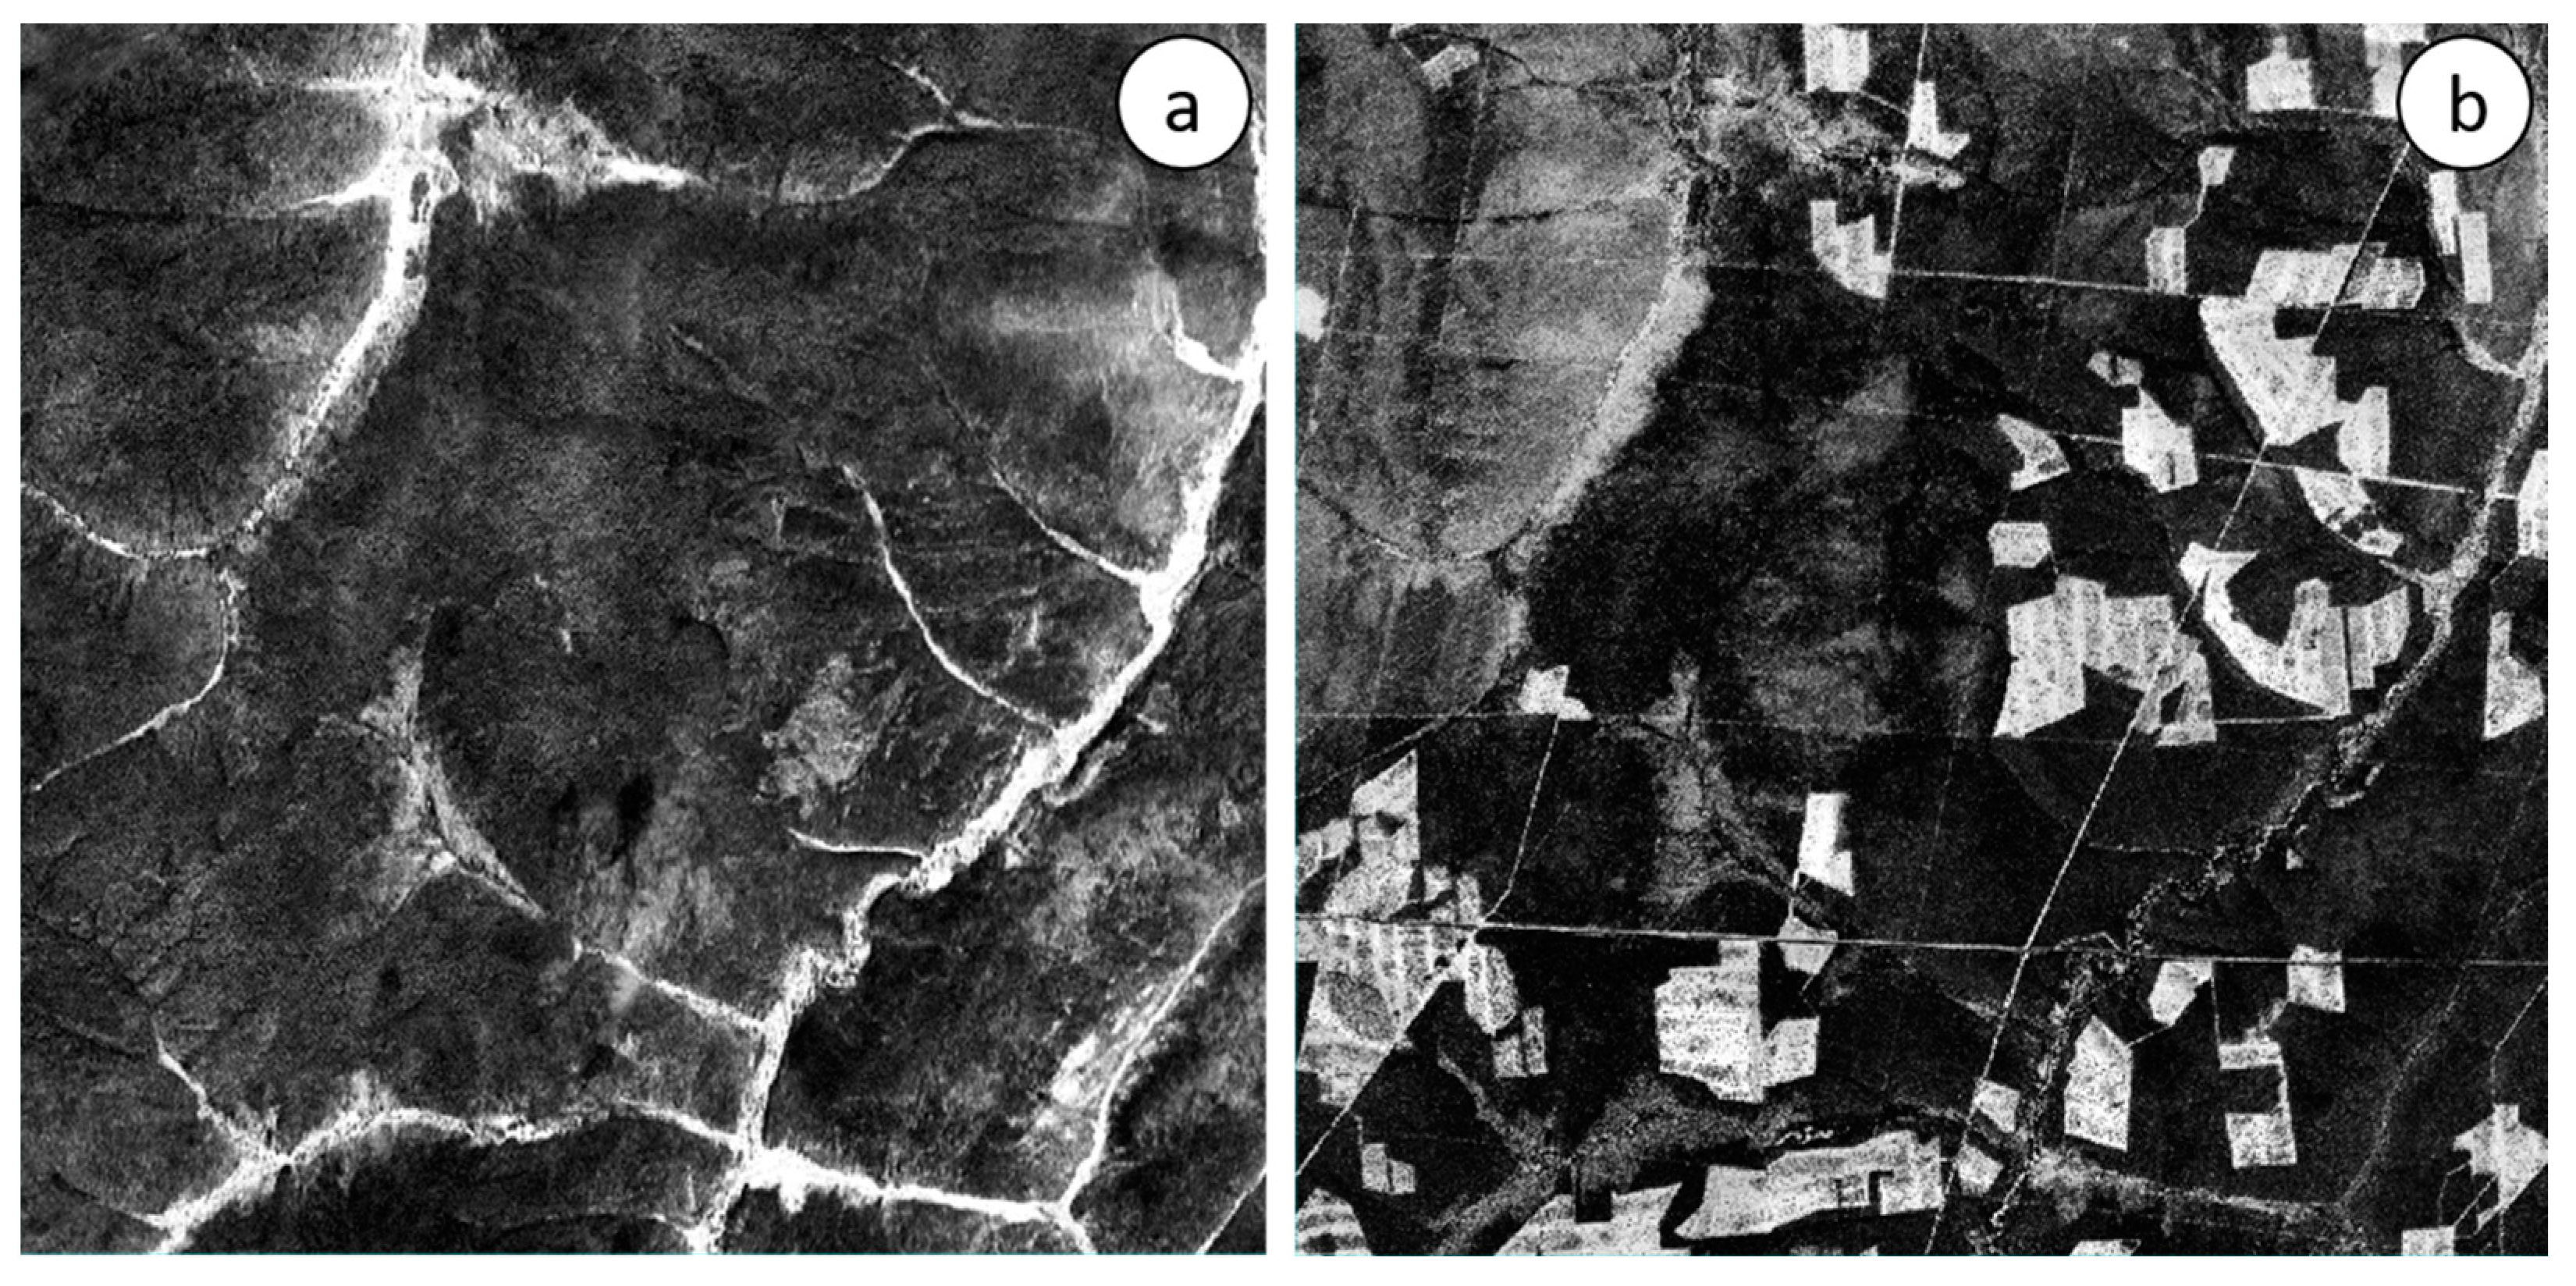
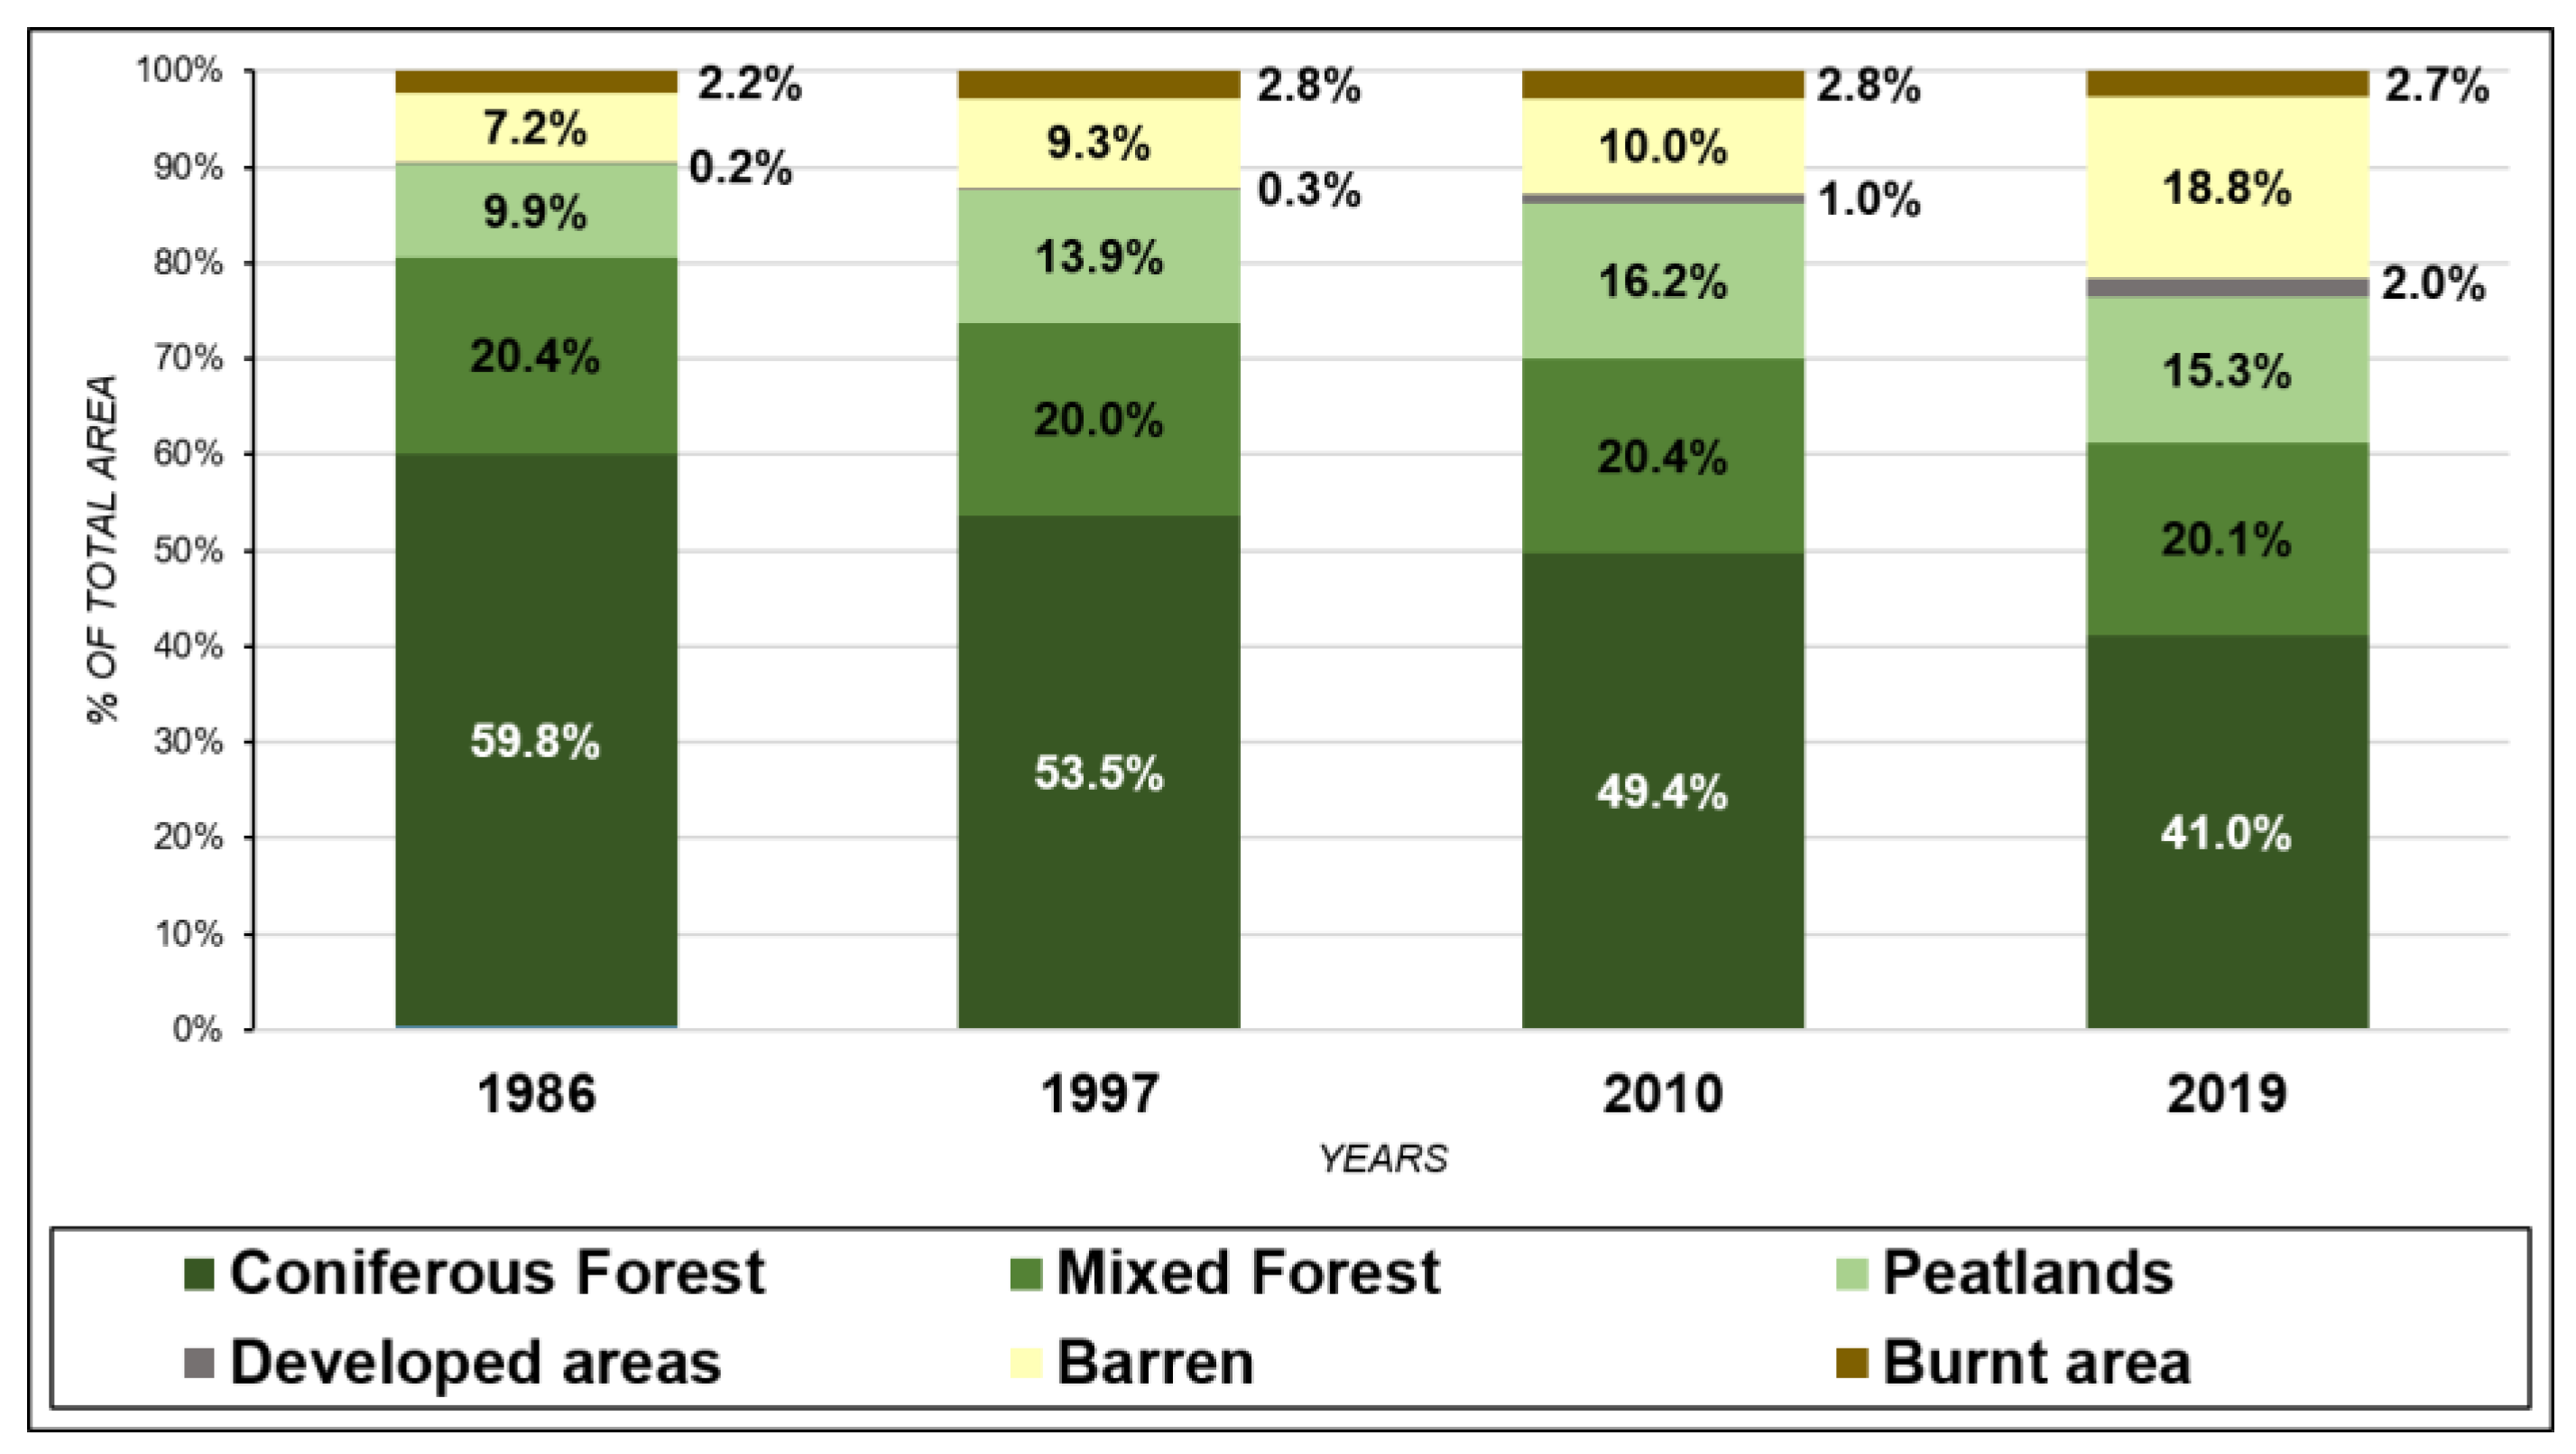
4.1. Land Cover and Land Use Mapping and Change Analysis
4.2. Land Cover Change and Road Density Spatial Autocorrelation Analysis
4.3. Analysis of Interviews in the Study Area
5. Discussion
6. Conclusions
Supplementary Materials
Author Contributions
Funding
Institutional Review Board Statement
Informed Consent Statement
Data Availability Statement
Acknowledgments
Conflicts of Interest
References
- Kuklina, V.; Petrov, A.N.; Krasnoshtanova, N.; Bogdanov, V. Mobilizing Benefit-Sharing Through Transportation Infrastructure: Informal Roads, Extractive Industries and Benefit-Sharing in the Irkutsk Oil and Gas Region, Russia. Resources 2020, 9, 21. [Google Scholar] [CrossRef]
- Laurance, W.F.; Arrea, I.B. Roads to Riches or Ruin? Science 2017, 358, 442–444. [Google Scholar] [CrossRef] [PubMed]
- Perz, S.G. The Promise and Perils of Roads. Nature 2014, 513, 178–179. [Google Scholar] [CrossRef]
- Arima, E.Y.; Walker, R.T.; Perz, S.; Souza, C. Explaining the Fragmentation in the Brazilian Amazonian Forest. J. Land Use Sci. 2015, 11, 257–277. [Google Scholar] [CrossRef]
- Raynolds, M.K.; Jorgenson, J.C.; Jorgenson, M.T.; Kanevskiy, M.; Liljedahl, A.K.; Nolan, M.; Sturm, M.; Walker, D.A. Landscape Impacts of 3D-seismic Surveys in the Arctic National Wildlife Refuge, Alaska. Ecol. Appl. 2020, 30, e02143. [Google Scholar] [CrossRef]
- Tarnocai, C.; Stolbovoy, V. Chapter 2 Northern Peatlands: Their Characteristics, Development and Sensitivity to Climate Change. In Developments in Earth Surface Processes; Elsevier: Amsterdam, The Netherlands, 2006; Volume 9, pp. 17–51. [Google Scholar] [CrossRef]
- Hedlund, C.; Blomstedt, Y.; Schumann, B. Association of Climatic Factors with Infectious Diseases in the Arctic and Subarctic Region—A Systematic Review. Glob. Health Action 2014, 7, 24161. [Google Scholar] [CrossRef]
- IPCC. Summary for Policymakers; Climate Change 2021: The Physical Science Basis. Contribution of Working Group I to the Sixth Assessment Report of the Intergovernmental Panel on Climate Change. 2021. in press. Available online: https://www.ipcc.ch/report/ar6/wg1/ (accessed on 30 March 2022).
- Ibisch, P.L.; Hoffmann, M.T.; Kreft, S.; Pe’er, G.; Kati, V.; Biber-Freudenberger, L.; DellaSala, D.A.; Vale, M.M.; Hobson, P.R.; Selva, N. A Global Map of Roadless Areas and Their Conservation Status. Science 2016, 354, 1423–1427. [Google Scholar] [CrossRef]
- Lee, J. Indigenous People and Political Agenda: The Issue of Social and Ecological Change of the Nomadic Siberian, the Evenki, in Russia. J. Contemp. Anthropol. 2013, 4, 1. [Google Scholar]
- Achard, F.; Mollicone, D.; Stibig, H.-J.; Aksenov, D.; Laestadius, L.; Li, Z.; Popatov, P.; Yaroshenko, A. Areas of Rapid Forest-Cover Change in Boreal Eurasia. For. Ecol. Manag. 2006, 237, 322–334. [Google Scholar] [CrossRef]
- Bergen, K.M.; Zhao, T.; Kharuk, V.; Blam, Y.; Brown, D.G.; Peterson, L.K.; Miller, N. Changing Regimes. Photogramm. Eng. Remote Sens. 2008, 74, 787–798. [Google Scholar] [CrossRef]
- Kirillina, K.; Shvetsov, E.G.; Protopopova, V.V.; Thiesmeyer, L.; Yan, W. Consideration of Anthropogenic Factors in Boreal Forest Fire Regime Changes during Rapid Socio-Economic Development: Case Study of Forestry Districts with Increasing Burnt Area in the Sakha Republic, Russia. Environ. Res. Lett. 2020, 15, 035009. [Google Scholar] [CrossRef]
- Blinnikov, M.S. A Geography of Russia and Its Neighbors; Texts in regional geography: A Guilford series; Guilford Press: New York, NY, USA, 2011. [Google Scholar]
- Kuklina, V.; Sizov, O.; Bogdanov, V.; Krasnoshtanova, N.; Morozova, A.; Petrov, A.N. Combining Community Observations and Remote Sensing to Examine the Effects of Roads on Wildfires in the East Siberian Boreal Forest. Arct. Sci. 2022. [Google Scholar] [CrossRef]
- Loboda, T.V.; Chen, D. Spatial Distribution of Young Forests and Carbon Fluxes within Recent Disturbances in Russia. Glob. Chang. Biol. 2017, 23, 138–153. [Google Scholar] [CrossRef] [PubMed]
- Groisman, P.Y.; Gutman, G. (Eds.) Regional Environmental Changes in Siberia and Their Global Consequences; Springer Environmental Science and Engineering: Dordrecht, The Netherlands; Springer: New York, NY, USA, 2013. [Google Scholar]
- Bergen, K.M.; Conard, S.G.; Houghton, R.A.; Kharuk, V.I.; Krankina, O.N.; Ranson, K.J.; Shugart, H.H.; Sukhinin, A.I.; Treyfeld, R.F. NASA and Russian Scientists Observe Land-Cover and Land-Use Change and Carbon in Russian Forests. J. For. 2003, 101, 34–41. [Google Scholar]
- Prishchepov, A.V.; Radeloff, V.C.; Baumann, M.; Kuemmerle, T.; Müller, D. Effects of Institutional Changes on Land Use: Agricultural Land Abandonment during the Transition from State-Command to Market-Driven Economies in Post-Soviet Eastern Europe. Environ. Res. Lett. 2012, 7, 024021. [Google Scholar] [CrossRef]
- Gutman, G.; Radeloff, V. (Eds.) Land-Cover and Land-Use Changes in Eastern Europe after the Collapse of the Soviet Union in 1991; Springer International Publishing: Cham, Switzerland, 2017. [Google Scholar] [CrossRef]
- Maynard, N.G.; Oskal, A.; Turi, J.M.; Mathiesen, S.D.; Eira, I.M.G.; Yurchak, B.; Etylin, V.; Gebelein, J. Impacts of Arctic Climate and Land Use Changes on Reindeer Pastoralism: Indigenous Knowledge and Remote Sensing. In Eurasian Arctic Land Cover and Land Use in a Changing Climate; Gutman, G., Reissell, A., Eds.; Springer: Dordrecht, The Netherlands, 2010; pp. 177–205. [Google Scholar] [CrossRef]
- Tysiachniouk, M.; Petrov, A.; Kuklina, V.; Krasnoshtanova, N. Between Soviet Legacy and Corporate Social Responsibility: Emerging Benefit Sharing Frameworks in the Irkutsk Oil Region, Russia. Sustainability 2018, 10, 3334. [Google Scholar] [CrossRef]
- Markolf, S.A.; Chester, M.V.; Eisenberg, D.A.; Iwaniec, D.M.; Davidson, C.I.; Zimmerman, R.; Miller, T.R.; Ruddell, B.L.; Chang, H. Interdependent Infrastructure as Linked Social, Ecological, and Technological Systems (SETSs) to Address Lock-in and Enhance Resilience. Earth’s Future 2018, 6, 1638–1659. [Google Scholar] [CrossRef]
- Chester, M.; Pincetl, S.; Elizabeth, Z.; Eisenstein, W.; Matute, J. Infrastructure and Automobile Shifts: Positioning Transit to Reduce Life-Cycle Environmental Impacts for Urban Sustainability Goals. Environ. Res. Lett. 2013, 8, 015041. [Google Scholar] [CrossRef]
- Vasilevich, G.M. Evenki. Istoriko-Etnograficheskie Ocherki (XVIII–Nachalo XX v.). [Evenki. Historical and Ethnographic Essays (18th–Early 20th Centuries)]; Nauka: Leningrad, Russia, 1969. [Google Scholar]
- Sirina, A.A. Evenki i Eveny v Sovremennom mire: Samosoznaniye, Prirodopol’zo-Vaniye, Mirovozzreniye; Vostochnaya Literature: Moscow, Russia, 2012. [Google Scholar]
- Kurdyukov, V.N. Problems of Preservation of Evenki Traditional Farming in Katangsky District of the Irkutsk Oblast. Earth Sci. 2015, 13, 111–119. [Google Scholar]
- Sereda, E.N. Oil and gas production in the Irkutsk Oblast. History. Sci. Sib. 2015, 1–2, 2137–2138. [Google Scholar]
- Hijmans, R.J.; Cruz, M.; Rojas, E.; Guarino, L. DIVAGIS, Version 1.4. A Geographic Information System for the Management and Analysis of Genetic Resources Data, Manual; International Potato Center: Lima, Peru, 2001. [Google Scholar]
- Gilfanova, V.I. Ethno-Demographic Consequences of The BAM Construction for the Evenki of the Transbaikal region. Notes Transbaikal Branch Russ. Geogr. Soc. 2014, 1, 68–75. [Google Scholar]
- Shepelev, I.A. Soviet Experience of Building the Baikal-Amur Mainline in the Context of Total Modernization of Railway Industry. Hist. Sci. 2019, 1, 126–133. [Google Scholar]
- Baikalov, N.S. Sanitary condition in the areas of the proposed construction of the BAM (1970-1980s). Sci. Res. 2020, 3, 20–32. [Google Scholar]
- Povoroznyuk, O. Aborigeny, bamovtsy i priezzhie: Sotsial’nye otnoscheniya na severe Zabaikal’ia. Sib. Sb. 2014, 4, 35–55. [Google Scholar]
- Povoroznyuk, O. “Urban Aboriginals” of the BAM Region: Industrial Boom, Technosocial Networks and Competition for Resources. Etnogr. Obozr. 2016, 1, 23–41. [Google Scholar]
- Polynov, M.F.; Tarasova, E.A. The Transition to the Market Economy in USSR during Perestroika: Creation of the Concept, 1989–1991. Mod. Hist. Russ. 2017, 1, 113–127. [Google Scholar] [CrossRef]
- Pastuhova, A.Y. Evenki of the North part of Baikal Siberia in the XX Century (According to Field and Archival Data). Proc. Lab. Anc. Technol. 2004, 2. Available online: https://www.evenkiteka.ru/stellages/ethnography/evenki-severa-baykalskoy-sibiri-v-xx-veke-po-polevym-i-arkhivnym-dannym/ (accessed on 12 November 2022).
- Fondahl, G.; Parlato, N.; Filippova, V.; Savvinova, A. The Difference Place Makes: Regional Legislative Approaches to Territories of Traditional Nature Use in the Russian North. Arct. Rev. Law Politics 2021, 12, 108–133. [Google Scholar] [CrossRef]
- Zmyvalova, E. Human Rights of Indigenous Small-Numbered Peoples in Russia: Recent Developments. AR 2020, 11, 334. [Google Scholar] [CrossRef]
- Krasnoshtanova, N.E.; Kuklina, V.; Cherenev, A.A. Northern Periphery of the Irkutsk Oblast. Geogr. Res. Sib. Adjac. Territ. 2014, 1, 212–234. [Google Scholar]
- Rudykh, L.; Shilova, O. Analysis of the Socio-Economic Indicators of the Irkutsk Region, Buryatia, and the Far East in 2016-2017: Investments and Prospects. Invest. Constr. Real Estate 2018, 212, 269–275. [Google Scholar] [CrossRef]
- Buraeva, O.V. Deer Farming of Evenki of Buryatia: History and Modernity. Geoarchaeol. Ethnol. Anthropol. 2017, 21, 197–208. [Google Scholar]
- Power of Siberia. Gazprom. 2019. Available online: www.gazprom.ru/projects/power-of-siberia/ (accessed on 7 May 2022).
- Kuklina, V.; Bilichenko, I.; Bogdanov, V.; Kobylkin, D.; Petrov, A.N.; Shiklomanov, N. Informal Road Networks and Sustainability of Siberian Boreal Forest Landscapes: Case Study of the Vershina Khandy Taiga. Environ. Res. Lett. 2021, 16, 115001. [Google Scholar] [CrossRef]
- Gaynutdinova, V.S.; Boiko, A.V. Project “BAM-2”-Breakthrough of Infrastructure for Russia. Financ. Asp. Struct. Transform. Econ. 2019, 5, 45–51. [Google Scholar]
- Suter, L.; Streletskiy, D.; Shiklomanov, N. Assessment of the Cost of Climate Change Impacts on Critical Infrastructure in the Circumpolar Arctic. Polar Geogr. 2019, 42, 267–286. [Google Scholar] [CrossRef]
- Rozenstein, O.; Karnieli, A. Comparison of Methods for Land-Use Classification Incorporating Remote Sensing and GIS Inputs. Appl. Geogr. 2011, 31, 533–544. [Google Scholar] [CrossRef]
- Al-Tamimi, S.; Al-Bakri, J.T. Comparison Between Supervised and Unsupervised Classifications for Mapping Land Use/Cover in Ajloun Area. Jordan J. Agric. Sci. 2005, 1, 73–83. [Google Scholar]
- Kamusoko, C.; Aniya, M. Land Use/Cover Change and Landscape Fragmentation Analysis in the Bindura District, Zimbabwe. Land Degrad. Dev. 2007, 18, 221–233. [Google Scholar] [CrossRef]
- Bahadur K.C., K. Improving Landsat and IRS Image Classification: Evaluation of Unsupervised and Supervised Classification through Band Ratios and DEM in a Mountainous Landscape in Nepal. Remote Sens. 2009, 1, 1257–1272. [Google Scholar] [CrossRef]
- Wong, D.W.S.; Lee, J.; Lee, J. Statistical Analysis of Geographic Information with ArcView GIS and ArcGIS; Fully rev. & updated; John Wiley & Sons, Inc.: Hoboken, NJ, USA, 2005. [Google Scholar]
- Anselin, L. A Local Indicator of Multivariate Spatial Association, Extending Geary’s c. Geogr. Anal. 2019, 51, 133–150. [Google Scholar] [CrossRef]
- Kocher, S.D.; Harris, R. Forest Streams. For. Steward. 2007, 9. [Google Scholar] [CrossRef]
- Foody, G.M. Status of Land Cover Classification Accuracy Assessment. Remote Sens. Environ. 2002, 80, 185–201. [Google Scholar] [CrossRef]
- Bendavid, A. Comparison of Classification Accuracy Using Cohen’s Weighted Kappa. Expert Syst. Appl. 2008, 34, 825–832. [Google Scholar] [CrossRef]
- Kuklina, V.; Sizov, O.; Rasputina, E.; Bilichenko, I.; Krasnoshtanova, N.; Bogdanov, V.; Petrov, A.N. Fires on Ice: Emerging Permafrost Peatlands Fire Regimes in Russia’s Subarctic Taiga. Land 2022, 11, 322. [Google Scholar] [CrossRef]
- Morozova, A. Impacts of Land Cover & Land Use Change on Indigenous Communities in Siberian Taiga. Ph.D. Thesis, The George Washington University, Washington, DC, USA, 2022. [Google Scholar]
- Krasnoshtanova, N.E. Traditional Land Use Management under the Conditions of Industrial Development on the North of the Irkutsk Oblast. In Proceedings of the Materials of the Russian Scientific Conference “Geographic Research of Economic Regions of the Resource-Peripheral Type”, Chita, Russia; 2012. Available online: http://inrec.sbras.ru/files/public/1438564650.pdf (accessed on 14 November 2021).
- Bezrukov, L.A. Stages and results of the formation of a market economy. In Modern History of the Irkutsk Region: 1992–2012; Irkutsk State University: Irkutsk, Russia, 2015; Volume 1. [Google Scholar]
- Anderies, J.; Janssen, M.; Schlager, E. Institutions and the performance of coupled infrastructure systems. Int. J. Commons 2016, 10, 495. [Google Scholar] [CrossRef]
- Frischmann, B.M. Infrastructure: The Social Value of Shared Resources (Introduction). Soc. Sci. Res. Netw. 2012. Available online: https://papers.ssrn.com/abstract=2000962 (accessed on 12 November 2022).


| Change Driver | ||||
|---|---|---|---|---|
| Human | Environment | Infrastructure | ||
| Impacted SETs Framework Domain | Human | “We don’t see these people [outsiders]… There are so many of them, they have the type of equipment capable of mowing down so much in two days—the area becomes unrecognizable…” (70-year-old male Tokma resident, March 2020) | “They [extractive industries] negotiated a security agreement with us. Two hunters work in shifts: one works for a month then switches with the other. Living conditions are rough…” (55-year-old female, Magistralny, August 2021) | “You can’t leave firewood unattended there. Nothing can be left in areas that can be reached by roads. You don’t want to leave anything behind, not even dishes or a spoon. Things that are left get stolen!” (30-year-old male, Vershina Khandy, 30, August 2019) |
| Environment | “They cut down the good forest, you see. Animals are leaving. There is so much noise… The Siberian moose is almost gone now, so to say. The reindeer is gone, too. Well, there is still reindeer, but very few…” (70-year-old male, Tokma, March 2020) | “They say that Manchurian elk appeared in the forest as soon as loggers started to cut the trees. We had never had any… They say that they [Manchurian elk] are pushing them [moose] away and for some reason they are replacing the moose…” (70-year-old male, Tokma, March 2020) | “It is common to see bears walking along the road and wapitis and deer, typically crossing the roads. Black and wood grouse are often seen flying over the roads. Sometimes the wood grouse walks along the road undaunted…” (55-year-old female, Magistralny, August 2019) | |
| Infrastructure | “The road that runs along the pipe is considered administrative, and it is hard for residents to get on it. There are usually barriers with security guards along the road… It is dangerous to allow people on the service road, but there isn’t an alternative road …” (Interviews with representatives of Ust-Kut municipality, August 2019) | “The movement of the all-terrain vehicles makes it easy for the wolves to move around the area… Therefore, deer cannot inhabit here; it is either driven out by wolves or vehicles.” (40-year-old male, Magistralny, August 2021) | “They seem to be expanding the service roads by using adjacent informal roads, previously used by geologists, and now used by hunters for setting up traps. As a result, upon returning to the area, you often find a new road that is 7 times wider than before, with no hunting traps.” (50-year-old male, Tokma, March 2020) | |
| Driver | Anthropogenic | Natural | ||
|---|---|---|---|---|
| Within obshchina | Outside of obshchina | Within obshchina | Outside of obshchina | |
| Years | 1986–1997 | |||
| Changed Area % | 0.6 | 1.7 | 32.8 | 18.1 |
| Years | 1997–2010 | |||
| Changed Area % | 3.6 | 5.7 | 42.8 | 22.6 |
| Years | 2010–2019 | |||
| Changed Area % | 2.6 | 4.0 | 50.6 | 18.72 |
Disclaimer/Publisher’s Note: The statements, opinions and data contained in all publications are solely those of the individual author(s) and contributor(s) and not of MDPI and/or the editor(s). MDPI and/or the editor(s) disclaim responsibility for any injury to people or property resulting from any ideas, methods, instructions or products referred to in the content. |
© 2023 by the authors. Licensee MDPI, Basel, Switzerland. This article is an open access article distributed under the terms and conditions of the Creative Commons Attribution (CC BY) license (https://creativecommons.org/licenses/by/4.0/).
Share and Cite
Morozova, A.O.; Nyland, K.E.; Kuklina, V.V. Taiga Landscape Degradation Evidenced by Indigenous Observations and Remote Sensing. Sustainability 2023, 15, 1751. https://doi.org/10.3390/su15031751
Morozova AO, Nyland KE, Kuklina VV. Taiga Landscape Degradation Evidenced by Indigenous Observations and Remote Sensing. Sustainability. 2023; 15(3):1751. https://doi.org/10.3390/su15031751
Chicago/Turabian StyleMorozova, Arina O., Kelsey E. Nyland, and Vera V. Kuklina. 2023. "Taiga Landscape Degradation Evidenced by Indigenous Observations and Remote Sensing" Sustainability 15, no. 3: 1751. https://doi.org/10.3390/su15031751
APA StyleMorozova, A. O., Nyland, K. E., & Kuklina, V. V. (2023). Taiga Landscape Degradation Evidenced by Indigenous Observations and Remote Sensing. Sustainability, 15(3), 1751. https://doi.org/10.3390/su15031751