1. Introduction
In 2006, China became one of the largest CO
2 emission countries in the world, contributing 14.3% of the sum of the world’s CO
2 emission. In 2020, CO
2 emission reached 10.1 × 10
9 t [
1], an increase of 382.63% compared with 1990, and accounted for about 29% of the total global CO
2 emission. In 2020, China proposed to increase the country’s autonomous contribution, and strive for CO
2 emission to peak by 2030, and achieve carbon neutrality by 2060 [
2]. The Air Pollution Prevention Action Plan (“Ten Air Regulations”) in 2013 and the Three-Year Action Plan for Winning the Battle of Defending the Blue Sky (“Blue Sky Defense War”) in 2018 were released and implemented, and China’s air quality has been significantly improved. In order to realize synergies between energy saving, carbon reduction, and pollution reduction, and sustained improvement in ecological and environmental quality, and to ensure the completion of the energy saving and emission reduction targets of the 14th Five-Year Plan, the State Council issued the “Comprehensive Work Program for Energy Saving and Emission Reduction of the 14th Five-Year Plan” and the “New Pollutant Management Action Program” in 2022, but 37.2% of the 339 cities at the prefecture level or above still exceeded the ambient air quality standards (GB 3095-2012) in 2022. As the main sources of greenhouse gas (GHG) and air pollutants are fossil energy consumption, industrial production, and residential life, with the characteristics of “the same root, the same source, and the same process”, which means that carbon reduction and pollution reduction have the same control targets and can be synergistically promoted [
3,
4,
5].
Most foreign scholars use models to simulate the synergistic emission reduction in GHGs and air pollutants. The models used mainly include the Air Pollution Emission Experiments and Policy Analysis Model (APEEP), GHGs, Regulated Emissions, Energy Use in Transportation (GREET), and Computable General Equilibrium (CGE) [
6]. Muller [
7] used the APEEP and GREET model for simulation to monetize the consideration of damages caused by pollutants associated with CO
2, and the results show that different forms of energy in the electricity generating sector have different costs of environmental pollution. Schwanitz et al. [
8] synthesized eleven equilibrium models and conducted a scenario analysis of low-carbon energy policies in the European region. The findings demonstrate that low-carbon policies can help decrease energy dependence, boost energy security, and encourage the development of renewable energy sources other than biomass.
Most of the existing studies in China have focused on the assessment of the synergistic effect of engineering and technological emission reduction measures in a city or an industry, and have focused on the synergistic effect brought about by pollution control policies [
9]. By creating a synergistic emission reduction equivalence index, Liu et al. [
10] assessed the comprehensive emission reduction effect of individual technical measures on the major air pollutants (CO
2, SO
2, and NO
x) and came to the conclusion that the NO
x emission reduction target in China’s iron and steel industry can only be attained by front-end and process control measures, while CO
2 and SO
2 emission reduction may be realized by implementing end treatment measures with higher costs. Zhou et al. [
11] used the energy–environment–economy input–output method to calculate China’s energy–environmental complete consumption coefficient in 2007, based on which they analyzed the changes in emissions of CO
2, SO
2, and NO
x and the degree of synergistic emission reduction in the thermal power industry after adopting a variety of abatement measures, and the results showed that optimizing the energy structure and the coal-fired power generation structure are the fundamental measures to reduce air pollutants in the thermal power industry. To assess the synergistic control effect of technical emission reduction measures on CO
2, SO
2, and NO
x in the thermal power industry, Mao et al. [
12] used the synergistic control effect coordinate system, cross elasticity analysis of pollutant emission reduction, and unit pollutant emission reduction cost. The results showed that the end-of-pipe control measures are not synergistic, while the front-end control measures and the process control measures have a better synergistic effect. In addition, the priority of end-of-pipe control measures is ranked later. The results show that the end-of-pipe measures are not synergistic, while the front-end control measures and process control measures have better synergistic effects.
Socio-economic indicators are closely related to GHG and air pollutant emission, with factors like population growth and economic development influencing emission levels, while emission reduction measures and sustainable development policies help to protect the environment while enhancing economic efficiency. Common socio-economic indicators include the gross domestic product (GDP), GDP per capita, per capita income, population size, population growth rate, carbon emission, pollutant emission, and natural resource consumption. Zhang et al. [
13] analyzed the relationship between air quality and per capita GDP over 13 years by taking 64 cities under key environmental protection in China as samples, and the study showed that the economic development of these cities is based on environmental pollution, and found that PM
10 is the main pollutant affecting urban air quality from it. Li et al. [
14] explored the GHG emissions from urban domestic waste treatment and disposal in China and its socio-economic factors by constructing the STIRPAT model, and the study showed that the urban population and the per capita GDP had a positive impact on the GHG emissions from urban domestic waste. Li et al. [
15] explored the factors affecting Beijing’s air quality by constructing a multivariate nonlinear econometric model and adopting a principal component analysis and found that the relationship between GDP per capita and air quality indicators is an inverted “N” curve, i.e., when the relationship is in the downward part of the inverted “N” curve, air quality decreases with the growth of GDP per capita, and on the contrary, when the relationship is in the upward part of the inverted “N” curve, air quality increases with the growth of GDP per capita. Wu et al. [
16] explored the relationship between economic growth and air pollution using the Spatial Durbin Lag Model and a Semiparametric Spatial Lag Model, and their findings demonstrated a nonlinear association resembling an oscillatory curve, suggesting that economic growth impacts air quality to some extent. Wang et al. [
17] analyzed panel data covering all Chinese provinces from 2000 to 2016, and they employed both a Dynamic Panel Data Model and a Panel Threshold Model to examine the influence of energy consumption structure and other factors on air pollution, and the results indicated that energy consumption structure contributes to air pollution in China’s eastern, central, and western regions. Firtescu et al. [
18] empirically assessed, from 1995 to 2019, 28 countries in Europe and their effect of environmental tax levels on GHG emissions, and the results showed that in most countries, the increase in environmental taxes leads to a decrease in GHG emissions.
Along with aims relating to the reduction in pollutant emission, China includes targets related to the drop in carbon emission per unit of GDP (carbon intensity) during the 12th Five-Year Plan period in the binding targets of the 5-year plan outline. The People’s Republic of China planned to “implement synergistic control of GHG and air pollution, such as particulate matter, SO
2, NO
X, volatile organic compounds, ammonia and other air pollutants and GHGs” in its Law on the Prevention and Control of Air Pollution in 2015. In 2016, it was suggested to “strengthen the synergistic control of carbon emission and air pollutant emission” in the “13th Five-Year Plan” for the control of GHG emissions. In 2021, the “Guiding Opinions on Coordinating and Strengthening the Work Related to Climate Change and Ecological Environment Protection” emphasized the coordinated control of GHG and pollutant emissions as the key work, and clarified the tasks from five major areas, marking the stage of carbon reduction and pollution reduction from “weak correlation” to “strong combination”. Hebei Province ranks among China’s provinces with the highest energy consumption intensity and the most severe air pollution. The carbon emission of Hebei Province in 2019 totaled 914 × 10
6 t, roughly accounting for 8.02% of the nation’s overall carbon emission [
19,
20]. Among the bottom 10 cities in the air quality ranking of 168 key cities in China in 2022, there were 4 cities belonging to Hebei Province (Baoding, Handan, Shijiazhuang, and Xingtai). The number of mildly polluted or worse days in Hebei province in 2022 with ambient air quality that was remained 95, making up 26.02% of the total number of days in the year. Therefore, research on the synergistic emission reduction effect of GHGs and air pollutants in Hebei Province is of great scientific significance and practical value, which is also one of the effective ways to cope with climate change [
21].
In this study, the emission factor method was used to calculate and analyze the emissions of GHGs and air pollutants in Hebei Province from 2011 to 2020. Seven socio-economic indicators of Hebei Province directly related to GHGs and air pollutant emissions were selected to analyze the trend during the study period. The Tapio decoupling model was used to study the relationship between economic growth and GHG emissions. The Spearman rank correlation coefficient method was applied to analyze the correlation between GHG and air pollutant emission. Finally, the synergistic control effect coordinate system and the cross-elasticity coefficient of emission reduction were used to quantitatively measure and compare the synergistic emission reduction effect of GHGs and air pollutants.
3. Results and Analysis
3.1. Analysis of Changes in GHG Emissions
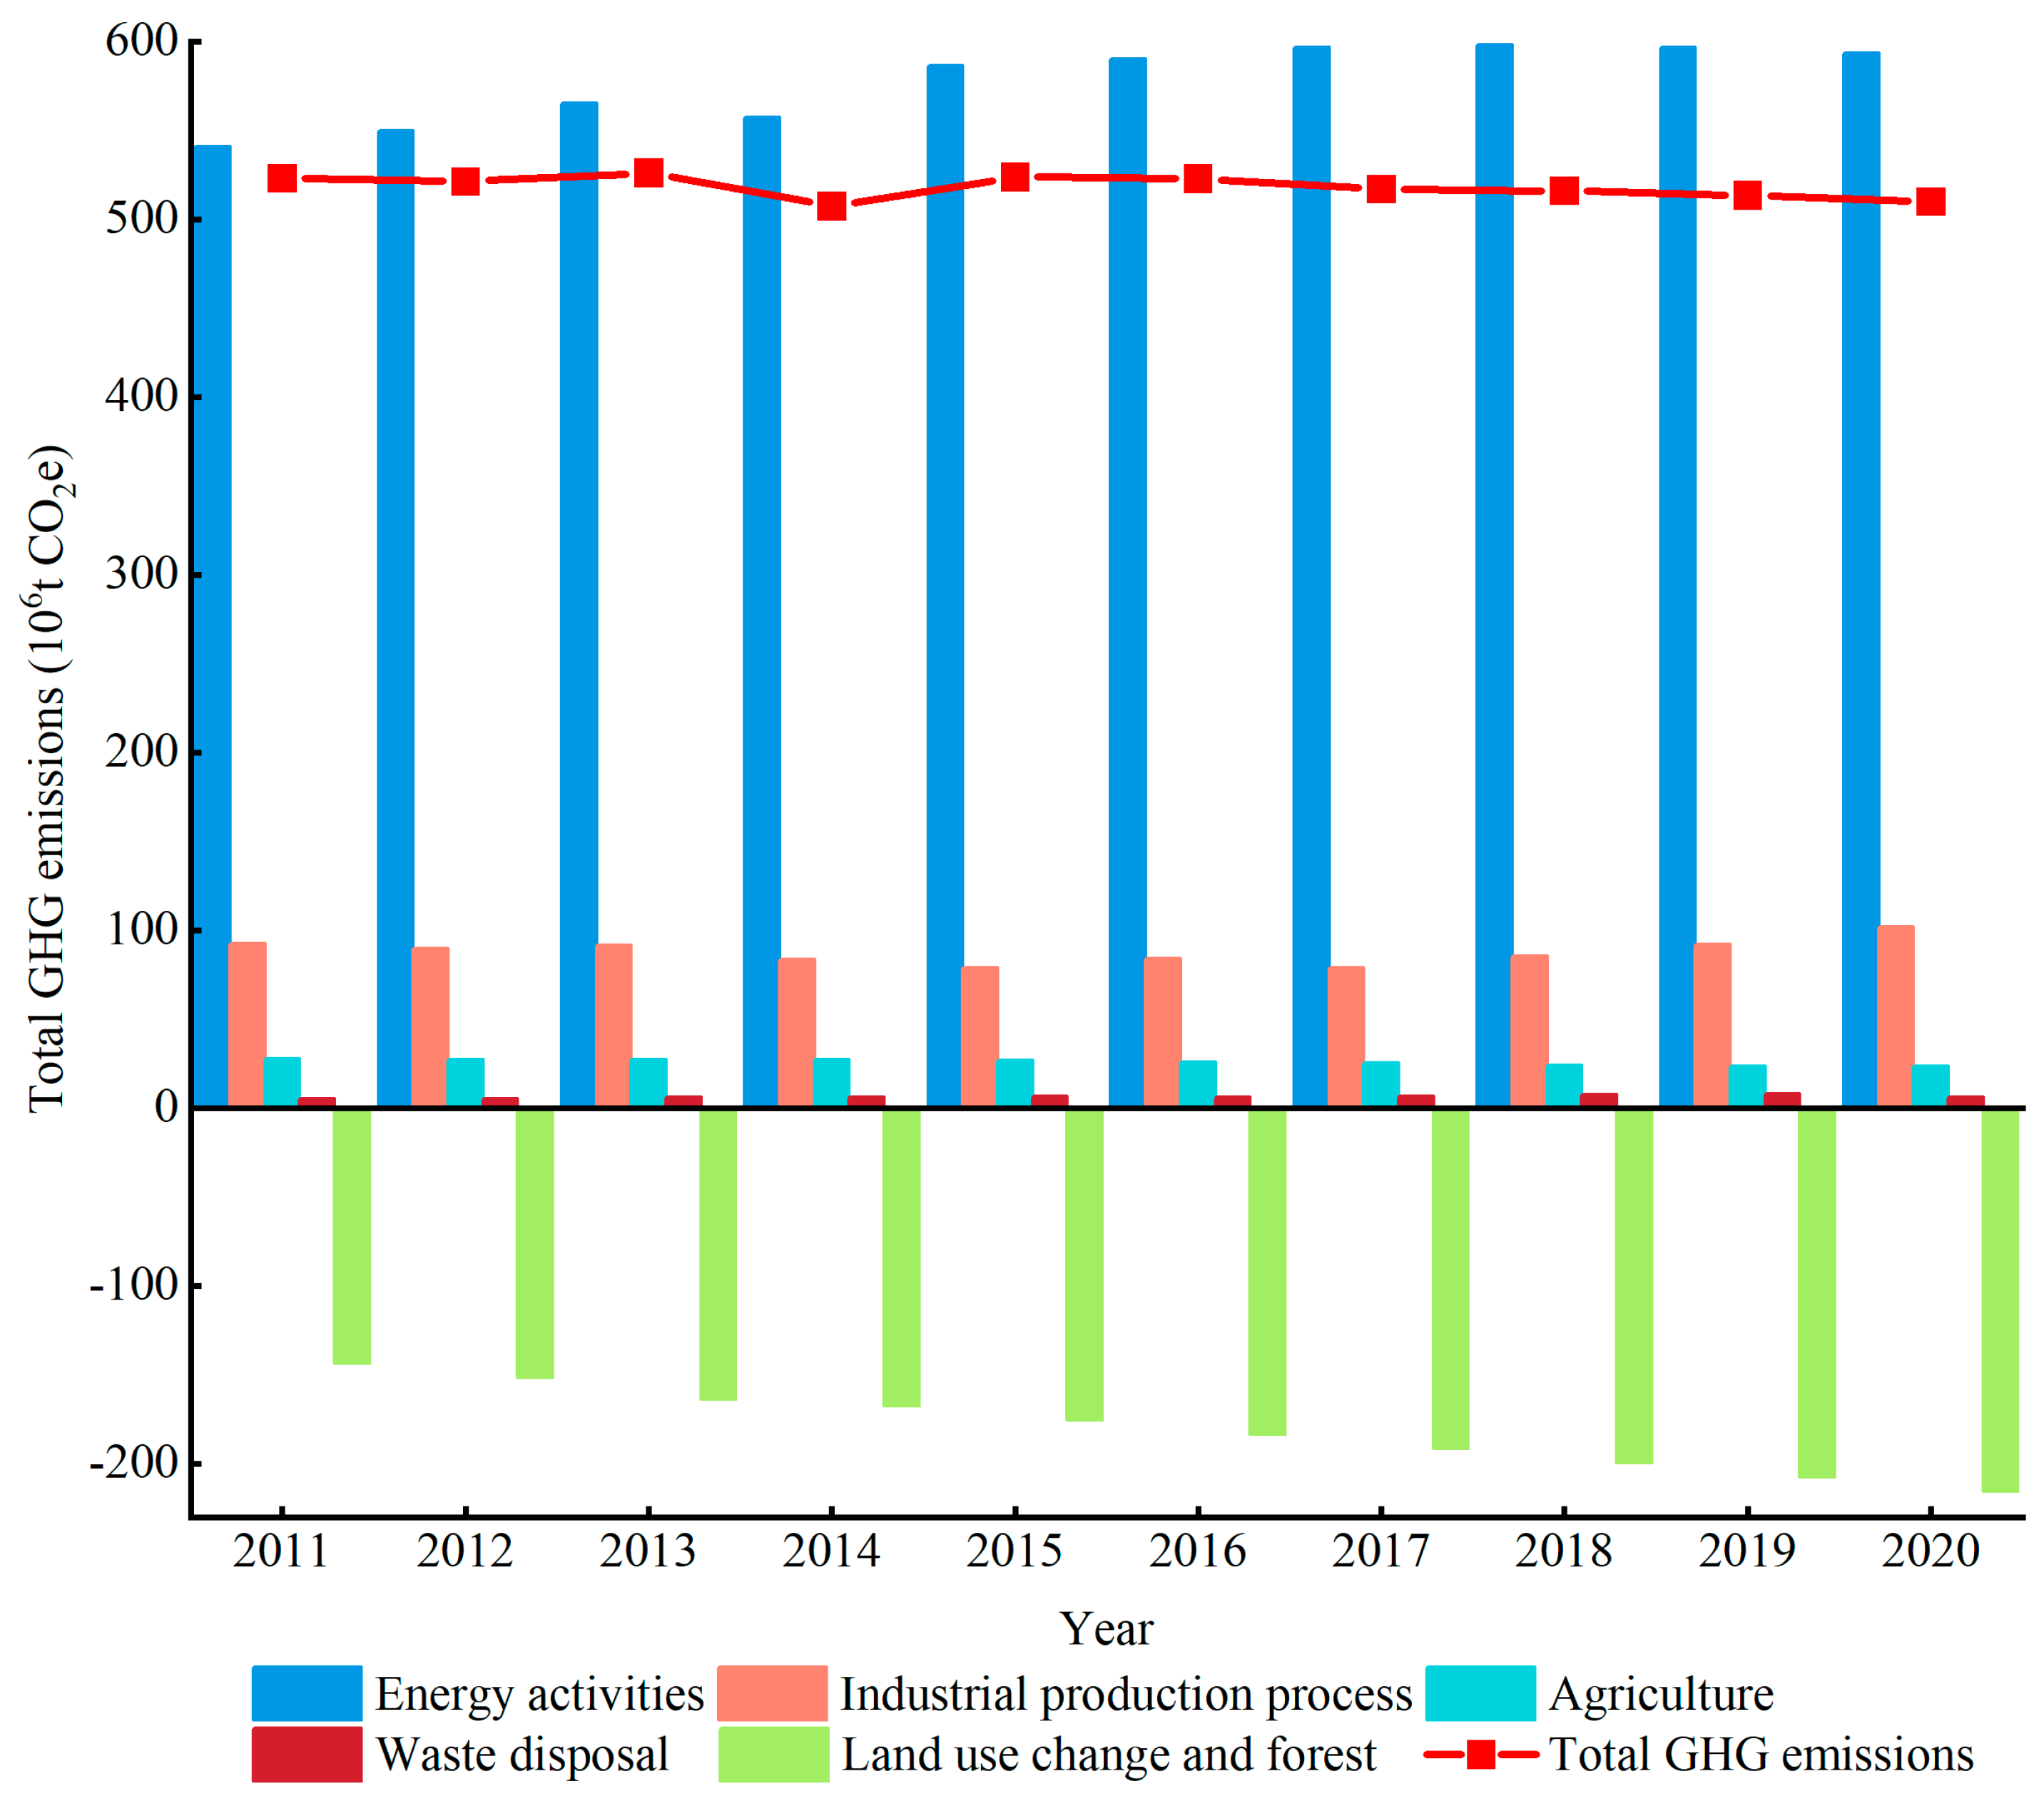
Figure 1 displays the overall amount of GHG emissions in Hebei Province from 2011 to 2020 as well as the emission of each component. Overall, the total amount of GHG emissions from 2011 to 2015 fluctuated slightly, reaching a peak of 526 × 10
6 t CO
2e in 2013. Since 2015, it has shown a slow downward trend and fell to 510 × 10
6 t CO
2e in 2020. This is mainly due to the “13th Five-Year Plan” period, Hebei Province has vigorously adjusted its industrial structure, optimized its energy structure, strengthened energy conservation and consumption reduction, and increased forestry carbon sinks to effectively control GHG emissions.
From the perspective of emission sources, the GHG emissions from energy activities in Hebei Province from 2011 to 2020 are 541 × 106~598 × 106 t CO2e, accounting for about 103.42~116.35% of the total GHG emissions, which is far more than other emission sources and is the primary source of emissions of GHGs. From 2011 to 2020, the GHG emissions from energy activities showed an overall upward trend. This is related to the rapid economic development and increasing energy consumption in Hebei Province since the 18th National Congress of the Communist Party of China. The total energy consumption of the whole society increased from 281 × 106 tce (ton of standard coal equivalent, referred to as tce) in 2011 to 328 × 106 tce in 2020, an increase of 16.77%, with 1.68% yearly growth on average. With the gradual implementation of policies such as air pollution control, removal of outdated production capabilities, and coal reduction and substitution in 2013, energy conservation and emission reduction have been further promoted, and energy consumption has continued to operate at a low level. In 2014, GHG emissions from energy activities decreased. From 2015 to 2020, its emissions increased but the growth rate was slow. This is because, since 2015, Hebei Province has combined energy conservation, coal cutting, and pollution reduction with structural adjustment, pollution control, and benefiting people’s livelihood; vigorously promoted the thorough handling of air pollution; and implemented dual control of total energy consumption and intensity, and energy consumption has been effectively controlled.
After energy-related activities, the second biggest source of GHG emissions is industrial production process, which accounting for 15.09~19.98%. GHG emissions experienced fluctuations from 2011 to 2020, closely related to the production of industrial products, particularly steel and cement. Influenced by the global economic crisis in 2008, China initiated an investment of CNY 4 trillion in infrastructure development, which significantly accelerated the growth of the iron and steel sector in Hebei Province. By the end of 2012, the crude steel production in Hebei Province accounted for 25.18% of the total national output. Since 2013, the state has increased efforts to eliminate backward production capacity, which has contributed to the decline in steel production in Hebei Province to a certain extent. As of 2015, the proportion of crude steel production in Hebei Province has dropped to 23.42%. Hebei Province has accelerated the adjustment and optimization of the industrial structure and has continued to push the reduction in production capacity after the production of crude steel in the province removed a certain amount of production capacity. The ability to produce steel was decreased by 8.21 × 10⁷ t during the “13th Five-Year Plan” period, and it fell down from a peak of 3.20 × 10⁸ t to less than 2 × 10⁸ t. Cement production is an industry with high emission and energy usage. Under the influence of environmental protection pressure and production restriction policy in Hebei Province, cement production decreased from a peak of 1.41 × 10⁸ t in 2011 to 1.17 × 10⁸ t in 2020, a decrease of 21.06%.
The GHG emissions from agriculture and waste treatment accounted for a relatively low proportion, representing 4.63~5.44% and 1.02~1.59% of the overall emissions of GHGs, respectively. The highest GHG emissions from agriculture in Hebei Province in 2011 were 2.77 × 10⁷ t CO2e, and the lowest in 2019 were 2.36 × 10⁷ t CO2e, showing a downward trend year by year. The GHG emissions from waste treatment increased from 5.33 × 10⁶ t CO2e in 2011 to 6.35 × 10⁶ t CO2e in 2020 due to the increase in population and consumption.
The amount of GHGs absorbed via land use change and forestry increased from 143 × 106 t CO2e in 2011 to 215 × 106 t CO2e in 2020, with a 5.01 percent yearly growth rate on average, which is closely related to the forestry development policy in Hebei Province. In 2011, Hebei Province issued the “12th Five-Year Plan for Forestry Development in Hebei Province” to strengthen forest scientific management, combine forestry construction with farmers’ poverty alleviation and prosperity, and create a strong atmosphere for accelerating forestry development. At the same time, the implementation of key forestry ecological projects such as Taihang Mountain greening, Beijing-Tianjin-Hebei sandstorm source control, Three North Shelterbelt, Grain for Green, Coastal Shelterbelt, etc., has effectively alleviated the trend of ecological deterioration in some areas.
3.2. Analysis of Changes in Air Pollutant Emissions
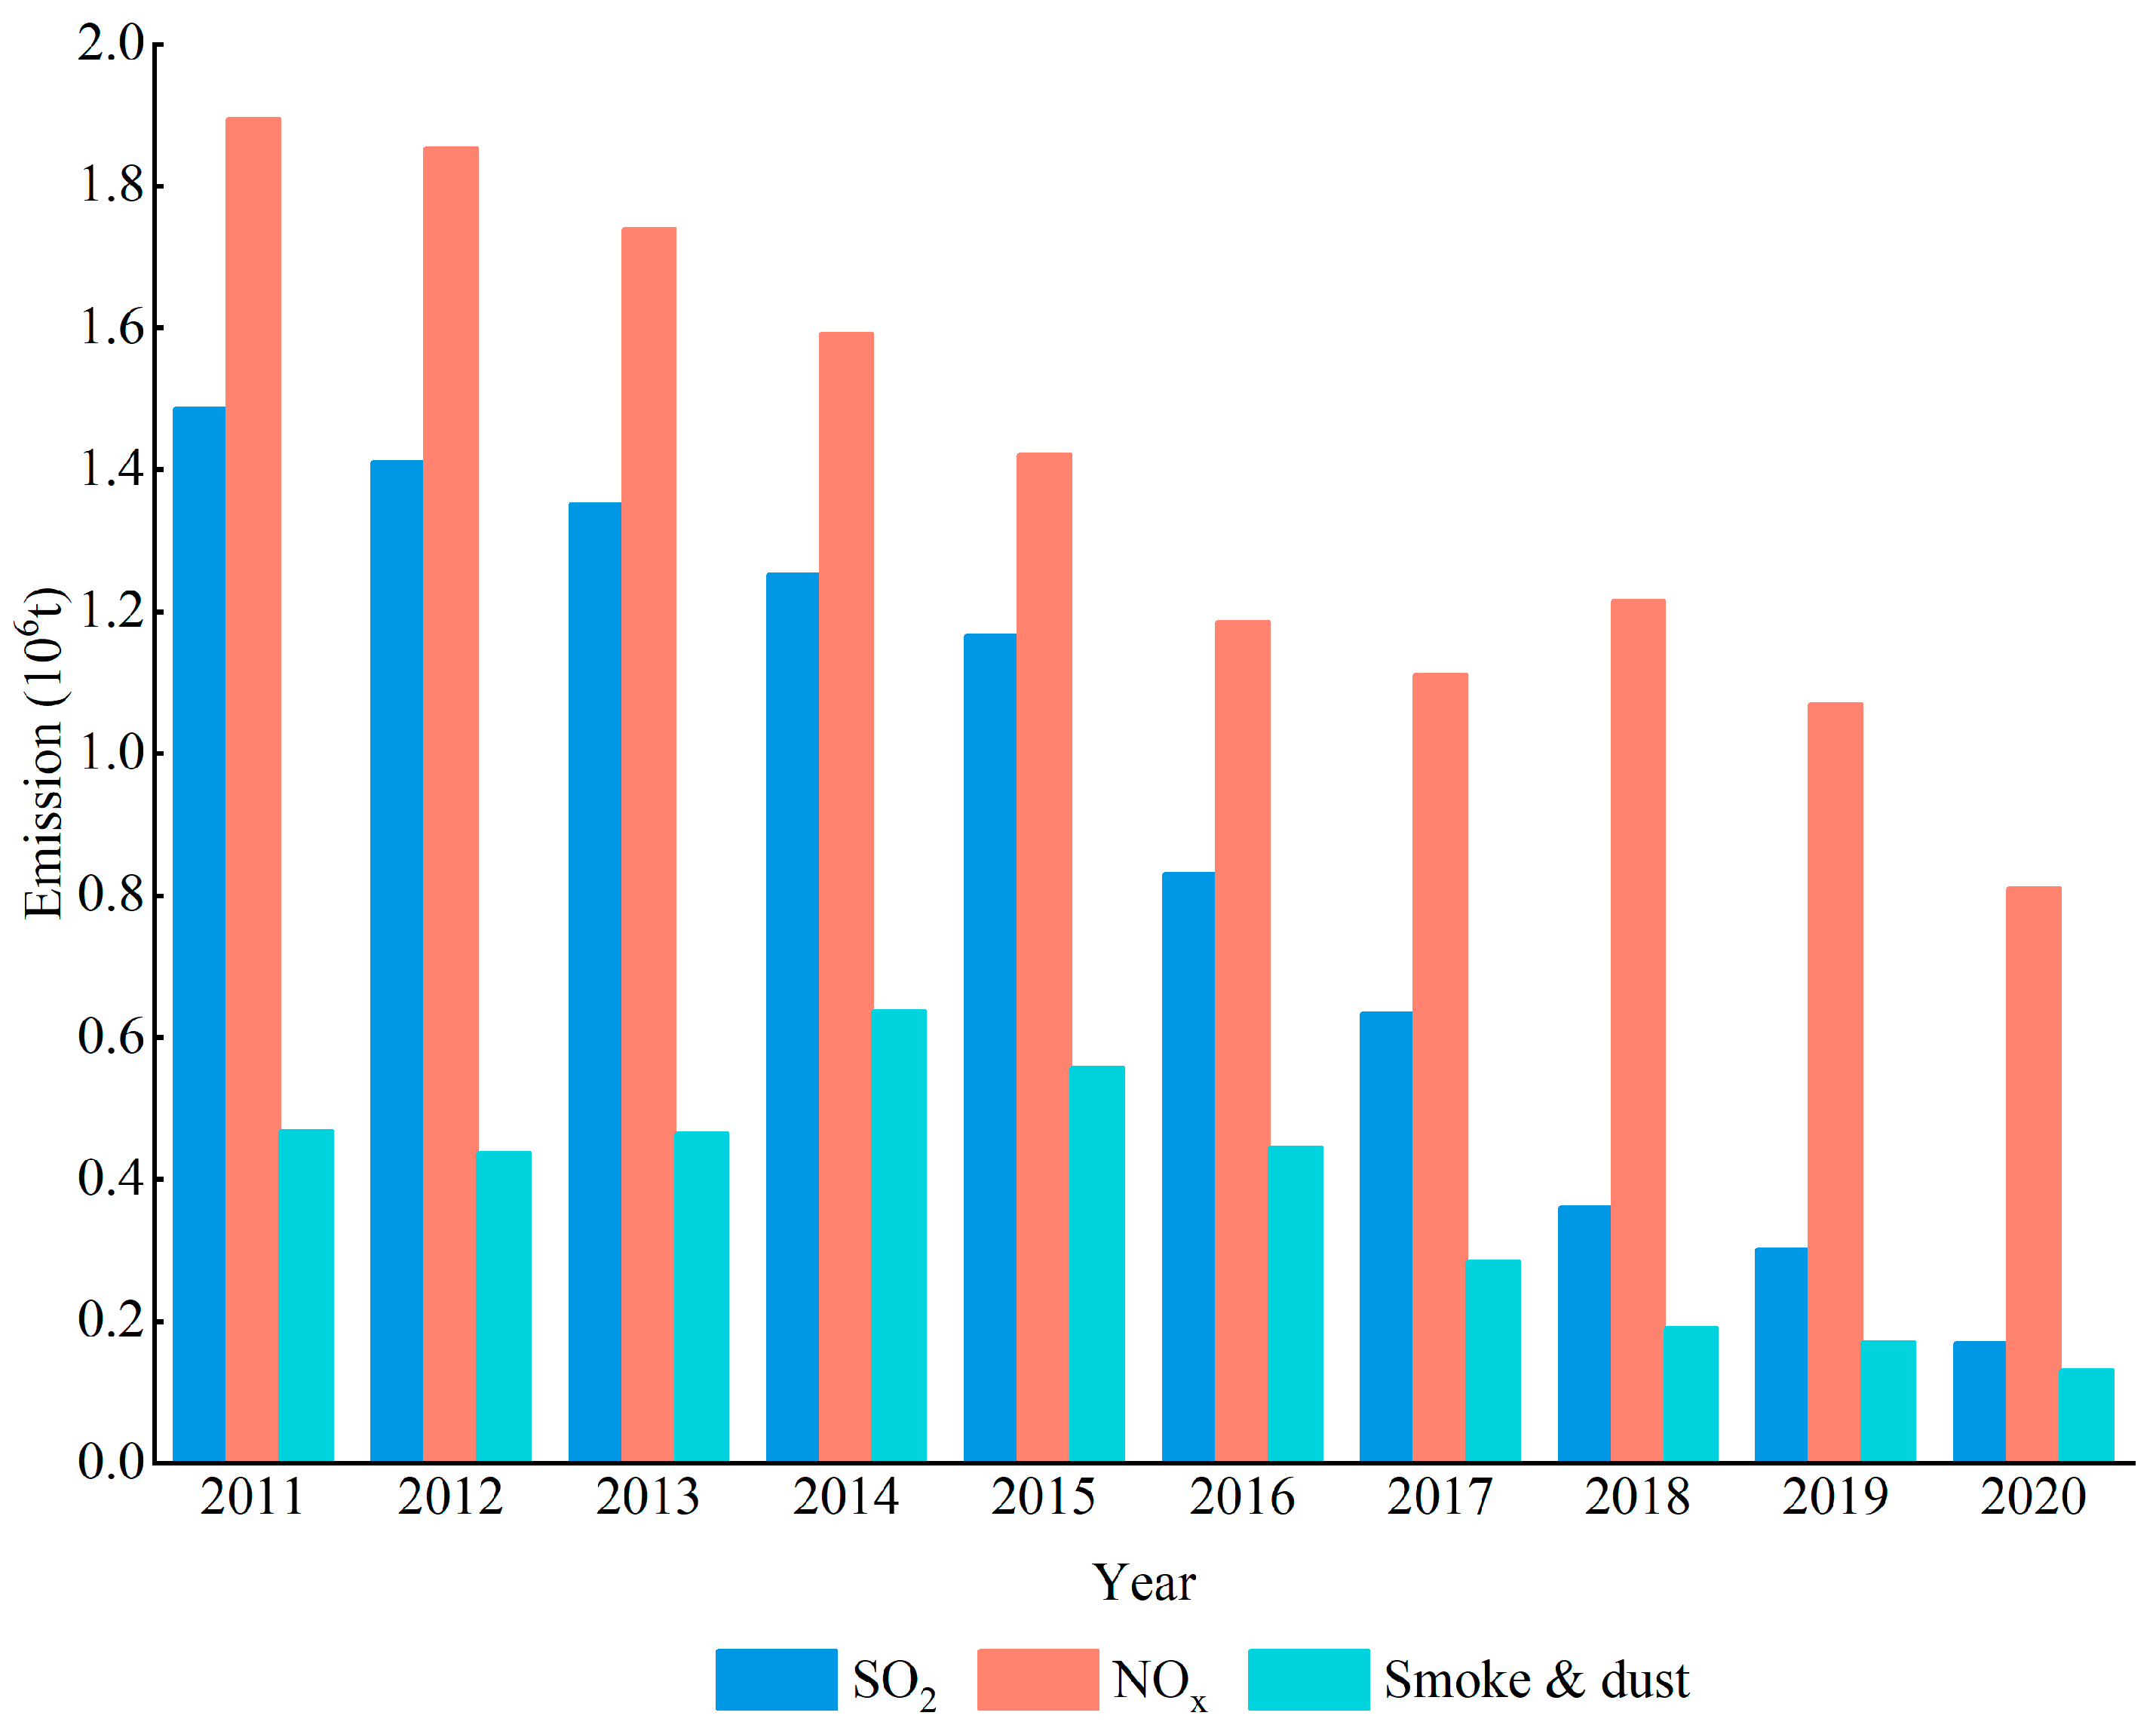
The emissions of three types of air pollutants (SO
2, NO
X, and smoke & dust) in Hebei Province from 2011 to 2020 are shown in
Figure 2. It is evident that Hebei Province’s air pollution emissions from 2011 to 2020 typically followed a declining trend: SO
2 emission decreased year by year, from 1.48 × 10
6 t in 2011 to 0.17 × 10
6 t in 2020, with a decrease of 88.55%. NO
X decreased from 1.90 × 10
6 t in 2011 to 0.81 × 10
6 t in 2020, with a decrease of 57.27%. The amount of smoke & dust decreased from 0.47 × 10
6 t in 2011 to 0.13 × 10
6 t in 2020, a decrease of 71.97%. The results obtained are closely related to the air pollution control policy of Hebei Province. Beijing, Tianjin, and Hebei are three provinces and cities that are considered vital locations according to China’s “Ten Air Regulations”, which were published in 2013. The Beijing–Tianjin–Hebei region and the neighboring territories (referred to as “2 + 26” cities) were designated as critical locations in both the “2017 Air Pollution Prevention and Control Work Plan for Beijing-Tianjin-Hebei region and neighbouring territories” and the “Blue Sky Defense War”. With the advancement of the process of air pollution control, the scope of key areas is constantly optimized and adjusted, reflecting the scientific and accurate improvement in air pollution control in China. In addition, Beijing–Tianjin–Hebei and the surrounding regions keep pushing for changes to the energy, transportation, and industrial structures in order to reduce air pollution emission; this is carried out in terms of governance measures. Along with reducing the negative effects of heavy pollution weather, it has also continued to carry out regional joint prevention and control, regularly organized air pollution tackling actions in the autumn and winter, and implemented special projects on the causes and treatment of heavy air pollution. These actions have provided strong scientific and technological support for accurate pollution control in the future.
3.3. Analysis of Socio-Economic Indicators
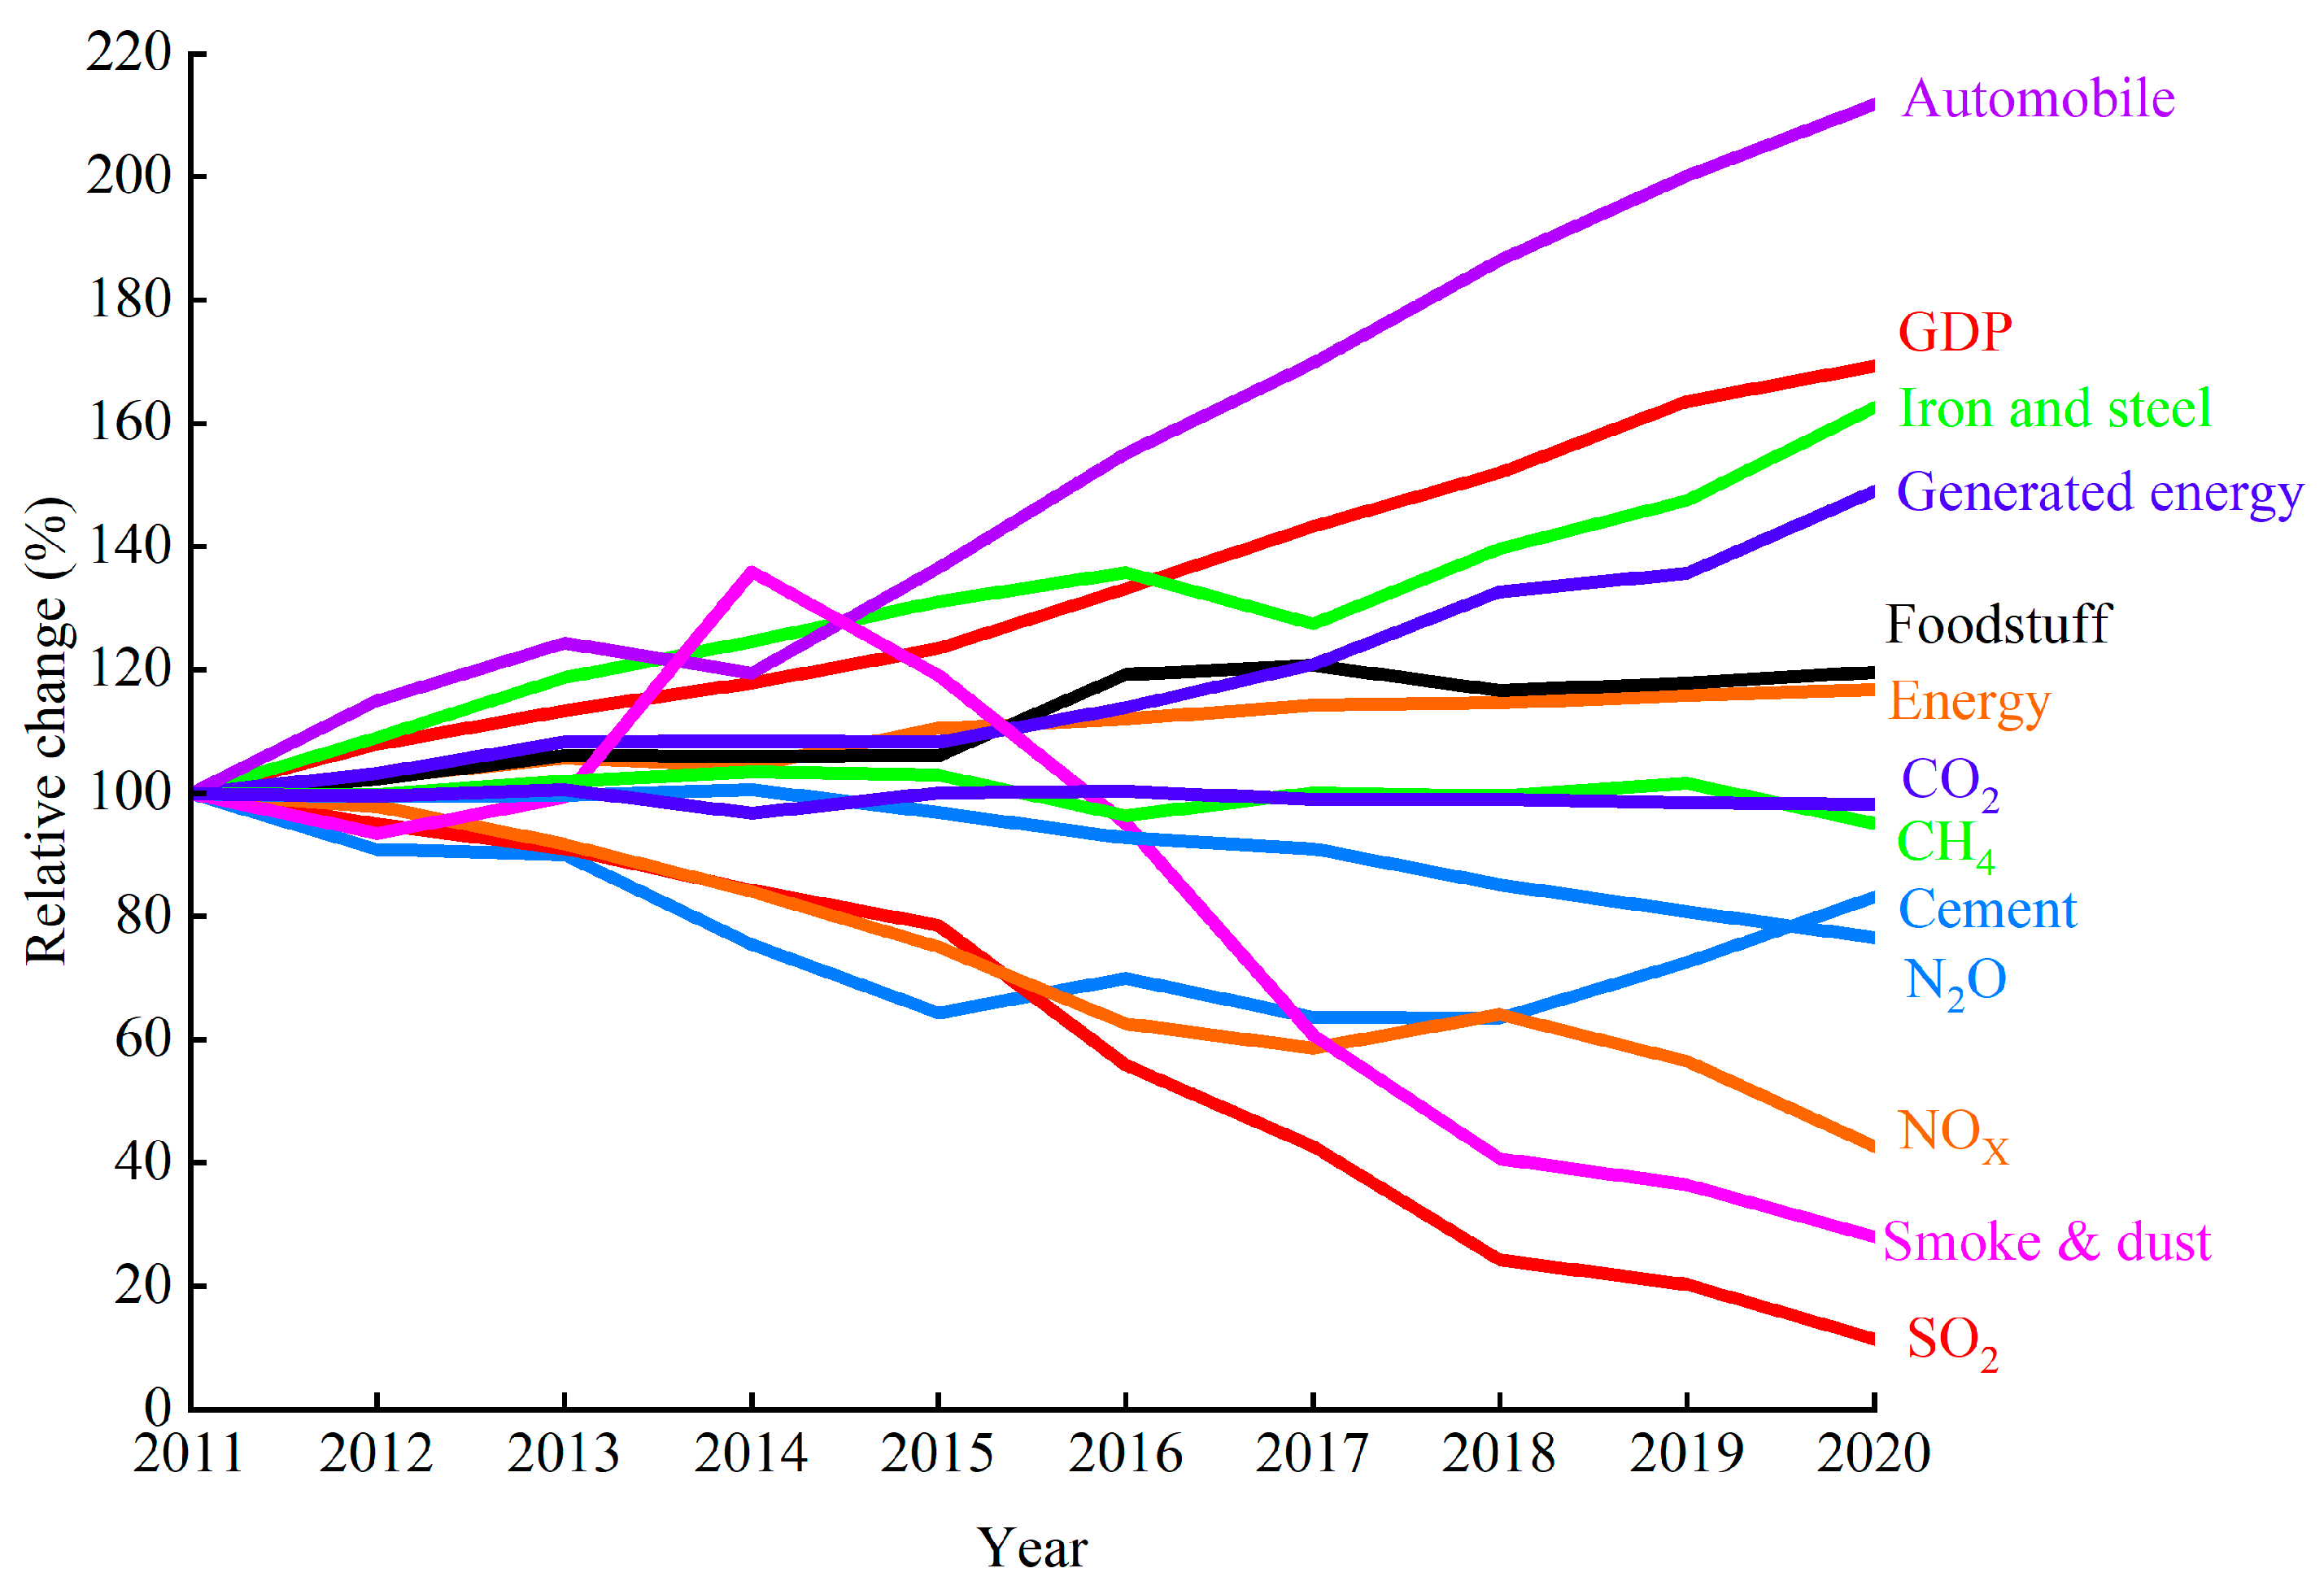
The trend of national economic and social development indicators in Hebei Province from 2011 to 2020 is shown in
Figure 3. GDP and energy consumption affect almost all major GHG and air pollutant emissions [
35]. Steel and cement are typical industrial products in Hebei Province. The output of steel and cement in 2021 ranks 1st and 11th in the country, respectively [
26], which has a greater impact on GHG and air pollutant emissions [
36,
37,
38]. There is a strong correlation between grain output and agricultural sources [
39]. Power generation is closely related to power sources [
40]. Compared with 2011, the GDP, energy consumption, steel production, cement production, car ownership, grain production, and power generation of Hebei Province in 2020 increased by 169.31%, 116.77%, 162.63%, 83.14%, 211.78%, 119.65%, and 149.04%, respectively.
Through the comparison of pollutant emissions and economic trends, it can be seen that Hebei Province has achieved effective reductions in major GHG and air pollutant emissions while maintaining stable and sustainable socio-economic development from 2011 to 2020. Although some measures are used to control emissions, such as banning the operation of “scattered” enterprises and eliminating old vehicles in advance, which may lead to certain economic losses and additional financial expenses, the former can promote the reform of high-energy-consuming and high-emission enterprises and promote the upgrading of traditional industries. The latter is expected to release the demand for new car sales and promote the growth of the automobile industry. Since the 18th National Congress of the Communist Party of China, China has eliminated more than 20 million yellow-labeled vehicles and old vehicles, which has promoted new vehicle sales to reach CNY 3.5 trillion. Air pollution control is organically combined with the optimization of industrial, energy, and transportation structures, which not only helps to continuously reduce GHG and air pollutant emissions, but also meets the needs of high-quality economic development [
41].
3.4. Decoupling Elasticity Analysis of GHG Emissions in Hebei Province
The results of the decoupling model between the change in GHG emissions and economic development in Hebei Province from 2012 to 2020 are shown in
Table 3. It can be seen that from 2012 to 2020, the relationship between GHG emissions and economic growth in Hebei Province was in a weak decoupling state in 2013 and 2015, and the remaining years were in a strong decoupling state. It shows that the GHG emission rate of Hebei Province is negative, and the economic growth rate is positive. There is a negative correlation between GHG emissions and economic growth in Hebei Province. It is an ideal state that GHG emissions in Hebei Province are declining while economic growth is rising. This is related to the fact that Hebei Province has gradually attached importance to environmental protection and vigorously advocated for a low-carbon economy since 2011. For example, Hebei Province vigorously promotes industrial green upgrading, focusing on steel, petrochemical, chemical, and building material industries, and vigorously implements industrial energy-saving and low-carbon transformation, which not only improves energy efficiency but also reduces the waste of fossil fuels. In addition, there is the full implementation of cleaner production, accelerating the green development of agriculture and other ways to gradually achieve the development of low-carbon economy.
3.5. Rank Correlation Analysis of GHGs and Air Pollutants
In order to understand the correlation between GHG and air pollutant emissions, the rank correlation analysis of GHGs (CO
2, CH
4, and NO
2) and air pollutant (SO
2, NO
X, and smoke & dust) emissions in Hebei Province from 2011 to 2020 was carried out.
Table 3 presents the findings. As
Table 4 illustrates, all Sig. (two-tailed) values are less than 0.05 at the significance level of 0.05, which suggests that these correlation coefficients are statistically significant. The Spearman rank correlation coefficients of SO
2 with NO
X and NO
2 were 1.000 and 0.915, respectively (
p < 0.01), indicating that there was a high positive correlation between SO
2 and NO
X and NO
2. The Spearman rank correlation coefficient between NO
X and NO
2 was 0.915 (
p < 0.01), indicating that there was a high positive correlation between NO
X and NO
2. In addition, the Spearman rank correlation coefficient between smoke & dust and NO
2 was 0.903 (
p < 0.01), indicating that there was a high positive correlation between smoke & dust and NO
2, and the correlation between other variables was not significant. In general, these correlation coefficients indicate that there is a certain degree of correlation between different pollutant indicators.
3.6. Cross-Elasticity Analysis of Synergy Degree and Emission Reduction
3.6.1. Synergy Analysis
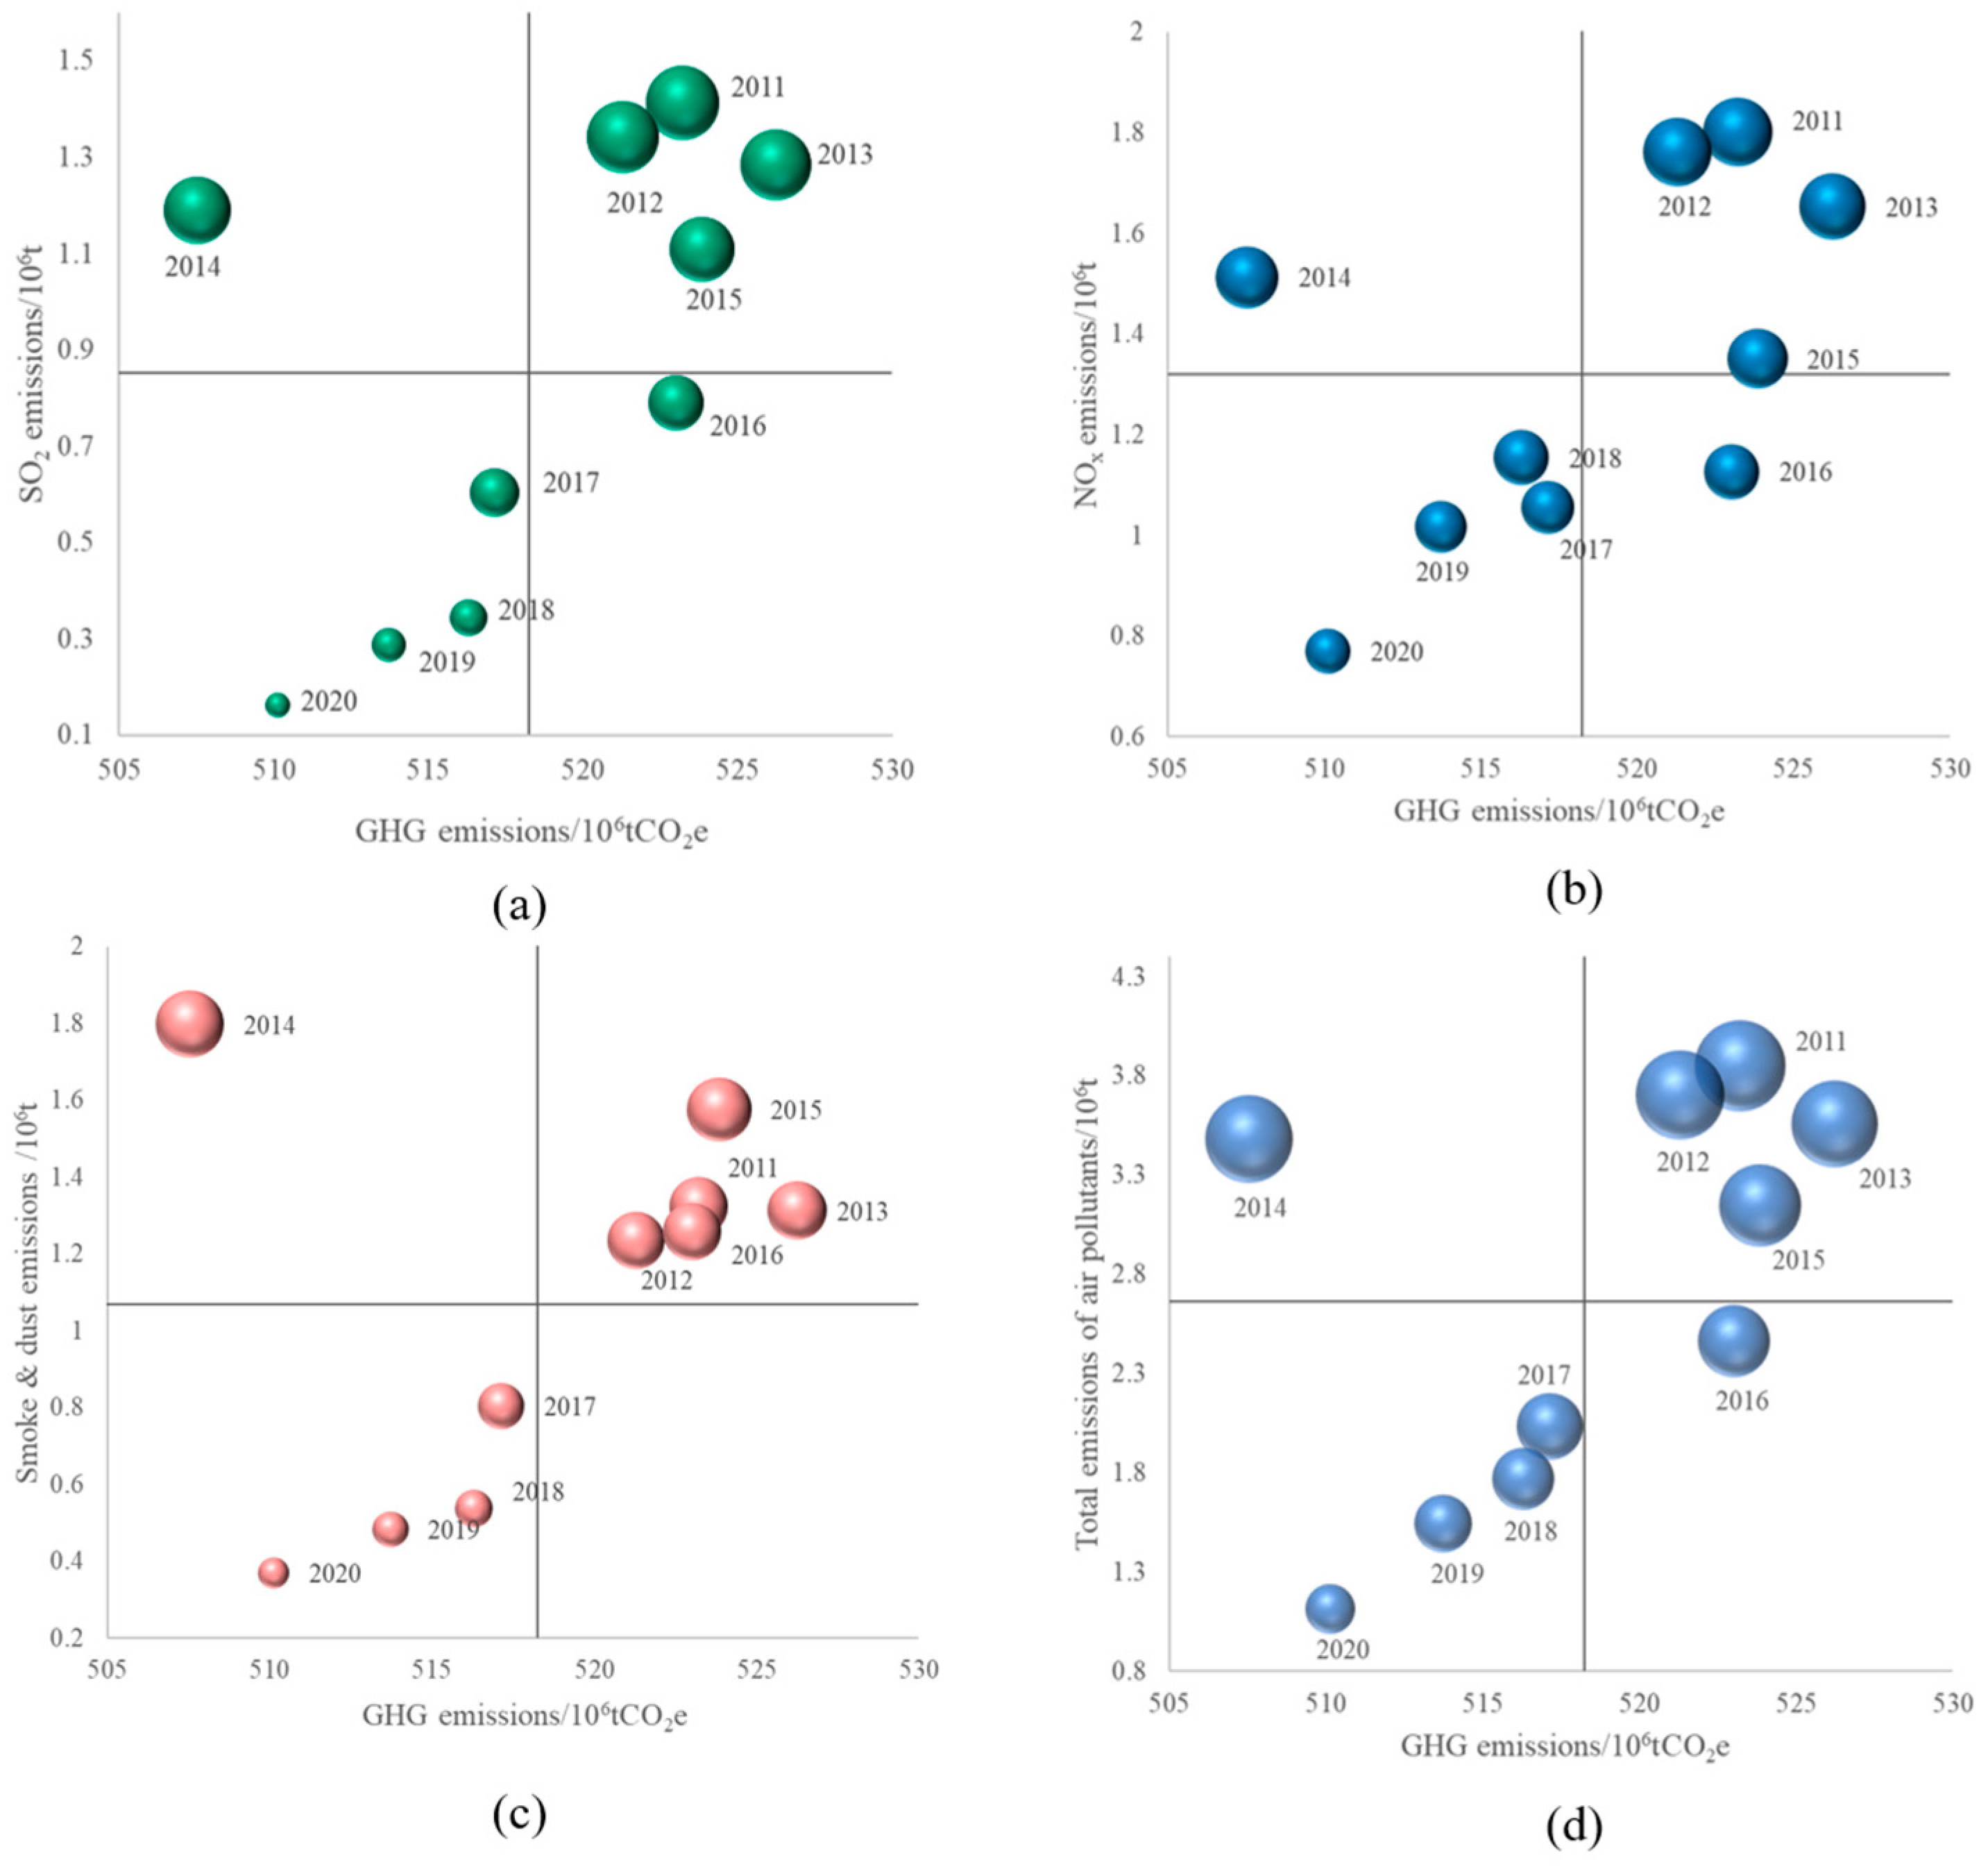
Because the emissions of GHG and air pollutant are positive, all the points fall in the first quadrant, so the first quadrant is selected as the research object. By observing the four-quadrant diagram of the total amount of GHG emissions in Hebei Province from 2011 to 2020 with the emissions of SO
2, NO
x, smoke & dust and the total amount of air pollutants (
Figure 4a–d), we can intuitively see the emission synergy of their emissions in different years. In 2011~2012, 2013~2014, and 2015~2020, all the emissions of GHG, SO
2, NO
X, smoke & dust, and air pollutants decreased, with good emission synergy. In addition, the emissions of smoke & dust and GHG in 2012~2013 were rising, indicating that the synergistic effect of smoke & dust and GHG emissions is better than SO
2 and NO
x.
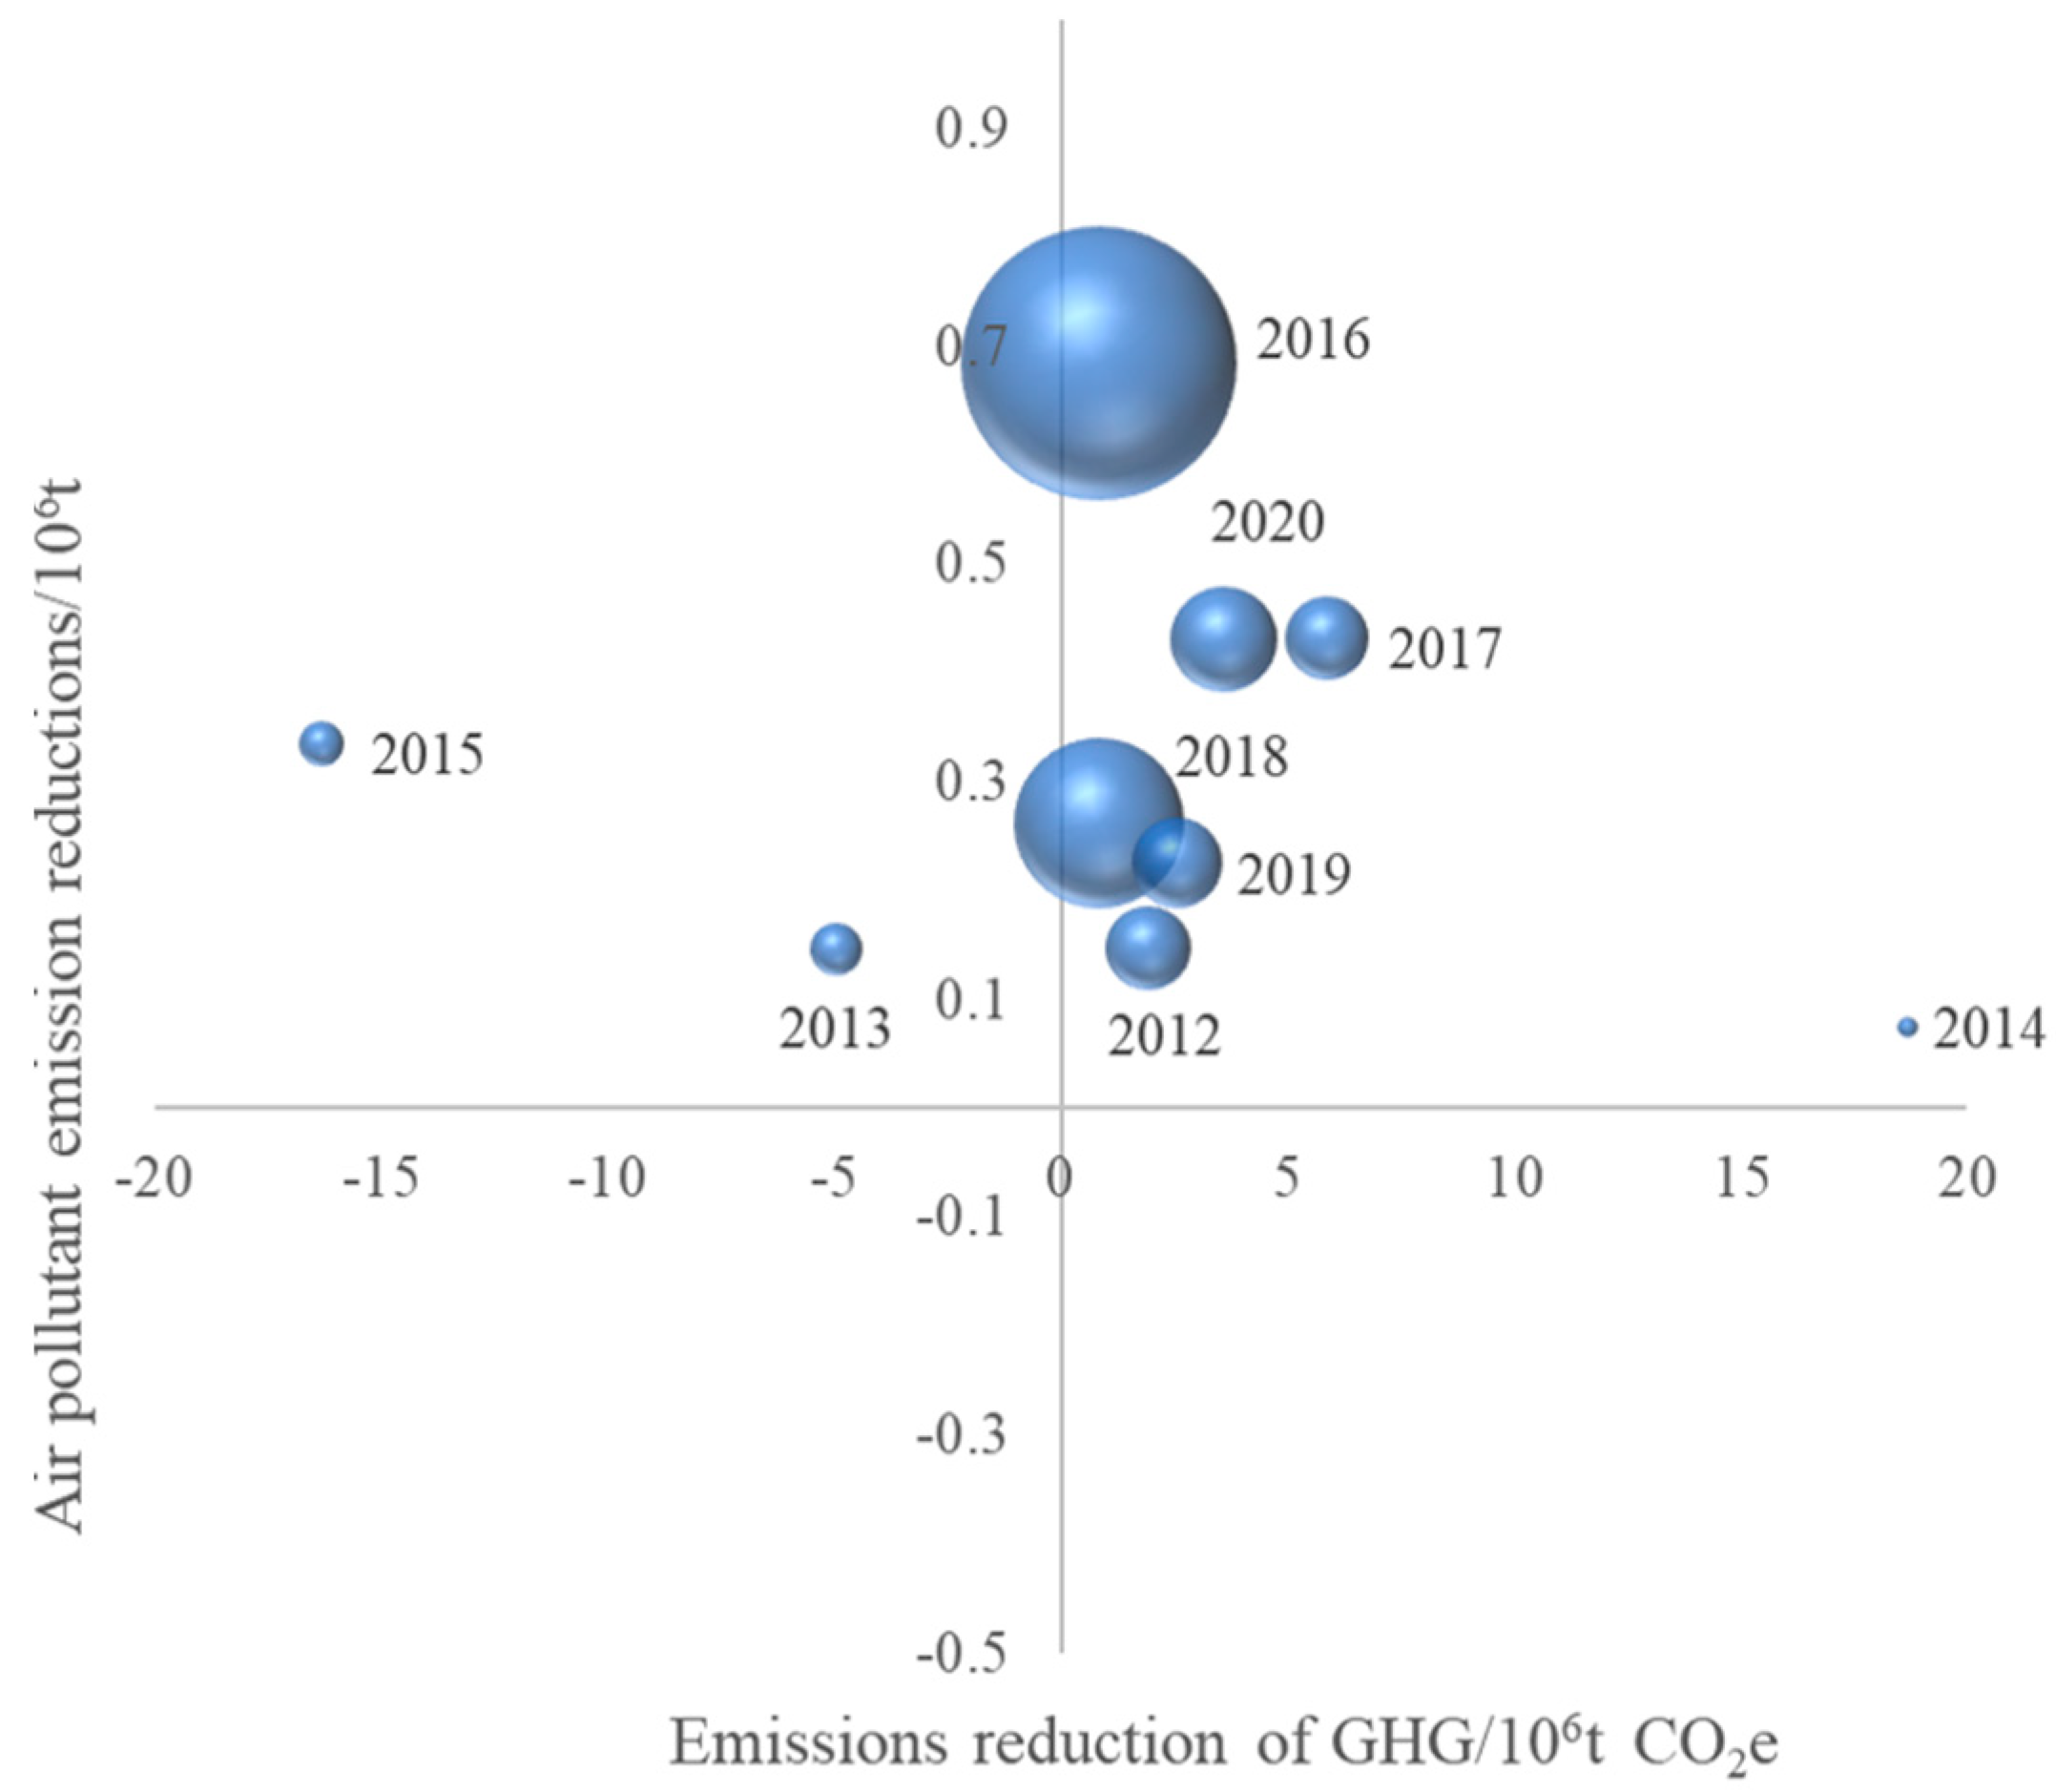
From
Figure 5, it is evident that 7 years of GHG and air pollutants from 2011 to 2020 have achieved simultaneous emission reduction, and the emission reduction situation is relatively concentrated in the quadrant diagram except for 2014. The remaining 2 years only achieved air pollutant emission reduction, and the years of emission reduction were not continuous.
3.6.2. Cross-Elasticity Analysis of Emission Reductions
From
Table 5, it is evident that ELs
CE-SE was less than 0 in 2012~2013 and 2014~2015, indicating that only SO
2 achieved emission reduction in that year. In other years, ELs
CE-SE is greater than 0, indicating that the GHG and air pollutants have achieved synergistic emission reduction, but in 2015~2016 and 2017~2018, ELs
CE-SE is less than 1, and the decrease in SO
2 emissions is greater than the decrease in GHG emissions.
4. Discussion
4.1. Uncertainty Analysis
In the process of calculating GHG emissions in Hebei Province, a large amount of data and emission factors need to be collected. Due to the statistical errors in the acquisition process of data and emission factors, the calculation results deviate from the actual situation. For example, in terms of energy activity emissions, the GHG emissions from coal, oil, and natural gas consumption are mainly considered, and the power transfer in and out is not included in the calculation; in the industrial production process, only the GHG emissions in the production of cement and steel are calculated, while other industries such as lime and adipic acid are not included; in the process of agricultural production, the calculation of N2O produced by manure nitrogen application is lacking, and the classification of animals in intestinal fermentation is not refined into scale feeding, farmer feeding, and grazing feeding; land use change and forestry only considered the change in biomass carbon storage of forest and other woody biomass, while the carbon emission of forest conversion was not calculated. In terms of waste emissions, there is no BOD-related measured data in the methane emission of domestic sewage treatment, which is obtained by the conversion of the correlation between BOD and COD recommended by the Provincial Guidelines. In addition, the assumption that all the waste is domestic waste in the incineration of solid waste will lead to a deviation between the calculation results and the actual total GHG.
In the process of calculating the emission of air pollutants in Hebei Province, only the emissions of SO2, NOX, and smoke & dust are considered, while other air pollutants such as PM2.5 and PM10 are not included, which will lead to the deviation between the calculation results and the actual total amount of air pollutants.
4.2. Analysis of Calculation Methods
In addition to the IPCC emission factor method, the production method and the input–output method are also used to calculate GHG emissions. The production method can be more intuitive and can be traced back to specific production activities, which helps to formulate industrial and regional emission reduction strategies. However, it does not consider indirect emissions caused by consumption, which may lead to emission reduction in production areas and an actual increase in emissions in consumption areas. The input–output method considers the emissions of different links in the entire industrial chain, which helps to reveal the key points in the supply chain. However, it has high computational complexity and requires a large amount of data, which makes it easy to introduce uncertainty. Compared with the two methods, the emission factor method is based on the average emission factor of each economic activity, which simplifies the calculation process but may ignore the differences in actual production, resulting in inaccurate results. In general, different accounting methods apply to different purposes and backgrounds. The comprehensive application can better understand the situation of GHG emissions, weigh the advantages and disadvantages of each method, and better guide emission reduction policies and actions.
4.3. Limitation
This study demonstrates the phenomenon of synergistic emission reduction in different pollutants but does not further explore the reasons behind it and propose corresponding emission reduction measures. Therefore, future work will conduct in-depth research on this part, which is of great significance for formulating comprehensive emission reduction strategies and controlling air pollution.
5. Conclusions
With the continuous improvement in the urbanization level in Hebei Province, the annual emissions of GHGs and air pollutants are still at a high emission level. Since the sources of GHGs and air pollutants are the same, their emission reduction measures have a synergistic effect. Hebei Province is one of the provinces with the largest energy consumption intensity and the most serious air pollution in China. Therefore, quantifying the emissions of GHGs and air pollutants in Hebei Province and the synergistic emission reduction effect between them will help to jointly control the emissions of GHGs and air pollutants.
The results show that from 2011 to 2020, the GHG emissions in Hebei Province generally showed a trend of increasing first and then decreasing, reaching a maximum of 5.26 × 10⁸ t CO2e in 2013. From the perspective of emission sources, the GHG emissions generated by energy activities are the main source of total GHG emissions in Hebei Province, followed by the GHG emissions generated by industrial production processes. The GHG emissions generated by waste treatment accounted for the lowest proportion, while the land use change and forestry part showed the absorption of GHGs, effectively controlling the growth of total GHG emissions. From 2011 to 2020, the total amount of air pollutant emissions in Hebei Province decreased year by year, from 3.85 × 10⁶ t in 2011 to 1.12 × 10⁶ t in 2020, with a significant decrease. The total amount of air pollutant emissions in 2020 decreased by 71.13% compared with 2013.
The results show that among the seven socio-economic indicators, GDP and energy consumption have the greatest impact on GHG and air pollutant emissions. In 2020, compared with 2011, GDP and energy consumption in Hebei Province increased by 169.31% and 116.77%, respectively.
The decoupling model of GHG emissions and economic growth shows that there is a negative correlation between them. The GHG emissions in Hebei Province are declining while the economy is growing, reaching an ideal state.
The rank correlation analysis of GHG and air pollutant emissions shows that there is a strong correlation between SO2, NOx, smoke & dust emissions and NO2 emissions. The correlation between other different pollutant indicators is not significant, but there is still a certain degree of correlation.
The results of the coordinate system of the synergistic control effect of GHG and air pollutant emissions show that the total amount of GHG emissions in Hebei Province from 2011 to 2020 is synergistic with the emissions of SO2, NOX, smoke & dust, and the total amount of air pollutant emissions, and the synergistic effect of smoke & dust and GHG emissions is better than that of SO2, NOx, and GHG emissions. During the study period, in addition to 2013 and 2015, the emissions of GHG and air pollutant in the remaining years have achieved simultaneous emission reductions, with emission reduction synergies.
Considering the calculation results of the cross-elasticity coefficient of GHG–air-pollutant synergistic emission reduction, the overall emission reduction synergy between GHG emission reduction and three types of air pollutants in Hebei Province from 2011 to 2020 is poor, usually in the state of “only air pollutant emission reduction” or “both synergistic emission reduction, but the reduction in GHG emissions is not as great as the reduction in emissions of air pollutants”. It also reflects that compared with the change in emission reduction of three kinds of air pollutants, the change in GHG emission reduction is smaller. In general, the GHG emission reduction and air pollutant control in Hebei Province have shown a synergistic effect, but the degree of synergy is different due to the types of air pollutants.


