
Response of Alpine Timberline to Permafrost Degradation on Changbai Mountain

 ,
,  , ,
, ,
Abstract
:1. Introduction
2. Data and Methods
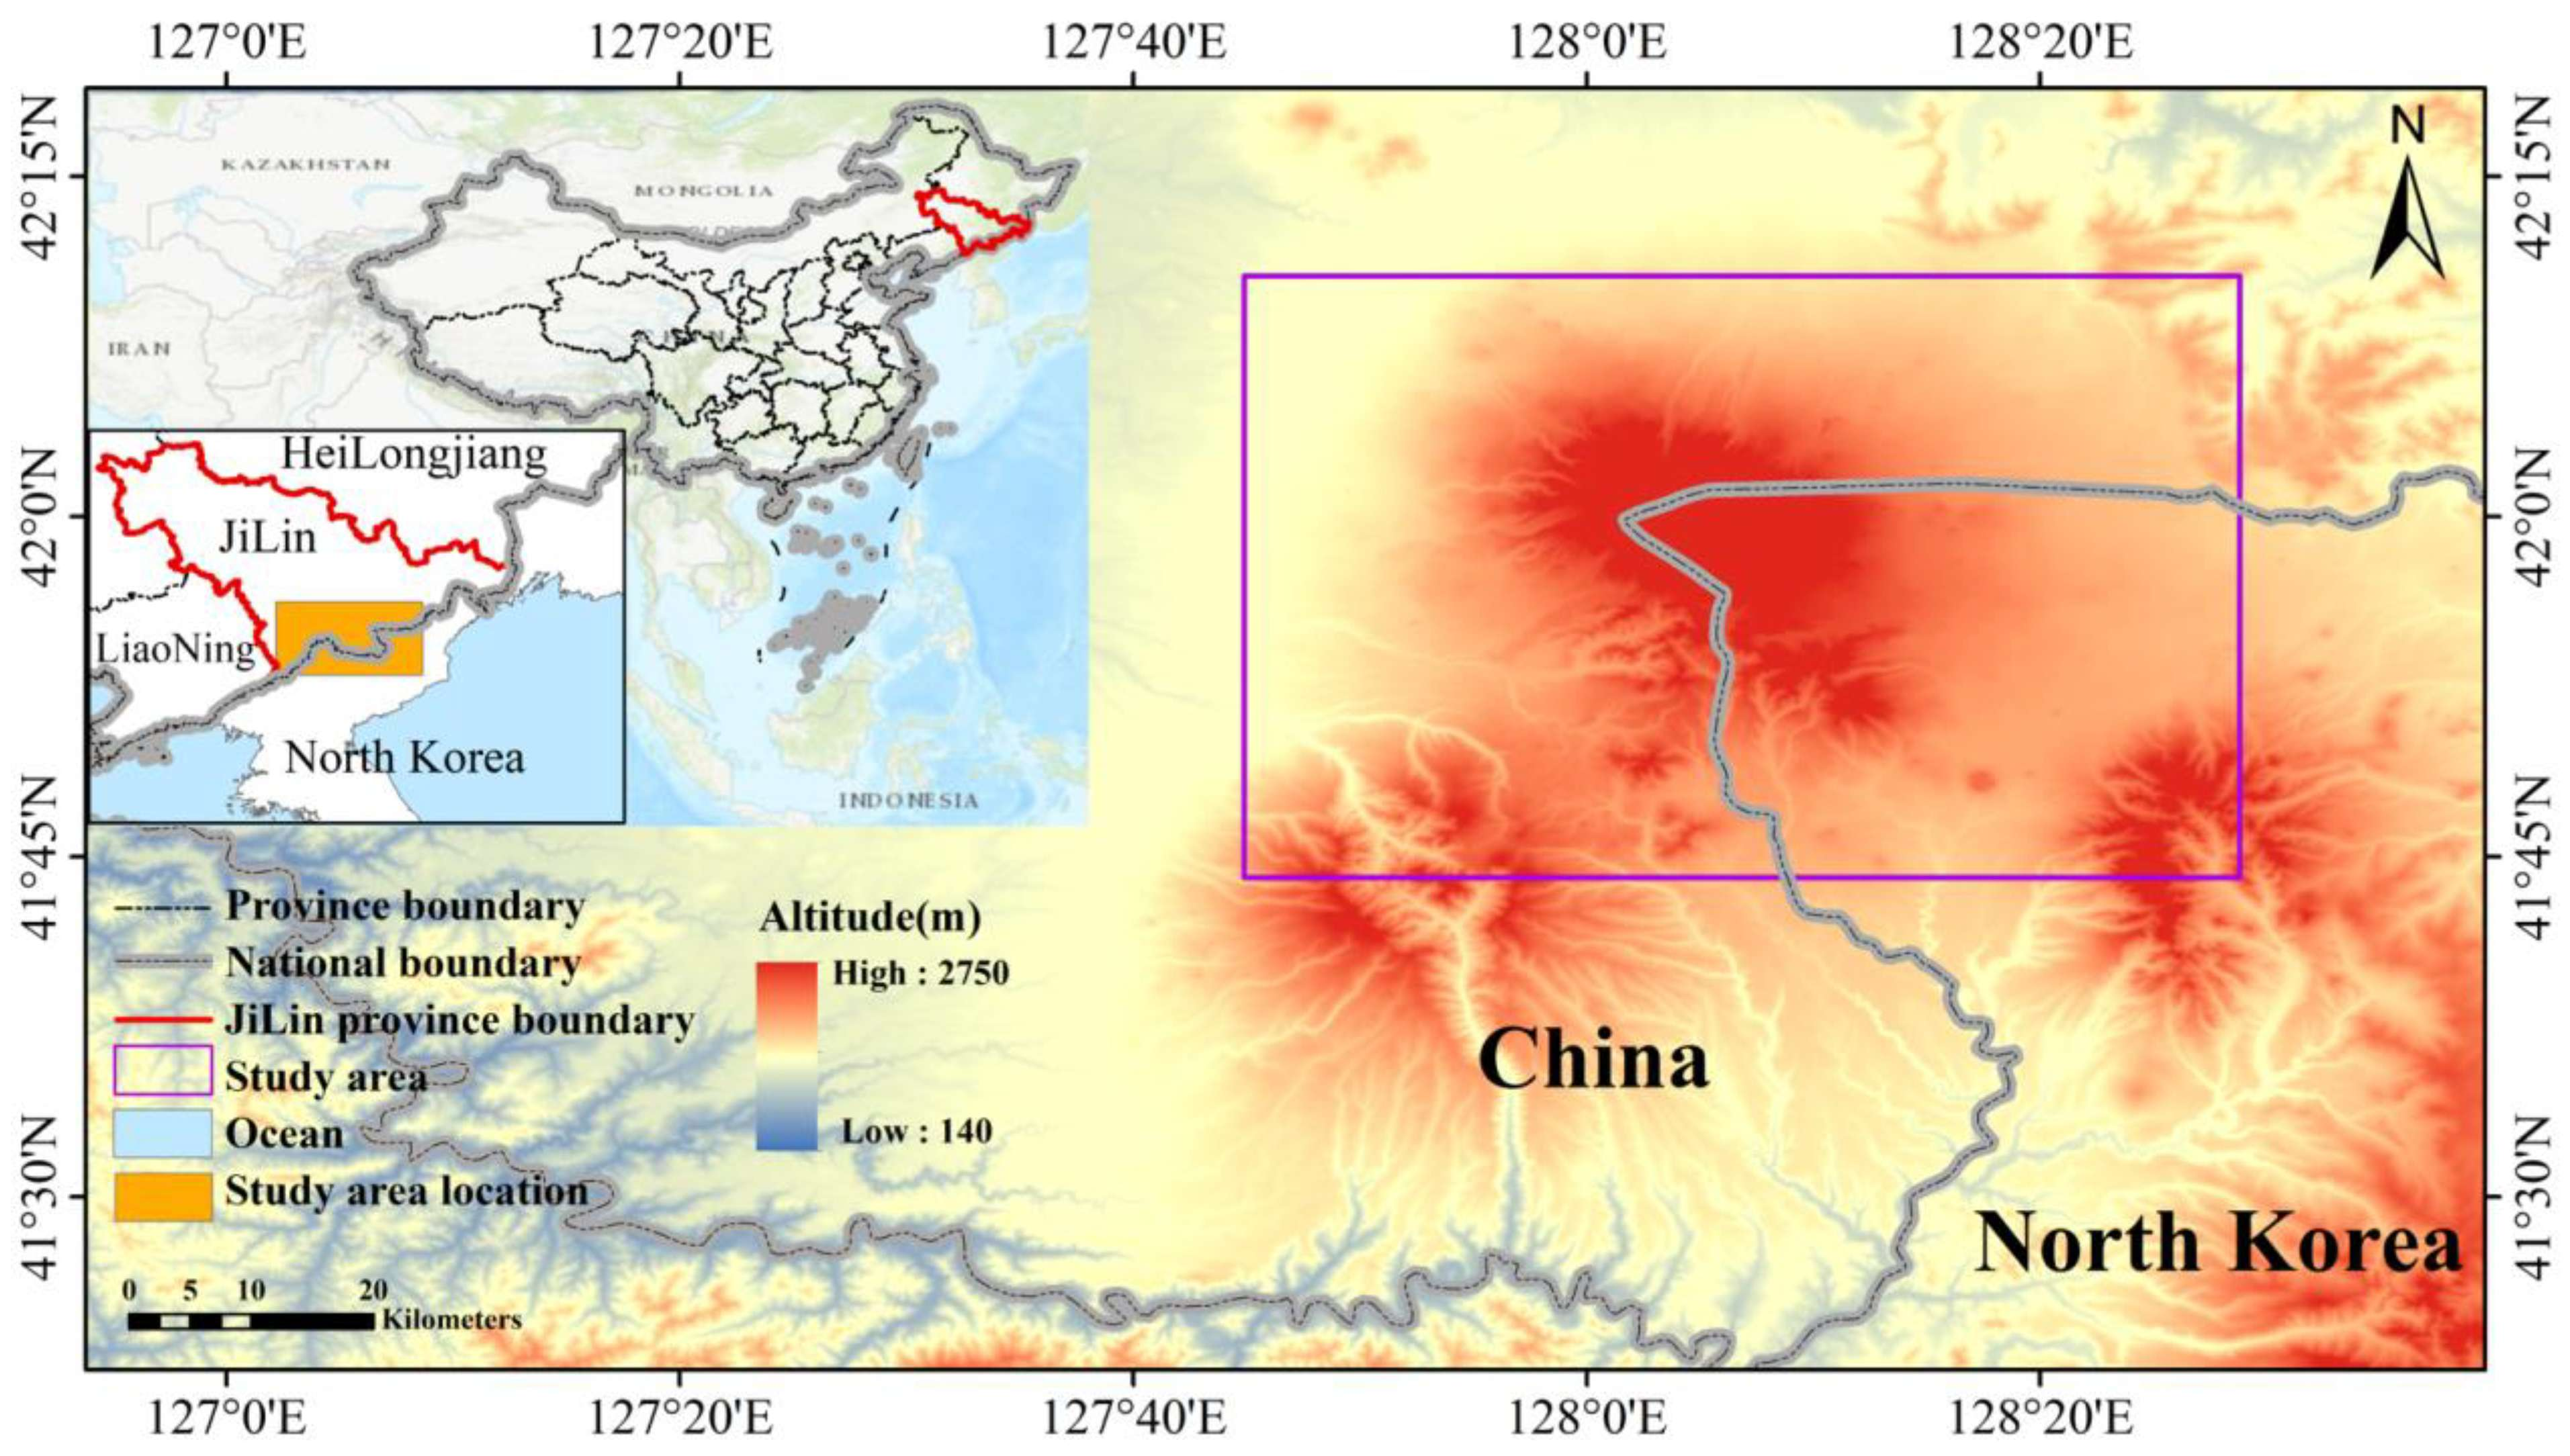
2.1. Study Area
2.2. Data Description and Data Sources
2.3. Analysis Methods
2.3.1. Significance Analysis of Vegetation Trends
2.3.2. Extraction of Alpine Timberlines Based on the Support Vector Machine Method
2.3.3. Surface Frost Number Model
3. Results
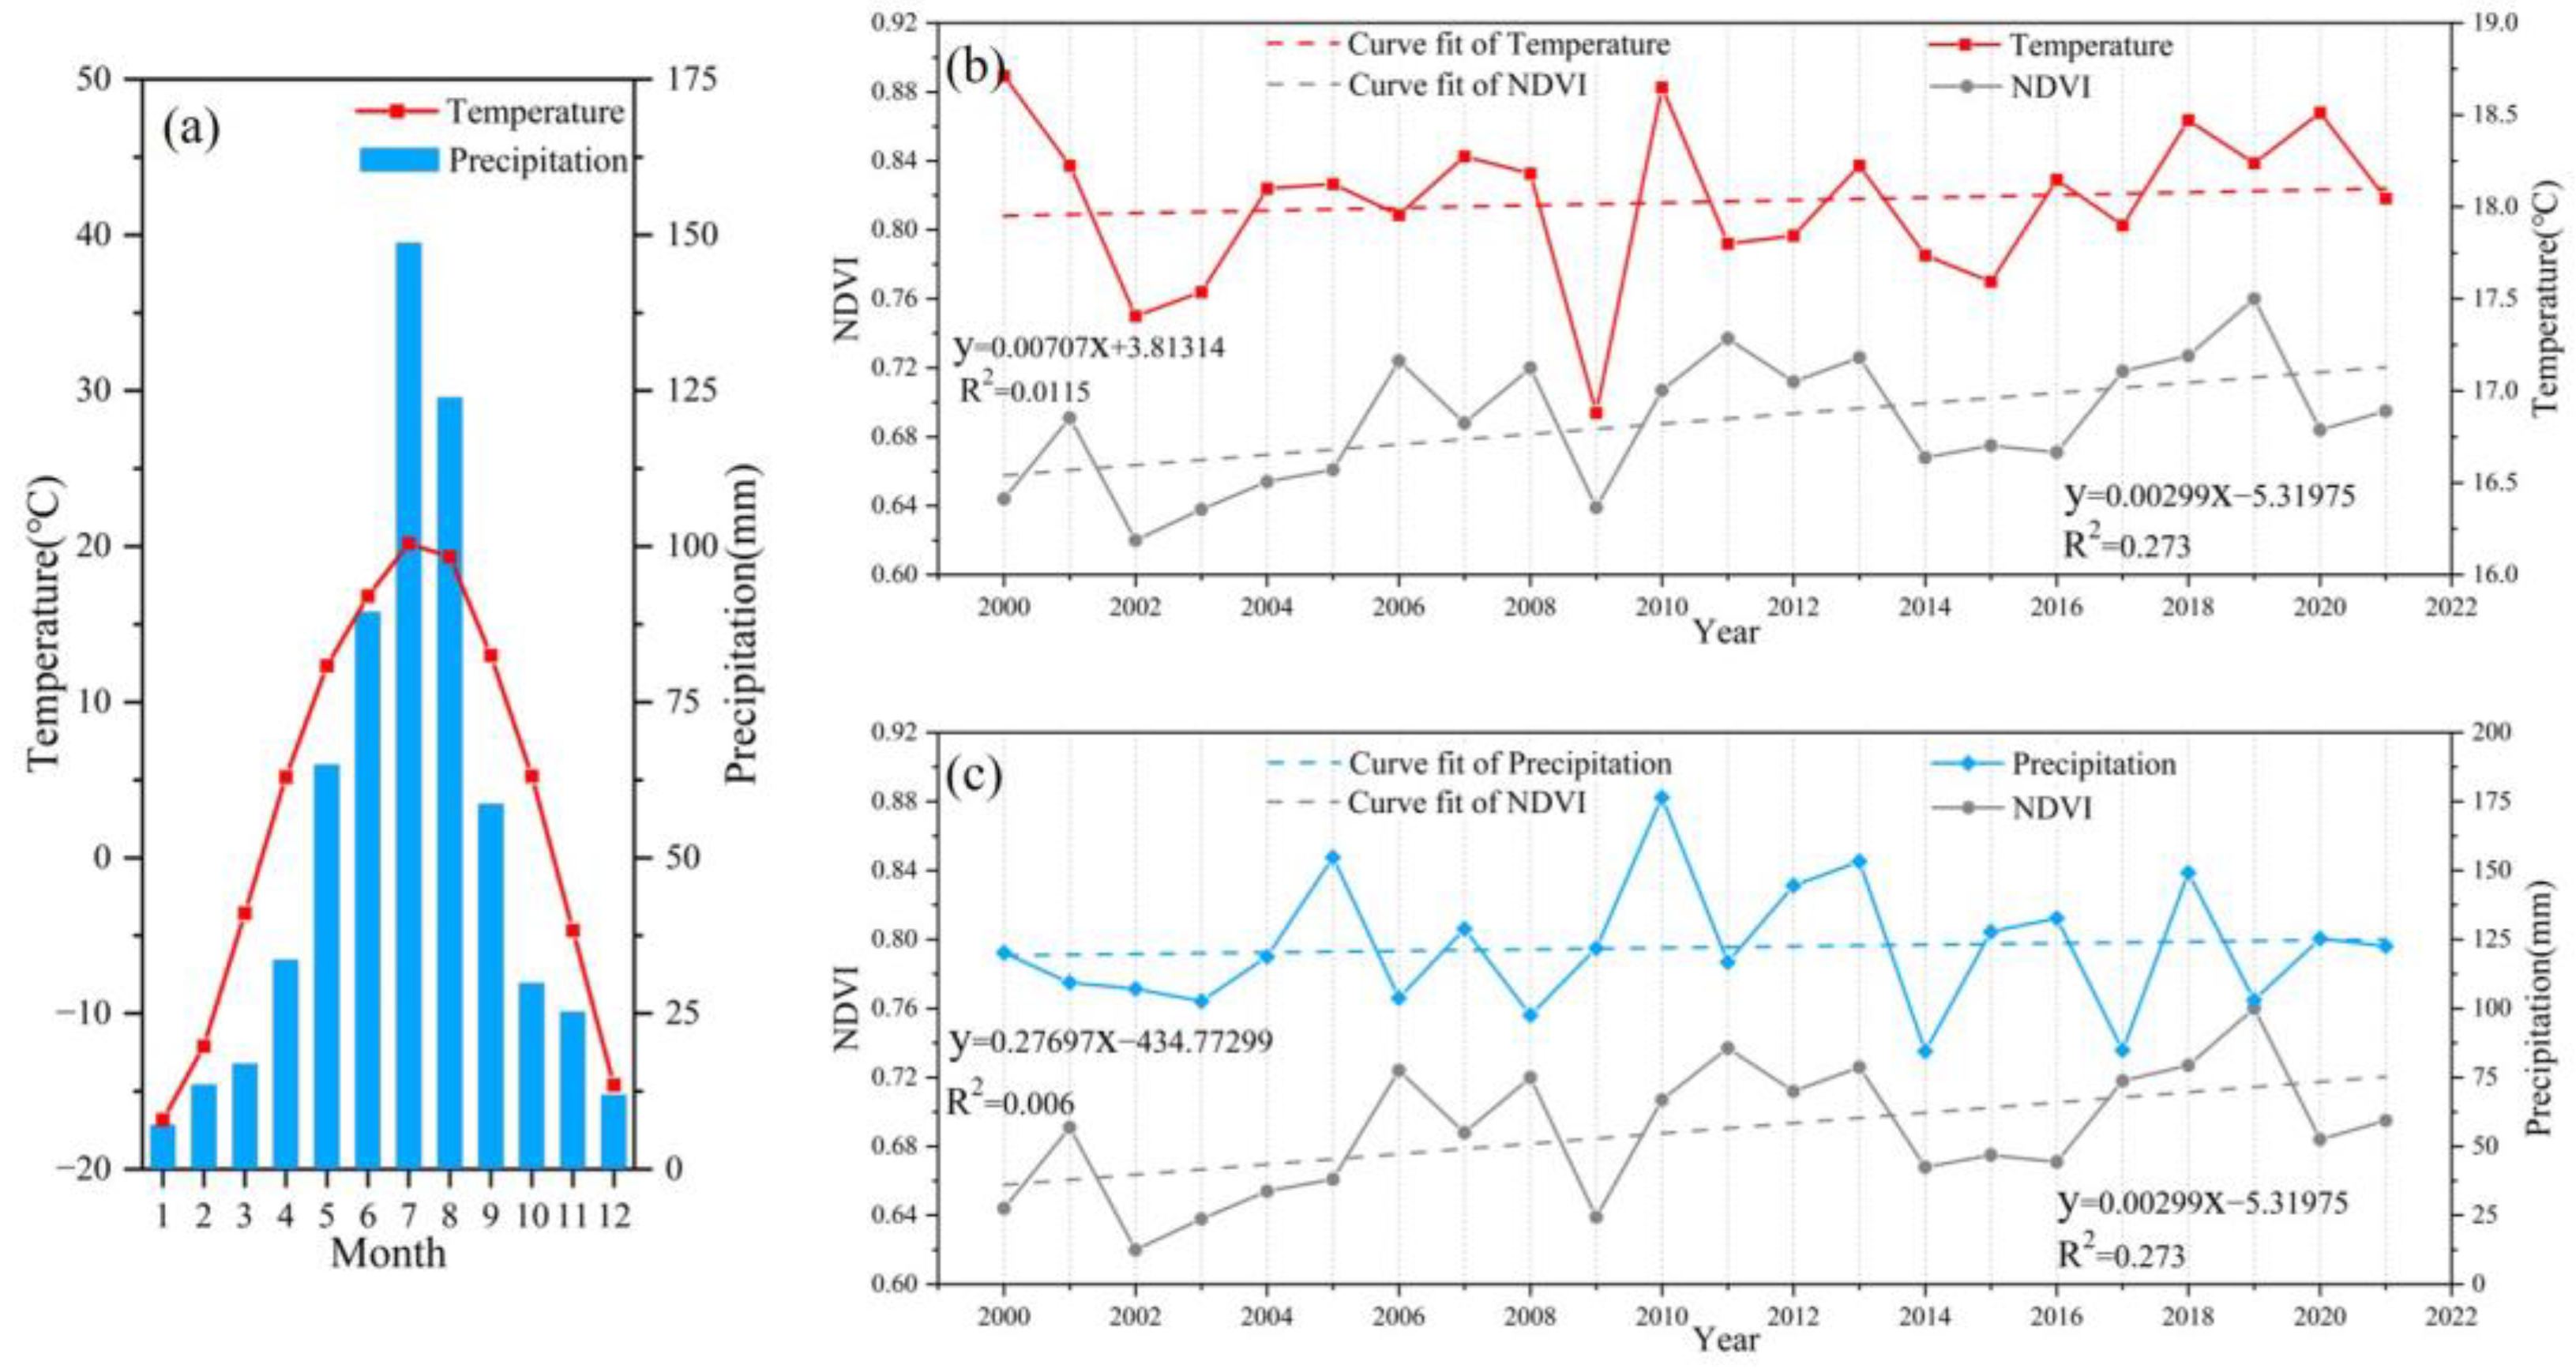
3.1. Vegetation Change
3.2. Coupled Permafrost and Vegetation Changes
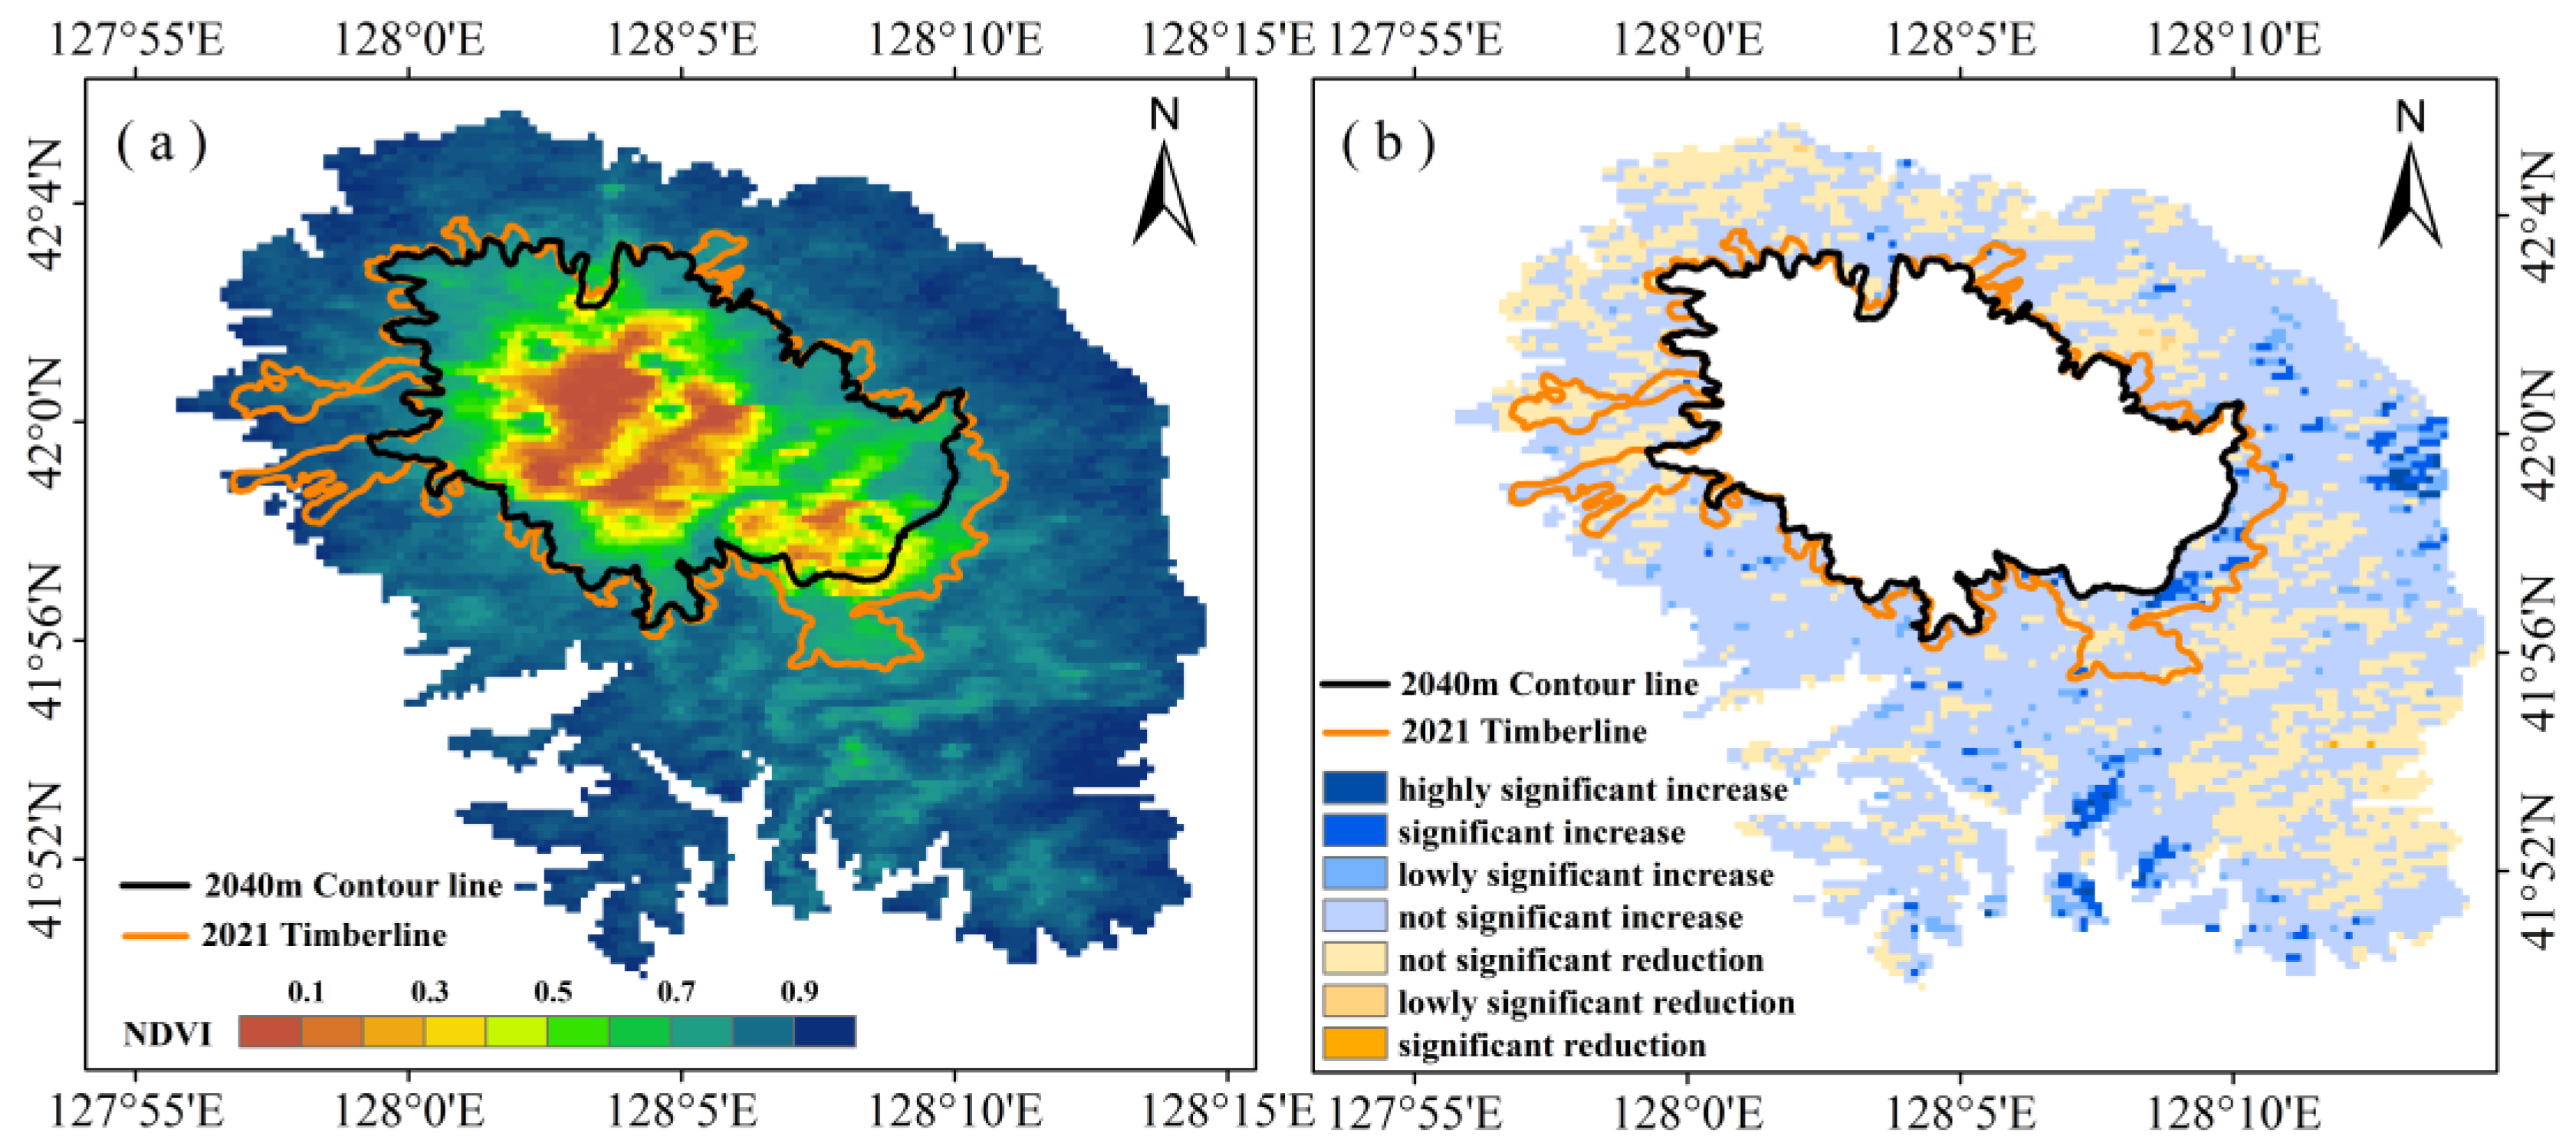
3.3. Spatial Distribution of Vegetation on Changbai Mountain and Trends in Change
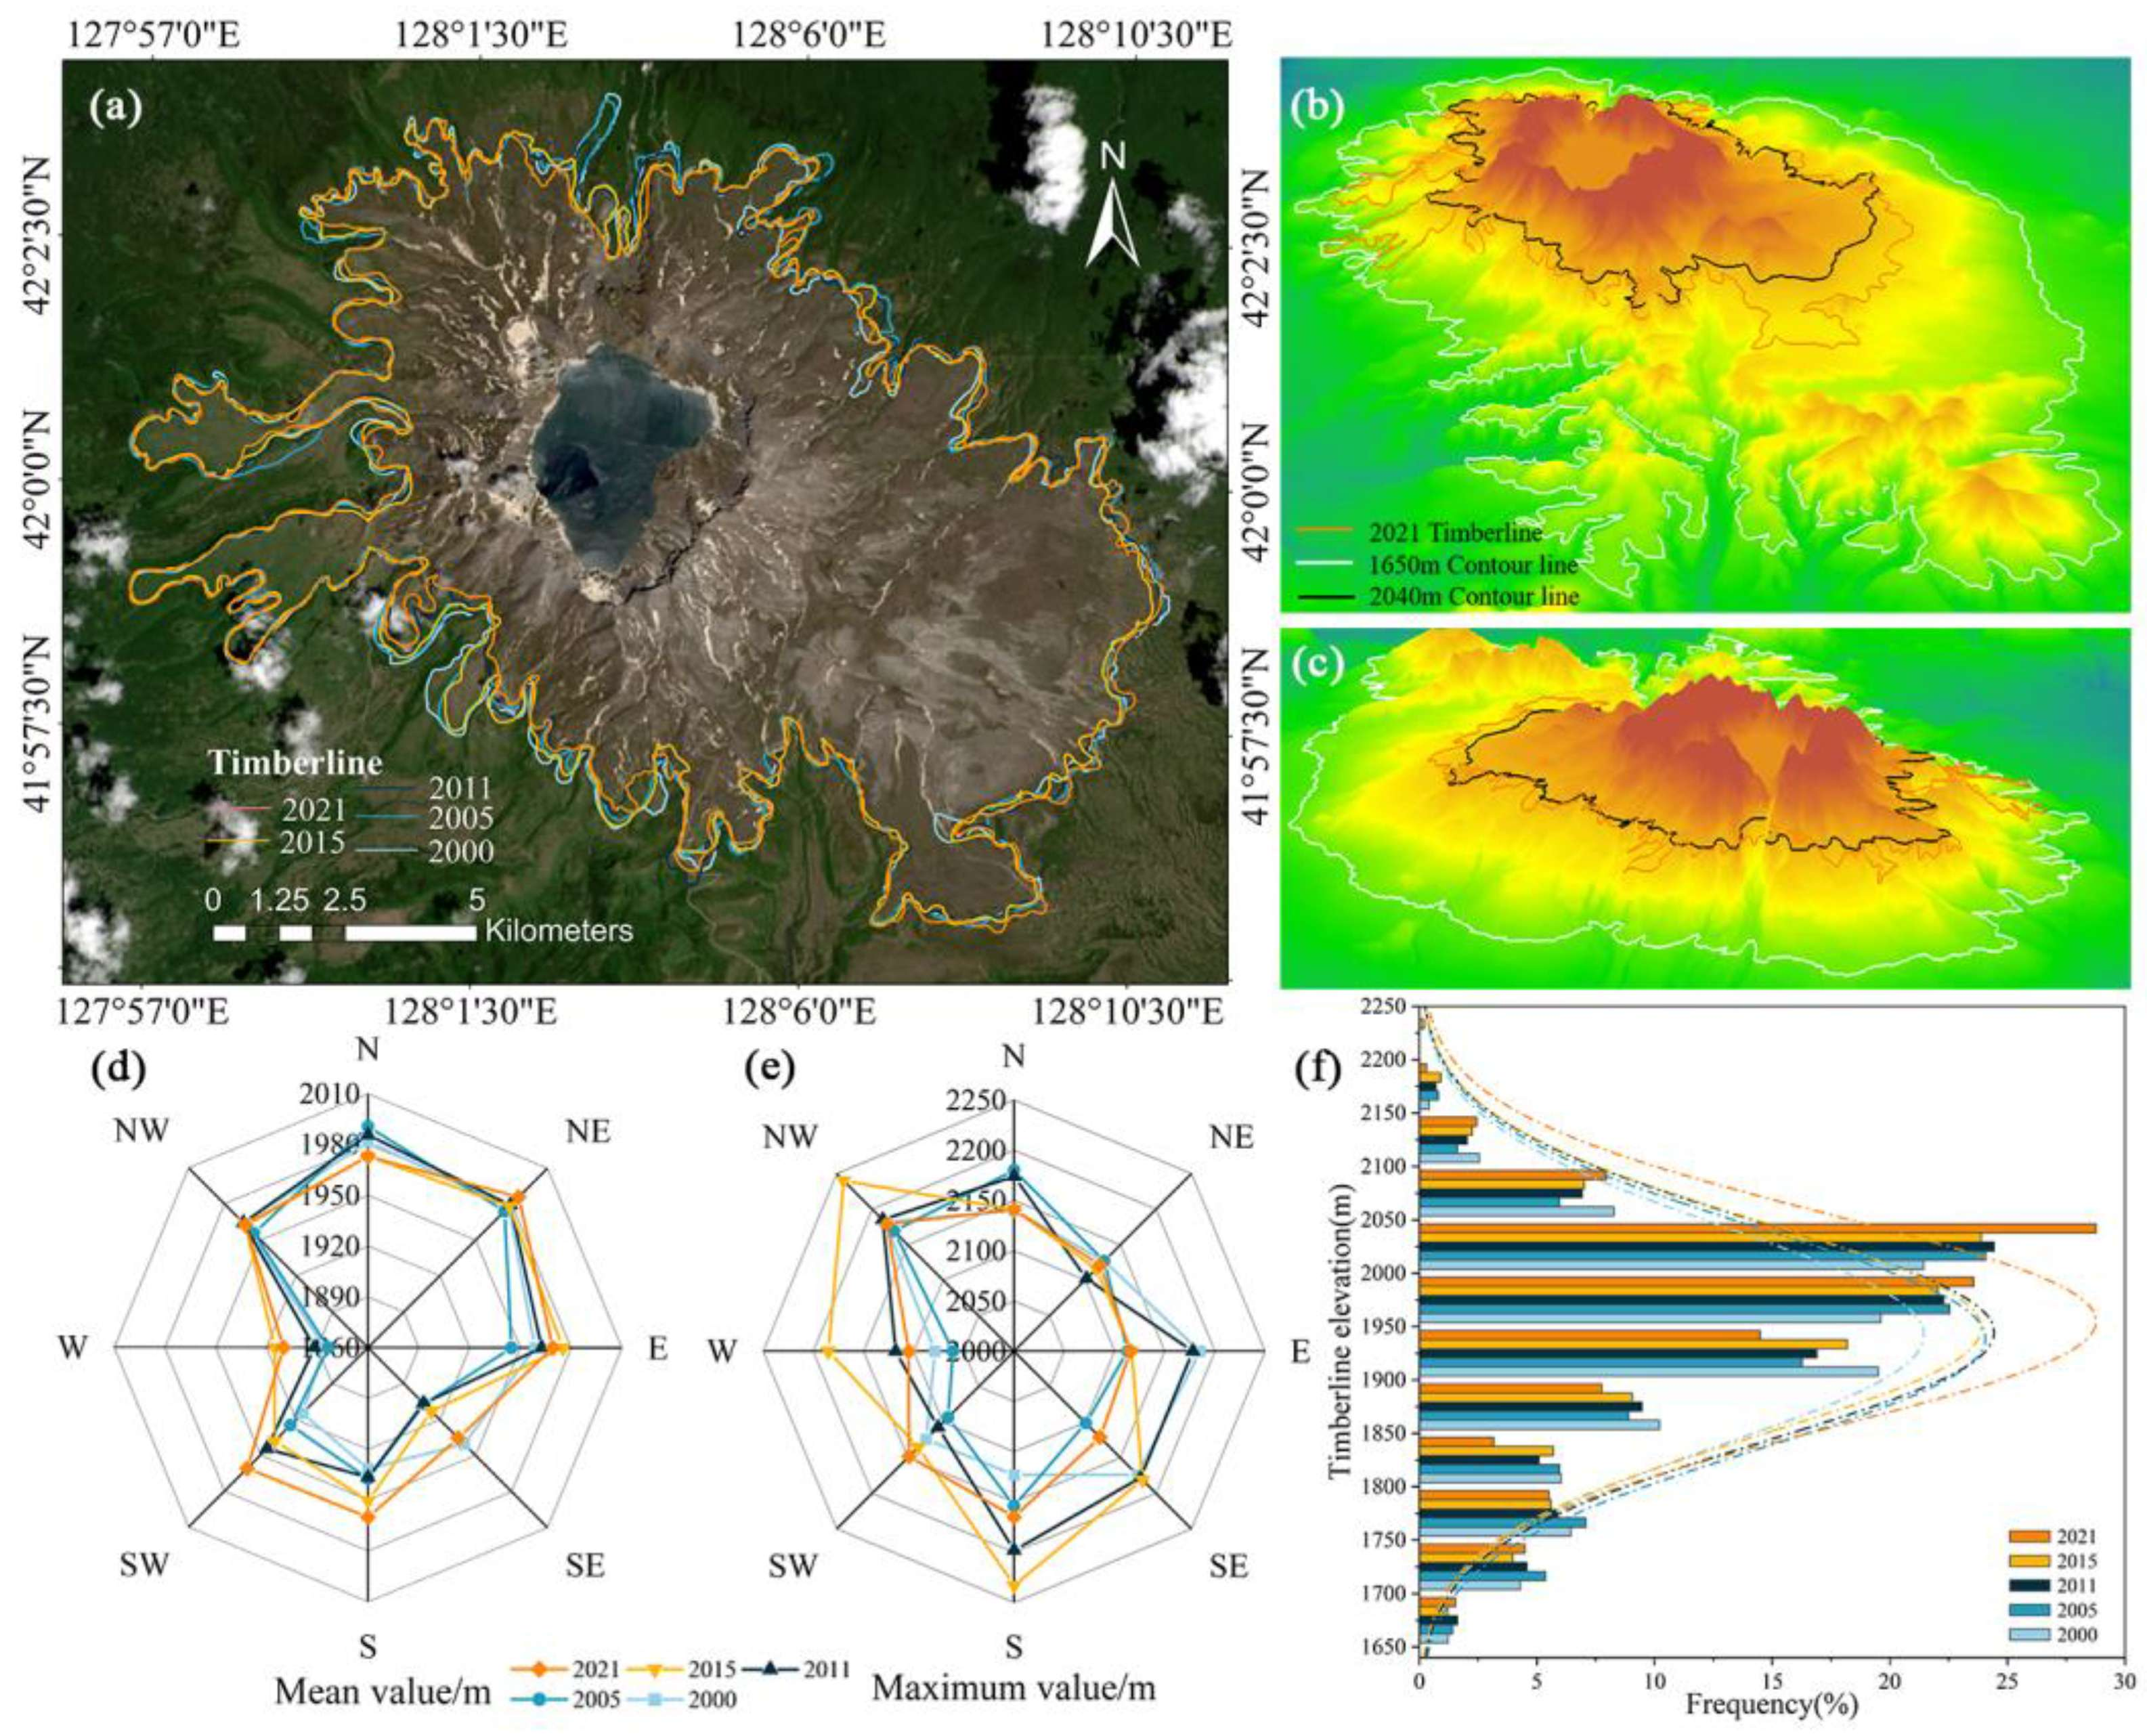
3.4. Changbai Mountain Alpine Timberline Changes
4. Discussion
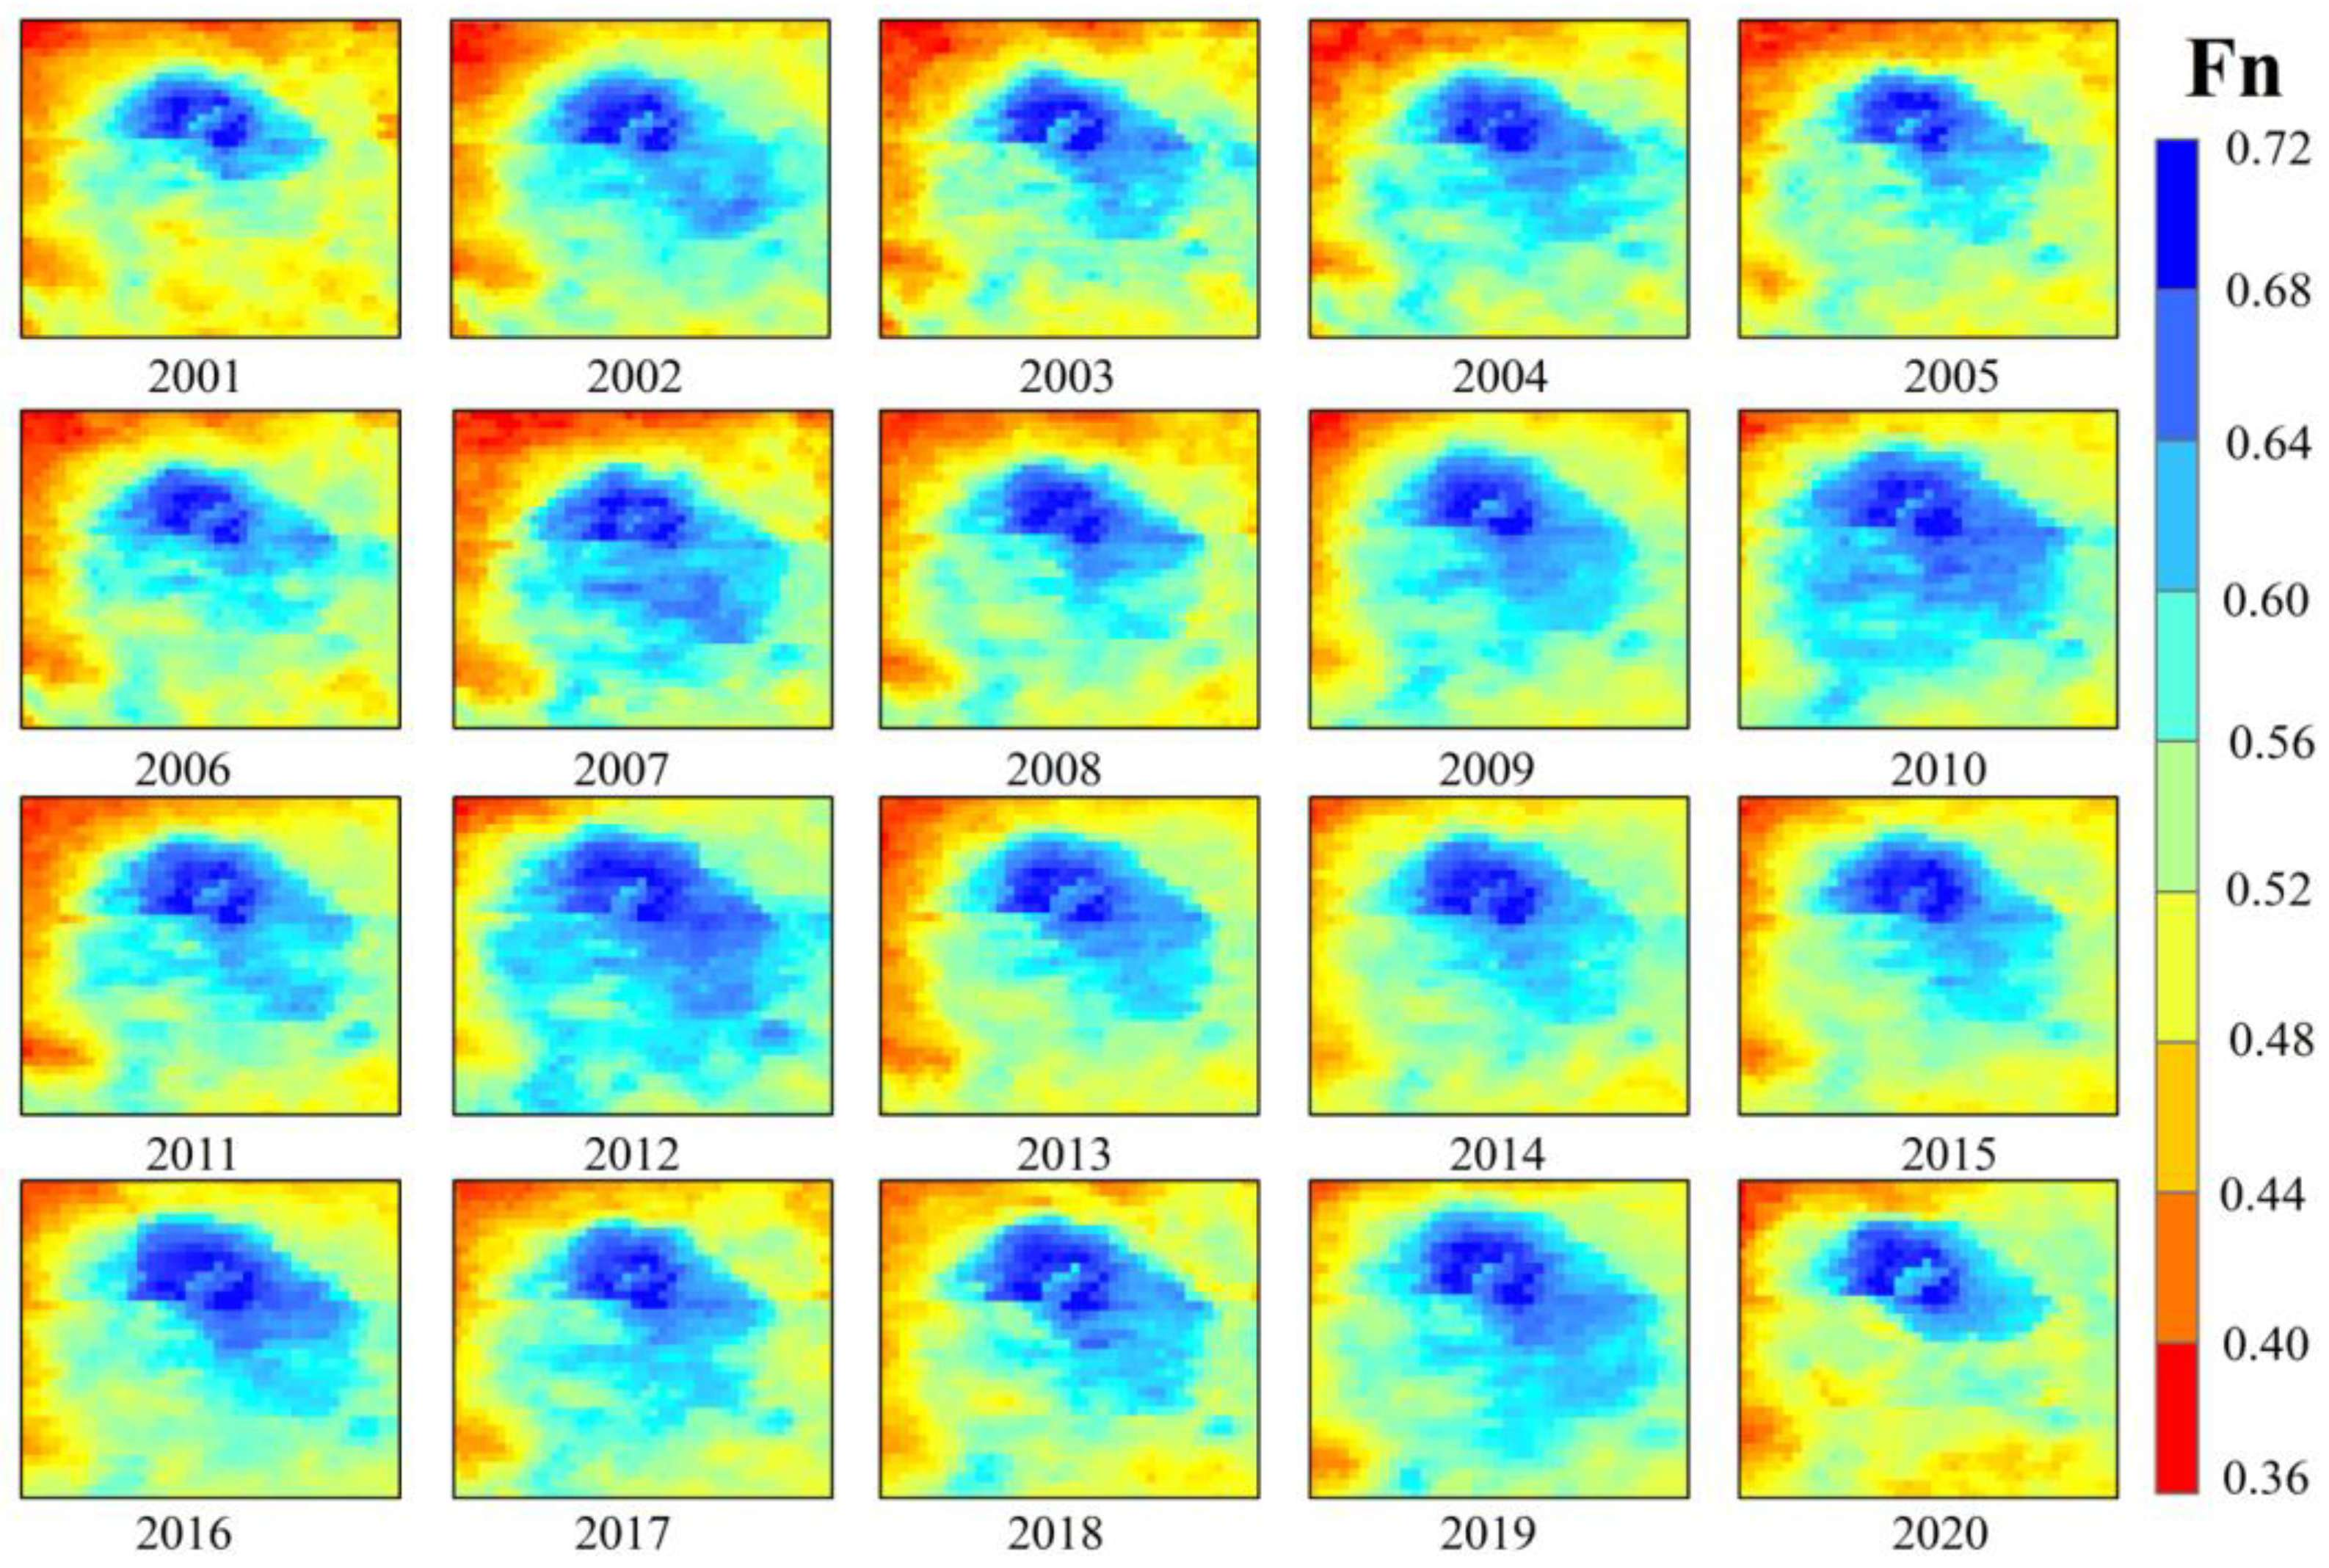
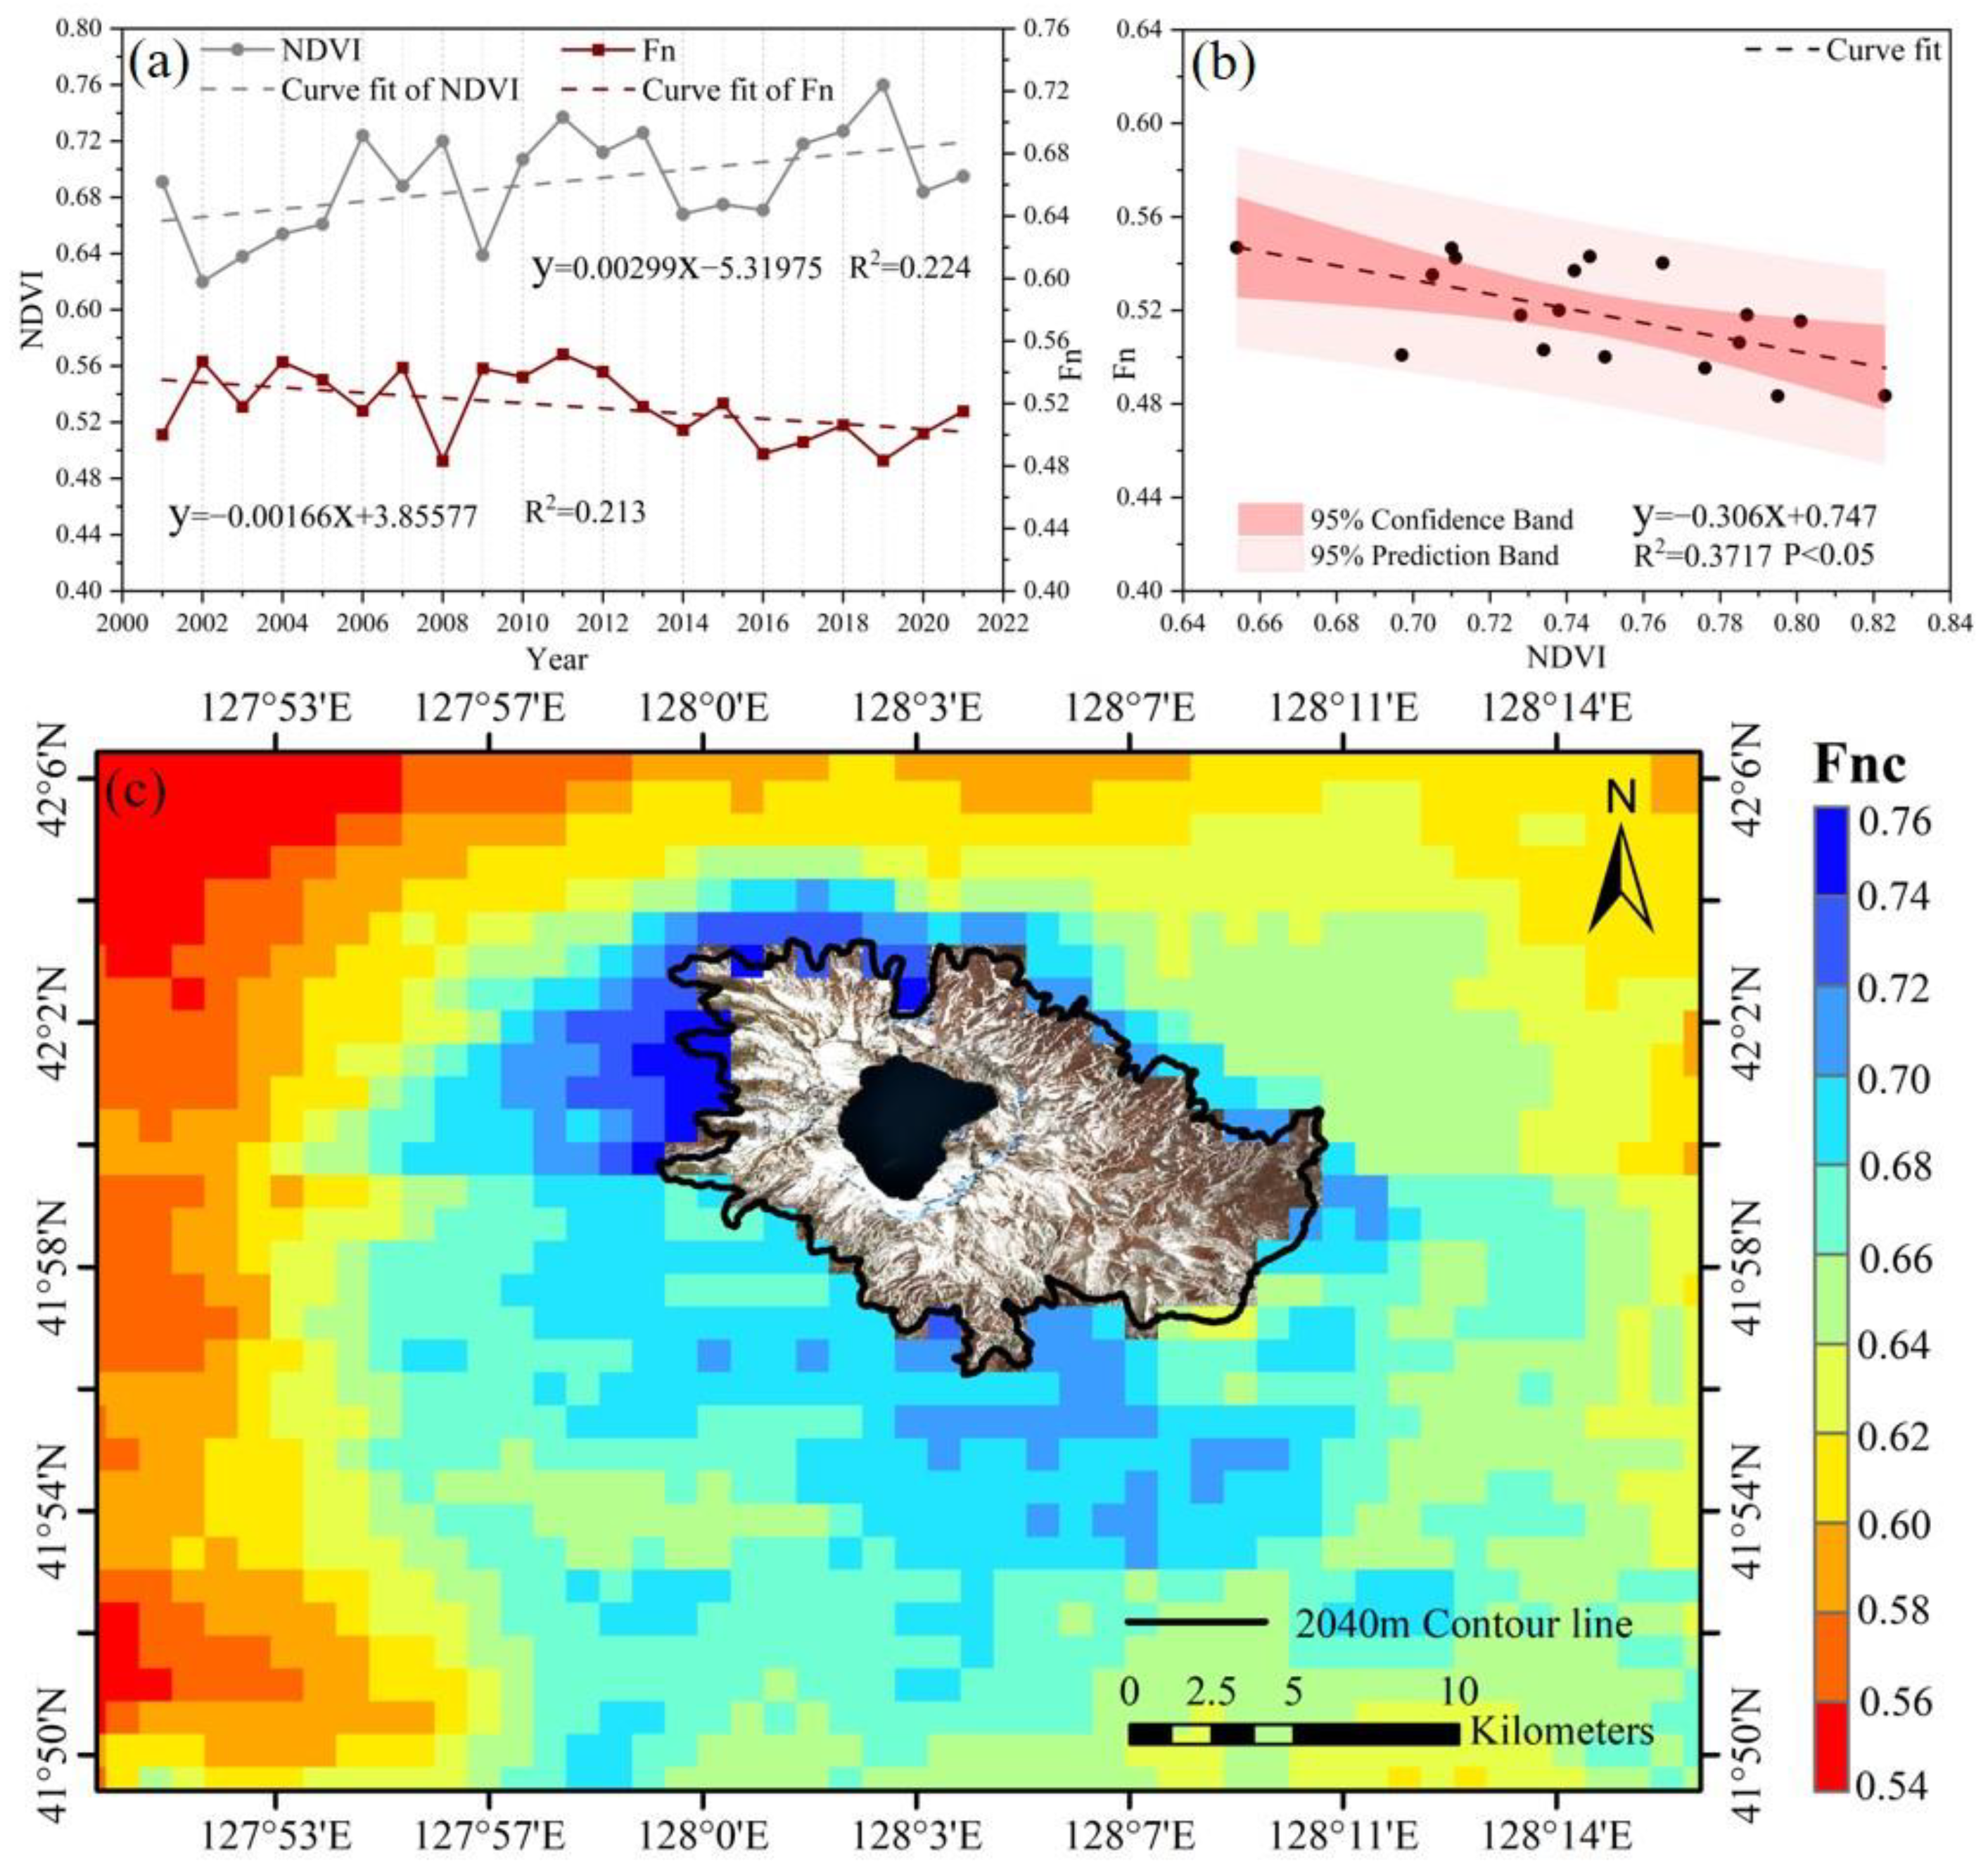
4.1. Stability Analysis of Permafrost in the Changbai Mountain
4.2. The Distribution Characteristics of Changbai Mountain Permafrost and Alpine Timberline at Elevation Are Correlated
4.3. Response of Alpine Timberlines on Changbai Mountain to Permafrost Degradation
5. Conclusions
Author Contributions
Funding
Institutional Review Board Statement
Informed Consent Statement
Data Availability Statement
Conflicts of Interest
References
- IPCC. Climate Change 2013: The Physical Science Basis. In Contribution of Working Group I to the Fifth Assesment Report of the Intergovernment Panel on Climate Change; Cambridge University Press: Cambridge, UK; New York, NY, USA, 2013. [Google Scholar]
- Zhang, Z.; Wu, Q.; Xun, X.; Wang, B.; Wang, X. Climate Change and the Distribution of Frozen Soil in 1980–2010 in Northern Northeast China. Quat. Int. 2018, 467, 230–241. [Google Scholar] [CrossRef]
- Man, H. Attribution Analysis of Soil Hydrothermal Characteristics and Surface Runoff Changes in Permafrost Area of Huma River Basin. Ph.D. Thesis, Harbin Normal University, Harbin, China, 2023. [Google Scholar]
- Li, X.; Zhang, K.; Li, X. The Minimum Temperature Outweighed the Maximum Temperature in Determining Plant Growth over the Tibetan Plateau from 1982 to 2017. Remote Sens. 2023, 15, 4032. [Google Scholar] [CrossRef]
- Zeng, X.; Xing, Y.; Shan, W.; Zhang, Y.; Wang, C. Vegetation Degradation Analysis in the Island-shaped Permafrost Areas along Beian-Heihe Expressway Based on the Mann-Kendall Test. J. Northwest For. Univ. 2017, 32, 22–29. [Google Scholar]
- Guo, J.; Hu, Y.; Bu, R. Effect of Degradation of Permafrost in the Northeast of China on Seasonal Change of Vegetation NDVI. J. Inn. Mong. Norm. Univ. 2022, 51, 50–56. [Google Scholar]
- Mao, D.; Wang, Z.; Song, K.; Liu, D.; Zhang, B.; Zhang, S.; Luo, L.; Zhang, C. The vegetation NDVI variation and its responses to climate change and LUCC from 1982 to 2006 year in northeast permafrost region. China Environ. Sci. 2011, 31, 283–292. [Google Scholar]
- Nan, Y.; Liu, Z.F.; Dong, Y.H.; Li, X.X.; Ji, Z. The Responses of Vegetation Cover to Climate Change in the Changbai Mountain Area from 2000 to 2008. Sci. Geogr. Sin. 2010, 30, 921–928. [Google Scholar]
- Qin, J.; Bai, H.; Zhao, P.; Fang, S.; Xiang, Y.; Huang, X. Dendrochronology-Based Normalized Difference Vegetation Index Reconstruction in the Qinling Mountains, North-Central China. Forests 2022, 13, 443. [Google Scholar] [CrossRef]
- Ma, X.; Bai, H.; Deng, C.; Wu, T. Sensitivity of Vegetation on Alpine and Subalpine Timberline in Qinling Mountains to Temperature Change. Forests 2019, 10, 1105. [Google Scholar] [CrossRef]
- Piao, S.; Friedlingstein, P.; Ciais, P.; Zhou, L.; Chen, A. Effect of Climate and CO2 Changes on the Greening of the Northern Hemisphere over the Past Two Decades. Geophys. Res. Lett. 2006, 33, 23402. [Google Scholar] [CrossRef]
- Smith, W.K.; Germino, M.J.; Hancock, T.E.; Johnson, D.M. Another Perspective on Altitudinal Limits of Alpine Timberlines. Tree Physiol. 2003, 23, 1101–1112. [Google Scholar] [CrossRef]
- Körner, C.; Paulsen, J. A World-Wide Study of High Altitude Treeline Temperatures: Study of High Altitude Treeline Temperatures. J. Biogeogr. 2004, 31, 713–732. [Google Scholar] [CrossRef]
- Malanson, G.P.; Butler, D.R.; Cairns, D.M.; Welsh, T.E.; Resler, L.M. Variability in an Edaphic Indicator in Alpine Tundra. CATENA 2002, 49, 203–215. [Google Scholar] [CrossRef]
- Noble, I.R. A Model of the Responses of Ecotones to Climate Change. Ecol. Appl. 1993, 3, 396–403. [Google Scholar] [CrossRef] [PubMed]
- Sun, G.; Yu, S.; Wang, H. Causes, South Borderline and Subareas of Permafrost in Da Hinggan Mountains and Xiao Hinggan Mountains. Sci. Geogr. Sin. 2007, 27, 68–74. [Google Scholar]
- Beckage, B.; Osborne, B.; Gavin, D.G.; Pucko, C.; Siccama, T.; Perkins, T. A Rapid Upward Shift of a Forest Ecotone during 40 Years of Warming in the Green Mountains of Vermont. Proc. Natl. Acad. Sci. USA 2008, 105, 4197–4202. [Google Scholar] [CrossRef] [PubMed]
- Danby, R.K.; Hik, D.S. Evidence of Recent Treeline Dynamics in Southwest Yukon from Aerial Photographs. Arctic 2007, 60, 411–420. [Google Scholar] [CrossRef]
- Kammer, A.; Hagedorn, F.; Shevchenko, I.; Leifeld, J.; Guggenberger, G.; Goryacheva, T.; Rigling, A.; Moiseev, P. Treeline Shifts in the Ural Mountains Affect Soil Organic Matter Dynamics. Glob. Chang. Biol. 2009, 15, 1570–1583. [Google Scholar] [CrossRef]
- Yang, J.; Huang, Y.; Luo, L.; Li, Y. The Role of Changbai Mountain in an Extreme Precipitation Event in Liaoning Province, China. Remote Sens. 2023, 15, 4381. [Google Scholar] [CrossRef]
- Yu, J.; Liu, Q.; Xu, Q.; Luo, C.; Wang, H.; Li, J. Variation of vegetation index in response to climate change on the eastern Variation of vegetation index in response to climate change on the eastern slope of Changbai Mountain, Northeast China. Chin. J. Appl. Env. Biol. 2015, 21, 323–332. [Google Scholar]
- Xu, Z.; Wang, X.; Fan, W.; Wang, G.; Liu, H. Comparative Analysis of Laris olgensis and Betula ermanii Associated with Environment on North Slopes Treeline of the Changbai Mountains. Sci. Geogr. Sin. 2014, 34, 748–756. [Google Scholar] [CrossRef]
- Wang, Y.; Xue, Z.; Chen, J.; Chen, G. Spatio-Temporal Analysis of Phenology in Yangtze River Delta Based on MODIS NDVI Time Series from 2001 to 2015. Front. Earth Sci. 2019, 13, 92–110. [Google Scholar] [CrossRef]
- Wang, M.; Lu, H.; Chen, B.; Sun, W.; Yang, G. Fine-Scale Analysis of the Long-Term Urban Thermal Environment in Shanghai Using Google Earth Engine. Remote Sens. 2023, 15, 3732. [Google Scholar] [CrossRef]
- Wu, P.; Shen, H.; Ai, T.; Liu, Y. Land-Surface Temperature Retrieval at High Spatial and Temporal Resolutions Based on Multi-Sensor Fusion. Int. J. Digit. Earth 2013, 6, 113–133. [Google Scholar] [CrossRef]
- Xu, T.; Wu, H. Spatiotemporal Analysis of Vegetation Cover in Relation to Its Driving Forces in Qinghai–Tibet Plateau. Forests 2023, 14, 1835. [Google Scholar] [CrossRef]
- He, Z.; Zhou, T.; Chen, J.; Fu, Y.; Peng, Y.; Zhang, L.; Yao, T.; Farooq, T.H.; Wu, X.; Yan, W.; et al. Impacts of Climate Warming and Humidification on Vegetation Activity over the Tibetan Plateau. Forests 2023, 14, 2055. [Google Scholar] [CrossRef]
- Li, P.; Wang, J.; Liu, M.; Xue, Z.; Bagherzadeh, A.; Liu, M. Spatio-Temporal Variation Characteristics of NDVI and Its Response to Climate on the Loess Plateau from 1985 to 2015. CATENA 2021, 203, 105331. [Google Scholar] [CrossRef]
- Chen, T.; Xia, J.; Zou, L.; Hong, S. Quantifying the Influences of Natural Factors and Human Activities on NDVI Changes in the Hanjiang River Basin, China. Remote Sens. 2020, 12, 3780. [Google Scholar] [CrossRef]
- Jiang, W.; Yuan, L.; Wang, W.; Cao, R.; Zhang, Y.; Shen, W. Spatio-Temporal Analysis of Vegetation Variation in the Yellow River Basin. Ecol. Indic. 2015, 51, 117–126. [Google Scholar] [CrossRef]
- Ge, J.; Meng, B.; Liang, T.; Feng, Q.; Gao, J.; Yang, S.; Huang, X.; Xie, H. Modeling Alpine Grassland Cover Based on MODIS Data and Support Vector Machine Regression in the Headwater Region of the Huanghe River, China. Remote Sens. Environ. 2018, 218, 162–173. [Google Scholar] [CrossRef]
- Zhong, G.; Chen, J.; Huang, R.; Yi, S.; Qin, Y.; You, H.; Han, X.; Zhou, G. High Spatial Resolution Fractional Vegetation Coverage Inversion Based on UAV and Sentinel-2 Data: A Case Study of Alpine Grassland. Remote Sens. 2023, 15, 4266. [Google Scholar] [CrossRef]
- Su, L. Optimizing Support Vector Machine Learning for Semi-Arid Vegetation Mapping by Using Clustering Analysis. ISPRS J. Photogramm. Remote Sens. 2009, 64, 407–413. [Google Scholar] [CrossRef]
- Chen, P.; Zhang, Y.; Wang, C.; Ge, S. Method of Extracting Surface Peaks Based on DEM. Mod. Surv. Mapp. 2006, 29, 11–13. [Google Scholar]
- Jiang, L.G.; Liu, X.N.; Feng, Z.M. Remote Sensing Identification and Spatial Pattern Analysis of the Alpine Timberline in the Three Parallel Rivers Region. Resour. Sci. 2014, 36, 259–266. [Google Scholar]
- Nelson, F.E. Permafrost Distribution in Central Canada: Applications of a Climate-Based Predictive Model. Ann. Assoc. Am. Geogr. 1986, 76, 550–569. [Google Scholar] [CrossRef]
- Bin, C.; Tingjun, Z.; Xiaoqing, P.; Lei, Z.; Cuicui, M.; Qingfeng, W. Spatial Variability of Freezing-Thawing Index over the Heihe River Basin. Adv. Earth Sci. 2015, 30, 357. [Google Scholar] [CrossRef]
- Luo, D.; Jin, H.; Marchenko, S.S.; Romanovsky, V.E. Difference between Near-Surface Air, Land Surface and Ground Surface Temperatures and Their Influences on the Frozen Ground on the Qinghai-Tibet Plateau. Geoderma 2018, 312, 74–85. [Google Scholar] [CrossRef]
- Fang, X.; Wang, A.; Lyu, S.; Fraedrich, K. Dynamics of Freezing/Thawing Indices and Frozen Ground from 1961 to 2010 on the Qinghai-Tibet Plateau. Remote Sens. 2023, 15, 3478. [Google Scholar] [CrossRef]
- Xu, Z.; Chen, Y.; Shan, W.; Deng, C.; Ma, M.; Wu, Y.; Mao, Y.; Ding, X.; Ji, J. Study of Methane Emission and Geological Sources in Northeast China Permafrost Area Related to Engineering Construction and Climate Disturbance Based on Ground Monitoring and AIRS. Atmosphere 2023, 14, 1298. [Google Scholar] [CrossRef]
- Zhang, Z.; Wu, Q.; Xun, X.; Li, L. Spatial Distribution and Changes of Xing’an Permafrost in China over the Past Three Decades. Quat. Int. 2019, 523, 16–24. [Google Scholar] [CrossRef]
- Lv, J.; Li, X.; Hu, Y.; Wang, X.; Sun, J. Application of frost number model in Northeast China pepmafrost regionalization. Chin. J. Appl. Ecol. 2008, 19, 2271–2276. [Google Scholar]
- Zhang, C.; Shan, W.; Liu, S.; Guo, Y.; Qiu, L. Simulation of Spatiotemporal Distribution and Variation of 30 m Resolution Permafrost in Northeast China from 2003 to 2021. Sustainability 2023, 15, 14610. [Google Scholar] [CrossRef]
- Kneisel, C.; Kääb, A. Mountain Permafrost Dynamics within a Recently Exposed Glacier Forefield Inferred by a Combined Geomorphological, Geophysical and Photogrammetrical Approach. Earth Surf. Process. Landf. 2007, 32, 1797–1810. [Google Scholar] [CrossRef]
- Wang, Y.; Chen, H.; Nan, Z.; Shang, Z. Modelling Permafrost Characteristics and Its Relationship with Environmental Constraints in the Gaize Area, Qinghai-Tibet Plateau, China. Remote Sens. 2022, 14, 5610. [Google Scholar] [CrossRef]
- Han, L.; Zhang, J.; Zhang, Y.; Ma, Q.; Alu, S.; Lang, Q. Hazard Assessment of Earthquake Disaster Chains Based on a Bayesian Network Model and ArcGIS. ISPRS Int. J. Geo-Inf. 2019, 8, 210. [Google Scholar] [CrossRef]
- Xu, W.; He, X.; Chen, W.; Liu, C. Characteristics and Succession Rules of Vegetation Types in Changbai Mountain. Chin. J. Ecol. 2004, 23, 162–174. [Google Scholar]
- Dai, L.; Wu, Y.; Han, S.; Li, Y. Effects of Great Volcanic Eruption on Historical Vegetation Succession on Eastern Slope of Changbai Mountain. Chin. J. Ecol. 2008, 27, 1771–1778. [Google Scholar]
- Shan, W.; Zhang, C.; Guo, Y.; Qiu, L. Mapping the Thermal State of Permafrost in Northeast China Based on the Surface Frost Number Model. Remote Sens. 2022, 14, 3185. [Google Scholar] [CrossRef]
- Gao, X.; Zhang, Y.; Xu, J.; Jin, Y.; Guo, X. Analysis of wind disturbance-inducing factors in temperate forest: A case of typhoon disturbed area in Changbai Mountain. J. Northeast. Norm. Univ. 2019, 51, 130–139. [Google Scholar] [CrossRef]
- Guo, D. The Study of Topographic Controls on Altitudinal Belt on Changbai Mountain. Ph.D. Thesis, Northeast Normal University, Changchun, China, 2014. [Google Scholar]
- Qiao, X. Study on Changes of Forest Line in Changbai Mountain Based on Spectral Indexs and SFA Algorithm. Ph.D. Thesis, China University of Geosciences, Beijing, China, 2021. [Google Scholar]
- Jin, X.-Y.; Jin, H.-J.; Iwahana, G.; Marchenko, S.S.; Luo, D.-L.; Li, X.-Y.; Liang, S.-H. Impacts of Climate-Induced Permafrost Degradation on Vegetation: A Review. Adv. Clim. Chang. Res. 2021, 12, 29–47. [Google Scholar] [CrossRef]
- Haberkorn, A.; Kenner, R.; Noetzli, J.; Phillips, M. Changes in Ground Temperature and Dynamics in Mountain Permafrost in the Swiss Alps. Front. Earth Sci. 2021, 9, 626686. [Google Scholar] [CrossRef]
- Jin, X.; Jin, H.; Luo, D.; Sheng, Y.; Wu, Q.; Wu, J.; Wang, W.; Huang, S.; Li, X.; Liang, S.; et al. Impacts of Permafrost Degradation on Hydrology and Vegetation in the Source Area of the Yellow River on Northeastern Qinghai-Tibet Plateau, Southwest China. Front. Earth Sci. 2022, 10, 845824. [Google Scholar] [CrossRef]
- Baral, P.; Allen, S.; Steiner, J.F.; Gurung, T.R.; McDowell, G. Climate Change Impacts and Adaptation to Permafrost Change in High Mountain Asia: A Comprehensive Review. Environ. Res. Lett. 2023, 18, 093005. [Google Scholar] [CrossRef]
- Li, Y.; Liu, H. Responses of Vegetation Growth to Climate Change in Permafrost Distribution Region in Northeast China. Acta Sci. Nat. Univ. Pekin. 2021, 57, 783–789. [Google Scholar] [CrossRef]
- Che, L.; Zhang, H.; Wan, L. Spatial Distribution of Permafrost Degradation and Its Impact on Vegetation Phenology from 2000 to 2020. Sci. Total Environ. 2023, 877, 162889. [Google Scholar] [CrossRef] [PubMed]
- Wang, J.; Liu, D. Vegetation Green-up Date Is More Sensitive to Permafrost Degradation than Climate Change in Spring across the Northern Permafrost Region. Glob. Chang. Biol. 2022, 28, 1569–1582. [Google Scholar] [CrossRef] [PubMed]
- Du, H.; Liu, J.; Li, M.-H.; Büntgen, U.; Yang, Y.; Wang, L.; Wu, Z.; He, H.S. Warming-Induced Upward Migration of the Alpine Treeline in the Changbai Mountains, Northeast China. Glob. Chang. Biol. 2018, 24, 1256–1266. [Google Scholar] [CrossRef]

| Landsat Sensor Type | Dates |
|---|---|
| Landsat5 TM | 12 September 2000 |
| Landsat7 ETM | 4 October 2005 |
| Landsat7 ETM | 3 September 2011 |
| Landsat7 ETM | 14 September 2015 |
| Landsat8 OLI/TIRS | 18 June 2021 |
| β | |Z| | Significance |
|---|---|---|
| β < 0 | |Z| > 2.58 | highly significant decrease |
| 1.96 < |Z| ≤ 2.58 | significant decrease | |
| 1.65 < |Z| ≤ 1.96 | low significant decrease | |
| |Z| ≤ 1.65 | no significant decrease | |
| β > 0 | |Z| ≤ 1.65 | no significant increase |
| 1.65 < |Z| ≤ 1.96 | low significant increase | |
| 1.96 < |Z| ≤ 2.58 | significant increase | |
| |Z| > 2.58 | highly significant increase |
| Type of Permafrost | Surface Thermal State | Fnc Value | Percentage | Area (/km2) |
|---|---|---|---|---|
| Continuous permafrost | Extremely stable surface thermal state | ≥0.66 | 33.6% | 425.47 |
| Discontinuous permafrost | Stabilized surface thermal state | 0.55–0.66 | 65.25% | 826.30 |
| Sub-stabilized surface thermal state | 0.50–0.55 | 1.15% | 14.50 | |
| Aggregate | - | - | 100% | 1266.27 |
| Year | Elevation Range | Average Elevation | Standard Deviation |
|---|---|---|---|
| 2000 | 1661–2185 | 1939.02 | 101.12 |
| 2005 | 1663–2180 | 1941.99 | 102.31 |
| 2011 | 1662–2198 | 1944.67 | 100.92 |
| 2015 | 1665–2241 | 1948.70 | 99.92 |
| 2021 | 1661–2179 | 1955.27 | 99.74 |
Disclaimer/Publisher’s Note: The statements, opinions and data contained in all publications are solely those of the individual author(s) and contributor(s) and not of MDPI and/or the editor(s). MDPI and/or the editor(s) disclaim responsibility for any injury to people or property resulting from any ideas, methods, instructions or products referred to in the content. |
© 2023 by the authors. Licensee MDPI, Basel, Switzerland. This article is an open access article distributed under the terms and conditions of the Creative Commons Attribution (CC BY) license (https://creativecommons.org/licenses/by/4.0/).
Share and Cite
Shan, W.; Xu, G.; Wang, Y.; Qiu, L.; Guo, Y.; Zhang, C. Response of Alpine Timberline to Permafrost Degradation on Changbai Mountain. Sustainability 2023, 15, 16768. https://doi.org/10.3390/su152416768
Shan W, Xu G, Wang Y, Qiu L, Guo Y, Zhang C. Response of Alpine Timberline to Permafrost Degradation on Changbai Mountain. Sustainability. 2023; 15(24):16768. https://doi.org/10.3390/su152416768
Chicago/Turabian StyleShan, Wei, Guangchao Xu, Yan Wang, Lisha Qiu, Ying Guo, and Chengcheng Zhang. 2023. "Response of Alpine Timberline to Permafrost Degradation on Changbai Mountain" Sustainability 15, no. 24: 16768. https://doi.org/10.3390/su152416768
APA StyleShan, W., Xu, G., Wang, Y., Qiu, L., Guo, Y., & Zhang, C. (2023). Response of Alpine Timberline to Permafrost Degradation on Changbai Mountain. Sustainability, 15(24), 16768. https://doi.org/10.3390/su152416768