Next Article in Journal
ESG and Investment Efficiency: The Role of Marketing Capability
Previous Article in Journal
Open and Closed Black Soldier Fly Systems Tradeoff Analysis
 
 
Retraction published on 9 April 2024, see Sustainability 2024, 16(8), 3097.
Article

RETRACTED: A Study on Life Cycle Impact Assessment of Seawater Desalination Systems: Seawater Reverse Osmosis Integrated with Bipolar-Membrane-Enhanced Electro-Dialysis Process

by
Farayi Musharavati
Department of Mechanical and Industrial Engineering, Qatar University, Doha P.O. Box 2713, Qatar
Sustainability 2023, 15(24), 16673; https://doi.org/10.3390/su152416673
Submission received: 23 October 2023 / Revised: 28 November 2023 / Accepted: 5 December 2023 / Published: 8 December 2023 / Retracted: 9 April 2024

Abstract

:
A lot of research has been carried out to improve the sustainability of seawater desalination. Despite progress, relatively few studies have analyzed the sustainability of seawater desalination processes integrated on two fronts, i.e., (i) process integration and (ii) energy integration. In addition, life cycle assessment studies on multi-stage flash (MSF) desalination often neglect the impact of the disposed brine by assuming that dilution of the discharged brine impacts on ecological systems less. The present study contributes to these omissions by exploring the environmental sustainability of seawater desalination systems using life cycle impact assessment (LCIA). More specifically, the LCIA of Seawater Reverse Osmosis (SWRO) integrated with (i) an Electro-Dialysis (EDBMED) process and (ii) solar photovoltaics (PV) is investigated. Life cycle analysis was used to identify pertinent indicators of the LCIA and their implications in SWRO. The comparative analysis reveals that the advantage of SWRO as compared to other technologies such as MSF is energy efficiency, at estimated levels of 75.0%. The study concludes that despite the technological challenges associated with sustainable desalination and sustainable brine management, integrating renewable energy into seawater desalination can contribute to the sustainability improvements of seawater desalination systems. The findings of this paper provide an initial assessment of the ecological footprints of seawater desalination systems.

Graphical Abstract

1. Introduction

Global water scarcity is now a commonly observed phenomenon regardless of region. In recent years, almost one-third of the global population has faced acute water shortages [1]. More alarmingly, 780 million people have no access to potable water [2]. The United Nations World Water Development Report also revealed that almost six billion people are projected to suffer acute water scarcity by 2050. However, as a result of factors such as expanding resource distribution, population growth, socioeconomic challenges, and climate change, the projected scarcity is expected to increase beyond these figures [3].
In the meantime, the central focus is on better or optimized management and consumption of available water resources to foster sustainability. Existing consumption patterns and the rise in industrial and water-intensive patterns have been major causes of the inefficient usage of available water resources [4]. Moreover, to overcome water scarcity globally, initiatives to make efficient use of freshwater, brackish water, and seawater have to be expedited [5]. In this regard, seawater desalination has catered to the freshwater requirement of the human population globally, including in the Middle Eastern region, the North African region [6], the United States [7], the European region [8], and Mediterranean nations [9].
Seawater desalination, as a non-conventional yet practical solution, plays a crucial role in addressing the global potable water shortage, especially in countries with extensive arid climates, where water is a scarce resource. This is particularly evident in Gulf Cooperation Council (GCC) countries that receive relatively less rainfall [10]. Qatar is part of the GCC and has one of the largest seawater desalination capacities at a larger scale globally, where almost 99.0% of its water supply at the municipal level is desalinated water [11,12]. However, upon comparison with the well-articulated techniques of treating water, seawater desalination can be regarded as a highly energy-intensive technology at a global scale [13].
In particular, thermal desalination techniques consume the highest energy when compared with other desalination technologies [12,14]. This heightened energy consumption not only affects economic considerations but also has significant environmental implications, contributing to greater greenhouse gas emissions during the desalination process [15]. The environmental impact of desalination extends beyond greenhouse gas emissions and includes factors such as brine disposal, which can harm marine ecosystems if not managed properly. According to a study by Do Thi and Tóth [16], the most commonly-adopted desalination techniques are Multi-Effect Distillation (MED), reverse osmosis (RO), and multi-stage flash (MSF) distillation. Do Thi and Tóth [16] conducted a study and investigated the greenhouse gas (GHG) emissions produced when desalination technologies were powered by renewable energy and fossil fuels. The study was based on two methods: life cycle assessment (LCA) and carbon footprints (CFs). The results revealed that the reverse osmosis technology produced significantly lower GHG emissions, and its efficiency grew when it was used with renewable energy sources in comparison with using fossil fuels.
Another study [17] presented a comparative assessment of the simulation outcomes of compressed air energy storage (CAES), MED, and MSF techniques to propose an integrated CAES desalination process. The findings of this study reported a 3% betterment in the efficiency of the system, as well as an increase in the quality of the distilled water, i.e., 2.5 times higher than a traditional desalination system. However, the study did not conduct a life cycle assessment (LCA). Alhaj et al. [18] in their study conducted a LCA on a solar-driven MED process. The study documented that the operational phase comprised most of the life cycle impacts related to climate change, water depletion, and fossil fuel combustion. This analysis showed a reduction of 10 kg/CO2 eq., and in terms of energy, it had higher efficiency levels for every 1 cubic meter (m3) of freshwater in comparison with the existing process. Integration of renewable energy into the desalination system resulted in a reduction in environmental impact, the results of which can be used to improve sustainability performance [18]. Similarly, Najjar et al. [19] conducted a LCA for a preliminary cost analysis of renewable energy grid combinations such as a photovoltaic grid, wind grid, and anaerobic digestion grid. The study reported a 60% reduction in CF. A study [20] performed a social life cycle assessment of a small seawater desalination plant installed in a local community in Malaysia. This study found positive social impacts of a small seawater desalination plant for the local community.
The present study aims to conduct an LCIA of seawater desalination technologies. Via this analysis, this study seeks to evaluate the ecological and environmental impacts associated with seawater desalination systems. In addition, the study will explore potential strategies for enhancing the environmental sustainability and energy efficiency of seawater desalination technologies. The results of this study will offer valuable insights to students, researchers, and practitioners interested in the life cycle analysis of seawater desalination technologies.

2. Related Work

Membrane desalination and thermal desalination are the two most commonly adopted desalination techniques across the globe. Thermal desalination technologies include Multi-Effect Desalination (MED) and multi-stage flash (MSF) desalination. Reverse osmosis (RO) is more popular globally. Gradually, Qatar has shown its interest in employing membrane desalination technologies and has built new seawater desalination plants with a steady transition from MSF to integrate more energy-efficient techniques and mitigate its CF and ecological impacts [11].
The factors associated with seawater desalination technologies include the usage of electric, mechanical, and thermal energy consumption [11,20], where solar energy has been gaining traction to generate electricity [11,20], as it is promising for integrating sustainability into the entire process of desalinating seawater. Consequently, MED and RO can be considered two potential techniques in comparison with MSF desalination as they are optimal and can be combined with the solar energy technique.
Moreover, thermal desalination techniques are more tolerant of an unfavorable seawater quality due to the presence of algae and a higher volume of salts. They can also survive tides, unlike SWRO, which can be damaged by tides in the form of the misalignment of the Bipolar Membrane. Thus, thermal desalination techniques do not cause maintenance and operational expenses [11,21]. The climate impacts are severe in the Middle East and North African region (MENA). In many instances, photovoltaic-based reverse osmosis (PV-RO) desalination techniques have produced favorable results as compared to thermal desalination techniques (MED, MSF) [22]. Cost-effectiveness and low CFs are two prominent features of PV-RO techniques. Also, their modular characteristics make them favorable to be used in decentralized systems [6]. Upon examining the feasibility of solar-integrated techniques, evaluating their sustainable aspects is crucial, where they could work along with different other desalination techniques, working with various solar collectors as a hybrid system for desalination.
There is a lesser focus of researchers on presenting a comprehensive and comparative analysis of different solar desalination technologies and their ecological footprints. When it comes to adopting a hybrid system where solar energy systems are integrated with desalination techniques, it must be followed by a cost–benefit analysis of this integrated system. The motive of selecting integrated and hybrid systems must be concentrated on environmental sustainability as part of both the short-term and long-term policies [23]. Besides the environmental footprint, economic benefits can be ensured by using renewable energy. A proper understanding of the different configurations of renewable energy systems, integrated with desalination, can yield high economic merits, providing a chance to implement climate change mitigation strategies, particularly in developing countries [24]. An improper understanding of such renewable-energy-based desalination techniques can have consequences, resulting in a misinformed environmental policy at a governmental scale [25]. The success of such policies depends on a complete understanding of the environmental impacts associated with renewable-energy-based seawater desalination systems [26]. Another aspect of this paper incorporates the integration of Electrodialysis Bipolar Membrane (EDBM) technology with a Seawater Reverse Osmosis (SWRO) desalination procedure. The SWRO desalination process can be regarded one of the most cost-effective and highly economical processes when compared to the various commercially available desalination technologies [27]. SWRO currently dominates the desalination technology market share at an estimated proportion of 65.0% of the total available capacity installed globally [28].
Even though SWRO is a well-established and widely implemented alternative to desalination, SWRO has its drawbacks, including (i) discharged waste into aquatic ecosystems, i.e., water bodies, (ii) GHGs released into the environment, and (iii) relatively high consumption of energy. The generation of hyper-saline brine streams is equivalent to the volume of freshwater generation during the SWRO process [29]. The salt concentration in the discharged brines during the SWRO process ranges at estimated levels between 44.00 g/L and 75.20 g/L [30]. It can be concluded that the concentration of brine is approximately two-fold higher than in seawater. Brine discharge (BD) during the SWRO process consists of small amounts of different chemical species which are used during the pre-treatment and cleaning stages. The main concern lies in the fact that the brine produced during SWRO is discharged directly into the seawater. Currently, there is no alternative technology on the market to cater to the proper disposal of brine in situ. This includes the need to address the technicalities of the process, social and economic restraints, as well as the environmental feasibility of waste effluents rather than direct disposal into aquatic ecosystems, i.e., seawater, lakes, streams, etc. [31].
Nevertheless, some researchers have discussed the impacts of the disposal of brine on aquatic ecosystems [32,33,34,35,36,37,38,39,40,41]. Such discussions have led to the assumption that the desirable levels of brine disposal concentration are lower than the typical concentration of the brine disposed, which ultimately results in defining two approaches concerning the brine disposal methodology, namely (i) disposal of the brine effluent in vacant vegetation areas or (ii) the process of brine effluent treatment for the reduction in concentration levels, allowing for their valorization [42,43,44].
Electrodialysis using Bipolar Membranes (EBDM) is regarded as an ideal and emerging technology that is utilized in the treatment and valorization of discharged brines during the SWRO desalination process [45,46,47,48,49,50]. EBDM technology can be regarded as having great potential in the treatment and valorization processes concerning the brine generated during the desalination process. The inputs to the EBDM treatment plant consist of (i) brine, i.e., a mixture of Sodium Chloride (NaCl) and water, and (ii) energy, which are used to produce Hydrochloric Acid (HCl) and Sodium Hydroxide (NaOH) as outputs. The EDBM-generated output, HCl and NaOH, can be classified as commodities incorporated into a wide range of industrial processes, including the process of desalination. Both HCl and NaOH mixtures are required during the stages of (i) pre-treatment, i.e., adjustments in the PH levels, (ii) cleaning, and (iii) maintenance, with the estimated consumption of sulfuric acid (H2SO4) ranging between 15.0 mg/L and 100.0 mg/L during the overall stages [49].
It has been estimated that around 76.0 million tons of equivalent CO2 is produced in desalination process plants worldwide [50,51]. However, the integration of the SWRO desalination process with renewable energy sources has the potential to reduce the generated GHGs, i.e., CO2, by an estimated 90.0% at a global scale [52].
The environmental merits of substituting conventional energy sources with renewable energy sources in desalination are numerous [49]. The integration of EBMD with solar PV can address the challenges of brine management associated with the conventional SWRO desalination process. When considering the advantages of the EBDM technology being integrated with solar PV, it is vital to conduct a comprehensive life cycle impact assessment (LCIA) to evaluate, on an overall basis, the ecological effects of such desalination techniques.

3. Materials and Methods

The study conducts a life Cycle impact assessment (LCIA) that compares alternative seawater desalination techniques. References are made to common desalination methods i.e., MSF, RO, and SWRO.
The process of desalination incorporates the conversion of a saline water supply into freshwater (potable), utilized by the human population in households. The resource (input supply) to the seawater desalination systems is utilized at a larger scale depending upon the seawater source. Nonetheless, another option is to use brackish (saline) water from aquifers.
The process of desalination can be segregated into two forms, namely thermal desalination and membrane desalination processes [53]. Thermal desalination is a historical procedure that is used in desalting seawater or saline (brackish) water based on a distillation technique followed by evaporation and boiling stages [54]. The thermal energy requirement is catered to via its generation using steam turbines, waste and recovery heat boiler units, and extraction, or via the back-pressure steam generated by steam turbines in power stations.

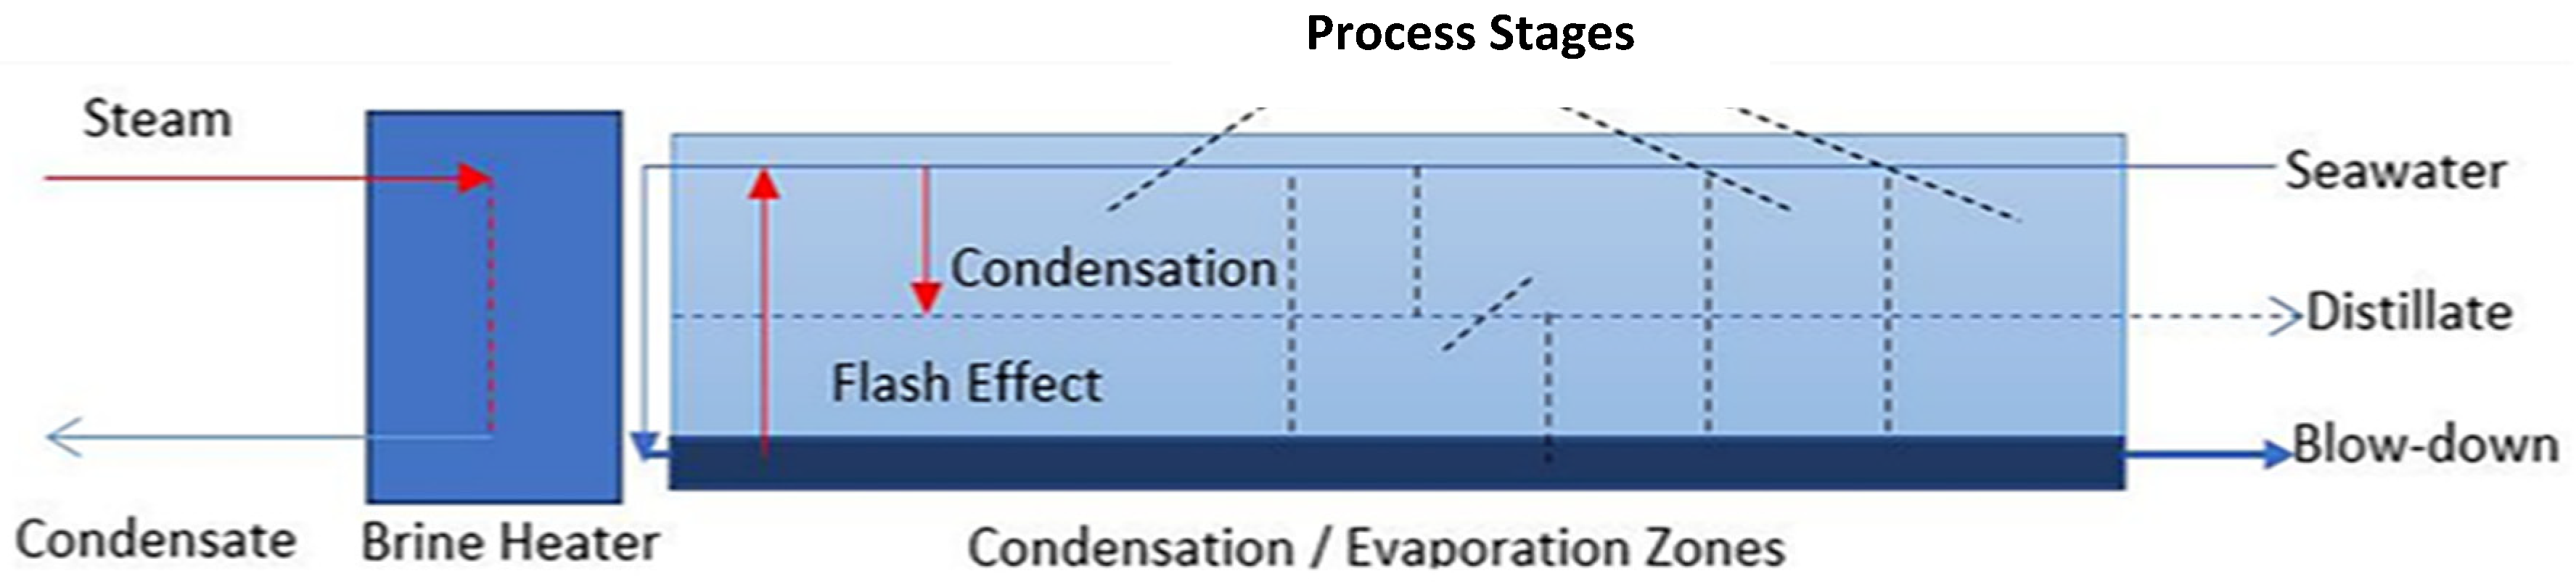
3.1. Multi-Stage Flash (MSF) Desalination Process

Figure 1 outlines the overall MSF desalination schematic, where the processes of evaporation followed by condensation occur at many stages, henceforth increasing the overall process efficiency. The seawater supply to the MSF system passes via a heat-exchanging tube mechanism where the condensation of the high-temperature incoming seawater occurs at the exterior surface geometry of the heat-exchanging tubes. The condensate is further passed along the brine heating unit, where the throttled steam via an exterior basis delivers the input energy for conducting the MSF procedure. This results in increasing the levels of seawater to an extreme level. The pressure decreases further when the seawater at the highest temperature passes through an evaporator, causing its flashing or boiling. The process reiterates itself over several stages, with a gradual reduction in seawater pressure to ensure flashing at lower temperatures. The distilled pure water is supplied at the outlet of the MSF desalination plant.

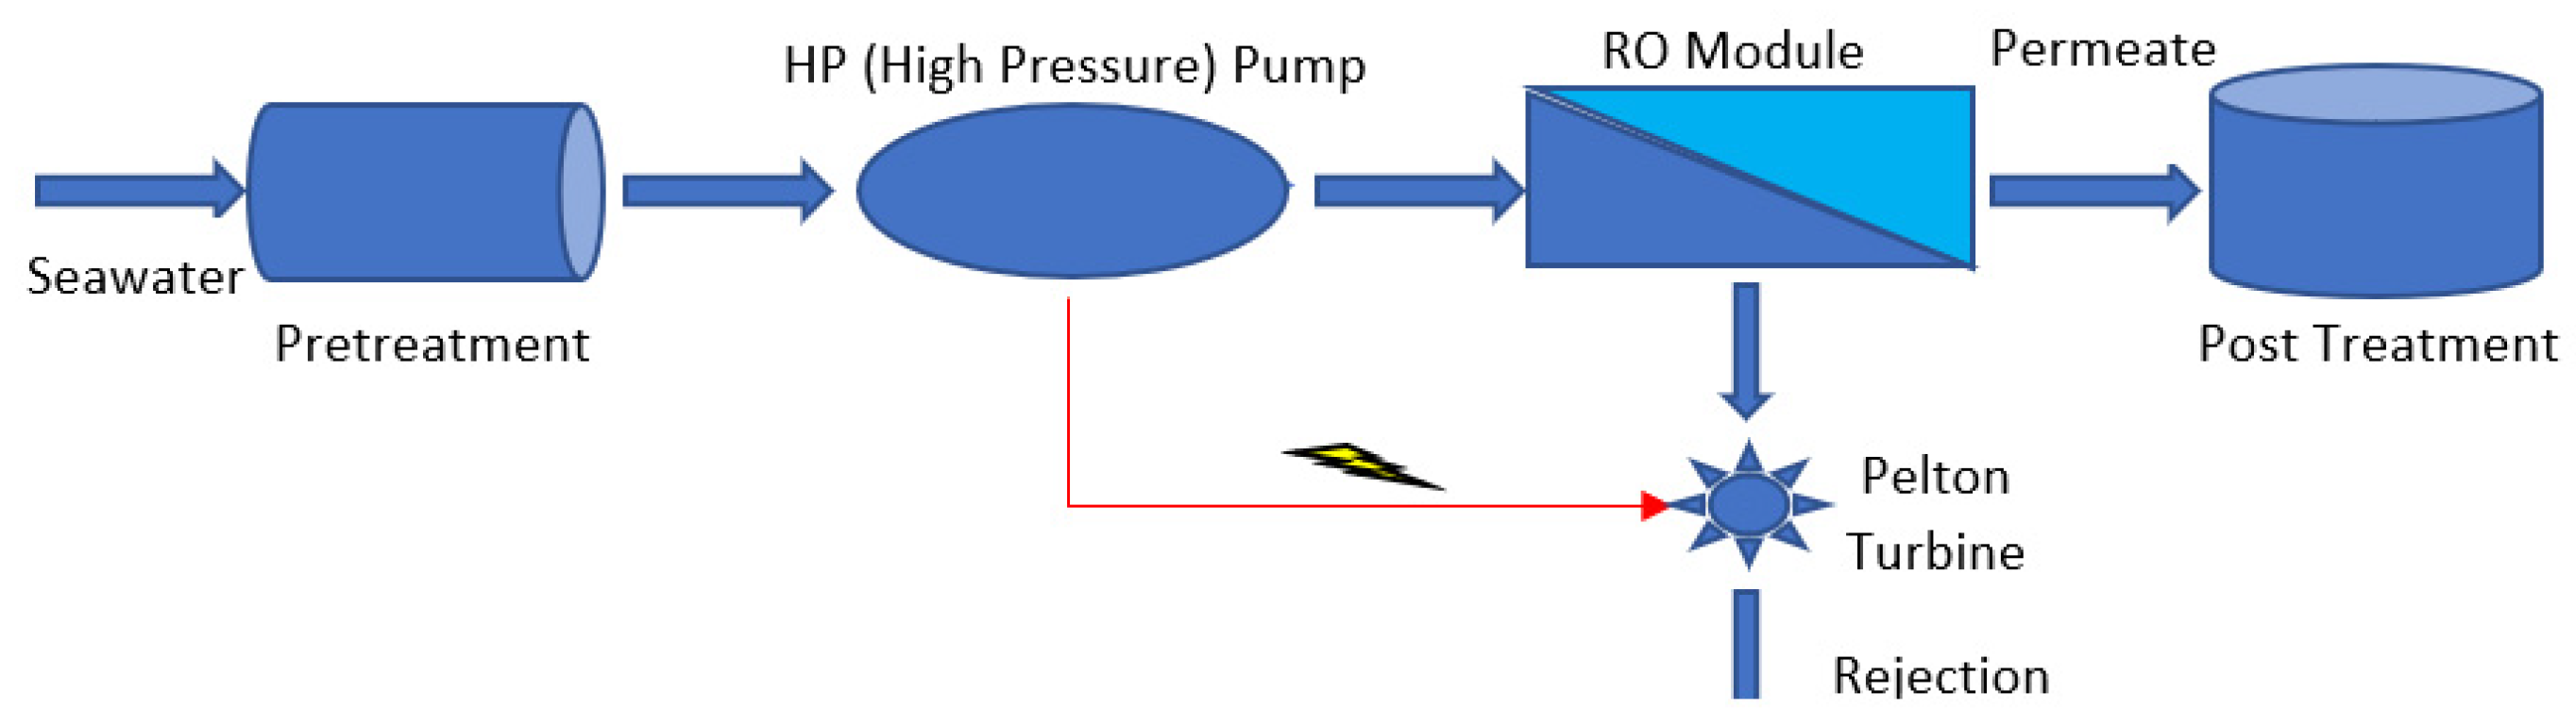
3.2. Seawater Reverse Osmosis (SWRO) Process

The membrane desalination process is used in the desalination process via the incorporation of semi-permeable and ion-specific membranes. The membrane desalination is based on a separation phenomenon instead of distillation. However, the option of membrane distillation can also be applied. The RO membrane configurations permit the flow of water and restrain the flow of ionic salts. Only a small percentage, i.e., 1.0% of the sea salts, manages to pass through the membranes or the leakage passages around the pressure seals. The RO technology is implementable in the cases of potable drinking water. The operating pressure of the reverse osmosis technology can be defined as a function that correlates with salinity as a function of the feed water [55]. The main energy input mechanism to the overall RO process is the driving force generated by electrical pumping mechanisms. A characteristic reverse osmosis plant is illustrated in Figure 2.
The seawater incorporated into the system is partially desalted, with a proportion rejected at the outlet as brine. The mechanical energy of the brine solution pumped at an outlet is utilized in the energy recovery units before being transported into the sea, which saves a significant amount of energy.

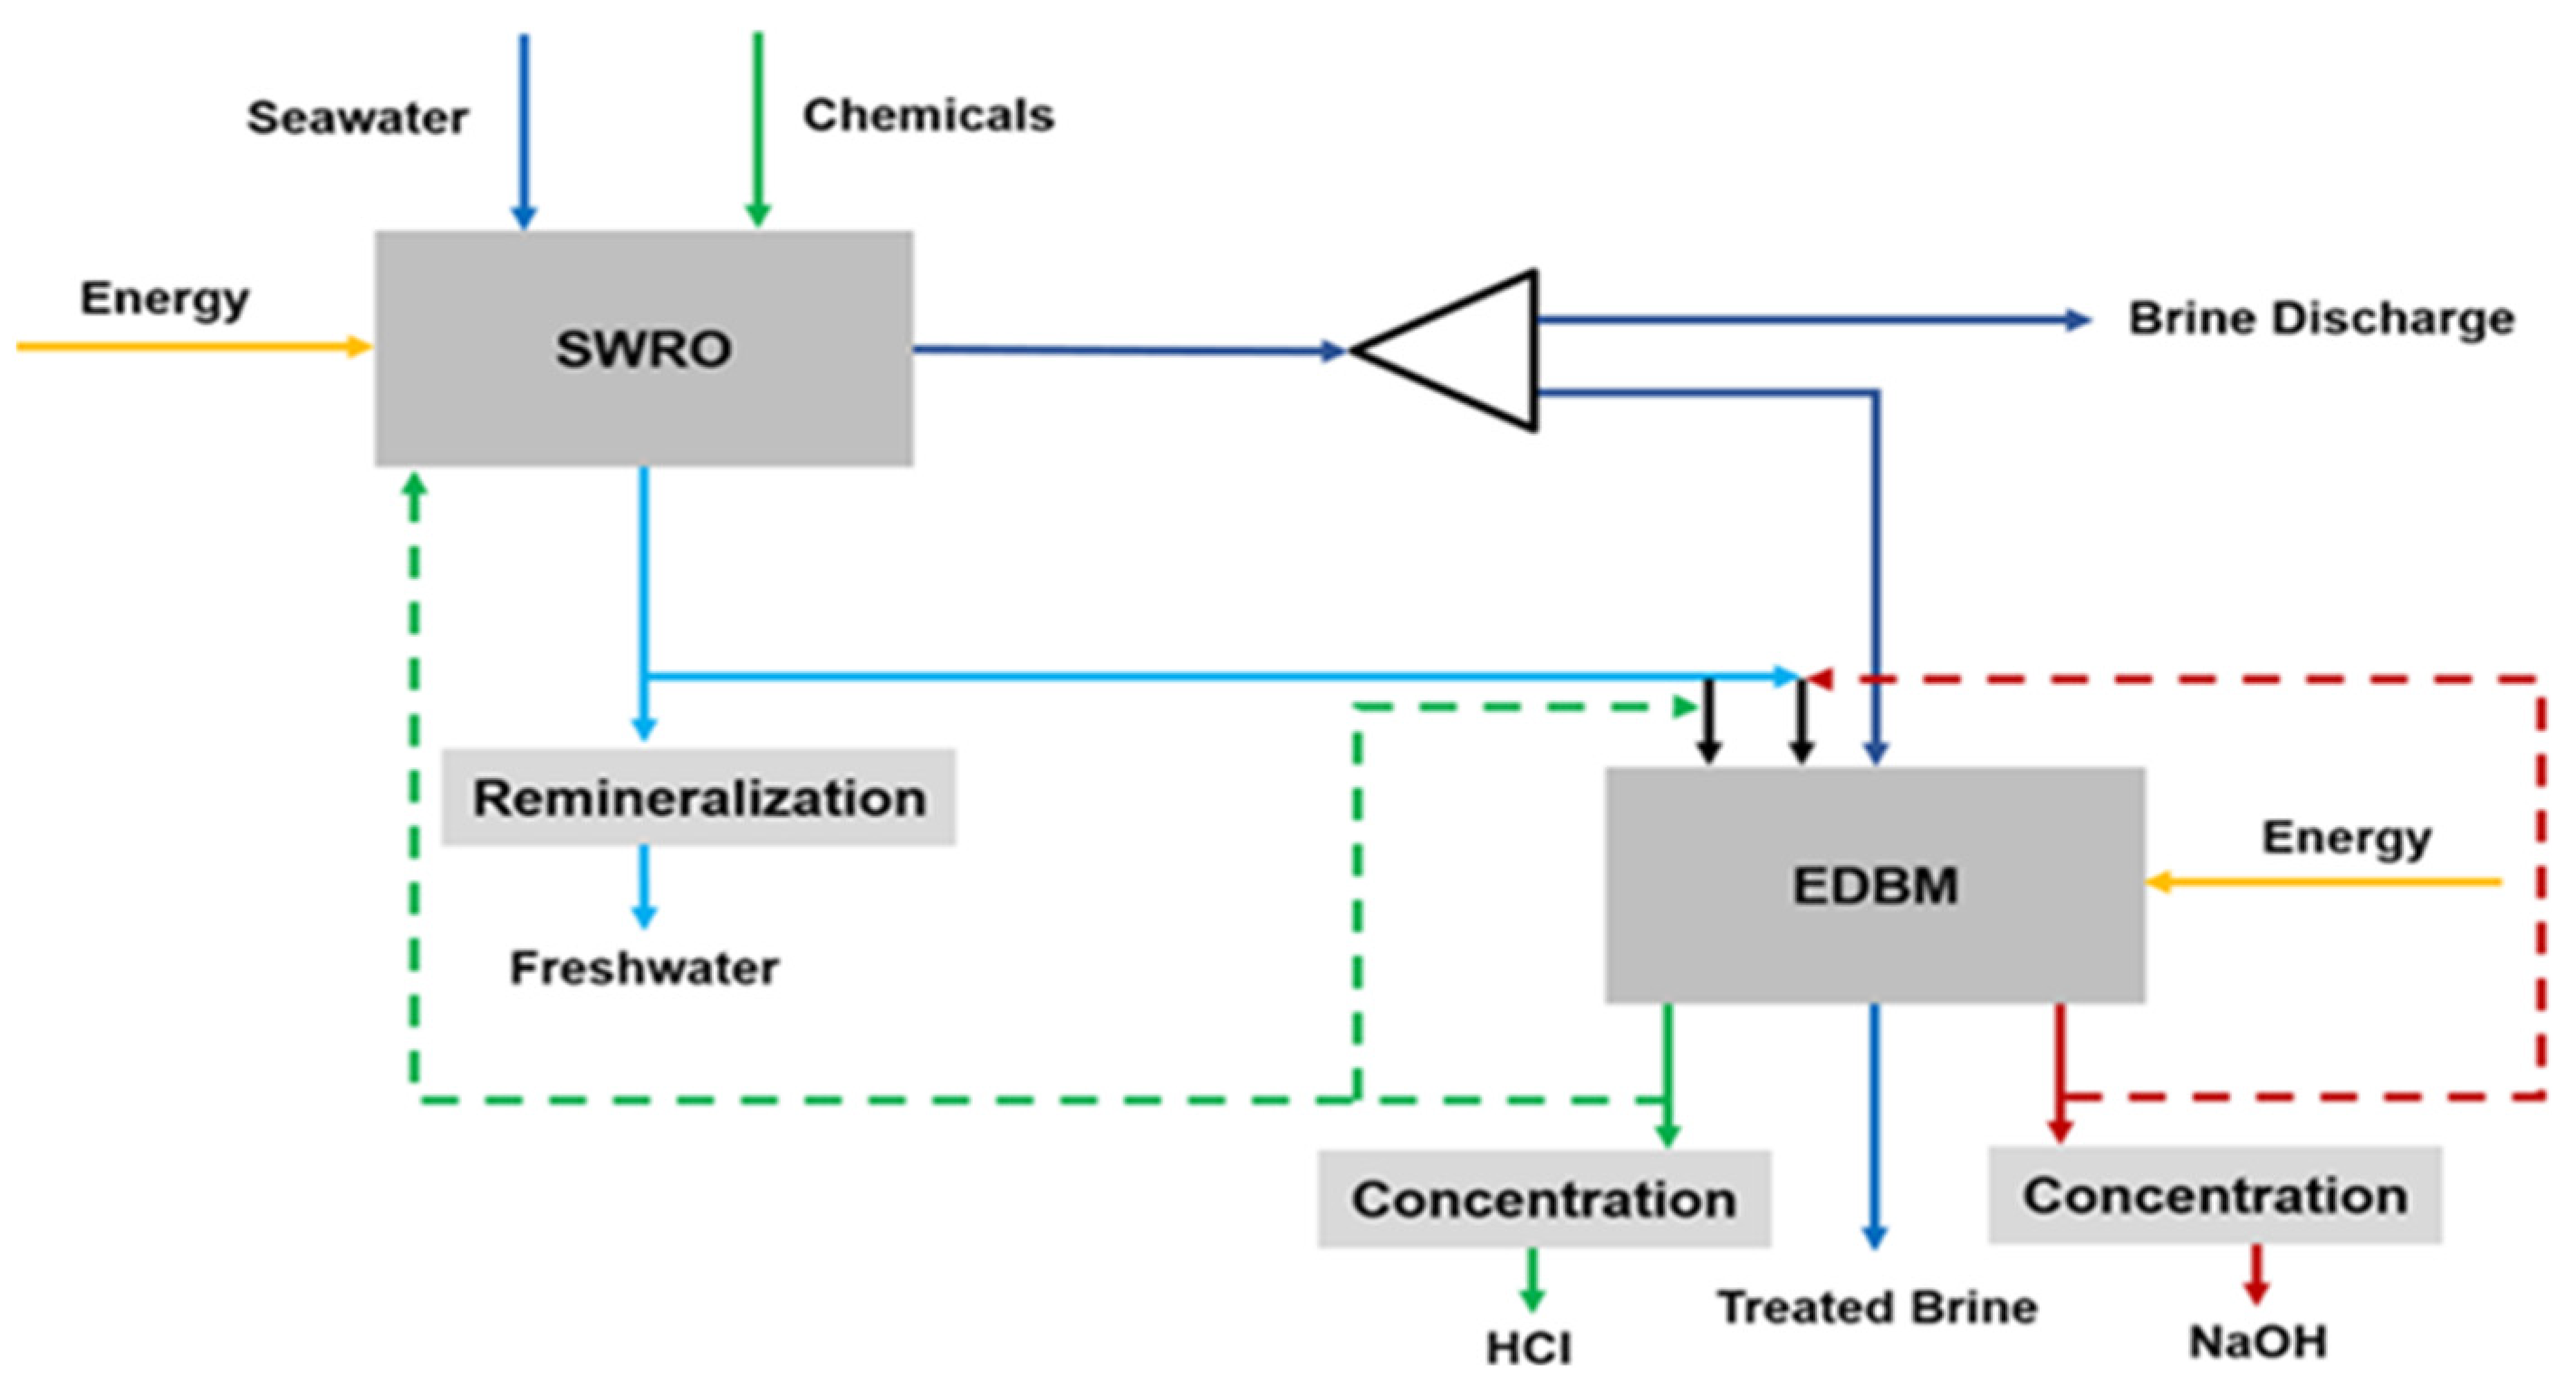
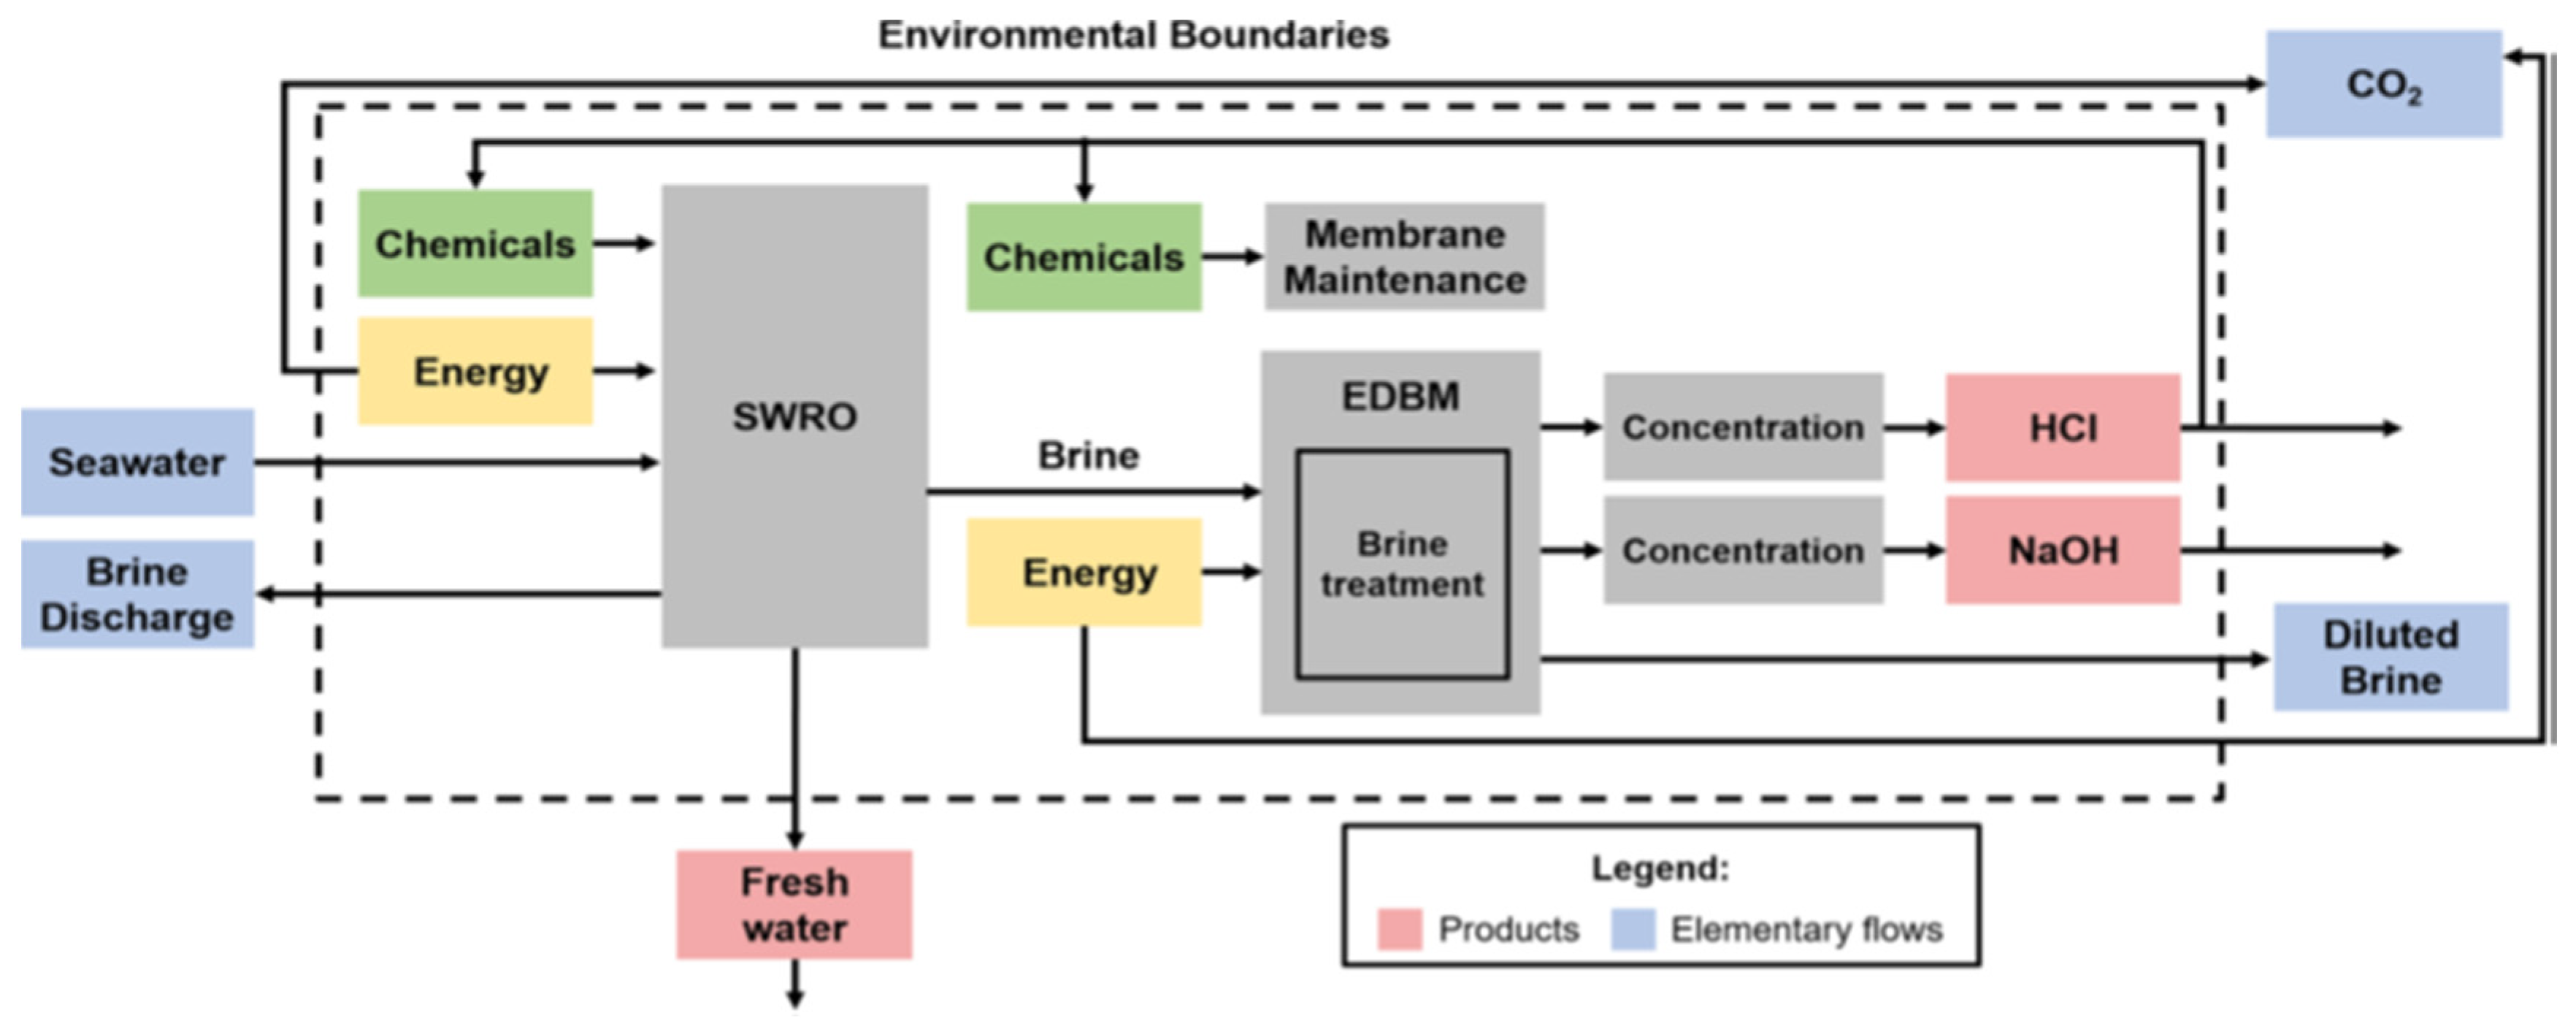
3.3. Integration of Electrodialysis with Bipolar Membranes (EDBM)

Electrodialysis with Bipolar Membranes (EDBM) based on SWRO desalination technology has a direct influence on environmental burdens. These are associated with the conventional SWRO desalination process, including (i) climatic conditions (incorporated into the study as CF) and (ii) the alteration of the ecological indicators associated with the nearby environment as a result of the disposal of brine [56]. These challenges with SWRO desalination are tackled using the incorporation of EDBM driven by PV solar-energy-based technology [57]. The brine generated in the process is utilized to produce HCL and NaOH, as both are used in desalination process plants [57]. In this way, environmental advantages are achievable through the self-supplying potential of the generated fluids.
The study in this paper involves an environmental sustainability assessment via a LCIA of the SWRO desalination system, incorporating the EDBM technology. Four different scenarios are investigated, taking into consideration the proportion of treated brines during desalination. These scenarios were selected to analyze the influence of the power generation grid mix on environmental sustainability outcomes. The electrical generation systems considered in the study include (i) PV solar energy with 100% renewable energy sources, (ii) the mean Spanish grid energy mix with 36% renewable energy source(s), and (iii) the mean Israeli grid energy mix with 1.90%. The objective is to examine the environmental sustainability of the EDBM brine treatment system, which caters to the produced bases and acids combined with the SWRO desalination plant while giving special consideration to the arising implications of the volume of brine processed. The main focus of the study is to examine the effects of the SWRO, including (i) direct brine disposal into seawater and (ii) indirect GHGs emitted during the energy-intensive desalination process. Considering the commercialization and distribution of the generated products outside the facility premises, the concentrations are to be configured stage-wise as illustrated in the given flow diagram (Figure 3).
The system boundaries of the SWRO desalination unit integrated with the EDBM unit were defined to focus primarily on the environmental impacts associated with the desalination process itself, as well as the brine treatment using EDBM. This deliberate scope allows for concentration on the core research objectives related to environmental sustainability and environmental assessments. Certain stages, such as construction and transportation, were not considered, as they fall outside the immediate scope of the study and do not directly impact the environmental performance of the integrated system. The focus is on evaluating the environmental implications of the desalination and brine treatment processes.
The SWRO desalination unit comprises the following stages: (i) pretreatment, (ii) high-pressure pumping, (iii) post-treatment, followed by membrane cleaning. The operation stages as well as the usage of substances and exhausted energy during the process are considered. The stages consisting of plant construction dismantling and transportation are not considered. The system boundaries of the SWRO desalination unit integrated with the EDBM unit are illustrated in Figure 4.

4. Life Cycle Impact Assessment (LCIA) Framework

LCIA is used in the quantification of environmental impacts associated with systems considering a cradle-to-grave analysis across multiple categories of impacts [58]. Quantifying the associated impact levels becomes challenging because solar-energy-based desalination technology has lower energy-related impacts compared to fossil-fuel-based desalination systems [59]. This challenge introduces uncertainty. The associated environmental impacts of the EDBM technology together with its integration into the PV-based solar renewable energy desalination system will be assessed.
Numerous life cycle assessment studies on drinking water production techniques have been published since the early 2000s. These studies primarily focus on comparing various water treatment and desalination methodologies [60,61,62,63]. Additionally, some studies have concentrated on highlighting major areas in various procedures associated with higher energy usage. Researchers such as Meneses et al. [28], Shahabi et al. [52], Cherchi et al. [64], and Aleisa and Al-Shayji [65] explored these areas. Moreover, the research addressed issues related to brine disposal, as evidenced in the LCIA analysis conducted by Meneses et al. [28], Zhou et al. [66], and Zhou et al. [67]. Other LCIA studies [68,69] provided alternative solutions by comparing different freshwater supply options.
The paper aims to figure out the association between renewable energy and seawater desalination technology considering multi-regional and multi-criterion environmentally based scenarios, providing a clearer picture of the life cycle impacts associated with solar energy desalination systems. The adoption of this approach will lead to the facilitation of the recommended course of action in catering to the challenges of Global Climate Change and Water Policies as indicated in the United Nations Sustainable Development Goals (SDGs) No. 06 (Clean Water and Sanitation Provisions) and No. 07 (Clean and Affordable Energy Policy), together with the corresponding objectives and indicators, including (i) 6.1, (ii) 6.4, (iii) 6.A, (iv) 7.1, (v) 7.2, and (vi) 7.A and 7.B, as described by the UN relevant to solar-based desalination technology, yielding reductions in water stress levels globally, thus increasing the proportion of renewable energy sources in the global overall energy supply mix [18]. The main objective of the life cycle impact analysis is the quantification of the impacts on the environment during the production of 1.0 m3 of freshwater via solar-based Multi-Effect Desalination (MED) plant(s) installed at different locations globally [18].
Thus, the objective of the LCIA analysis is to examine the environmental sustainability in terms of the associated impact levels of an EDBM brine treatment system, integrated with a PV-based thermal desalination system. The EDBM system analyzed also caters to the treatment of effluent brine to produce the acids and bases used in the SWRO desalination plant, with special attention given to the implications which arise due to the volume of treated brine in the overall desalination process. The analysis is in the context of the whole life cycle with a focus on the main SWRO environmental disadvantages, including (i) the direct disposal of brine into seawater, and (ii) the resultant GHG production on account of the energy-exhaustive process of desalination. To identify the issue of brine disposal, the volume of waste brine released is used as a metric. The CF is measured and incorporated as an ecological metric concerning the usage of energy. An analysis of four different scenarios is carried out concerning the volume of brine effluent pumped for the treatment process. Lastly, a sensitivity analysis concerning the electrical energy input (supply) is performed, which provides three different alternatives per scenario analyzed.

5. LCIA of EDBM Integrated with SWRO Desalination System

5.1. Description of the System and the Functional Unit

The integration of EDBM technology with an SWRO desalination system can be viewed as two main sections, i.e., (i) the SWRO desalination system, and (ii) the EDBM technology. Two inputs to the system are considered, including (i) seawater and (ii) chemicals, i.e., NaOH and HCl. The system material outputs comprise five streams including the (i) freshwater stream, (ii) NaCl-concentrated brine, (iii) HCl, (iv) NaOH, and (v) NaCl post-treatment brine. The overall process is shown in Figure 3 and the system environmental boundaries of the integrated SWRO desalination system are also shown in Figure 4. In the analysis in this paper, the operational stages have been considered, and they incorporate the use of NaOH and HCl as well as consumable energy sources.
The SWRO process incorporates the stages of (i) pre-treatment, (ii) highly pressurized pumping, (iii) selective membrane type, (iv) post-treatment, and (v) cleaning of the membrane. An estimated mean seawater concentration of 31.80 gm/L is considered, which fluctuates between 20.0 gm/L and 50.0 gm/L, as indicated by Jones et al. [70], whereas a concentration level of 63.50 gm/L is considered in the case of the NaCl brine. The outcomes of this experiential work exhibited that the creation of 1.130 mol/L of HCl and NaOH solutions is attainable via the EDBM process. The experimental analysis shows that the water evaporation during the process yields a concentration level of 30.0% by weight of HCl and 98.0% by weight of NaOH.
In this paper, a comparison between the energy grid mixes of the Spanish energy grid mix, Israeli energy grid mix, and PV solar electrical energy mix supply is provided. Both Spain and Israel, among other countries, face severe water scarcity and shortages; therefore, they rely primarily on desalination technology to make up for the population’s freshwater demand [71].
Currently, both Spain and Israel are key exporters of SWRO desalination technology worldwide [71], holding ranks in the top 10 worldwide country rankings. According to the overall installed desalination capacity, Spain has a desalination capacity of 5 million m3/day [72] and Israel has 585 million m3/year [73]. Moreover, the condition of solar irradiation in Israel is 2000 kWh per sq/m [74].
The functional unit of the SWRO integrated with EDBM technology is described as producing 1.0 m3 of freshwater during the desalination process. Table 1 outlines the energy grid mix composition of Spain and Israel with the proposal of a single CF value for each source of energy [75] among a wide array of reported standards used in the published studies, described primarily by the IPCC [76].
To consider the use of EDBM in brine treatment during desalination, the study proposes four different scenarios. Additionally, we analyze three distinct electrical power supply sources: (i) 100% PV solar energy, (ii) 36.0% Spanish energy grid mix, and (iii) 1.90% Israeli energy grid mix. A complete analysis of the scenarios is illustrated in Table 2.
In Table 2, the first scenario represents a freshwater supply with 100% brine disposal; hence, it is taken as the reference scenario. The remaining second, third, and fourth scenarios incorporated the EDBM technology into the process of brine treatment to produce the chemicals HCl and NaOH, thus eliminating the external purchasing requirements for incorporating reagent(s) into the process. Nevertheless, brine treatment is carried out stage-wise with different volumes of brine treated. The second scenario involves the production of only those reagents with a self-supply requirement, which allows for 1.80% of brine treatment depending on the maximum HCl dosage during the process. The proposal of overproducing the reagents in the third and fourth scenario(s) is made to market the reagents produced for commercial purposes. The third scenario considers 50.0% brine treatment. Whereas, the fourth scenario considers an overall (complete i.e., 100%) brine treatment. In summary, a SWRO plant is represented by the first scenario, a SWRO plant with self-supply of reagents is represented by the second scenario, and a SWRO plant integrated with a production plant of commercial reagents is represented by the third and fourth scenario(s), respectively.
The assumptions and hypotheses about the LCIA study have been summarized as follows:
  • The desalination plant’s infrastructural details such as construction and dismantling are not considered in the LCIA analysis.
  • The stage(s) of transportation regarding the reagents both into and out of the desalination plant have not been considered in the structural limitations of the LCA.
  • An overall electrical energy consumption by the SWRO plant of approximately 3.0 kWh/m3 of desalted seawater has been assumed [80]. Therefore, assuming 50.0% freshwater production using the SWRO desalination system [32], an electrical energy consumption of 6.0 kWh/m3 of freshwater production is considered, which comprises the (i) pre-treatment stage, (ii) a highly pressurized pumping stage, (iii) a selective membrane stage, the post-treatment stage, and (iv) cleaning of the membrane [2].
  • The brine (NaCl) concentration is assumed to be 63.50 g/L of NaCl [75].
  • The seawater concentration is assumed to be 31.80 g/L of brine (NaCl) [75].
  • The EDBM plant’s energy consumption is assumed to be 4.40 kWh/kg of HCl reagent at a laboratory scale.
  • The heat energy input required during the stages of concentration of acid (35.0% volume, i.e., HCl) and the base (dry product, i.e., NaOH) is estimated using the water’s latent vaporization heat of 2257.0 MJ/ton until the desired five purity levels. The CF in the case of steam is taken as 0.2940 kg CO2 equivalent kW/h.
  • The density of seawater is approximated at 1000 kg/m3.

5.2. Life Cycle Inventory (LCI)

The mass and energy balance is undertaken to obtain the required data for the Life Cycle Inventory (LCI) analysis of the four scenarios defined in Table 2. The data are obtained from updated research and references (Table 3) outlined to elaborate the SWRO inventory of the plant section. The EDBM plant section’s data are extracted from previously conducted research [75]. The overall inputs and outputs consider 1.0 m3 of freshwater concerning the individual scenarios (Table 3). Table 3 shows that both EDBM and SWRO consume high electrical energy, which further clarifies that the determinant of environmental impacts, and the CF is the production of electrical energy as an input to the desalination system.
Considering the SWRO system unit, the energy incorporated during the pumping of seawater intake, as well as for pumping at high-pressure levels, generates a sufficient pressure gradient. Hence, it allows the flux of water via the membranes. Energy conservation is achievable using the recovery mechanisms. The EDBM unit, on the other hand, consumes energy during the generation of an electrical potential difference, which allows the ionic flux through the membranes. The main effluents generated during the process consist of brines: NaCl.

6. Results and Discussion
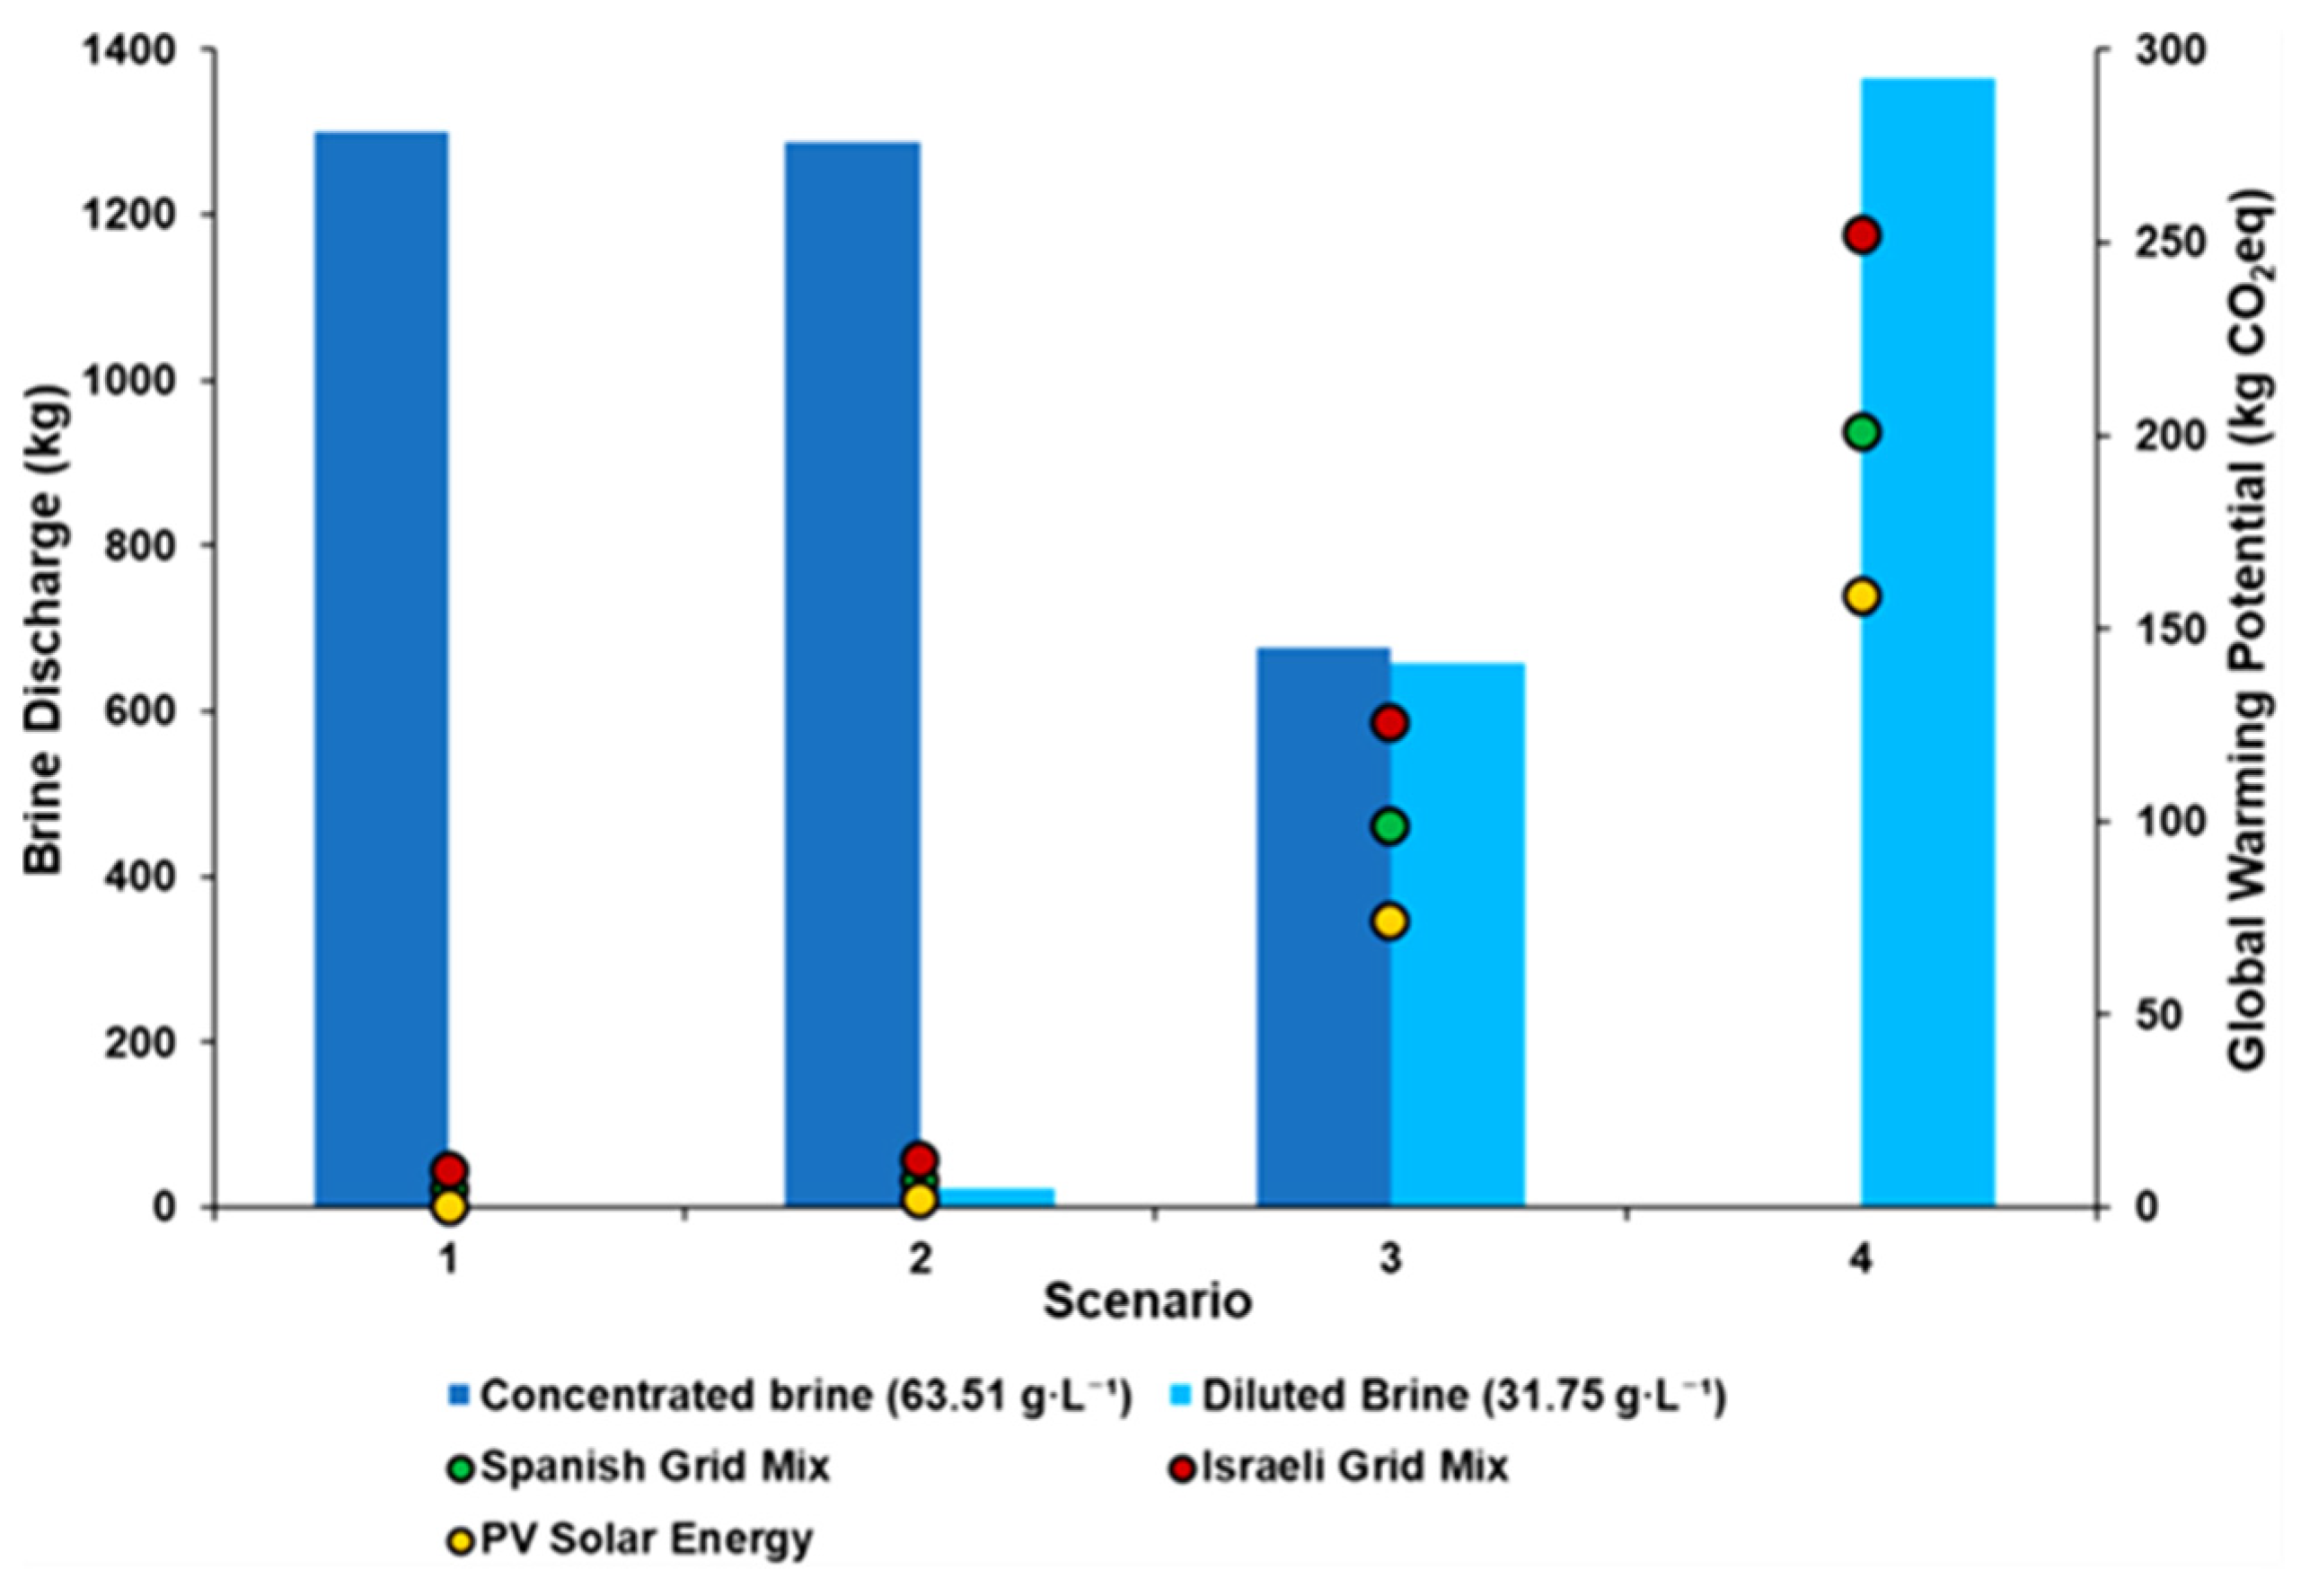
A life cycle impact assessment (LCIA) was performed using the Gabi 6 software [81] integrated into the Eco Invent database (Swiss Centre for Life Cycle Inventories 2016), which enabled the estimation of associated environmental impacts (burdens) due to the individual processes in desalination systems. The main impact category chosen is climate change (CC), particularly owing to the indirect emissions which are associated with the higher energy requirement levels in operating desalination systems. The CF is incorporated as environmental problems related to CC. Furthermore, the main environmental impact resulting from desalination as reported by previous studies [82,83,84,85] is the energy consumption during the overall process.
Large volumes of brine are disposed into seawater daily globally, thus having consequences not only in the form of environmental burdens but also resulting in an economic loss for the country in question. The literature examined does not discuss any relevant characterization factors in the overall desalination process. However, consideration has been given to the BD factor. Both the amount (volume) and concentration levels of BD are accounted as contributions to the environmental impact based on the volume discharged and variations in levels of concentration. Hence, the BD factor has been incorporated as a mid-point metric indicator for the effects of discharged brine effluent near the desalination facility. Keeping in view these facts, the concentration levels of the discharged brine effluents range between 31.80 g/L in the case of the NaCl in fully treated brine and 63.50 g/L in the case of the NaCl in direct brine disposal.

6.1. BD Scenarios

Table 4 shows the categories of the environmental impacts chosen for analysis in the study based on the overall BD levels of the four different scenarios discussed in the previous section. BD is calculated using a mass balance method for the four scenarios.
The valorization of brine using the EDBM brings a trivial rise in the overall production of brine. Due to the slightly larger volume of seawater utilized in the generation of 1.0 m3 of freshwater, the increments in brine generated during Scenario 2 are estimated at 0.770% and 5.00% during Scenario 4.

6.2. Life Cycle Interpretation of Outcomes

The SWRO plant comprises brine which consists of a higher proportion of concentrated NaCl solution at 63.50 g/L. However, some residual chemical compounds other than NaCl can be found due to the SWRO pre-treatment stages. The EDBM treatment results in the NaCl concentration in the brines generated being half of the SWRO NaCl value, estimated at 31.80 g/L. Therefore, the total BD mean concentration levels of NaCl [71] in EDBM treatment depend upon the proportion of brine solution supplied as input to the EDBM treatment plant, ranging between 31.80 g/L and 63.50 g/L, i.e., 100.0% and 1.80% proportions of the brine treatment rate (first and second scenario). An inverse relation exists where a larger proportion of the volume of brine NaCl processed using EDBM yields a lower proportion of the mean accumulation of the total BD NaCl. The lowest brine volume is achieved in the fourth scenario, estimated at 31.0 g/L, where the brine treatment rate is 100.0% (all brine NaCl is treated). In the second scenario, a brine treatment rate of 1.80% indicates that the treatment of brine NaCl at 1.80% is not sufficient for the plant requirements of self-supply.

6.2.1. Impact on Climate Change

The selected categories regarding the environmental performance including climate change and BD relevant to the individual electrical energy supply grid mixes analyzed in the life cycle assessment, including the Spanish and Israeli energy grid mixes, are illustrated in Figure 5.
An energy consumption of the SWRO system ranging between 3.0 kWh/m3 and 10.0 kWh/m3 of seawater was indicated [85]. Similarly, an energy consumption of 3.0 kWh/m3 was estimated [79] for the Las Palmas III-IV SWRO plant located in Spain. Considering the Spanish and Israeli energy grid mixes as reported by the IEA [77] in 2015, and the CF concerning the different sources of energy according to the IPCC publication [76], the calculated CF values include (i) PV solar energy, 10.0 kg CO2 eq/GJ; (ii) Israeli energy grid mix, 194.0 kg CO2 eq/GJ, and (iii) Spanish energy grid mix, 94.0 kg CO2 eq/GJ, respectively.
The CF values are calculated concerning the SWRO self-supply mechanism and the reagent generation using EDBM technology based on the Spanish energy grid mix, 6.960 kg CO2 eq/GJ; Israeli energy grid mix, 12.570 kg CO2 eq/GJ, and the solar PV energy grid mix, 2.170 kg CO2 eq/GJ, of the freshwater levels simultaneously. A directly proportional relation exists where an increment in the volume of treated brine NaClconc using EDBM technology leads to an increase in the generated CF during the process of the three electrical energy supply mixes analyzed in this paper. Moreover, in each scenario, the highest CFs were observed in the Israeli energy grid mix, followed by the CF of the Spanish energy grid mix and the CF of the solar PV energy grid mix. The CFs decrease upon an increase in the proportion of renewable energy sources, i.e., solar PV energy, in the overall electrical energy supply with the following percentage increments: (i) the Israeli energy grid mix at 1.90%, (ii) the Spanish energy grid mix at 36.0%, and (iii) the solar PV energy grid mix at 100.0% utilization of renewable energy, in turn.
The incorporation of solar PV energy as a proportion of the electrical energy supplied leads to average CF reductions of 68.80% for the Israeli grid mix and 82.70% for the Spanish grid mix. The main contribution to the CF can be associated with the HCl and NaOH concentration stages, as well as being highly intensive during the consumption of steam in the process.

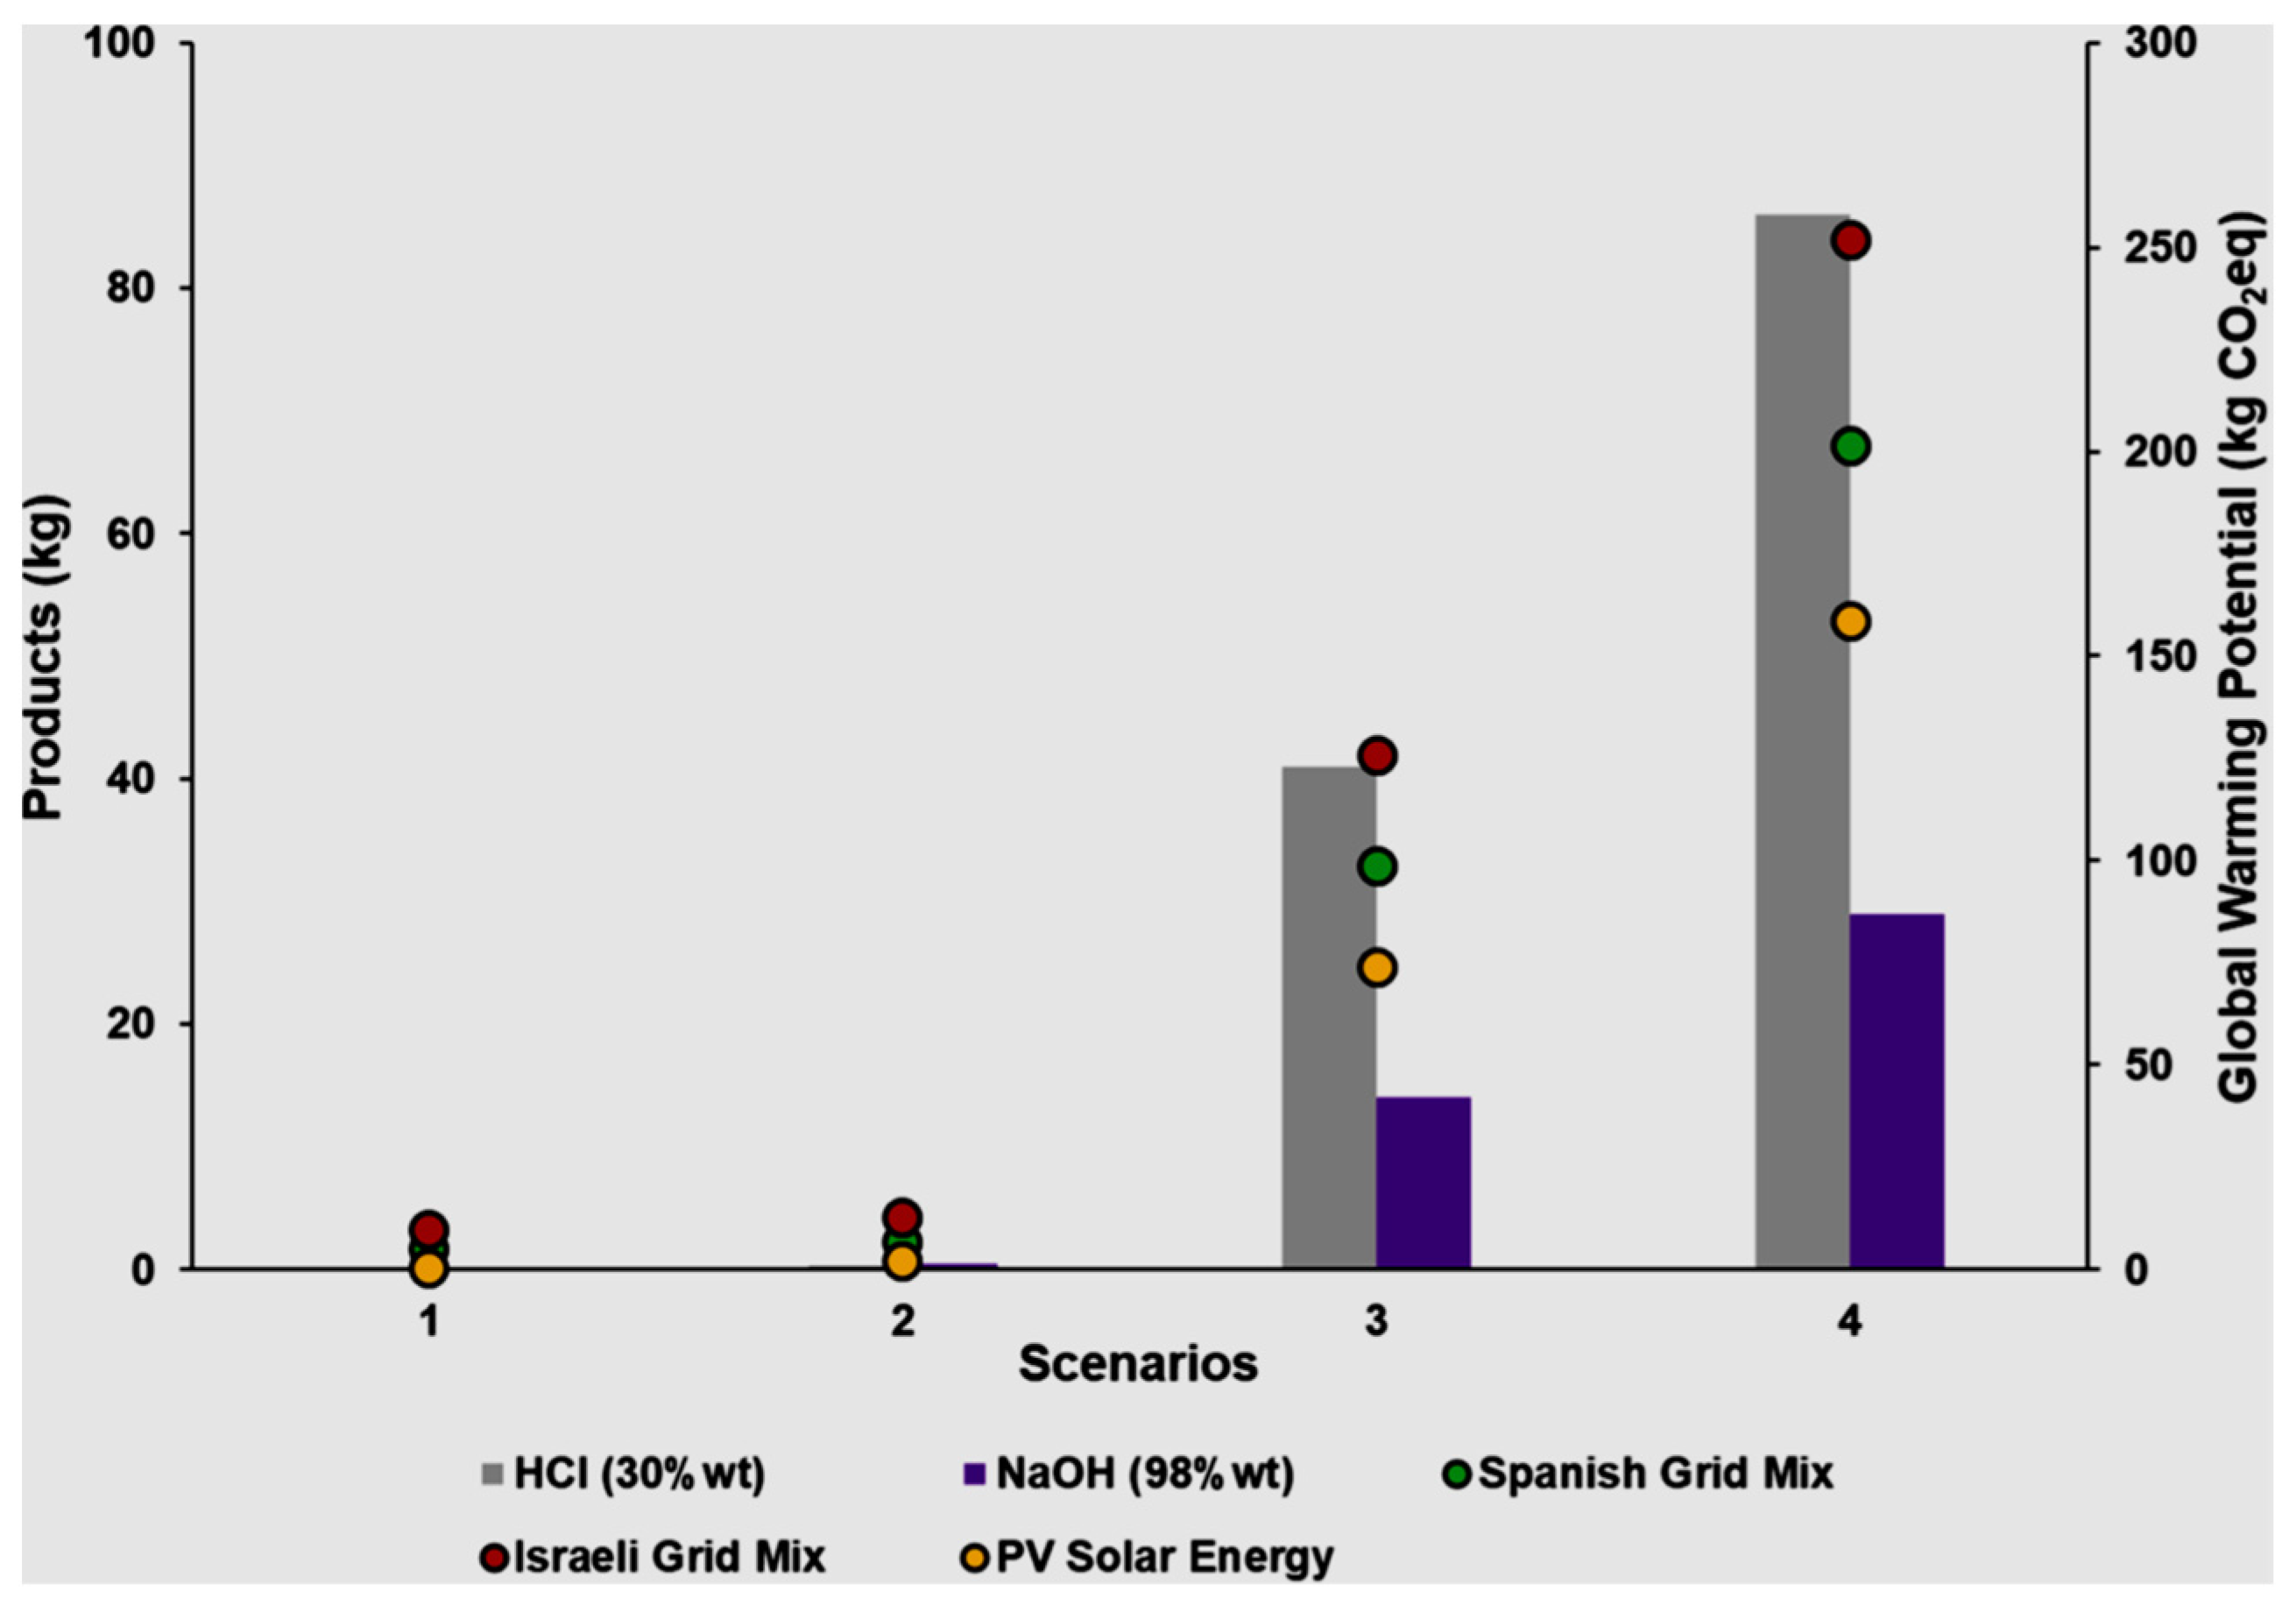
6.2.2. Impact on Global Warming Potential (GWP)

The production capacity and the associated CF levels are compared concerning individual electrical energy supply, and the scenarios included in the analysis are illustrated in Figure 6. The number of products generated within the CF is another aspect that should be incorporated into CF calculations. A higher volume of seawater input is required to produce a 1.0 m3 volume of freshwater output upon an increase in the capacities (concentration) of HCl and NaOH supplied as input. The resultant increase in HCl and NaOH capacities is due to the EDBM system’s freshwater consumption to cater to the acid and base streams. The GHG emissions are the only environment-impacting factor that contributes to the CF in the fourth scenario, with the brine discharge having a similar concentration to the seawater being utilized, thus having a negligible impact on the environment.

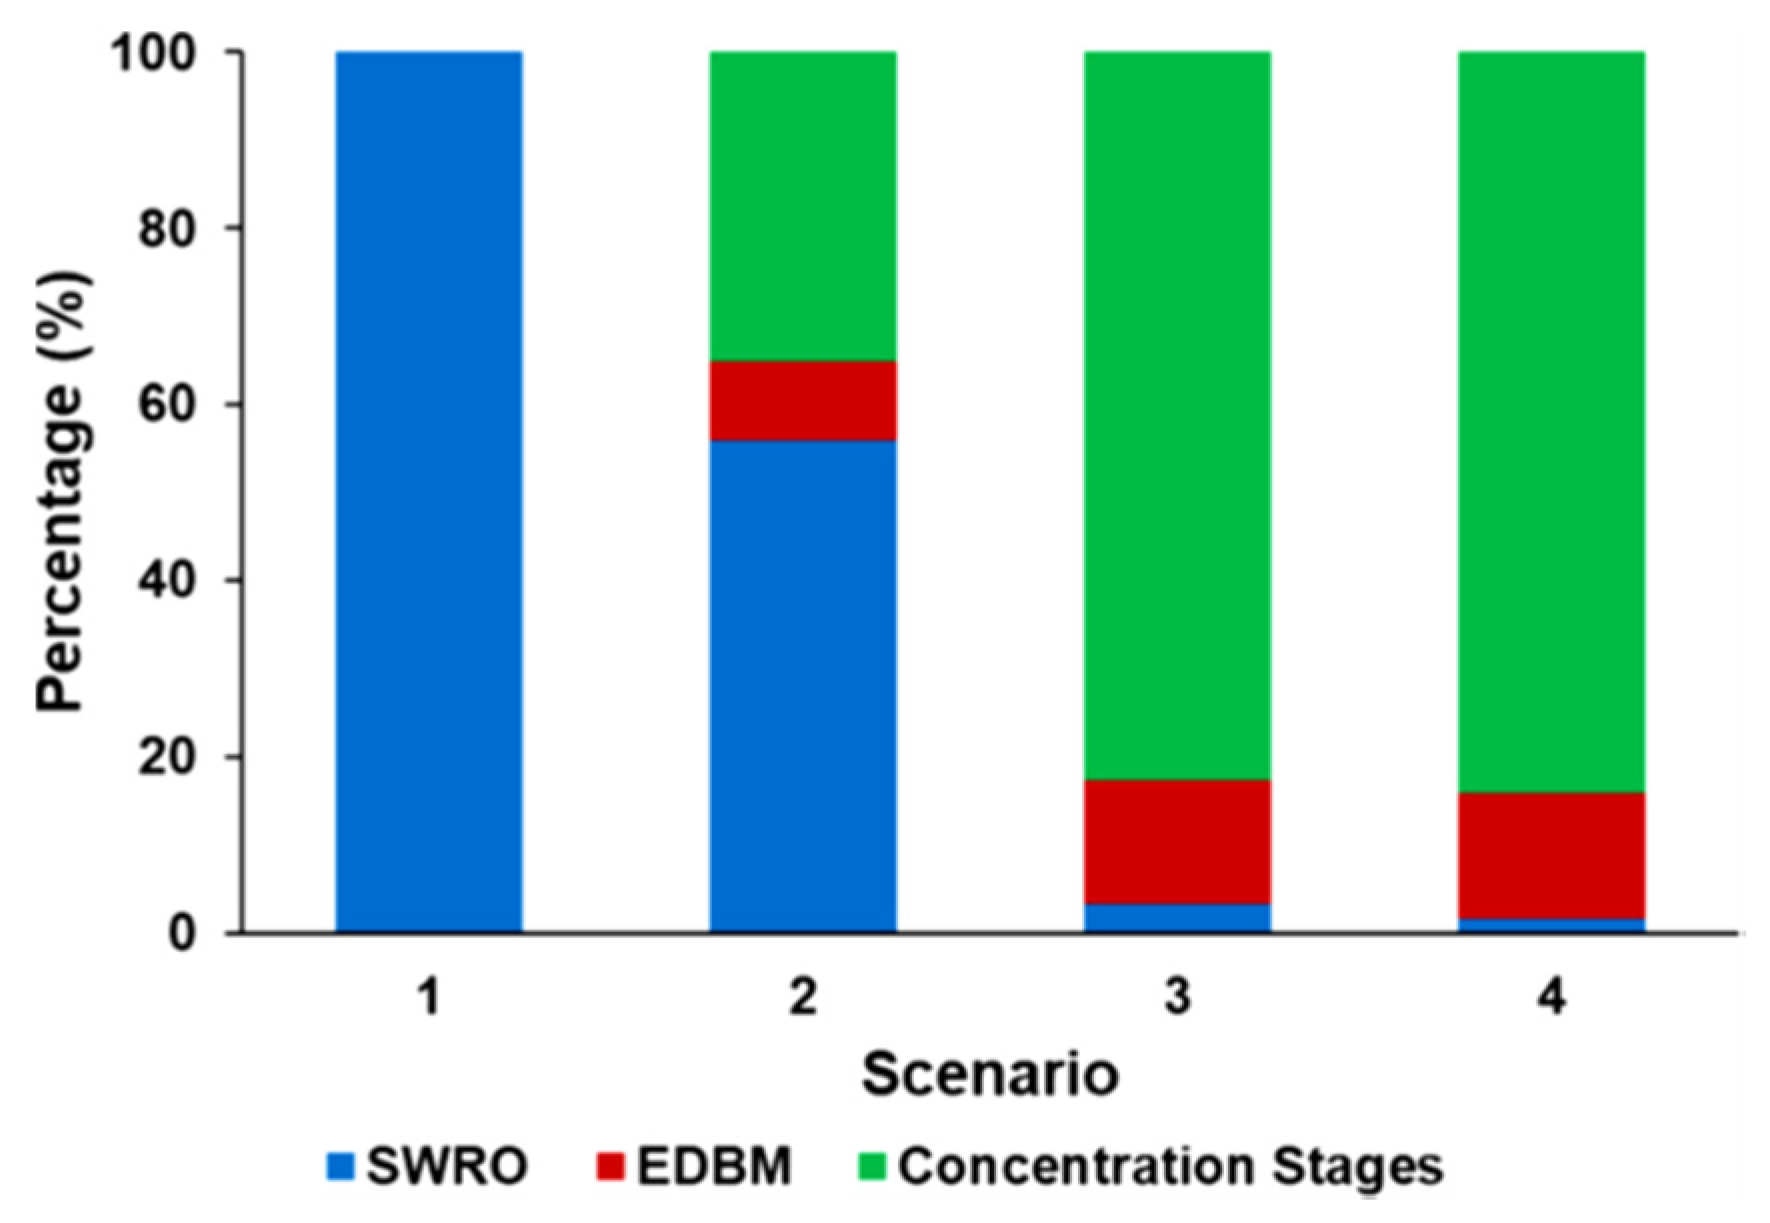
6.2.3. Relative Impact of Desalination System Components

The impact allocated to individual steps in the cumulative CF is analyzed and illustrated in Figure 7. The percentage of individual steps is independent of the incorporated energy grid mixes and depends only upon the relevant scenarios. An increment in the brine treatment percentage, as in the second scenario to the fourth scenario, causes the EDBM impact levels, together with those of the concentration stages, to increase; thus, these are of higher relevance, causing the SWRO to occupy less than 5.0% of the contribution in the third and fourth scenarios. It is observable that the highest energy-intensive stage contributing to the highest CFs is the concentration stage. Irrespective of the brine treatment percentage, whether it may be at the minimum level as in the case of the second scenario, i.e., a 1.80% brine treatment rate, the overall contribution of the concentration factor of the products to the CF is larger than 35.0% and 80.0% in the third and fourth scenarios.
Hence, upon the analysis of the BD and CF of the process, the scenario to be selected can be identified for further operation stages. Figure 8 provides a comparison of the BD and CF parameters for the four scenarios analyzed. A reduction in the BD parameter is dependent upon an increase in the CF, owing to the utilization of energy at the concentration stages of the products. Therefore, a compromise is necessary to be drawn between these conflicting objectives. The third and fourth scenarios are compromised concerning the sustainability of the environment of the incorporated desalination system due to the associated CF levels per unit volume of freshwater produced, which far exceed the CF levels obtained in the first scenario. As a result, the second scenario is preferred since it is a “trade-off” due to the moderate increment in CF levels as compared to the third and fourth scenarios. Nevertheless, the suggested combination may not suffice in avoiding the environmental impacts associated with the BD process, and it is inevitable to recommend analysis of the integration of the desalination system with other zero-liquid-discharge systems. The overall process can be shaped with sustainability by increasing the concentration levels of the products during the EDBM stage to allow for a decrease in energy usage at the concentration stages. In this way, a larger volume of brine treatment is possible without a substantial increase in the CF, particularly in the case where PV energy is incorporated as a part of the desalination system.

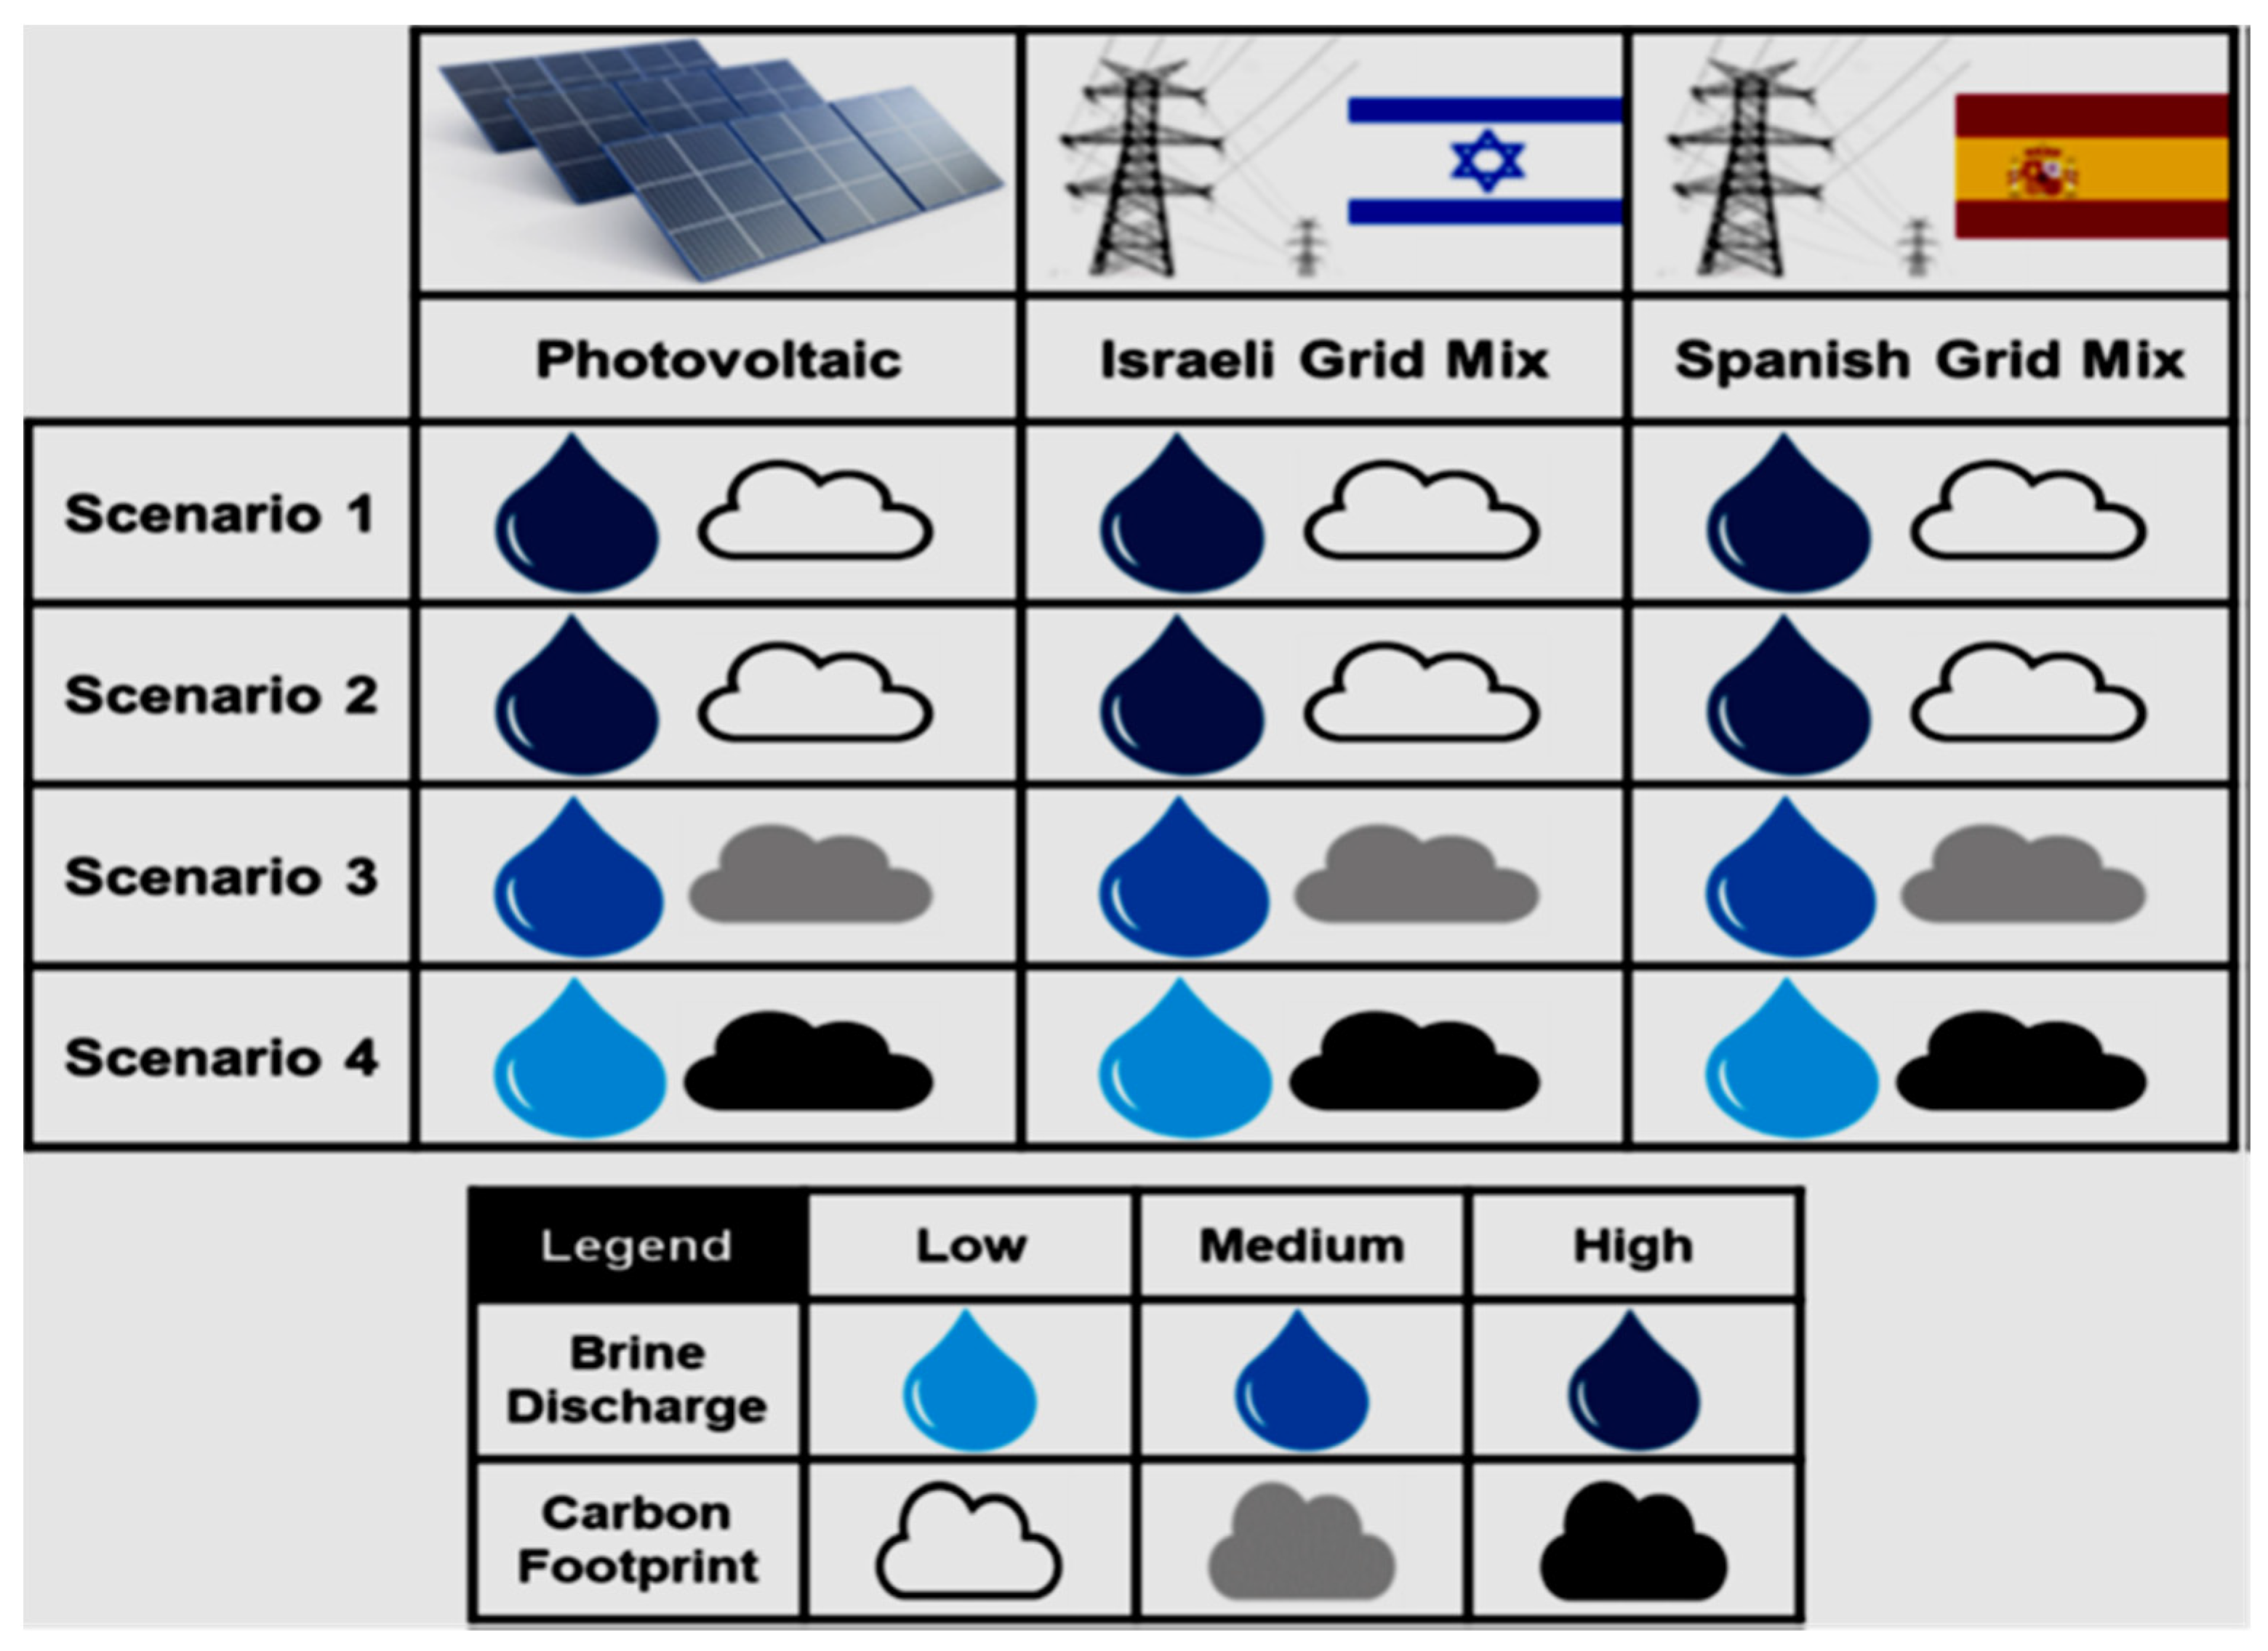
6.3. Ecological Implications

In the first scenario, where no brine treatment is applied, the study observed a significant discharge of concentrated brine with a concentration level of 63.5 g/L. This approach results in the highest BD factor and CF among all scenarios. It exemplifies the ecological effect of direct BD into seawater, emphasizing the need for more sustainable alternatives. In the second scenario, with a slight increase in brine treatment to 1.8%, a modest reduction in both the BD factor and CF was observed. This scenario showcases the potential benefits of minimal brine treatment, hinting at the environmental advantages of harnessing brine byproducts. In the third scenario, moving toward more extensive brine treatment (50%), the study achieved a significant reduction in both the BD factor and CF. This demonstrates the effectiveness of brine treatment in mitigating environmental impacts and reducing the burden of brine disposal. In the fourth scenario, brine treatment is maximized, resulting in zero direct BD. This approach offers the lowest BD factor and CF, highlighting its potential as a sustainable solution. However, it is essential to consider the feasibility and energy requirements associated with 100% brine treatment.
The interpretation of these scenario outcomes highlights the importance of brine treatment in reducing the environmental burdens associated with desalination. It provides valuable insights into the trade-offs between brine treatment rates, energy consumption, and ecological impacts. Additionally, the analysis suggests that a balanced approach, such as Scenario 3, combining efficient brine treatment with freshwater and byproduct recovery, holds promise for achieving both environmental sustainability and resource optimization.
This study aimed to fill the gaps in previous research by investigating the environmental sustainability of seawater desalination systems using a life cycle impact assessment (LCIA). Specifically, the study looks at the LCIA of Seawater Reverse Osmosis (SWRO) integrated with (i) Electro-Dialysis (EDBMED) and (ii) solar photovoltaics (PV). Via life cycle analysis, the study identified relevant indicators for LCIA and their implications in SWRO. The comparison analysis shows that SWRO has a higher energy efficiency, with an estimated level of 75%, as compared to other technologies like MSF. Despite the technological challenges associated with sustainable desalination and sustainable brine management, integrating renewable energy into seawater desalination can contribute to the environmental sustainability improvements of seawater desalination systems. Overall, this study provides an initial assessment of the ecological footprints of seawater desalination systems. Bipolar Membrane Electrodialysis (BMED) has been used and developed in recent years in seawater desalination, as it is different from the other methods that obtain salts or condensed wastewater directly. BMED has the capability to obtain higher-value acid from the dissolved waste salt, causing environmental conservation and supporting economic sustainability [86]. It is also a widely used technology for recovering NaCl, NaSO4, and NaNO3 salts for large-scale production. However, the efficiency of BMD has not been well documented in the case of ammonia nitrogen recovery, CO2 capture, wastewater ion removal, and recovery. Öner et al. [87] adopted it as an alternative separation method for distillation in manufacturing synthetic soda ash production. The study concluded that based on the voltage and initial salt concentration, BMED provided a higher desalination ratio (90–98%). In addition, the acid and base conversion ratio of salt ranged from 60 to 80%. However, the energy consumption was between 1.54 and 2.33 kWh/kg acid. Also, the BMED system has been experimented with as useful in desalinating process water [87]. Du et al. [88] adopted it by incorporating RO into a brackish water desalination plant. The study yielded 91.1 and 97.2% purities of the acid and base with a total cost of $1.69/kg NaOH [88]. Another study confirmed BMED as a cost-effective technique in processing high-salinity sulfanilic acid wastewater [89] and in treating cold-rolling wastewater [90]. A life cycle assessment (LCA) was adopted to assess the environmental sustainability, combining SWRO and EDBM. González et al. [91] used BMED in aiming to obtain LiOH directly from brine. The findings revealed that 0.77 at initial concentrations of LiOH 0.5 wt% and LiCl 14 wt% was the current efficiency, and a 3.34–4.35 wt% LiOH solution with 96.0–95.4% purity was obtained, symbolizing the prospects of BMED for large-scale LiOH production [91]. Although the prospects of the BMED technique are numerous, the challenges in its adoption in large-scale manufacturing include membrane fouling, ion leakage, a high preparation cost depending upon the feed conditions, current density, product quality, membrane characteristics, and parameter design. However, fouling can be mitigated by making changes to the hydrophilicity, charge, and roughness with the help of nanoparticles, treating solutions prior using coagulation, chemical precipitation, and filtration to decrease the solution’s ion concentration. Also, the operating conditions can be changed (i.e., feed speed, pH, and raw material concentration). An acid-blocking membrane is a pragmatic way to prevent ion leakage by limiting the current density, cell voltage, and salt compartment solution pH. Despite all the above-stated limitations of BMED, the environmental friendliness of this strategy, with no requirement for chemical reagents, high efficiency, less complex operations, and small carbon footprint, makes it more viable than other alternatives for environmental protection and resource recovery. However, future studies can further investigate and extend its wider applications to other fields [92]. BMED is an evolving technology in the field of desalination and has made strides in certain aspects, but it is not as mature as the well-established Seawater Reverse Osmosis (SWRO) technology. Membrane technology is crucial for the efficiency and cost-effectiveness of desalination processes, and BMED still requires further improvement in this aspect [92]. The integration of BMED technology with well-established SWRO systems is promising in its innovation potential. SWRO has undergone significant advancements, optimizations, and cost reductions due to extensive research, large-scale implementation, and market demand [93]. In contrast, BMED is still in the earlier stages of development and has not experienced the same level of industry-wide adoption and refinement.

7. Conclusions

This paper investigated a life cycle impact assessment of seawater desalination systems. The analysis focused on the SWRO process integrated with EDBM. In addition, the paper examined the impact of integrating solar PV with the seawater desalination process. The combination of EDBM technology with SWRO desalination processes significantly impacts two crucial environmental factors, namely (i) the CF, which is associated with the indirect GHG emissions generated due to the energy-intensive consumption process, particularly the electrical energy consumption, the span of which remains uninfluenced by renewable energy sources, and (ii) the variations in the environmental effects in the proximity of the desalination plant facility concerning BD. EDBM proved to be instrumental in reducing the environmental impacts associated with the BD stages, focusing on both the volume and concentration aspects of BD. By lowering the brine concentration from 63.50 g/L to 31.80 g/L, akin to seawater levels, EDBM enables a more environment-oriented disposal of brine into the sea. Therefore, EDBM can reduce substantially the environmental impacts of SWRO desalination processes, thereby positioning them toward more sustainable seawater desalination systems.
In the operations of SWRO integrated with EDBM, several CF levels can be achieved based on operating scenarios. The CF obtained in this study concerning a SWRO desalination operating with self-supply reagent, i.e., 2nd scenario in this study, yielded the following results: (a) for the Spanish Energy Grid Mix, 6.960 kg CO2-eq/m3 of freshwater volume, (b) for the Israeli Energy Grid Mix, 12.570 kg CO2-eq/m3 of freshwater volume, and the solar PV grid, 2.170 kg CO2-eq/m3 of freshwater volume, respectively.
This study explored a range of scenarios, with the brine treatment percentages spanning from 1.80% to 100.0%. The study also explored variations in the production of HCL and NaOH as byproducts of the SWRO process, integrated with EDBM. The results indicate that a SWRO self-supply of HCL and NaOH is achievable under certain circumstances, for example, brine treatment to 1.80%.
Further, the integration of SWRO and EDBM leads to an increased thermal energy demand due to product accumulation and the resulting CF. While it eliminates the need to purchase external chemical reagents, these environmental benefits must be balanced against the impact of increased steam consumption. Notably, the study identifies that a reduction in CF levels by 68.80% and 82.70% can be realized via the incorporation of renewable energy sources as alternatives to the energy grid mixes of, for example, Spain and Israel. Thus, further enhancements in overall CFs are attainable via the integration of PV technology with seawater desalination systems.
This paper has focused on the environmental sustainability of seawater desalination processes integrated on two fronts, i.e., (i) process integration and (ii) energy integration systems. Future research can be undertaken to extend the study to cover other dimensions of sustainability, such as social and economic aspects. This could take the form of a composite index based on indicators of sustainability dimensions, i.e., environmental, social, and economic, to enhance decision-making and policy formulations on seawater desalination systems.

Funding

This research received no external funding.

Institutional Review Board Statement

Not applicable.

Informed Consent Statement

Not applicable.

Data Availability Statement

Data are contained within the article.

Acknowledgments

The author is very thankful to all the associated personnel in any reference that contributed to/for this research.

Conflicts of Interest

The author declares no conflict of interest.

References

  1. Mekonnen, M.M.; Hoekstra, A.Y. Four billion people facing severe water scarcity. Sci. Adv. 2016, 2, e1500323. [Google Scholar] [CrossRef] [PubMed]
  2. Pal, M.; Ayele, Y.; Hadush, M.; Panigrahi, S.; Jadhav, V. Public health hazards due to unsafe drinking water. Air Water Borne Dis. 2018, 7, 2. [Google Scholar]
  3. Boretti, A.; Rosa, L. Reassessing the projections of the world water development report. NPJ Clean Water 2019, 2, 15. [Google Scholar] [CrossRef]
  4. Zhang, C.-Y.; Oki, T. Water pricing reform for sustainable water resources management in China’s agricultural sector. Agric. Water Manag. 2023, 275, 108045. [Google Scholar] [CrossRef]
  5. Dhal, L.; Swain, S. Understanding and modeling the process of seawater intrusion: A review. Adv. Remediat. Tech. Polluted Soils Groundw. 2022, 48, 269–290. [Google Scholar] [CrossRef]
  6. Sayed, E.T.; Olabi, A.; Elsaid, K.; Al Radi, M.; Alqadi, R.; Abdelkareem, M.A. Recent progress in renewable energy based-desalination in the Middle East and North Africa MENA region. J. Adv. Res. 2023, 48, 125–156. [Google Scholar] [CrossRef] [PubMed]
  7. Xu, X.; Ness, J.E.; Miara, A.; Sitterley, K.A.; Talmadge, M.; O’Neill, B.; Coughlin, K.; Akar, S.; Edirisooriya, E.T.; Kurup, P. Analysis of brackish water desalination for municipal uses: Case studies on challenges and opportunities. ACS EST Eng. 2022, 2, 306–322. [Google Scholar] [CrossRef]
  8. De Nicolás, A.P.; Molina-García, A.; Vera-García, F.; García-Bermejo, J.T. Sustainable Zero Liquid Discharge for Desalination and Denitrification Processes: Desirows Life European Project. In Proceedings of the 2022 IEEE International Conference on Environment and Electrical Engineering and 2022 IEEE Industrial and Commercial Power Systems Europe (EEEIC/I&CPS Europe), Prague, Czech Republic, 28 June–1 July 2022; pp. 1–5. [Google Scholar]
  9. Panagopoulos, A. Techno-economic assessment and feasibility study of a zero liquid discharge (ZLD) desalination hybrid system in the Eastern Mediterranean. Chem. Eng. Process. Process Intensif. 2022, 178, 109029. [Google Scholar] [CrossRef]
  10. Moossa, B.; Trivedi, P.; Saleem, H.; Zaidi, S.J. Desalination in the GCC countries—A review. J. Clean. Prod. 2022, 357, 131717. [Google Scholar] [CrossRef]
  11. Darwish, M.; Hassabou, A.H.; Shomar, B. Using Seawater Reverse Osmosis (SWRO) desalting system for less environmental impacts in Qatar. Desalination 2013, 309, 113–124. [Google Scholar] [CrossRef]
  12. Mannan, M.; Alhaj, M.; Mabrouk, A.N.; Al-Ghamdi, S.G. Examining the life-cycle environmental impacts of desalination: A case study in the State of Qatar. Desalination 2019, 452, 238–246. [Google Scholar] [CrossRef]
  13. Assad, M.E.H.; AlMallahi, M.N.; Abdelsalam, M.A.; AlShabi, M.; AlMallahi, W.N. Desalination technologies: Overview. In Proceedings of the 2022 Advances in Science and Engineering Technology International Conferences (ASET), Dubai, United Arab Emirates, 21–24 February 2022; pp. 1–4. [Google Scholar]
  14. Natarajan, S.K.; Suraparaju, S.K.; Elavarasan, R.M. A review on low-temperature thermal desalination approach. Environ. Sci. Pollut. Res. 2022, 29, 32443–32466. [Google Scholar] [CrossRef] [PubMed]
  15. Kumar, S.; Kumar, M.; Chowdhury, S.; Rajpurohit, B.S.; Randhawa, J.K. Environmental concerns and long-term solutions for solar-powered water desalination. J. Clean. Prod. 2022, 345, 131180. [Google Scholar] [CrossRef]
  16. Do Thi, H.T.; Tóth, A.J. Investigation of CFs of Three Desalination Technologies: Reverse Osmosis (RO), Multi-Stage Flash Distillation (MSF) and Multi-Effect Distillation (MED). Period. Polytech. Chem. Eng. 2023, 67, 41–48. [Google Scholar] [CrossRef]
  17. Tayefeh, M. An innovative rearrangement and comprehensive comparison of the combination of compressed air energy storage (CAES) with multi-stage flash (MSF) desalination and multi-effect distillation (MED) systems. J. Energy Storage 2022, 52, 105025. [Google Scholar] [CrossRef]
  18. Alhaj, M.; Mabrouk, A.; Al-Ghamdi, S.G. Energy efficient multi-effect distillation powered by a solar linear Fresnel collector. Energy Convers. Manag. 2018, 171, 576–586. [Google Scholar] [CrossRef]
  19. Najjar, E.; Al-Hindi, M.; Massoud, M.; Saad, W. Life cycle assessment and cost of a seawater reverse osmosis plant operated with different energy sources. Energy Convers. Manag. 2022, 268, 115964. [Google Scholar] [CrossRef]
  20. European Union. A Guide to Autonomous Desalination System Concepts. Brussels: European Union: European Union ADIRA Handbook; European Union: Geneva, Switzerland, 2008. [Google Scholar]
  21. Mabrouk, A.A.; Bourouni, K.; Abdulrahim, H.K.; Darwish, M.; Sharif, A. Impacts of tube bundle arrangement and feed flow pattern on the scale formation in large capacity MED desalination plants. Desalination 2015, 357, 275–285. [Google Scholar] [CrossRef]
  22. Maftouh, A.; El Fatni, O.; Bouzekri, S.; Rajabi, F.; Sillanpää, M.; Butt, M.H. Economic feasibility of solar-powered reverse osmosis water desalination: A comparative systemic review. Environ. Sci. Pollut. Res. 2023, 30, 2341–2354. [Google Scholar] [CrossRef]
  23. Small, M.J. Policy analysis at ES&T. Environ. Sci. Technol. 2012, 46, 2483. [Google Scholar]
  24. Al-Ghamdi, S.G.; Bilec, M.M. On-site renewable energy and green buildings: A system-level analysis. Environ. Sci. Technol. 2016, 50, 4606–4614. [Google Scholar] [CrossRef] [PubMed]
  25. Lave, L.B. Using input-output analysis to estimate economy-wide discharges. Environ. Sci. Technol. 1995, 29, 420A–426A. [Google Scholar] [CrossRef]
  26. Pacca, S.; Horvath, A. Greenhouse gas emissions from building and operating electric power plants in the Upper Colorado River Basin. Environ. Sci. Technol. 2002, 36, 3194–3200. [Google Scholar] [CrossRef]
  27. Drioli, E.; Ali, A.; Macedonio, F. Membrane operations for process intensification in desalination. Appl. Sci. 2017, 7, 100. [Google Scholar] [CrossRef]
  28. Amy, G.; Ghaffour, N.; Li, Z.; Francis, L.; Linares, R.V.; Missimer, T.; Lattemann, S. Membrane-based seawater desalination: Present and future prospects. Desalination 2017, 401, 16–21. [Google Scholar] [CrossRef]
  29. Meneses, M.; Pasqualino, J.C.; Céspedes-Sánchez, R.; Castells, F. Alternatives for reducing the environmental impact of the main residue from a desalination plant. J. Ind. Ecol. 2010, 14, 512–527. [Google Scholar] [CrossRef]
  30. García-Rubio, M.A.; Guardiola, J. Desalination in Spain: A growing alternative for water supply. Int. J. Water Resour. Dev. 2012, 28, 171–186. [Google Scholar] [CrossRef]
  31. Palomar, P.; Losada, I.J. The impacts of desalination on the marine. In The Marine Environment: Ecology Management and Conservation; Nemeth, A.D., Ed.; Nova Science: New York, NY, USA, 2011. [Google Scholar]
  32. Fernández-Torquemada, Y.; Sánchez-Lizaso, J.L. Effects of salinity on leaf growth and survival of the Mediterranean seagrass Posidonia oceanica (L.). Delile. J. Exp. Mar. Biol. 2005, 320, 7–63. [Google Scholar] [CrossRef]
  33. Gacia, E.; Invers, O.; Manzanera, M.; Ballesteros, E.; Romero, J. Impact of the brine from a desalination plant on a shallow seagrass (Posidonia oceanica) meadow. Estuar. Coast. Shelf Sci. 2007, 72, 579–590. [Google Scholar] [CrossRef]
  34. Del-Pilar-Ruso, Y.; De-la-Ossa-Carretero, J.A.; Giménez-Casalduero, F.; Sánchez-Lizaso, J.L. Effects of a brine discharge over soft bottom Polychaeta assemblage. Environ. Pollut. 2008, 156, 240–250. [Google Scholar] [CrossRef]
  35. Sánchez-Lizaso, J.L.; Romero, J.; Ruiz, J.; Gacia, E.; Buceta, J.L.; Invers, O.; Torquemada, Y.F.; Mas, J.; Ruiz-Mateo, A.; Manzanera, M. Salinity tolerance of the Mediterranean seagrass Posidonia oceanica: Recommendations to minimize the impact of brine discharges from desalination plants. Desalination 2008, 221, 602–607. [Google Scholar] [CrossRef]
  36. Roberts, D.A.; Johnston, E.L.; Knott, N.A. Impacts of desalination plant discharges on the marine environment: A critical review of published studies. Water Res. 2010, 44, 5117–5128. [Google Scholar] [CrossRef]
  37. Yoon, S.J.; Park, G.S. Ecotoxicological effects of brine discharge on the marine community by seawater desalination. Desalin. Water Treat. 2011, 33, 240–247. [Google Scholar] [CrossRef]
  38. Belkin, N.; Rahav, E.; Elifantz, H.; Kress, N.; Berman-Frank, I. Enhanced salinities, as a proxy of seawater desalination discharges, impact coastal microbial communities of the eastern Mediterranean Sea. Environ. Microbiol. 2015, 17, 4105–4120. [Google Scholar] [CrossRef] [PubMed]
  39. Belkin, N.; Rahav, E.; Elifantz, H.; Kress, N.; Berman-Frank, I. The effect of coagulants and antiscalants discharged with seawater desalination brines on coastal microbial communities: A laboratory and in situ study from the southeastern Mediterranean. Water Res. 2017, 110, 321–331. [Google Scholar] [CrossRef] [PubMed]
  40. de-la-Ossa-Carretero, J.A.; Del-Pilar-Ruso, Y.; Loya-Fernández, A.; Ferrero-Vicente, L.M.; Marco-Méndez, C.; Martinez-Garcia, E.; Giménez-Casalduero, F.; Sánchez-Lizaso, J.L. Bioindicators as metrics for environmental monitoring of desalination plant discharges. Mar. Pollut. Bull. 2016, 103, 313–318. [Google Scholar] [CrossRef]
  41. Röthig, T.; Ochsenkühn, M.A.; Roik, A.; Van Der Merwe, R.; Voolstra, C.R. Long-term salinity tolerance is accompanied by a major restructuring of the coral bacterial microbiome. Mol. Ecol. 2016, 25, 1308–1323. [Google Scholar] [CrossRef]
  42. Jiang, C.; Wang, Y.; Wang, Q.; Feng, H.; Xu, T. Production of lithium hydroxide from lake brines through electro–electrodialysis with bipolar membranes (EEDBM). Ind. Eng. Chem. 2014, 53, 6103–6112. [Google Scholar] [CrossRef]
  43. Jiang, C.; Wang, Y.; Zhang, Z.; Xu, T. Electrodialysis of concentrated brine from RO plant to produce coarse salt and freshwater. J. Membr. Sci. 2014, 450, 323–330. [Google Scholar] [CrossRef]
  44. Ortiz-Albo, P.; Ibañez, R.; Urtiaga, A.; Ortiz, I. Phenomenological prediction of desalination brines nanofiltration through the indirect determination of zeta potential. Sep. Purif. Technol. 2019, 210, 746–753. [Google Scholar] [CrossRef]
  45. Koter, S.; Warszawski, A. A new model for characterization of bipolar membrane electrodialysis of brine. Desalination 2006, 198, 111–123. [Google Scholar] [CrossRef]
  46. Pérez-González, A.; Urtiaga, A.M.; Ibáñez, R.; Ortiz, I. State of the art and review on the treatment technologies of water reverse osmosis concentrates. Water Res. 2012, 46, 267–283. [Google Scholar] [CrossRef] [PubMed]
  47. Wang, M.; Wang, K.K.; Jia, Y.X.; Ren, Q.C. The reclamation of brine is generated from the desalination process by bipolar membrane electrodialysis. J. Membr. Sci. 2014, 452, 54–61. [Google Scholar] [CrossRef]
  48. Yang, Y.; Gao, X.; Fan, A.; Fu, L.; Gao, C. An innovative beneficial reuse of seawater concentrate using bipolar membrane electrodialysis. J. Membr. Sci. 2014, 449, 119–126. [Google Scholar] [CrossRef]
  49. Fernandez-Gonzalez, C.; Dominguez-Ramos, A.; Ibañez, R.; Irabien, A. Electrodialysis with bipolar membranes for valorization of brines. Sep. Purif. Rev. 2016, 45, 275–287. [Google Scholar] [CrossRef]
  50. Reig, M.; Valderrama, C.; Gibert, O.; Cortina, J.L. Selectrodialysis and bipolar membrane electrodialysis combination for industrial process brine treatment: Monovalent-divalent ions separation and acid and base production. Desalination 2016, 399, 88–95. [Google Scholar] [CrossRef]
  51. Masdar. Global CO2 Emissions of Water Desalination Plants. 2015. Available online: http://www.clca.columbia.edu/Global-Water.pdf (accessed on 10 September 2023).
  52. Shahabi, M.P.; McHugh, A.; Anda, M.; Ho, G. Environmental life cycle assessment of seawater reverse osmosis desalination plant powered by renewable energy. J. Renew. Energy 2014, 67, 53–58. [Google Scholar] [CrossRef]
  53. Siefan, A.; Rachid, E.; Elashwah, N.; AlMarzooqi, F.; Banat, F.; van der Merwe, R. Desalination via solar membrane distillation and conventional membrane distillation: Life cycle assessment case study in Jordan. Desalination 2022, 522, 115383. [Google Scholar] [CrossRef]
  54. Ghazi, Z.M.; Rizvi, S.W.F.; Shahid, W.M.; Abdulhameed, A.M.; Saleem, H.; Zaidi, S.J. An overview of water desalination systems integrated with renewable energy sources. Desalination 2022, 542, 116063. [Google Scholar] [CrossRef]
  55. Elhashimi, M.A.; Gee, M.; Abbasi, B. Unconventional desalination: The use of cyclone separators in HDH desalination to achieve zero liquid discharge. Desalination 2022, 539, 115932. [Google Scholar] [CrossRef]
  56. Cassaro, C.; Virruso, G.; Culcasi, A.; Cipollina, A.; Tamburini, A.; Micale, G. Electrodialysis with Bipolar Membranes for the Sustainable Production of Chemicals from Seawater Brines at Pilot Plant Scale. ACS Sustain. Chem. Eng. 2023, 11, 2989–3000. [Google Scholar] [CrossRef] [PubMed]
  57. Herrero-Gonzalez, M.; Ibañez, R. Technical and Environmental Feasibilities of the Commercial Production of NaOH from Brine by Means of an Integrated EDBM and Evaporation Process. Membranes 2022, 12, 885. [Google Scholar] [CrossRef]
  58. Ramesh, M.; Deepa, C.; Kumar, L.R.; Sanjay, M.; Siengchin, S. Life-cycle and environmental impact assessments on the processing of plant fibers and its bio-composites: A critical review. J. Ind. Text. 2022, 51, 5518S–5542S. [Google Scholar] [CrossRef]
  59. Moreno Leiva, S. Optimal Planning of Water and Renewable Energy Systems for Copper Production Processes with Sector Coupling and Demand Flexibility; Eigenverlag des Instituts für Wasser-und Umweltsystemmodellierung: Stuttgart, Germany, 2022. [Google Scholar]
  60. Ghyselbrecht, K.; Huygebaert, M.; Van der Bruggen, B.; Ballet, R.; Meesschaert, B.; Pinoy, L. Desalination of an industrial saline water with conventional and bipolar membrane electrodialysis. Desalination 2013, 318, 9–18. [Google Scholar] [CrossRef]
  61. Fernandez-Gonzalez, C.; Dominguez-Ramos, A.; Ibañez, R.; Chen, Y.; Irabien, A. Valorization of desalination brines by electrodialysis with bipolar membranes using nanocomposite anion exchange membranes. Desalination 2017, 406, 16–24. [Google Scholar] [CrossRef]
  62. Wenten, I.G.; Ariono, D.; Purwasasmita, M.; Khoirudin, K. Integrated processes for desalination and salt production: A mini-review. AIP Conf. Proc. 2017, 1818, 020065. [Google Scholar]
  63. Ahmadvand, S.; Abbasi, B.; Azarfar, B.; Elhashimi, M.; Zhang, X.; Abbasi, B. Looking beyond energy efficiency: An applied review of water desalination technologies and an introduction to capillary-driven desalination. Water 2019, 11, 696. [Google Scholar] [CrossRef]
  64. Cherchi, C.; Badruzzaman, M.; Becker, L.; Jacangelo, J.G. Natural gas and grid electricity for seawater desalination: An economic and environmental life-cycle comparison. Desalination 2017, 414, 89–97. [Google Scholar] [CrossRef]
  65. Aleisa, E.; Al-Shayji, K. Ecological–economic modeling to optimize a desalination policy: A case study of an arid rentier state. Desalination 2018, 430, 64–73. [Google Scholar] [CrossRef]
  66. Zhou, J.; Chang, V.W.-C.; Fane, A.G. An improved life cycle impact assessment (LCIA) approach for assessing the aquatic eco-toxic impact of brine disposal from seawater desalination plants. Desalination 2013, 308, 233–241. [Google Scholar] [CrossRef]
  67. Zhou, J.; Chang, V.W.-C.; Fane, A.G. Life cycle assessment for desalination: A review on methodology feasibility and reliability. Water Res. 2014, 61, 210–223. [Google Scholar] [CrossRef] [PubMed]
  68. Uche, J.; Martínez-Gracia, A.; Círez, F.; Carmona, U. Environmental impact of water supply and water use in a Mediterranean water-stressed region. J. Clean. Prod. 2015, 88, 196–204. [Google Scholar] [CrossRef]
  69. Biswas, W.K.; Yek, P. Improving the CF of water treatment with renewable energy: A Western Australian case study. Renew. Wind Water Sol. 2016, 3, 14. [Google Scholar] [CrossRef]
  70. Jones, E.; Qadir, M.; van Vliet, M.T.; Smakhtin, V.; Kang, S. The state of desalination and brine production: A global outlook. Sci. Total Environ. 2019, 657, 1343–1356. [Google Scholar] [CrossRef] [PubMed]
  71. de Souza Moreira, F.; Lopes, M.P.C.; de Freitas, M.A.V.; de Souza Antunes, A.M. Future scenarios for the development of the desalination industry in contexts of water scarcity: A Brazilian case study. Technol. Forecast. Soc. Chang. 2021, 167, 120727. [Google Scholar] [CrossRef]
  72. Smart Water Magazine. Spanish Desalination Know-How, a Worldwide Benchmark Smart Water Magazine. Smart Water Magazine, 28 February 2022. [Google Scholar]
  73. Mo, F. Seawater Desalination in Israel. 2021. Available online: https://www.gov.il/en/departments/general/project-water-desalination-background (accessed on 13 September 2023).
  74. Michael, F. Israel May Lift Land Restrictions for Large-Scale Solar. 2023. Available online: https://www.pv-magazine.com/2023/02/03/israel-may-lift-land-restrictions-for-large-scale-solar/ (accessed on 30 September 2023).
  75. Herrero-Gonzalez, M.; Wolfson, A.; Dominguez-Ramos, A.; Ibanez, R.; Irabien, A. Monetizing environmental footprints: Index development and application to a solar-powered chemicals self-supplied desalination plant. ACS Sustain. Chem. Eng. 2018, 6, 14533–14541. [Google Scholar] [CrossRef]
  76. Schlömer, S.; Bruckner, T.; Fulton, L.; Hertwich, E.; McKinnon, A.; Perczyk, D.; Roy, J.; Schaeffer, R.; Sims, R.; Smith, P. Annex III: Technology-specific cost and performance parameters. In Climate Change 2014: Mitigation of Climate Change: Contribution of Working Group III to the Fifth Assessment Report of the Intergovernmental Panel on Climate Change; Cambridge University Press: Cambridge, UK, 2014; pp. 1329–1356. [Google Scholar]
  77. IEA. Key World Energy Statistics. IEA. 2016. Available online: http://www.iea.org/ (accessed on 13 September 2023).
  78. Varun; Prakash, R.; Bhat, I. Life cycle energy and GHG analysis of hydroelectric power development in India. Int. J. Green Energy 2010, 7, 361–375. [Google Scholar] [CrossRef]
  79. Foro, F.N. De la Industria Nuclear Española. Energía. 2017. Available online: https://www.foronuclear.org/wp-content/uploads/2020/05/energia-2017.pdf?x67659 (accessed on 30 September 2023).
  80. Schallenberg-Rodríguez, J.; Veza, J.M.; Blanco-Marigorta, A. Energy efficiency and desalination in the Canary Islands. Renew. Sustain. Energy Rev. 2014, 40, 741–748. [Google Scholar] [CrossRef]
  81. Thinkstep. Gabi 6 Software and Database on Life Cycle Assessment; Thinkstep: Leinfelden-Echterdingen, Germany, 2017. [Google Scholar]
  82. Vince, F.; Aoustin, E.; Bréant, P.; Marechal, F. LCA tool for the environmental evaluation of potable water production. Desalination 2008, 220, 37–56. [Google Scholar] [CrossRef]
  83. Lyons, E.; Zhang, P.; Benn, T.; Sharif, F.; Li, K.; Crittenden, J.; Costanza, M.; Chen, Y. Life cycle assessment of three water supply systems: Importation, reclamation, and desalination. Water Sci. Technol. Water Supply 2009, 9, 439–448. [Google Scholar] [CrossRef]
  84. Tarnacki, K.; Melin, T.; Jansen, A.; Van Medevoort, J. Comparison of environmental impact and energy efficiency of desalination processes by LCA. Water Sci. Technol. Water Supply 2011, 11, 246–251. [Google Scholar] [CrossRef]
  85. Dashtpour, R.; Al-Zubaidy, S.N. Energy efficient reverse osmosis desalination process. Int. J. Environ. Sci. Dev. 2012, 3, 339. [Google Scholar]
  86. Chen, T.; Bi, J.; Ji, Z.; Yuan, J.; Zhao, Y. Application of bipolar membrane electrodialysis for simultaneous recovery of high-value acid/alkali from saline wastewater: An in-depth review. Water Res. 2022, 226, 119274. [Google Scholar] [CrossRef] [PubMed]
  87. Öner, M.R.; Kanca, A.; Ata, O.N.; Yapıcı, S.; Yaylalı, N.A. Bipolar membrane electrodialysis for mixed salt water treatment: Evaluation of parameters on process performance. J. Environ. Chem. Eng. 2021, 9, 105750. [Google Scholar] [CrossRef]
  88. Du, C.; Du, J.R.; Zhao, X.; Cheng, F.; Ali, M.E.; Feng, X. Treatment of brackish water RO brine via bipolar membrane electrodialysis. Ind. Eng. Chem. Res. 2021, 60, 3115–3129. [Google Scholar] [CrossRef]
  89. Sun, Y.; Wang, Y.; Peng, Z.; Liu, Y. Treatment of high salinity sulfanilic acid wastewater by bipolar membrane electrodialysis. Sep. Purif. Technol. 2022, 281, 119842. [Google Scholar] [CrossRef]
  90. Jiang, G.; Li, H.; Xu, M.; Ruan, H. Sustainable reverse osmosis, electrodialysis and bipolar membrane electrodialysis application for cold-rolling wastewater treatment in the steel industry. J. Water Proc. Eng. 2021, 40, 101968. [Google Scholar] [CrossRef]
  91. González, A.; Grágeda, M.; Quispe, A.; Ushak, S.; Sistat, P.; Cretin, M. Application and analysis of bipolar membrane electrodialysis for LiOH production at high electrolyte concentrations: Current scope and challenges. Membranes 2021, 11, 575. [Google Scholar] [CrossRef]
  92. Luo, Y.; Liu, Y.; Shen, J.; Van der Bruggen, B. Application of bipolar membrane electrodialysis in environmental protection and resource recovery: A Review. Membranes 2022, 12, 829. [Google Scholar] [CrossRef]
  93. Kurihara, M. Current status and future trend of dominant commercial reverse osmosis membranes. Membranes 2021, 11, 906. [Google Scholar] [CrossRef]
Figure 1. MSF schematic process.
Sustainability 15 16673 g001
Figure 2. Reverse osmosis seawater treatment plant.
Sustainability 15 16673 g002
Figure 3. SWRO desalination system integrated with EDBM.
Sustainability 15 16673 g003
Figure 4. Process flow diagram illustrating the system boundaries and SWRO process stages.
Sustainability 15 16673 g004
Figure 5. CC (climate change) and BD (brine disposal) parameters concerning 1.0 m3 freshwater volume regarding the Spanish and Israeli energy grid mixes as well as the PV solar energy grid mix.
Sustainability 15 16673 g005
Figure 6. Production of HCl (30.0% weight) and NaOH (98.0% weight) against global warming potential (GWP) relevant to Israeli and Spanish energy grid mixes, and the solar PV energy for 1.0 m3 volume of freshwater generated via desalination.
Sustainability 15 16673 g006
Figure 7. Relevant impact (individual contribution) of the SWRO, EDBM, and individual concentration stages to the cumulative CF.
Sustainability 15 16673 g007
Figure 8. A summarized illustration of the CF–CF and BD parameters in the first, second, third, and fourth scenarios together with the energy sources incorporated.
Sustainability 15 16673 g008
Table 1. The energy grid mix share of Spain and Israel in the year 2015 and carbon footprint of different energy sources (“Adapted with permission from ‘Herrero-Gonzalez, M.; 2018’ [75]” Copyright 2018 American Chemical Society).
Indicator(s)Energy Grid Mix Share [77]CF—CF (kg CO2 eqv/GJ)
Source(s) of Electrical EnergySpain
(%)
Israel
(%)
[75][76][78][79]
MinMedianMax
Oil6.100.70200.00 206.0069.44
NG18.7051.60150.00113.90136.10180.60136.00
Coal18.7045.80250.00205.60227.80252.80228.00
Nuclear Energy20.400.005.001.003.3030.603.00
Hydro Electric Energy11.200.005.000.306.70611.107.00
Biofuel (Biomass) Energy1.800.10200.00172.20205.60247.20206.00
Waste Sources0.500.0050.00
Geothermal Energy0.000.0010.001.7010.6021.9011.00
Solar PV (Photovoltaics)2.901.7010.005.0013.3050.0013.00
Solar Thermal Energy2.000.0010.002.407.5017.508.00
Wind Energy17.600.005.001.903.1015.603.00
Tidal Energy0.000.00-
Other Source(s)0.100.00
Global CF–CF (kg.CO2-eqv./GJ)94.00194.00
Table 2. Description of scenarios.
Scenarios1st Scenario2nd Scenario3rd Scenario4th Scenario
Brine treatment eate (%)0.001.8050.00100.00
BD (to seawater)100.0098.2050.000.00
Self-supply ratio—HCl0.00100.00100.00100.00
Products for market (Moossa et al. [10])Freshwater supplyFreshwater supply Freshwater supply, HCl (30.0%wt.), and NaOH (98.0%wt.)
Table 3. Inputs and outputs per scenarios of produced freshwater during the desalination process.
Plant Components1st Scenario2nd Scenario3rd Scenario4th ScenarioUnitsReferences
Inputs
Seawater2300.002319.002399.002489.00kgSelf-Calculated
Chemicals (reagents)
HCl0.14600.14600.14600.1460kg[61]
Power input
SWRO13.3013.4013.9014.40kWh[80]
EDBM0.002.15060.90126.00kWh[75]
Heat energy input
Acid and base concentration stage(s)0.008.38360.0752.0kWhSelf-Calculated
Process output
products
Freshwater1000.001000.001000.001000.00kgSelf-Calculated
HCl (30.0%wt.)0.000.4041.086.0kgSelf-Calculated
NaOH (98.0%wt.)0.000.5014.029.0kgSelf-Calculated
Waste Product(s)
Concentrated brine (NaCl)conc—63.5 g/L1300.001287.00678.000.00kgSelf-Calculated
Post-treated brine (NaCl)—31.80 g/L0.0023.006.5801365.00kgSelf-Calculated
Table 4. Mass balance for four scenarios based on BD per 1.0 m3 of freshwater volume.
Unit(s)Brine Treatment Rate
(%)
Concentrated BD (63.510 g/L)
[43]
BD Treatment (31.750 g/L)
[43]
Total BD
[43]
Total BD Mean Concentration (g/L)
1st Scenario0.001300.00.001300.063.510
2nd Scenario1.801287.023.01310.062.950
3rd Scenario50.0678.0658.01336.047.870
4th Scenario100.00.001365.01365.031.750
Disclaimer/Publisher’s Note: The statements, opinions and data contained in all publications are solely those of the individual author(s) and contributor(s) and not of MDPI and/or the editor(s). MDPI and/or the editor(s) disclaim responsibility for any injury to people or property resulting from any ideas, methods, instructions or products referred to in the content.

