Article

Economic and Environmental Sustainability Trade-Off Analysis in Sheep Farming Using the Farm Accountancy Data Network Database

1
Department of Agriculture, University of Sassari, 07100 Sassari, Italy
2
CREA—Council for Agricultural Research and Economics, Research Centre for Agricultural Policies and Bio-Economy c/o University of Udine, Via delle Scienze 206, 33100 Udine, Italy
3
National Biodiversity Future Centre, University of Palermo, Piazza Marina, 61, 90133 Palermo, Italy
*
Author to whom correspondence should be addressed.
Sustainability 2023, 15(24), 16621; https://doi.org/10.3390/su152416621
Submission received: 6 November 2023 / Revised: 30 November 2023 / Accepted: 2 December 2023 / Published: 6 December 2023
(This article belongs to the Special Issue Sustainable Agricultural and Food Economics)

Abstract

:
Agriculture and livestock farming significantly contribute to the success of all United Nations Sustainable Development Goals of Agenda 2030 and are pivotal in the sustainability transition of the European agri-food sector. However, those sectors have been criticized for generating negative environmental externalities. In this context, adopting indicators able to evaluate agriculture and sheep farming sustainability is essential for fostering sustainable development in the primary sector and defining appropriate policies to support it. Such indicators are crucial for understanding if European Union policies striving to realize win–win opportunities based on synergy between farms’ environmental and economic dimensions are realistic. This paper focuses on this wave of interest and has two aims. First, it intends to investigate the existence of synergies or trade-offs between those dimensions using a trade-off analysis. To this end, a significant set of economic and environmental farm indicators was selected, and two composite indicators were created. Second, it aims to investigate the relationship between those two indicators and some pivotal structural and socio-demographic variables. This study was carried out on 219 Sardinian sheep farms included in the Italian Farm Accountancy Data Network. The findings showed a low synergy between the economic and environmental spheres, a relationship between economic indicators and farmers’ ages and organic production variables, and no relationships between the environmental dimension and the analyzed variables.

1. Introduction

Agriculture and livestock farming are central to sustainable development [1,2] as they significantly contribute to the success of all Sustainable Development Goals (SDGs) of Agenda 2030 [3,4], and, partly, because they are circular by nature [5].
The European Union (EU) is committed to a comprehensive sustainability transition of the European agri-food sector. Livestock systems are not an exception, particularly in the light of the central role they play in the European primary economy [6] both in terms of the millions of workers involved and the considerable total economic output and government revenue contribution [7,8,9]. Moving towards this direction, the EU has approved new policies—the European Green Deal [10], the Farm to Fork [11] and Biodiversity [12] strategies, and the Next Generation EU [13]—that organically operate to support the food system’s transition towards a new production model. The aim is to ferry Europe’s agricultural sector towards a more sustainable model and make EU the first climate-neutral continent in the world (including through the application of various measures, such as reducing both the use of fertilizers by 20% and the use of antibiotics or increasing the share of organically cultivated agricultural land). On the wave of these new strategies, agricultural activities must simultaneously meet a set of complex goals (i.e., to mitigate climate change while adapting to it and to reverse biodiversity loss as well), which would lead to safeguarding the affordability of food products, generating fairer economic returns, furthering the competitiveness of the EU supply sector, and favoring fair trade [14]. The feasibility of adhering to new EU constraints while maintaining farming activities’ social and economic sustainability is a very current topic. This is because the importance of ensuring the EU agricultural sector’s economic vitality and competitiveness to ensure EU food security and affordability and to meet new EU environmental goals is undeniable [14].
According to Poponi et al. [15], actions are needed in the agri-food sector and livestock production to ensure a transition to a more suitable development model [16,17,18]. Actually, although progress is slow, more sustainable production methods have been developed lately [17,19]. This also depends on criticism levelled at the agricultural sector, particularly livestock farming, which is argued to cause negative externalities and is indicated as one of the activities with the greatest environmental impact [18,20].
Specifically, sustainable livestock systems “should be environmentally friendly, economically viable for farmers and socially acceptable” [16], where environmental sustainability comprises the management of inputs and the use of resources and economic sustainability is the ability of the farming system to be profitable and to ensure prosperity for the farming community [16,21].
Nevertheless, the transition to a new livestock production system is contested, because each solution inevitably generates positive or negative outcomes and new patterns of winners and losers among actors [22].
In this context, farmers are called to make efforts in light of the “just transition” [11] that should create synergies and avoid trade-offs among the sustainability dimensions (environment, social, and economic) embedded in multiple objectives of the European strategy. At the same time, to support the agriculture transition, policymakers need to know (i) whether the policies aimed at stimulating environmental performance improvement in agriculture (e.g., F2F, biodiversity strategies, and PNRR) come at the cost of retarding economic performance (e.g., by lowering the farm’s productivity), and (ii) whether those aimed at leveraging the potential economic benefits of transitioning to more sustainable systems realize win–win opportunities between farms’ environmental and economic dimensions.
Due to their controversial contribution to environmental change, farming systems, as well as being at the center of public and scientific debate, have led to an academic focus on their sustainability, with previous research studies on farm sustainability covering a miscellaneous spectrum of approaches and findings, which are encompassed by some dominant research fields [17,23].
One line of research includes studies aimed at understanding how livestock farming systems can improve their resilience by looking at the self-sufficiency of their inputs and by operating on their sustainability performance and strategies [24,25,26]. Studies have also examined the possibility of implementing a circular economy approach to transition to a more sustainable system [27,28]. Others highlight that as a result of their wide variety of production orientations, farming practices, and modes of resource use, livestock farming systems provide contrasting social, economic, and environmental outcomes, thus requiring a sustainability assessment that ought to take into account the farming systems’ differences for a deeper understanding of specific social and environmental roles of livestock on both a global and local scale [23,29,30].
In order to support the sustainable development of agricultural and livestock systems, sustainability assessment is essential [31], because sustainability is a concept without substance if it is not associated with an indicator that evaluates it [32]. Moreover, as a multifaceted concept with various meanings for different actors [33], sustainability cannot be assessed by addressing only one aspect; rather, it must be considered in its entire complexity without overlooking the interrelation among the single dimensions’ components.
Despite the increasing attention paid by the theoretical and empirical literature to the study of agricultural economic and environmental performances and balancing different objectives of sustainability [2,34,35], previous studies were often limited to environmental issues to the detriment of economic ones [36,37], or they were concentrated on only one dimension and did not provide an effective measure of the degree of sustainability. In addition, the results of previous studies are inconclusive, showing both a possible relationship [38,39,40] and a trade-off between economic and environmental goals [41,42,43]. In this regard, among the latest studies in the literature, Sidhoum et al. [35] analyzed the relationship between economic, environmental, and social sustainability on a sample of Spanish crop farms. Their findings showed the presence of trade-off between economic and environmental sustainability and environmental and social sustainability. Špička et al. [37] compared the compatibility of economic and environmental objectives in 1189 agricultural holdings in the Czech Republic. They found a moderately significant trade-off between the two dimensions investigated in the total sample. At the same time, in the sub-sample of milk farms, they found a positive relationship between economic and environmental dimensions. In their study, Gómez-Limón et al. [39] found that the most sustainable farms were those “of large size and are managed by professional farmers, younger people, members of cooperatives and possessing a farming qualification” (p. 1073). Furthermore, they found a positive relationship between the three dimensions of sustainability. Reckling et al. [43], in their research, found that, in general, there is a trade-off between environmental and economic goals. Still, this result may vary depending on the production system considered.
Despite this research evidence, however, there is still a need for studies that can allow us to fully understand the interrelationships between economic and environmental dimensions at the level of livestock farm analysis and levers to foster the sustainable transition of agriculture and livestock systems.
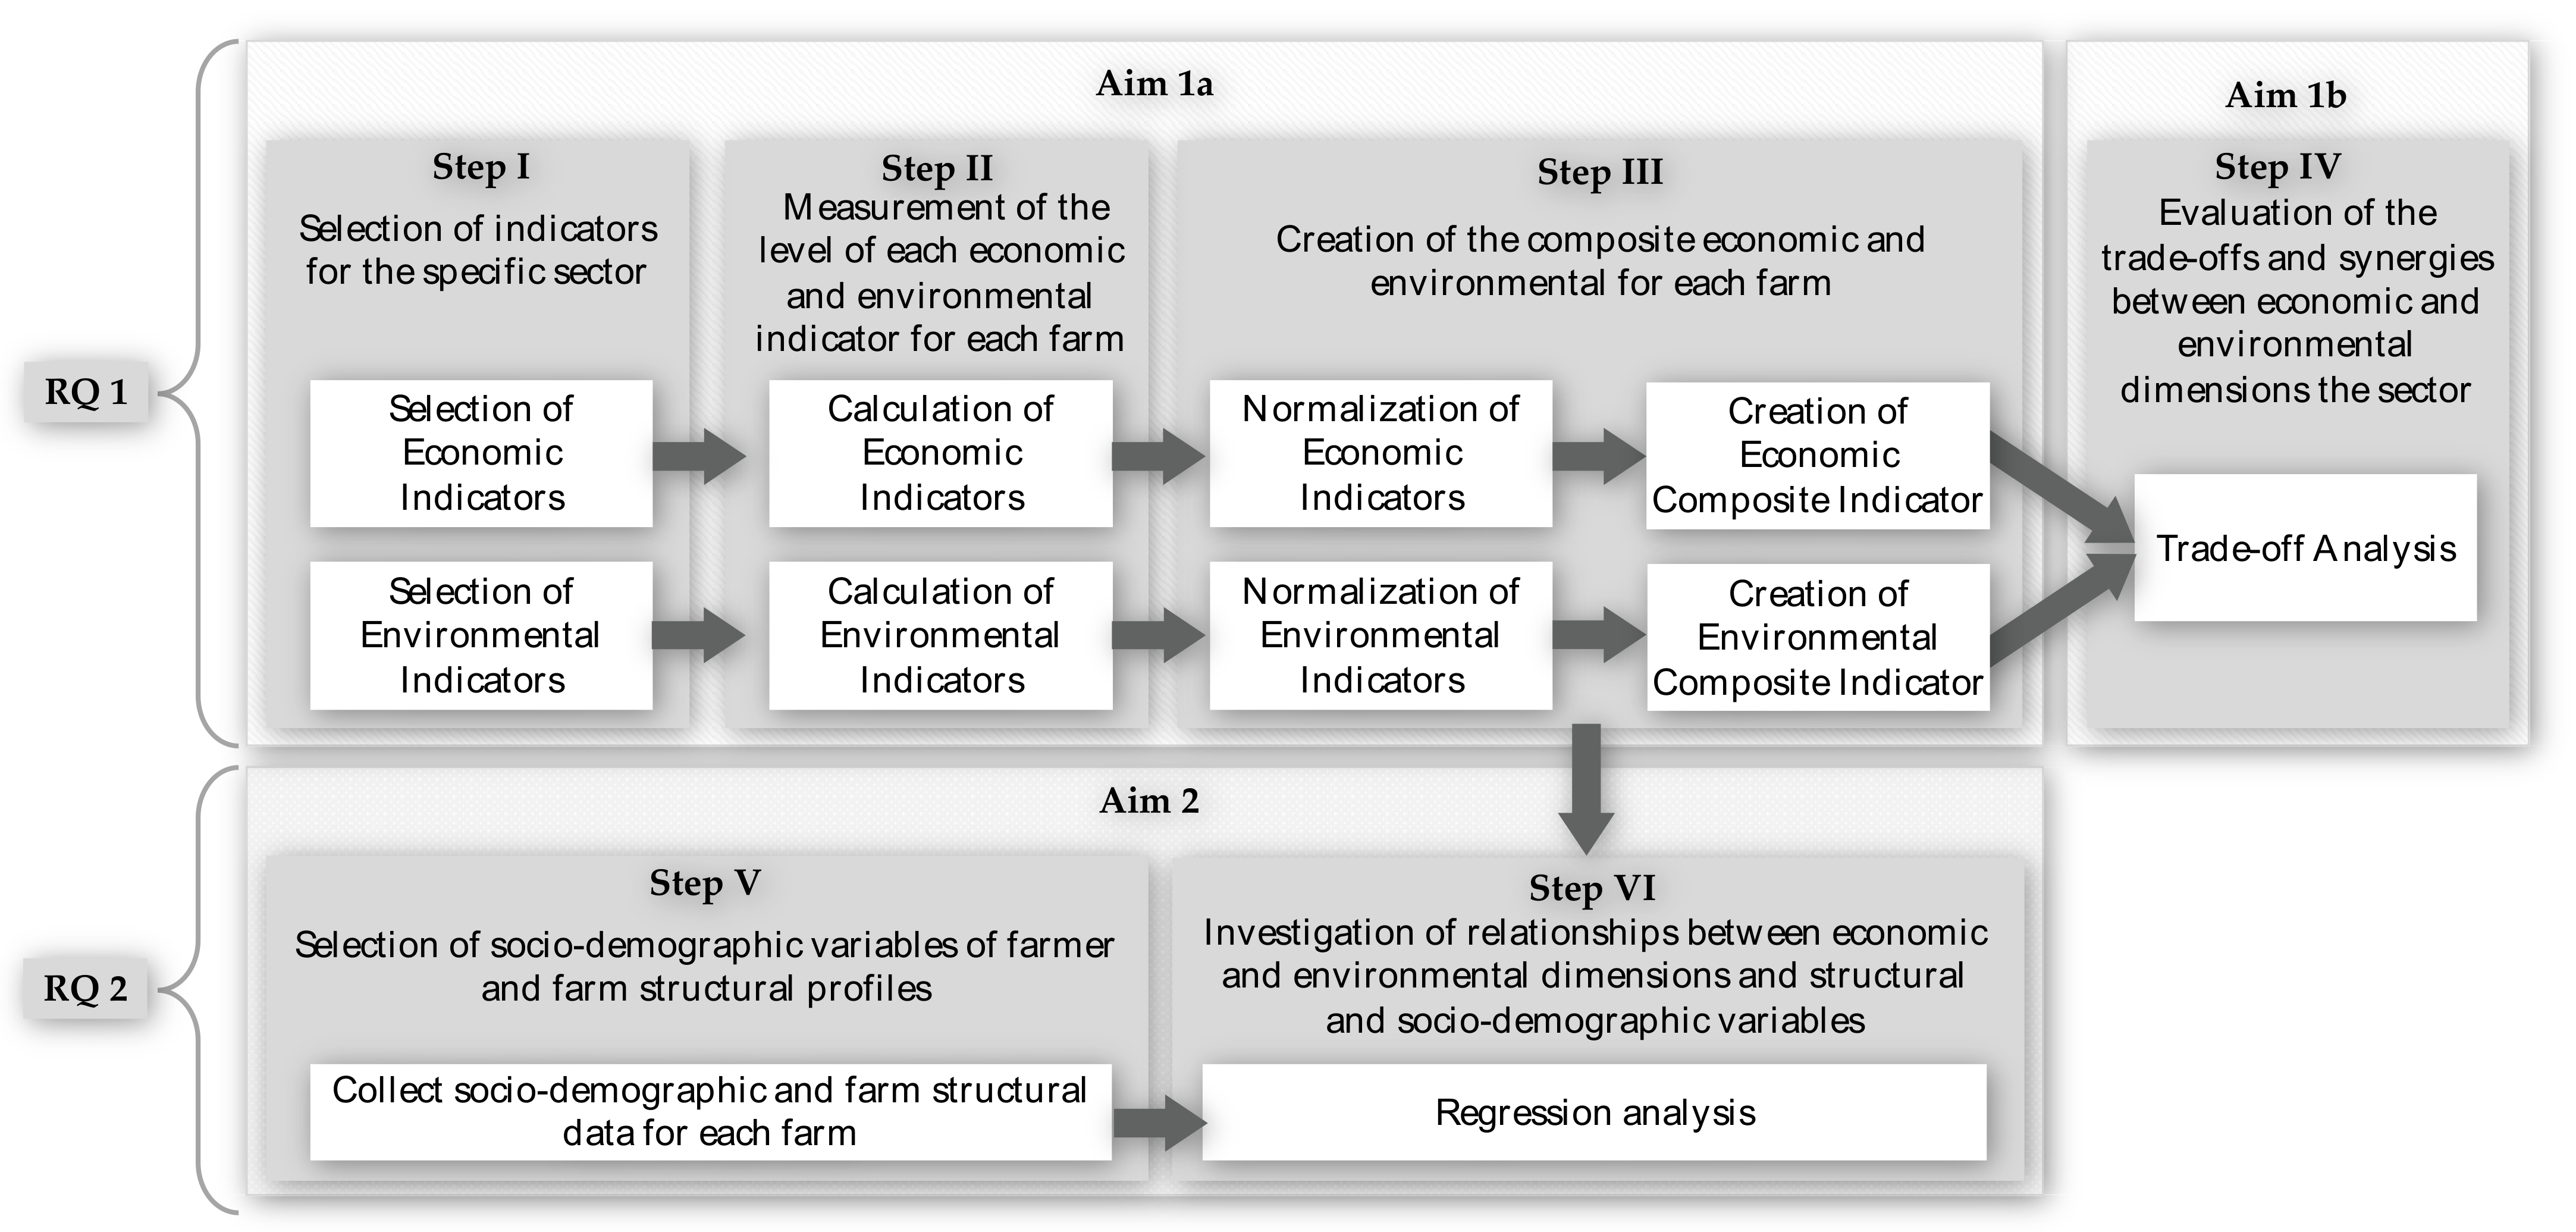
This study contributes to these discussions and has two aims. Firstly, it takes up the call of several authors who emphasize the need to provide indices assessing sustainability at the farm level [44,45] using a set of indicators [46] (Aim 1a). This is for two reasons: (i) the farm level is the legal unit for legislative purposes, and it is the economic unit that generally receives payments for externalities, and, as such, it is the level at which most policies are directed [47], and it is considered the most proper unit for assessing sustainability and implementing sustainable activities [48]; (ii) it is through indicators that the sustainability concept is made concrete and operative, and those indicators guides the decisions at the farm level, thereby determining how food systems affect societies and the environment, all within a framework where different actors have differing perceptions of the concept [49]. Moreover, this study seeks to improve our understanding of the existence and magnitude of the synergy or trade-off between the economic and environmental dimensions of the primary sector at the farm scale, where the primary focus of stakeholders is on maximizing yields and minimizing environmental impact [2] (Aim 1b).
Secondly, because farm sustainability is affected by the farm’s structural assets [17,50,51]—which mainly include the farm’s land area, the number of animals raised, the farmer’s age and education, and the production methods (such as organic)—this study wants to analyze the relationship between the sustainability dimensions investigated and the structural profiles of farms and some socio-demographic variables of the farmers (Aim 2).
To be precise, this study intends to respond to the following research questions:
RQ1: What is the relationship between the economic and environmental sustainability dimensions in dairy sheep farming?
RQ2: What relationships exist between economic and environmental sustainability dimensions, structural profiles of farms, and socio-demographic variables of farmers?
To answer these research questions, this paper focused on 219 sheep farms located in Sardinia and included in the Farm Accountancy Data Network (FADN) database in 2019 and 2020. In more detail, this paper used trade-off analysis [52] and regression analysis to answer the first and second research questions, respectively.
This paper provides pivotal food for thought for academics, policymakers, and farms for implementing new indicators to evaluate the multidimensionality of sustainability in agriculture, thus responding to previous research calls to understand the role of livestock production in the transition to a more suitable development model and to investigate which structural farm profiles and socio-demographic farmer variables can affect the economic and environmental dimensions of sustainability in a crucial sector, such as the dairy sheep farm.
The remainder of this paper is structured as follows. Section 2 introduces the livestock sector analyzed and its peculiarity in the investigated area. The research materials and methodology are illustrated in Section 3. Section 4 outlines the results, and Section 5 presents the conclusion and discussion of the results and provides suggestions for future research.

2. Sector Characteristics and Study Area

Approximately 1200 million sheep worldwide are generally located in sub-tropical areas and concentrated in the Mediterranean and Black Sea regions. According to FAO [53], world sheep milk production (10.6 Mt) refers first to Asia (46.8%), followed by Europe (29.5%), Africa (22.8%), and America (0.9%). In 2030, sheep milk production is expected to increase by approximately 3 Mt [54]. European sheep farming is an important sector playing sociocultural, economic, and environmental roles and ensuring livelihoods for vulnerable populations in rural and marginal areas [55]. As a matter of fact, the agricultural economy of various regions in Mediterranean Europe is strongly related to sheep milk production, to which Greece, Spain, Italy, and France contribute 31.8%, 19.0%, 16.6%, and 10.8%, respectively [53]; this may be because in these regions, given their significant Greek or Roman cultural heritage, dairy products are traditional ingredients in the human diet [56].
Specifically, the analysis narrows in on the Sardinian region, whose peculiarities make it a good benchmark for analyzing sheep raising and the challenges this sector is facing today. In the European Union (EU), Sardinia is the most important region for sheep milk production, which reaches approximately 320,000 t per year [57]. Nationwide, Sardinia sheep milk production contributes to about 69% of the Italian output [58] and accounts for 10% of the total EU supply [53]. Regionally, Sardinian dairy sheep farming plays a considerable role in the regional economy [59], contributing to about 40% of the total gross agricultural production value. However, it generally operates with low profit margins [60], and profitability often depends on the amount of financial aid made available by the Common Agricultural Policies (CAP) [23,61].

3. Materials and Methods

3.1. Data

The analysis was carried out using a quantitative research approach to examine the economic and environmental sustainability degree of the livestock sector in Sardinian dairy sheep farms.
Data were extracted from the FADN database, which has been used in recent years to evaluate the sustainability of the agri-food sector [31,62,63,64,65,66]. Its principal purpose is to provide data for the EU Commission to assess the economic performance of farms and the impact of the Common Agricultural Policy (CAP) [67].
In particular, using the Italian FADN database, named Rete Italiana di Contabilità Agricola (RICA), Sardinian sheep farms that meet the following criteria were selected:
  • Farms with data available for the years 2019–2020. The choice to analyze the 2019 and 2020 years derives from the need to avoid the results being influenced by conjectures depending on specific years, and they were the latest data available.
  • Farms dedicated to animal husbandry whose animal heritage was composed of at least 75% dairy sheep.
A total of 219 Sardinian sheep farms were selected. This research was carried out in February 2023.
The Italian FADN survey was used because it represents the farms of a territory that can be considered professional and market-oriented and offers data concerning the region, the economic dimension, and the technical–economic issues. Specifically, the Italian FADN has nationwide coverage of 95% of the utilized agricultural area, 91% of the livestock units, 97% of the value of standard production, and 92% of labor units; it has a sample of 11,000 farms, which is representative of all of the various types of farms in the national territory, and it provides greater detail with respect to the EU FADN as it collects slightly more than 1500 variables [68].

3.2. Research Method

To investigate the relationship between economic and environmental farm sustainability dimensions (RQ 1) and the relationship between the latter and the structural and socio-demographic variables (RQ 2), two methodologies were used: the trade-off analysis (points I–IV, Figure 1) and the regression analysis (points V–VI, Figure 1).
To answer the first research question and achieve Aim 1a, a preliminary selection of specific economic and environmental indicators for the dairy sheep sector was carried out. The second step concerned measuring farms’ economic and environmental indicators for each farm. After that, the information obtained during those phases was merged by creating a synthetic indicator for each dimension. The last step evaluated the existence and magnitude of synergy or trade-off between the two sustainability dimensions, thus allowing the achievement of Aim 1b and providing significant information to facilitate assessment and decision making by farmers and policymakers.
Subsequently, to achieve Aim 2 and answer our second research question, we selected significant structural variables of farms and socio-demographic variables of farmers and studied the relationship between these and the economic and environmental performance of farms using regression analysis.

3.2.1. Selecting Farms’ Economic and Environmental Sustainability Indicators

To identify the degree of economic and environmental sustainability of each farm, economic and environmental indicators that provide reliable and relevant information for the analysis were selected. This step is crucial because selecting a well-defined indicator through a transparent procedure is necessary for the credibility and reproducibility of this study [69].
The economic dimension includes six indicators describing agricultural productivity, cost, and profitability, which have already been used in previous research [5,17,37,64,70,71]. The procedure for calculating points based on FADN standard output codes (specifically indicated) is shown.
  • ECI1: Farm Net Value added (NVA) per agricultural work unit (AWU, the full-time equivalent of employment) (NVA/AWU) (SE425). It indicates the ability to remunerate all resources used in farm activities, and it is a source of labor, land (rent), and capital (interest) cost coverage.
  • ECI2: Total output per AWU (SE131/SE010). It considers sales of individual products, in-house use, captive consumption, and changes in closing stocks from opening ones.
  • ECI3: Total output livestock per total livestock units (LU) (SE206/SE080).
  • ECI4: Specific livestock costs per LU (SE309). It includes direct production costs, e.g., the costs of seed, fertilizers, feed, veterinary expenses, etc.
  • ECI5: Productivity of intermediate consumption (SE131/SE275). It is the ratio between the total output and the total intermediate consumption. It estimates the production cost effectiveness, i.e., the ability to cover production costs without considering depreciation and externalities, make a profit, and allow expanded reproduction without state intervention.
  • ECI6: Return on equity (ROE) (SE420/SE501). It is calculated as the ratio of farm net income (FNI) to shareholders’ equity. It measures how efficiently the company uses resources, i.e., the profitability of investments in the farm’s assets.
The environmental dimension was assessed using data from eleven indicators, some of which were already used in various combinations in previous research [5,17,37,63,66,72,73,74]. This work represents an evolution of those studies as it includes two indicators not previously used, such as animal emissions and carbon sequestration, which we consider critical in evaluating the environmental performance of farming because they complete the picture provided by a set of more generic indicators. At the European level, including an indicator that evaluates the greenhouse gas (GHG) produced by animals appears to be paramount, because the livestock sector is considered one of the main contributors to the environmental impacts of agriculture, mainly due to GHG emissions [28]. At the same time, carbon sequestration can partly counteract the livestock sector’s climate impact [75,76]. The grasslands on which dairy farms graze their animals can increase carbon sequestration so that CO2 is captured through stable and solid forms in the soil, thus reducing farmers’ carbon footprint per kilogram of milk. Therefore, adding the carbon sequestration indicator in the environmental assessments of dairy products has been demonstrated to significantly impact the conclusions when evaluating various management alternatives, such as feed strategies [77,78].
  • ENI1: Organic fertilizers used. It was elaborated by comparing the total cost of organic fertilizers indicated in the Italian FADN (i.e., humus and manure from cattle, buffaloes, horses, granivores, sheep, goats, and other animals) to the farm’s total utilized agricultural area (UAA) (SE025). The more organic fertilizers applied, the higher the farm scores.
  • ENI2: Use of industrial mineral fertilizers per UAA. It was elaborated by comparing the total cost of industrial mineral fertilizers indicated in the Italian FADN (i.e., solid mineral and organic mineral solid fertilizers) to the UAA of the farm (SE025). The fewer the industrial mineral fertilizers that are applied, the higher the farm scores.
  • ENI3: Use of pesticides per UAA. It was elaborated by comparing the total cost of crop protection to the UAA of the farm (SE300/SE025). The fewer the pesticides that are applied, the higher the farm scores.
  • ENI4: Use of water, energy, and fuels. It was elaborated by comparing the total cost of water, energy, and fuels indicated in the Italian FADN to the total production (SE131). The lower the consumption, the higher the company’s score.
  • ENI5: Share of clover. Using data from the Italian FADN, the ratio between meadow hectares with leguminous crops and the farm UAA (SE025) was calculated.
  • ENI6: Stocking density. It is the ratio between total livestock units and the business UAA (SE080/SE025).
  • ENI7: Multiannual and perennial crops per UAA. Taking data from the Italian FADN, the ratio between multiannual and perennial crops and the farm UAA (SE025) was calculated.
  • ENI8: Greening. Based on the Italian FADN database, it indicates the number of measures a farm adheres to.
  • ENI9: Renewable energy. Based on the Italian FADN, the farm’s presence of renewable energy sources was assessed (binary value 0 or 1).
  • ENI10: Animal emissions. It is calculated as the share of animal emissions per LU (CO2eq/SE080). Precisely, based on Italian FADN data and the refined Tier 1 method elaborated by the Intergovernmental Panel on Climate Change [79,80], two emission types were calculated, including the enteric methane (CH4) emissions from fermentation occurring in the rumen and from manure management, and nitrous oxide (N2O) emissions from manure management. These emissions were converted into a single indicator that measures the animal CO2eq emission for each farm. Details of the calculation methods are available in Appendix A.
  • ENI11: Carbon sequestration. It is calculated as the share of carbon sequestration per UAA (CO2/SE025). The coefficients of potential carbon sequestration were calculated based on indices set out in the previous literature [81,82,83,84]. The calculation method details are available in Appendix B.

3.2.2. Composite Indicator Creation

Agricultural trade-off analysis and sustainability definition rely on indicators [85,86,87]. Sustainability is a multidimensional concept that, therefore, requires a holistic approach. Such a feature makes the assessment of sustainability one of the most complex analyses [88,89]. Starting from these premises, the sustainability analysis cannot be based on a single indicator but rather on a set of indicators [46] that must be comparable and that can be aggregated [85].
These drawbacks can be overcome using composite indicators, which, by condensing the complexity and multidimensionality of the various indicators, make it possible to evaluate and compare results arising from different realities [46,90]. It should also be pointed out that the use of composite indicators is a debated topic. In fact, according to some studies [85,91], they do not provide complete information on the phenomenon under analysis and can lead to erroneous conclusions. Politicians and stakeholders nonetheless recognize them as a powerful tool for policymaking and public communication, providing information on sustainability dimensions development at various scales of analysis, and summarizing and focusing large amounts of complex information into a manageable amount of meaningful information [46,92,93].
A composite indicator means the mathematical combination of individual scores representing different aspects of the phenomenon under investigation [94]. Specifically, in this work, because the analysis was carried out over two years, an average of each value of data reported by the Italian FADN for the two years under analysis was preliminarily carried out for each farm.
The first step in creating a composite indicator requires reducing multidimensionality in favor of a standard scale through the normalization process, which can occur via different techniques. In this research, the normalization was performed in two phases. Firstly, ranking normalization was adopted, being one of the most widely employed techniques [95], by which the single score of each indicator of the economic (ECi) and environmental (ENi) dimensions for each farm was calculated based on the distance from the maximum value. In this way, the individual values of each indicator fell within the range [0, 1]. Afterwards, z-score normalization was used. Such normalization was calculated by subtracting the mean from an indicator value and dividing it by its standard deviation. This technique provides a dimensionless output, and the differences between the normalized values are preserved thanks to a linear transformation. Moreover, z-score is preferred when extreme values are present in the dataset [92]. In this regard, it should be noted that other normalization techniques, such as distance from a target value or min–max normalization, cannot be applied in this study due to the absence of target, minimum, and maximum values for all of the indicators considered.
After normalization, the second step involves merging singular scores into composite indicators. For this purpose, this work adopted the arithmetic mean, a common aggregation technique where the normalized indicators are summed to compute the arithmetic mean [96]. This methodology may be subjected to the compensatory effect. However, this effect is negligible due to the research objective of evaluating the trade-off between the two dimensions in their entirety and not between individual indicators. In sum, the economic (EC) and environmental (EN) aggregated indicators were calculated as follows:
E C = n = 6 1 E C I i N
E N = n = 11 1 E N I i N
where the ECIi and ENIi indicate the single economic and environmental indices used to calculate the economic (EC) and environmental (EN) aggregated indicators.

3.2.3. Trade-Offs and Synergy Analysis

Trade-off analysis is based on two concepts: resource scarcity and opportunity cost. It determines the effect of the decrease of one or more key factors and the simultaneous increase of other key factors within a process.
In recent years, this theory, first applied to agriculture in the 1970s to define the economic impact of new agricultural technologies on the primary sector [97], has been increasingly used to assess agricultural sustainability. The reason lies mainly in the need to adequately measure the presumed mutual reciprocity of the components of sustainability and verify whether the agricultural and environmental objectives envisaged by the new European policies can be achieved without penalizing the agricultural economic sphere.
In this way, Špička et al. [39], analyzing the compatibility of economic and environmental sustainability objectives in 1189 Czech farms through data from the FADN, found a moderate trade-off between the two dimensions in the total sample, which increased when analyzing farms according to their economic size. Similar conclusions arose from Masi et al. [17], whose analyzed FADN data related to 1211 Italian dairy and buffalo farms to identify relations among all dimensions of sustainability and farms’ structural profiles.
Despite the increasing relevance of the trade-off analysis in the agricultural field and the dairy sheep sector, to our knowledge, no study has previously assessed the degree of sustainability in dairy sheep farming.
This work evaluated the presence of trade-off or synergy relationships between EC and EN using the Pearson correlation analysis (r), which has been widely used in trade-off analysis in the past [37,98,99,100]. The purpose of this analysis was to describe both the direction as well as the strength of the linear relationship between two continuous variables. Pearson correlation coefficients range from −1.00 to 0.00 to +1.00. In order to interpret the descriptive significance of the magnitude of the coefficient absolute value, the following criteria were used [101]: (1) r = 0.00 implies that there is no statistical association, (2) r ± 0.20 signifies weak association, (3) r ± 0.50 indicates a moderate association, (4) r ± 80 suggests a strong association, and (5) r = 1.00 indicates a perfect association. The results are tested at confidence level α = 0.1.

3.2.4. Analysis of the Relationships between EC, EN, and Structural and Socio-Demographic Variables

The farms’ structural profiles and the socio-demographic farmers’ variables considered relevant are the following:
  • Gender (G). It is a binomial variable taking a value of 0 if the farm manager is male or 1 if she is female.
  • Age (Y). It is a binomial variable that follows the young farmer’s CAP definition, according to which she/he can be a maximum of 35–40 years old (Italy set 40 years old as the age limit). Therefore, the variable is 1 if the farm manager is 40 years old or younger and 0 on the contrary.
  • Education (E). This variable can assume a value that ranges from 1 to 4 as the farm manager’s education level increases: 1, holding only an elementary school leaving certificate; 2, holding a lower middle school leaving certificate; 3, holding a high school diploma or a professional diploma; and 4, holding a university degree.
  • Organic (O). It is a binomial variable obtained by taking a value of 0 if the farm is conventional (non-organic) or 1 if the farm is organic.
  • Diversification (D). It is a binomial variable obtained by taking a value of 0 if the farm does not diversify or a value of 1 if, instead, it implements diversification.
To identify the relationships between those variables and indicators of EC and EN, regression analysis was used. This statistical tool allows for showing the significant impact of a set of independent variables (predictors) on the dependent variables [102], and the extent to which variance in a continuous dependent variable can be explained by a set of predictors. Therefore, it allows us to identify the influence of structural and socio-demographic variables on the environmental and economic performance of Sardinian dairy sheep farms. To explore the relationships between these variables and the aggregated indicators of EC and EN, two regressions were performed:
E C = α G + β Y + γ E + ε O + ζ D
E N = α G + β Y + γ E + ε O + ζ D
where α, β, γ, O, and ζ are the exposure (gradients) to the respective independent variables G, Y, E, O, and D., i.e., regression parameters for the slope.

4. Results

4.1. Sample Profile

The 219 Sardinian dairy sheep farms are run by men in 89% of cases; most of the individuals (81.7%) are over 40 years of age. As to education level, most farmers have a lower middle school degree (63.9%), almost a quarter (22.4) of the sample have a diploma from high school, and as many as 11% have no lower middle school diploma. Only five farmers have a university degree.
Concerning the geographical distribution, almost 38% of farms are located in the province of Sassari, whereas a quarter are situated in the province of Nuoro. The remaining 37% is equally distributed between the Oristano and Cagliari provinces. The sample revealed low diversification and organic management, with 7 farms and 11 farms out of 219, respectively. The data are reported in Table 1.
The following Table 2 and Table 3 show the economic and environmental indicator statistics and the farms’ performances for each proposed indicator.
The analysis of the distribution of means and standard deviation for the economic dimensions shows that, in general, the sample of farms analyzed presents a wide variability, and it is thus rather heterogeneous.
The high values assumed by ECI1 and ECI2 could be due to the fact that these types of farms often use family work, and the entity of these work units within the AWU can vary among the farms. Concerning the ECI6 index, the results show a fairly good average ROE (0.27 ± 0.34), although there is a lot of heterogeneity between farms. However, it should be underlined that this indicator, because it considers the net income as the numerator, also includes the revenue deriving from CAP.
Regarding the environmental indicators, there is a high sample variability for the ENI 1, 2, 3, 5, and 7 variables, while the rest of the environmental indicators show more homogeneity. The first thing to highlight is the reduced use of mineral fertilizers and pesticides. These data are extremely important, as they reflect one of the objectives of European policies and emphasize the active role of sheep farming in achieving them.
As regards animal density, indicated by ENI6—which is an important parameter for defining the protection of pasture [103,104]—the farms analyzed, albeit with a fairly wide range (1.43 ± 0.84 LU/UAA), are within the optimal range of animal load, identified by the legislator as between the values of 0,2 (condition of undercharge) and 4 LU/UAA (condition of overload) [104]. The use of renewable energy (ENI9) in the farms analyzed is almost completely absent.
For ENI10 and ENI11, the values obtained from our analysis are higher than those presented in the literature [105,106], but these differences are due to the different calculation methods. For animal emissions, in this analysis, we chose to use the IPCC methodology, which is widely used in similar studies and universally recognized [107]. Furthermore, a different unit of measurement was used compared to most studies analyzing the impact of animal emissions, which are generally allocated per kg of Fat and Protein Corrected Milk (FPCM) [105,106]. In our study, the functional unit used is LU, because data on annual milk production were not available. Regarding the carbon sequestration definition, the differences from previous studies (i.e., [108]) are due to (i) the species included in the calculation and (ii) the carbon sequestration rate used and the methodologies adopted to define these rates.

4.2. Trade-Off between Economic and Environmental Performance

Table 4 illustrates the results of the Pearson correlation analysis, thus allowing us to evaluate the strength of the linear relationship between the economic and environmental performance in Sardinian dairy sheep farms and provide an answer to our first research question. The correlation analysis shows that the two variables considered are significantly positively correlated with each other (p-value < 0.1). Accordingly, despite the low intensity of the relationship between variables, there is a systematic relationship between these variables, and they are mutually reinforcing because they increase as one variable increases. This means that an increase in their profitability leads to an increase in the sector’s contribution to achieving the environmental sustainability goals of the EU.

4.3. Relationship between Economic and Environmental Performance and Structural and Socio-Demographic Variables of Farms

Two models were used to analyze the relationships between the economic and environmental dimensions and the structural and socio-demographic variables considered, one with a constant and the other without. The Generalized likelihood-ratio test (λ) was used to determine which of the two models most suited our needs. For each regression analysis, the model with a constant variable was compared to that without a constant variable. The statistic associated with this test is defined as [109]:
λ = −2ln L = −2 [ln L(H0) − ln L(H1)]
where L (H1) and L (H0) are the log-likelihood values of the model with or without a constant variable, respectively. The statistic parameter l has a chi-square distribution with different degrees of freedom that match the number of parameters deleted. These are assumed to be zero in the null hypothesis Ho. The null hypothesis cannot be rejected if λ is lower than the corresponding critical value for a given significance level.
The results of the Generalized likelihood-ratio test are reported in Table 5. In both cases, for the EN and EC models, the λ value was higher than the tabular value χ2, so we accepted the null hypothesis and used the models without the constant.
Using regression analysis, we were able to answer our second research question. The first regression analysis showed that one socio-demographic variable and one structural farm variable influence the economic performance of farms positively; these are young (p value < 0.1) and organic (p value < 0.05). The model fits the data well (p-value (F) < 0.05); however, the R2 is not high, implying that the pool of variables on the whole weakly affects the dependent variable.
Surprisingly, the environmental dimension is not linked to any of the structural profiles of farms or the socio-demographic variables of farmers considered. The model does not statistically fit the data—the p-value (F) is really high—and the R2 is extremely low, meaning these selected variables do not conditionate the environmental dimension.
The results of the regressions are reported in Table 6 (economic dimension as dependent variable) and Table 7 (environmental dimension as dependent variable), respectively.

5. Discussion

The agricultural sector is the backbone of the economy in many developed and developing countries, and it has an essential role in achieving sustainability goals. In the vision for a more sustainable food system in the EU, farms should be more environmentally friendly and socially acceptable, and they must ensure enough income for the farm owner. To achieve these objectives, it is necessary to preliminarily define proper indicators capable of evaluating the degree of the entirety of sustainability dimensions of the farm, and policymakers should pursue policies aimed at realizing win–win opportunities between the environmental and economic dimensions of farms.
This paper focused on this issue, and it had two aims investigated by concentrating on an important sector: dairy sheep farming. Firstly, this paper aimed to respond to previous research calls to provide indices to assess the sustainability in farms and investigate the type of relationship between the environmental and economic performances of farms. Secondly, this paper aimed to investigate which structural profiles of farms and socio-demographic variables of farmers could affect the economic and environmental performances of dairy sheep farms and foster their durability and “just transition” towards a sustainable livestock system that is environmentally friendly and economically viable for farmers.
Going into the details of the sample, over 80% of the sample is represented by male farmers over 40 years of age and with a low level of education. This could be the reason for the almost complete absence of diversification, which is one of the strategies households employ to increase and stabilize income, reduce risks, and maintain food security by making use of diverse assets and opportunities provided by their environment and the markets they can access [110,111]. Whether diversification occurs in other sectors beyond livestock farming, such as arable farming or non-agricultural incomes, it could be a profitable strategy, especially for the pastoral regions [111,112]. Our findings confirm previous research [110,113], according to which a higher level of formal education and the older age of farmers affect the diversification strategy and the farm’s production, the first positively and the second negatively, in addition to the adaptation and adoption of changes and new technologies.
Concerning the first aim, we preliminarily calculated the single economic and environmental indices, and then we elaborated two composite indicators used to perform the trade-off analysis (Aim 1a). In reference to the economic indicators, farms showed high variability in this, which may be due to a different specialization of the sheep farms that can be found in Sardinia. In fact, even with the same farm size and number of animals, farms with different production assets can exist in terms of infrastructure and, most importantly, genetic diversity [114], with differences in milk production.
Regarding the environmental indices, this study expands previous research in which farm-level sustainability indicators were considered (i.e., [37]), including some of the crucial aspects important in the evaluation of the sustainability of livestock sector performances, because they influence farms’ climate impact and the choice between different management alternatives, such as feeding strategies. These aspects are the GHG produced by animals and the carbon sequestration. Actually, animal emissions represent the main source of GHG pollution in dairy sheep farms [108]. At the same time, the carbon sequestration indicator contributes not only to mitigating the impact derived from livestock farming, but it also highlights the positive role that this type of farm plays in providing ecosystem services [108,115]. Including these indicators calculated with specific coefficients for the type of breeding and composition of the flocks increases the degree of fidelity of the sustainability indicators to reality and makes them operative to guide decisions at the farm level, as well as highlighting how the sector affects societies and the environment.
Studying how the environmental and economic performances of farms are related (Aim 1b) by analyzing the result of the trade-off analysis, this study answered the first research question. Specifically, it identified a positive and significant synergy between the economic and environmental dimensions of dairy sheep farming, even if low. This is an important result from the political point of view as it indicates that these farms can play an active role in achieving the objectives of a fair transition dictated by the new European policies [13], and it underlines the importance of political and economic support towards this type of activity [14].
Although there are currently policies to support pastoralism, sheep farming is one of the least supported sectors and one of the least profitable activities, together with goat raising [105,116]. Often, the profitability of livestock farms is supported by the presence of public financial aid, which can represent up to 75% of the total output [117]. The reduced profitability and the growing uncertainties that this sector has to face are leading to a reduction in the number of farms and an increasingly limited generational renewal [118]. Policymakers and decision makers have a double task. First of all, they must safeguard the existence of these types of farms, which are useful for achieving green objectives and represent a cornerstone for the protection of territories that, without this activity, would be subjected to abandonment and degradation [116]. Secondly, they must make measures to support livestock farming more feasible. Indeed, if it is true that the EU recognizes the multifunctional role of this sector through targeted policies, it is also true that these are often based on complicated procedures that are inconsistent or conflicting with each other, which might discourage breeders from pursuing their activities [116].
In this context, our findings are a starting point for decision makers called to define measures to support the sector. Indeed, while being aware that it is not automatically achieved and that the choices need to be weighed, the synergy between the economic and environmental dimensions suggests that leveraging one dimension can favor the development of the other. It is, therefore, crucial for the sustainable development of the sector to turn the farmers’ environmental care into income opportunities for dairy sheep farms [115] by developing an effective and efficient mechanism that translates farms’ environmental dimension growth into their economic dimension growth and vice versa.
Moving on to the second objective of our study, the structural profiles (Diversification and Organic) and socio-demographic variables (Gender, Age, and Education) used in our analysis agree with those used in similar studies [16,17].
Using the regression between the aforementioned data and the economic dimension to answer our second research question, we identified two positive and significant relationships, one relating to the young age of the farmers and the other to the fact that the farm is organic.
The first represents an important signal, as the presence of young farmers is fundamental to face the new challenges posed to this sector [18], and the generational renewal of agriculture and livestock farming is critical for the long-term survival of these in the EU [19]. Despite this, in recent years in the EU, there has been a decreasing trend in the number of young farmers [20], which specific CAP measures have attempted to counterbalance.
The presence of a positive relationship between the economic dimension and organic animal production is a finding confirmed by the previous literature [21,22], even if it is a debated question. Often, the greater cost effectiveness of organic farms is due only to the CAP measures that favor the implementation of this production model. Moreover, according to some authors [21,23], although this production method is more environmentally friendly, it presents difficulties, such as high production costs, lower productivity, and excessive bureaucracy, which can discourage farmers from applying it. Therefore, it is necessary to analyze this relationship more deeply to understand the actual nature of these factors.
However, as regards the regression between the environmental dimension and the variables analyzed, no relationship was found. This fact can be attributed to two reasons: (i) the environmental dimension is influenced by other variables that were not considered in our analysis, and (ii) the economic dimension is separate and not linked to socio-demographic or structural variables.
Some limitations affect our research. The empirical evaluations can be affected by the nature of the data on which they are carried out. Although the FADN is one of the most reliable databases, you may have to deal with deficient data, which can translate into possible sample bias [119]. Furthermore, although similar approaches are found in the literature on this issue, our choice is characterized by a certain degree of discretion both for the selection of individual indicators and for the procedure for calculating the value of the synthetic sustainability indicators (EC and EN). Concerning the procedure, using other methodologies (e.g., Multi-Criteria Analysis or Fuzzy Analysis) could be an alternative proposal, as could the possibility of weighing the individual indicators rather than using the arithmetic mean. Regarding the indicators, their selection can influence the conclusions of the analysis [16]. However, because the selected environmental and economic indicators have previously been used in other preceding studies and the greenhouse gas and carbon sequestration indicators have allowed for in-depth investigation of the sustainability performance of farms, despite these limitations, our results suggest several important academic, practical, and policy implications.

6. Conclusions

This study, to our knowledge, is the first to evaluate the relationship between the economic and environmental sustainability dimensions in dairy sheep farming and between each of them and some structural and socio-demographic variables.
Firstly, it takes up the call of several authors who emphasize the need to provide indices assessing sustainability at the farm level [44,45] using a set of indicators [46].
In terms of academic implications, this study fills a gap in the literature regarding farms’ sustainability assessment [44,45,46] by providing a measure of economic and environmental performance at the farm level through a set of indicators that grasp different aspects of farm management. This is really relevant, because the farm (i) is the first level at which policy measures are implemented, (ii) provides us with the highest degree of detail and is, therefore, the most useful site to assess whether sustainability practices have an effect or not, and (iii) is directly affected by the negative effects of climate change and, at the same time, benefits from the green practices that are applied.
Moreover, this paper, using a set of indicators for economic and environmental dimensions, offers a more realistic view of the sector, because sustainability is a multifaceted concept that is not correctly represented using a singular indicator or by examining only one dimension.
Again, this study is the first that combines the use of FADN indicators with indicators deriving from other methodologies, such as the IPCC tier 1 [79,80] for the methane and nitrous oxide calculation and the carbon sequestration definition.
Finally, because the definition of sustainability must consider structural and socio-demographic variables of farms, as they can positively or negatively influence their sustainability dimensions, this paper shows which variables to leverage to foster farms’ sustainability.
With reference to policy issues, knowing the relationship between the farm’s environmental and economic dimensions is fundamental because it allows politicians to understand whether the green transition they aspire to meet takes place from a win–win perspective between environmental sustainability and economic profitability. Furthermore, underlining the active role of the sector in pursuing green objectives offers a valid justification for public support, which is often defined as disproportionate.
Finally, our findings show the need to foster young breeders, who are fundamental to guarantee the durability of the dairy sheep sector, which has also been recognized to be crucial in light of the social role played by the sector to protect the territory.
As regards the implications for workers in the sector, knowing that applying more environmentally sustainable practices can also lead to better farm economic performance, it may be an incentive to move towards different production methods considered more sustainable.
This research can be extended in several directions. First, future research is warranted to evaluate whether, in other contexts where the structural profile of the companies and the socio-demographic variables of the farmers are different, the results of the trade-off analysis are different or not. Furthermore, it would be interesting to repeat this analysis in the same sector in other regions and states to see how the regional and political contexts influence sustainability, so that a cross-sectional research design can strengthen our research’s implications. Future research can also repeat the analysis by investigating other livestock and agriculture sectors by adapting the animal emissions and carbon sequestration to the cases analyzed. Expanding this type of study to the social dimension is also important due to its pivotal role in achieving the sustainability of the sector and its increasing role in the CAP.

Author Contributions

Conceptualization, B.A., F.C., R.F., F.A.M., P.P. and P.S.; methodology, B.A., F.C., F.A.M. and P.S.; formal analysis, B.A., F.C., F.A.M. and P.S.; investigation, B.A., F.C., F.A.M. and P.S.; writing—original draft preparation, B.A. and P.S.; writing—review and editing, B.A., F.C., R.F., F.A.M., P.P. and P.S.; visualization, B.A. and P.S.; supervision, F.A.M. and P.P.; project administration, P.P.; funding acquisition, B.A., F.A.M. and P.P. All authors have read and agreed to the published version of the manuscript.

Funding

This research was funded by ‘Fondo di Ateneo di Sassari della ricerca 2019’, “Sistema di indicatori e strategie del comparto lattiero-caseario ovino sardo”, granted by Fondazione di Sardegna, and “Bando Fondazione di Sardegna 2017—Progetti di ricerca di base dipartimentali”.

Institutional Review Board Statement

Not applicable.

Informed Consent Statement

Not applicable.

Data Availability Statement

Data that support the findings of this study are available from the corresponding author upon reasonable request.

Conflicts of Interest

The authors declare no conflict of interest.

Appendix A. Calculation Method for Animal Emissions

The enteric fermentation emissions produced by sheep are calculated as follows:
E F e i = E F i     N i
where:
EFei = enteric methane emissions in sheep category (kg CH4 yr−1);
Ni = number of heads;
EFi = emission factor per sheep category (kg CH4 head−1 yr−1) (the parameters are indicated in Table A1).
Table A1. Enteric emission factor per sheep category.
Livestock CategoriesEmission Factor EFi (kg CH4 head−1 yr−1)Source
Sheep9[79]—Table 10.10
The methane emissions from manure management produced by sheep are calculated as follows:
EMm i = ( N i     VS i     AWMS i     EF i ) / 1000
where:
  • EMmi = methane emissions from manure management in sheep category (kg CH4 yr−1);
  • Ni = the number of heads;
  • VSi = annual average of volatile solids (VS) per head of sheep (kg VS head−1 yr−1) (Equation (A3));
  • AWMSi = animal waste management systems, i.e., the fraction of VSi for sheep category (dimensionless) (the parameters are indicated in Table A2);
  • EFi = emission factor for direct CH4 emissions from manure management system for sheep (g CH4 kg VS−1) (the parameters are indicated in Table A3).
Table A2. Animal waste management system values.
Livestock CategoriesAWMSiSource
Sheep0.58[79]—Table 10A.8
Table A3. Values of emission factor for direct CH4 emissions from manure management system by sheep category.
Livestock CategoriesEmission Factor EFi (g CH4 kg VS−1)Source
Sheep5.1[79]—Table 10.14
The annual average of volatile solids (VS) per head are calculated as follows:
VS i = VS rate     TAM i 1000     365
where:
  • VSrate = default VS excretion rate (kg VS 1000 kg animal mass−1 d−1) (the parameters are indicated in Table A4);
  • TAMi = typical animal mass for sheep (kg) (the parameters are indicated in Table A5).
Table A4. Values of VS excretion.
Livestock CategoriesVS Excretion Rate (kg VS 1000 kg Animal mass−1 d−1)Source
Sheep8.2[79]—Table 10.13a
Table A5. Typical animal masses.
Livestock Species and CategoriesTAM (kg)Source
  Sheep [120]
  Lamb27.4
  Replacement ewe38
  Ewe45
  Ram65
  Slaughter sheep45
The direct N2O emissions from manure management are calculated as follows:
Dir N 2 O = N i     Nex i     AWMS i     EF i     44 28
where:
  • DirN2O = direct N2O emissions from manure management (kg N2O yr−1);
  • Ni = the number of heads;
  • Nexi = annual average nitrogen (N) excretion per head (kg N head−1 yr−1);
  • AWMSi = animal waste management systems, i.e., the fraction of total annual N excretion for sheep category (dimensionless) (the parameters are indicated in Table A2);
  • EFi = emission factor for direct N2O emissions from manure management system (kg N2O-N kg N−1) (the parameters are indicated in Table A6);
  • 44/28 = conversion of N2O-N(mm) emissions to N2O(mm) emissions.
Table A6. Value of direct N2O emission factors.
Livestock CategoriesEmission Factor EFi (kg N2O-N kg N−1)Source
Sheep0.003[80]—Table 11.1
The annual N excretion rates are calculated as follows:
Nex i = N rate     TAM i 1000     365
where:
  • Nexii = annual N excretion per head (kg N head−1 yr−1);
  • Nrate = default N excretion rate (kg N 1000 kg animal mass−1 d−1) (the parameters are indicated in Table A7);
  • TAMi = typical animal mass (kg) (the parameters are indicated in Table A5).
Table A7. Value of nitrogen of excretion rate.
Livestock CategoriesNrate (kg N 1000 kg Animal Mass−1 d−1)Source
Sheep0.36[80]—Table 10.19
The indirect N2O emissions due to the volatilization of N from manure management are calculated as follows:
Ind N 2 O vol = N vol     EF at     44 28
where:
  • IndN2Ovol = indirect N2O emissions due to volatilization of N from manure management (kg N2O yr−1);
  • Nvol = amount of manure nitrogen lost due to volatilization of NH3 and NOx (kg N yr−1);
  • EFat = emission factor for N2O emissions from atmospheric deposition of nitrogen on soils and water surfaces (kg N2O-N (kg NH3-N + NOx-N volatilized)−1 (the parameters are indicated in Table A8);
  • 44/28 = conversion of N2O-N(mm) emissions to N2O(mm) emissions.
Table A8. Emission factor for N2O emissions from atmospheric deposition of nitrogen on soils and water surfaces.
Livestock CategoriesEFat (kg N2O-N (kg NH3-N + NOx-N Volatilized)−1Source
Sheep0.01[80]—Table 11.3
The nitrogen losses due to volatilization from manure management are calculated as follows:
N vol = ( N i     Nex i )     AWMS i     Frac gas i
where:
  • Nvol = amount of manure nitrogen lost due to volatilization of NH3 and NOx (kg N yr−1);
  • Ni = the number of heads;
  • Nexi = annual average nitrogen (N) excretion per head (kg N head−1 yr−1);
  • AWMSi = fraction of total annual N excretion for sheep category managed in manure management (dimensionless) (the parameters are indicated in Table A2);
  • Fracgasi = fraction of managed manure nitrogen for sheep category that volatilizes as NH3 and NOx in the manure management (dimensionless) (the parameters are indicated in Table A9).
Table A9. Fraction of managed manure nitrogen that volatilizes as NH3 and NOx.
Livestock CategoriesFracgasiSource
Sheep0.12[80]—Table 10.22
The indirect N2O emissions due to leaching from manure management are calculated as follows:
Ind N 2 O leach = ( N leac     EF leach )     44 28
where:
  • IndN2Oleach = indirect N2O emissions due to leaching and runoff from manure management (kg N2O yr−1);
  • Nleach = amount of manure nitrogen lost due to leaching (kg N yr−1);
  • EFleach = emission factor for N2O emissions from nitrogen leaching and runoff (kg N2O-N kg N leached and runoff−1) (the parameters are indicated in Table A10);
  • 44/28 = conversion of N2O-N(mm) emissions to N2O(mm) emissions.
Table A10. Emission factor for N2O emissions from nitrogen leaching and runoff.
Livestock CategoriesEFleach (kg N2O-N kg N Leached and Runoff−1)Source
Sheep0.011[80]—Table 11.3
The nitrogen losses due to leaching from manure management are calculated as follows:
N leach = ( N i     Nex i )     AWMS i     Frac leach i
where:
  • Nleach = amount of manure nitrogen lost due to leaching (kg N yr−1);
  • Ni = the number of heads;
  • Nexi = annual average nitrogen (N) excretion per head (kg N head−1 yr−1);
  • AWMSi = fraction of total annual N excretion for sheep category managed in manure management (dimensionless) (the parameters are indicated in Table A2);
  • Fracleachsi = fraction of managed manure nitrogen for sheep category that is leached from the manure management (dimensionless) (Table A11).
Table A11. Fraction of managed manure nitrogen for sheep category.
Livestock CategoriesFracleachiSource
Sheep0.02[80]—Table 10.22

Appendix B. Calculation of Carbon Sequestration

The carbon sequestration value of the crops reported in Table A12 was estimated using data elaborated by previous studies.
Table A12. Carbon sequestration rate for each crop typology.
Type of CropCarbon Sequestration Rate (tons C ha−1 yr−1)Source
Pastures0.20[81]
Legumes (for grazing and grain)0.88[82]
Grasses (for grazing and grain)0.21[83]
Forage mixture of grasses and legumes0.36[84]

References

  1. Atzori, A.S.; Bayer, L.; Molle, G.; Arca, P.; Franca, A.; Vannini, M.; Cocco, G.; Usai, D.; Duce, P.; Vagnoni, E. Sustainability in the Sardinian Sheep Sector: A Systems Perspective, from Good Practices to Policy. Integr. Environ. Assess. Manag. 2022, 18, 1187–1198. [Google Scholar] [CrossRef] [PubMed]
  2. Kanter, D.R.; Musumba, M.; Wood, S.L.R.; Palm, C.; Antle, J.; Balvanera, P.; Dale, V.H.; Havlik, P.; Kline, K.L.; Scholes, R.J.; et al. Evaluating Agricultural Trade-Offs in the Age of Sustainable Development. Agric. Syst. 2018, 163, 73–88. [Google Scholar] [CrossRef]
  3. Arru, B.; Furesi, R.; Pulina, P.; Sau, P.; Madau, F.A. The Circular Economy in the Agri-Food System: A Performance Measurement of European Countries. Food Econ. 2022, 24, 1–35. [Google Scholar] [CrossRef]
  4. Verbeek, A.; Fackelmann, S.; McDonagh, B. Feeding Future Generations: How Finance Can Boost Innovation in Agri-Food; European Investment Bank: Luxembourg, 2019; ISBN 978-92-861-4298-7. [Google Scholar]
  5. Díaz de Otálora, X.; del Prado, A.; Dragoni, F.; Estellés, F.; Amon, B. Evaluating Three-Pillar Sustainability Modelling Approaches for Dairy Cattle Production Systems. Sustainability 2021, 13, 6332. [Google Scholar] [CrossRef]
  6. Finco, A.; Bentivoglio, D.; Bucci, G. Lessons of Innovation in the Agrifood Sector: Drivers of Innovativeness Performances. Econ. AGRO-Aliment. 2018, 20, 181–192. [Google Scholar] [CrossRef]
  7. FoodDrinkEurope. Data & Trends of the European Food and Drink Industry 2021; FoodDrinkEU: Brussels, Belgium, 2021. [Google Scholar]
  8. Grau, A.; Reig, A. Operating Leverage and Profitability of SMEs: Agri-Food Industry in Europe. Small Bus. Econ. 2021, 57, 221–242. [Google Scholar] [CrossRef]
  9. Juchniewicz, M.; Łukiewska, K. Diversity of the International Competitive Performance of the Food Industry of the European Union Member States. Agribusiness 2021, 37, 422–437. [Google Scholar] [CrossRef]
  10. European Commission. The European Green Deal; European Commission: Brussels, Belgium, 2019. [Google Scholar]
  11. European Commission. Farm to Fork Strategy for a Fair, Healthy and Environmentally-Friendly Food System; European Commission: Brussels, Belgium, 2020. [Google Scholar]
  12. European Commission. Biodiversity Strategy for 2030 Bringing Nature Back into Our Lives; European Commission: Brussels, Belgium, 2020. [Google Scholar]
  13. European Commission. The Next Generation of Own Resources for the EU Budget; European Commission: Brussels, Belgium, 2021. [Google Scholar]
  14. Dell’Unto, D.; Dono, G.; Cortignani, R. Impacts of Environmental Targets on the Livestock Sector: An Assessment Tool Applied to Italy. Agriculture 2023, 13, 742. [Google Scholar] [CrossRef]
  15. Poponi, S.; Arcese, G.; Pacchera, F.; Martucci, O. Evaluating the Transition to the Circular Economy in the Agri-Food Sector: Selection of Indicators. Resour. Conserv. Recycl. 2022, 176, 105916. [Google Scholar] [CrossRef]
  16. Lebacq, T.; Baret, P.V.; Stilmant, D. Sustainability Indicators for Livestock Farming. A Review. Agron. Sustain. Dev. 2013, 33, 311–327. [Google Scholar] [CrossRef]
  17. Masi, M.; Vecchio, Y.; Pauselli, G.; Di Pasquale, J.; Adinolfi, F. A Typological Classification for Assessing Farm Sustainability in the Italian Bovine Dairy Sector. Sustainability 2021, 13, 7097. [Google Scholar] [CrossRef]
  18. Pulina, G.; Lunesu, M.F.; Pirlo, G.; Ellies-Oury, M.-P.; Chriki, S.; Hocquette, J.-F. Sustainable Production and Consumption of Animal Products. Curr. Opin. Environ. Sci. Health 2022, 30, 100404. [Google Scholar] [CrossRef]
  19. Arvidsson Segerkvist, K.; Hansson, H.; Sonesson, U.; Gunnarsson, S. Research on Environmental, Economic, and Social Sustainability in Dairy Farming: A Systematic Mapping of Current Literature. Sustainability 2020, 12, 5502. [Google Scholar] [CrossRef]
  20. Zanni, S.; Roccaro, M.; Bocedi, F.; Peli, A.; Bonoli, A. LCA to Estimate the Environmental Impact of Dairy Farms: A Case Study. Sustainability 2022, 14, 6028. [Google Scholar] [CrossRef]
  21. Van Cauwenbergh, N.; Biala, K.; Bielders, C.; Brouckaert, V.; Franchois, L.; Garcia Cidad, V.; Hermy, M.; Mathijs, E.; Muys, B.; Reijnders, J.; et al. SAFE—A Hierarchical Framework for Assessing the Sustainability of Agricultural Systems. Agric. Ecosyst. Environ. 2007, 120, 229–242. [Google Scholar] [CrossRef]
  22. Morris, J.; Ensor, J.E.; Pfeifer, C.; Marchant, R.; Mulatu, D.W.; Soka, G.; Ouédraogo-Koné, S.; Wakeyo, M.B.; Topi, C. Games as Boundary Objects: Charting Trade-Offs in Sustainable Livestock Transformation. Int. J. Agric. Sustain. 2021, 19, 525–548. [Google Scholar] [CrossRef]
  23. Muñoz-Ulecia, E.; Bernués, A.; Briones-Hidrovo, A.; Casasús, I.; Martín-Collado, D. Dependence on the Socio-Economic System Impairs the Sustainability of Pasture-Based Animal Agriculture. Sci. Rep. 2023, 13, 14307. [Google Scholar] [CrossRef] [PubMed]
  24. Lebacq, T.; Baret, P.V.; Stilmant, D. Role of Input Self-Sufficiency in the Economic and Environmental Sustainability of Specialised Dairy Farms. Animal 2015, 9, 544–552. [Google Scholar] [CrossRef]
  25. Perrin, A.; Cristobal, M.S.; Milestad, R.; Martin, G. Identification of Resilience Factors of Organic Dairy Cattle Farms. Agric. Syst. 2020, 183, 102875. [Google Scholar] [CrossRef]
  26. Gaudino, S.; Reidsma, P.; Kanellopoulos, A.; Sacco, D.; Van Ittersum, M.K. Integrated Assessment of the EU’s Greening Reform and Feed Self-Sufficiency Scenarios on Dairy Farms in Piemonte, Italy. Agriculture 2018, 8, 137. [Google Scholar] [CrossRef]
  27. Ellen McArthur Foundation. The Circular Economy in Detail. Available online: https://ellenmacarthurfoundation.org/the-circular-economy-in-detail-deep-dive (accessed on 10 October 2023).
  28. Verduna, T.; Blanc, S.; Merlino, V.M.; Cornale, P.; Battaglini, L.M. Sustainability of Four Dairy Farming Scenarios in an Alpine Environment: The Case Study of Toma Di Lanzo Cheese. Front. Vet. Sci. 2020, 7, 569167. [Google Scholar] [CrossRef] [PubMed]
  29. McGee, M.; Lenehan, C.; Crosson, P.; O’Riordan, E.G.; Kelly, A.K.; Moran, L.; Moloney, A.P. Performance, Meat Quality, Profitability, and Greenhouse Gas Emissions of Suckler Bulls from Pasture-Based Compared to an Indoor High-Concentrate Weanling-to-Beef Finishing System. Agric. Syst. 2022, 198, 103379. [Google Scholar] [CrossRef]
  30. Rivera-Ferre, M.; López-i-Gelats, F.; Howden, M.; Smith, P.; Morton, J.; Herrero, M. Re-Framing the Climate Change Debate in the Livestock Sector: Mitigation and Adaptation Options. Wiley Interdiscip. Rev. Clim. Chang. 2016, 7, 869–892. [Google Scholar] [CrossRef]
  31. Boggia, A.; Fagioli, F.F.; Paolotti, L.; Ruiz, F.; Cabello, J.M.; Rocchi, L. Using Accounting Dataset for Agricultural Sustainability Assessment through a Multi-criteria Approach: An Italian Case Study. Int. Trans. Oper. Res. 2023, 30, 2071–2093. [Google Scholar] [CrossRef]
  32. Dumanski, J.; Terry, E.; Byerlee, D.; Pieri, C. Performance Indicators for Sustainable Agriculture; The World Bank: Washington, DC, USA, 1998; pp. 115–1124. [Google Scholar]
  33. Conway, G.R.; Barbier, E.B. After the Green Revolution: Sustainable Agriculture for Development; Earthscan Publications: London, UK, 1990; ISBN 1-85383-035-6. [Google Scholar]
  34. Aldieri, L.; Carlucci, F.; Vinci, C.P.; Yigitcanlar, T. Environmental Innovation, Knowledge Spillovers and Policy Implications: A Systematic Review of the Economic Effects Literature. J. Clean. Prod. 2019, 239, 118051. [Google Scholar] [CrossRef]
  35. Sidhoum, A.A.; Dakpo, K.H.; Latruffe, L. Trade-Offs between Economic, Environmental and Social Sustainability on Farms Using a Latent Class Frontier Efficiency Model: Evidence for Spanish Crop Farms. PLoS ONE 2022, 17, e0261190. [Google Scholar] [CrossRef] [PubMed]
  36. Darnhofer, I.; Fairweather, J.; Moller, H. Assessing a Farm’s Sustainability: Insights from Resilience Thinking. Int. J. Agric. Sustain. 2010, 8, 186–198. [Google Scholar] [CrossRef]
  37. Špička, J.; Vintr, T.; Aulová, R.; Macháčková, J. Trade-off between the Economic and Environmental Sustainability in Czech Dual Farm Structure. Agric. Econ. Zeměd. Ekon. 2020, 66, 243–250. [Google Scholar] [CrossRef]
  38. Bonfiglio, A.; Arzeni, A.; Bodini, A. Assessing Eco-Efficiency of Arable Farms in Rural Areas. Agric. Syst. 2017, 151, 114–125. [Google Scholar] [CrossRef]
  39. Gómez-Limón, J.A.; Sanchez-Fernandez, G. Empirical Evaluation of Agricultural Sustainability Using Composite Indicators. Ecol. Econ. 2010, 69, 1062–1075. [Google Scholar] [CrossRef]
  40. Picazo-Tadeo, A.J.; Gómez-Limón, J.A.; Reig-Martínez, E. Assessing Farming Eco-Efficiency: A Data Envelopment Analysis Approach. J. Environ. Manag. 2011, 92, 1154–1164. [Google Scholar] [CrossRef] [PubMed]
  41. Briner, S.; Huber, R.; Bebi, P.; Elkin, C.; Schmatz, D.; Grêt-Regamey, A. Trade-Offs between Ecosystem Services in a Mountain Region. Ecol. Soc. 2013, 18, 35. [Google Scholar] [CrossRef]
  42. Jaklič, T.; Juvančič, L.; Kavčič, S.; Debeljak, M. Complementarity of Socio-Economic and Emergy Evaluation of Agricultural Production Systems: The Case of Slovenian Dairy Sector. Ecol. Econ. 2014, 107, 469–481. [Google Scholar] [CrossRef]
  43. Reckling, M.; Bergkvist, G.; Watson, C.A.; Stoddard, F.L.; Zander, P.M.; Walker, R.L.; Pristeri, A.; Toncea, I.; Bachinger, J. Trade-Offs between Economic and Environmental Impacts of Introducing Legumes into Cropping Systems. Front. Plant Sci. 2016, 7, 669. [Google Scholar] [CrossRef] [PubMed]
  44. Van Huylenbroeck, G.; Jacobs, G.; Vanrolleghem, P. A Simulation Model to Evaluate the Impact of Environmental Programmes on Dairy Farms. Int. Trans. Oper. Res. 2000, 7, 171–183. [Google Scholar] [CrossRef]
  45. De Olde, E.M.; Oudshoorn, F.W.; Sørensen, C.A.G.; Bokkers, E.A.M.; de Boer, I.J.M. Assessing Sustainability at Farm-Level: Lessons Learned from a Comparison of Tools in Practice. Ecol. Indic. 2016, 66, 391–404. [Google Scholar] [CrossRef]
  46. Singh, R.K.; Murty, H.R.; Gupta, S.K.; Dikshit, A.K. An Overview of Sustainability Assessment Methodologies. Ecol. Indic. 2012, 15, 281–299. [Google Scholar] [CrossRef]
  47. OECD. Environmental Indicators for Agriculture—Methods and Results; OECD Publication: Paris, France, 2001. [Google Scholar]
  48. Kelly, E.; Latruffe, L.; Desjeux, Y.; Ryan, M.; Uthes, S.; Diazabakana, A.; Dillon, E.; Finn, J. Sustainability Indicators for Improved Assessment of the Effects of Agricultural Policy across the EU: Is FADN the Answer? Ecol. Indic. 2018, 89, 903–911. [Google Scholar] [CrossRef]
  49. Robling, H.; Abu Hatab, A.; Säll, S.; Hansson, H. Measuring Sustainability at Farm Level—A Critical View on Data and Indicators. Environ. Sustain. Indic. 2023, 18, 100258. [Google Scholar] [CrossRef]
  50. Castel, J.M.; Mena, Y.; Delgado-Pertíñez, M.; Camúñez, J.; Basulto, J.; Caravaca, F.; Guzmán-Guerrero, J.L.; Alcalde, M.J. Characterization of Semi-Extensive Goat Production Systems in Southern Spain. Small Rumin. Res. 2003, 47, 133–143. [Google Scholar] [CrossRef]
  51. Usai, M.G.; Casu, S.; Molle, G.; Decandia, M.; Ligios, S.; Carta, A. Using Cluster Analysis to Characterize the Goat Farming System in Sardinia. Livest. Sci. 2006, 104, 63–76. [Google Scholar] [CrossRef]
  52. Phillips, A.W. The Relation between Unemployment and the Rate of Change of Money Wage Rates in the United Kingdom, 1861-1957. Economica 1958, 25, 283–299. [Google Scholar] [CrossRef]
  53. FAO. FAOSTAT—Crop and Livestock Products. Available online: http://www.fao.org/faostat/en/#data/Q (accessed on 1 November 2023).
  54. Pulina, G.; Milán, M.J.; Lavín, M.P.; Theodoridis, A.; Morin, E.; Capote, J.; Thomas, D.L.; Francesconi, A.H.D.; Caja, G. Invited Review: Current Production Trends, Farm Structures, and Economics of the Dairy Sheep and Goat Sectors. J. Dairy Sci. 2018, 101, 6715–6729. [Google Scholar] [CrossRef] [PubMed]
  55. Paraskevopoulou, C.; Theodoridis, A.; Johnson, M.; Ragkos, A.; Arguile, L.; Smith, L.; Vlachos, D.; Arsenos, G. Sustainability Assessment of Goat and Sheep Farms: A Comparison between European Countries. Sustainability 2020, 12, 3099. [Google Scholar] [CrossRef]
  56. Caja, G. L’évolution des Systèmes de Production Ovin-Lait Dans le Bassin Méditerranéen. CIHEAM—Options Mediterr. Ser. A 1990, 12, 31–38. [Google Scholar]
  57. ISTAT Milk and Dairy Products. Available online: http://dati.istat.it/Index.aspx?DataSetCode=DCSP_LATTE# (accessed on 1 November 2023).
  58. Laore Sardegna Dati Sull’allevamento Ovino, Caprino e Bovino da Latte in Sardegna. 2019. Available online: https://www.sardegnaagricoltura.it/documenti/14_43_20200904094410.pdf (accessed on 1 November 2023).
  59. Istituto di Servizi per il Mercato Agricolo Alimentare (ISMEA). La Competitività della Filiera Ovina in Italia; ISMEA: Rome, Italy, 2018. [Google Scholar]
  60. Idda, L.; Furesi, R.; Pulina, P. Economia Dell’allevamento Ovino da Latte. Produzione, Trasformazione, Mercato: Produzione, Trasformazione, Mercato; FrancoAngeli: Milano, Italy, 2010; ISBN 978-88-568-2609-8. [Google Scholar]
  61. CREA. Le Aziende Agricole in Italia: Risultati Economici e Produttivi, Caratteristiche Strutturali, Sociali Ed Ambientali, Rapporto RICA 2021; CREA: Roma, Italy, 2021; ISBN 978-88-338-5139-6. [Google Scholar]
  62. Bazzani, G.M.; Vitali, G.; Cardillo, C.; Canavari, M. Using FADN Data to Estimate CO2 Abatement Costs from Italian Arable Crops. Sustainability 2021, 13, 5148. [Google Scholar] [CrossRef]
  63. Cardillo, C.; Di Fonzo, A.; Liberati, C. The Farm’s Orientation towards Sustainability: An Assessment Using FADN Data in Italy. Land 2023, 12, 301. [Google Scholar] [CrossRef]
  64. Coppola, A.; Amato, M.; Vistocco, D.; Verneau, F. Measuring the Economic Sustainability of Italian Farms Using FADN Data. Agric. Econ. Zeměd. Ekon. 2022, 68, 327–337. [Google Scholar] [CrossRef]
  65. Dabkiene, V.; Balezentis, T.; Streimikiene, D. Development of Agri-Environmental Footprint Indicator Using the FADN Data: Tracking Development of Sustainable Agricultural Development in Eastern Europe. Sustain. Prod. Consum. 2021, 27, 2121–2133. [Google Scholar] [CrossRef]
  66. Liberati, C.; Cardillo, C.; Di Fonzo, A. Sustainability and Competitiveness in Farms: An Evidence of Lazio Region Agriculture through FADN Data Analysis. Econ. Agro-Aliment. 2022, 23, 1–22. [Google Scholar] [CrossRef]
  67. Marongiu, S.; Bimbati, B.; Santamgelo, M. Use and Users of FADN Data in Italy. Econ. Agro-Aliment. 2022, 23, 1–21. [Google Scholar] [CrossRef]
  68. Turchetti, L.; Gastaldin, N.; Marongiu, S. Enhancing the Italian FADN for Sustainability Assessment: The State of Art and Perspectives. Econ. Agro-Aliment. 2022, 23, 11–21. [Google Scholar] [CrossRef]
  69. Niemeijer, D.; De Groot, R.S. A Conceptual Framework for Selecting Environmental Indicator Sets. Ecol. Indic. 2008, 8, 14–25. [Google Scholar] [CrossRef]
  70. Ripoll-Bosch, R.; Díez-Unquera, B.; Ruiz, R.; Villalba, D.; Molina, E.; Joy, M.; Olaizola, A.; Bernués, A. An Integrated Sustainability Assessment of Mediterranean Sheep Farms with Different Degrees of Intensification. Agric. Syst. 2012, 105, 46–56. [Google Scholar] [CrossRef]
  71. Bereżnicka, J. Sources of Return on Equity in Economically Diversified Agriculture of the European Union Countries. Probl. Agric. Econ. 2018, 3, 76–93. [Google Scholar] [CrossRef]
  72. Meul, M.; Nevens, F.; Reheul, D. Validating Sustainability Indicators: Focus on Ecological Aspects of Flemish Dairy Farms. Ecol. Indic. 2009, 9, 284–295. [Google Scholar] [CrossRef]
  73. Riera, A.; Duluins, O.; Schuster, M.; Baret, P.V. Accounting for Diversity While Assessing Sustainability: Insights from the Walloon Bovine Sectors. Agron. Sustain. Dev. 2023, 43, 30. [Google Scholar] [CrossRef]
  74. Weltin, M.; Hüttel, S. Sustainable Intensification Farming as an Enabler for Farm Eco-Efficiency? Environ. Resour. Econ. 2023, 84, 315–342. [Google Scholar] [CrossRef]
  75. Knudsen, M.T.; Dorca-Preda, T.; Djomo, S.N.; Peña, N.; Padel, S.; Smith, L.G.; Zollitsch, W.; Hörtenhuber, S.; Hermansen, J.E. The Importance of Including Soil Carbon Changes, Ecotoxicity and Biodiversity Impacts in Environmental Life Cycle Assessments of Organic and Conventional Milk in Western Europe. J. Clean. Prod. 2019, 215, 433–443. [Google Scholar] [CrossRef]
  76. Moberg, E.; Karlsson Potter, H.; Wood, A.; Hansson, P.-A.; Röös, E. Benchmarking the Swedish Diet Relative to Global and National Environmental Targets—Identification of Indicator Limitations and Data Gaps. Sustainability 2020, 12, 1407. [Google Scholar] [CrossRef]
  77. Vellinga, T.V.; Hoving, I.E. Maize Silage for Dairy Cows: Mitigation of Methane Emissions Can Be Offset by Land Use Change. Nutr. Cycl. Agroecosyst. 2011, 89, 413–426. [Google Scholar] [CrossRef]
  78. Henryson, K.; Meurer, K.H.E.; Bolinder, M.A.; Kätterer, T.; Tidåker, P. Higher Carbon Sequestration on Swedish Dairy Farms Compared with Other Farm Types as Revealed by National Soil Inventories. Carbon Manag. 2022, 13, 266–278. [Google Scholar] [CrossRef]
  79. IPCC. 10. Emissions from livestock and manure management. In 2019 Refinement to the 2006 IPCC Guidelines for National Greenhouse Gas Inventories; IPCC: Paris, France, 2019; Volume 4—Agriculture, Forestry and Other Land Use. [Google Scholar]
  80. IPCC. 11. N2O Emissions from Managed Soils, and CO2 Emissions from Lime and Urea Application. In 2019 Re-finement to the 2006 IPCC Guidelines for National Greenhouse Gas Inventories; IPCC: Paris, France, 2019; Volume 4—Agriculture, Forestry and Other Land Use. [Google Scholar]
  81. Dondini, M.; Martin, M.; De Camillis, C.; Uwizeye, A.; Soussana, J.-F.; Robinson, T.; Steinfeld, H. Global Assessment of Soil Carbon in Grasslands. In From Current Stock Estimates to Sequestration Potential; FAO Animal Production and Health Paper; FAO: Rome, Italy, 2023; ISBN 978-92-5-137550-1. [Google Scholar]
  82. Kumar, S.; Meena, R.S.; Lal, R.; Singh Yadav, G.; Mitran, T.; Meena, B.L.; Dotaniya, M.L.; EL-Sabagh, A. Role of Legumes in Soil Carbon Sequestration. In Legumes for Soil Health and Sustainable Management; Meena, R.S., Das, A., Yadav, G.S., Lal, R., Eds.; Springer: Singapore, 2018; pp. 109–138. ISBN 9789811302534. [Google Scholar]
  83. Giussani, A. Integrated Territorial Approach for Sustainable Agriculture: Nitrogen Management and Soil Carbon Sequestration in Lombardy Region. Ph.D. Thesis, Università degli Studi di Milano, Milan, Italy, 2013. [Google Scholar]
  84. Richardson, A.E.; Coonan, E.; Kirkby, C.; Orgill, S. Soil Organic Matter and Carbon Sequestration. In Australian Agriculture in 2020; Pratley, J., Kirkegaard, J., Eds.; Australian Society of Agronomy: Wagga Wagga, Australia, 2019; pp. 255–271. [Google Scholar]
  85. Böhringer, C.; Jochem, P.E.P. Measuring the Immeasurable—A Survey of Sustainability Indices. Ecol. Econ. 2007, 63, 770–786. [Google Scholar] [CrossRef]
  86. Independent Science and Partnership Council (ISPC). Data, Metrics and Monitoring in CGIAR—A Strategic Study; ISPC: Tervuren, Belgium, 2014. [Google Scholar]
  87. Van Der Werf, H.M.G.; Petit, J. Evaluation of the Environmental Impact of Agriculture at the Farm Level: A Comparison and Analysis of 12 Indicator-Based Methods. Agric. Ecosyst. Environ. 2002, 93, 131–145. [Google Scholar] [CrossRef]
  88. Ikerd, J. Two Related but Distinctly Different Concepts: Organic Farming and Sustainable Agriculture. Small Farm Today 1993, 101, 30–31. [Google Scholar]
  89. Sala, S.; Ciuffo, B.; Nijkamp, P. A Systemic Framework for Sustainability Assessment. Ecol. Econ. 2015, 119, 314–325. [Google Scholar] [CrossRef]
  90. Munda, G.; Saisana, M. Methodological Considerations on Regional Sustainability Assessment Based on Multicriteria and Sensitivity Analysis. Reg. Stud. 2011, 45, 261–276. [Google Scholar] [CrossRef]
  91. Sharpe, A. A Literature Review of Frameworks for Macro-Indicators; Centre for the Study of Living Standards: Ottawa, ON, Canada, 2004; Volume 3. [Google Scholar]
  92. Nardo, M.; Saisana, M.; Saltelli, A.; Tarantola, S. Tools for Composite Indicators Building; Institute for the Protection and Security of the Citizen; JRC: Ispra, Italy, 2005. [Google Scholar]
  93. Talukder, B.W.; Hipel, K.; W. vanLoon, G. Developing Composite Indicators for Agricultural Sustainability Assessment: Effect of Normalization and Aggregation Techniques. Resources 2017, 6, 66. [Google Scholar] [CrossRef]
  94. Saisana, M.; Tarantola, S. State-of-the-Art Report on Current Methodologies and Practices for Composite Indicator Development; European Commission; Joint Research Centre; Institute for the Protection and the Security of the Citizen; Techinological and Economic Risk Management Unit: Ispra, Italy, 2002. [Google Scholar]
  95. Saisana, M.; Saltelli, A. Rankings and Ratings: Instructions for Use. Hague J. Rule Law 2011, 3, 247–268. [Google Scholar] [CrossRef]
  96. Joint Research Centre-European Commission. OECD Handbook on Constructing Composite Indicators: Methodology and User Guide; OECD Publishing: Paris, France, 2008; ISBN 978-92-64-04346-6. [Google Scholar]
  97. Alston, J.M.; Norton, G.W.; Pardey, P.G. Science under Scarcity: Principles and Practice for Agricultural Research Evaluation and Priority Setting; Cornell University Press: Ithaca, NY, USA, 1995. [Google Scholar]
  98. Raudsepp-Hearne, C.; Peterson, G.D.; Bennett, E.M. Ecosystem Service Bundles for Analyzing Tradeoffs in Diverse Landscapes. Proc. Natl. Acad. Sci. USA 2010, 107, 5242–5247. [Google Scholar] [CrossRef]
  99. Turner, K.G.; Odgaard, M.V.; Bøcher, P.K.; Dalgaard, T.; Svenning, J.-C. Bundling Ecosystem Services in Denmark: Trade-Offs and Synergies in a Cultural Landscape. Landsc. Urban Plan. 2014, 125, 89–104. [Google Scholar] [CrossRef]
  100. Xiao, H.; Liu, Y.; Ren, J. Synergies and Trade-Offs across Sustainable Development Goals: A Novel Method Incorporating Indirect Interactions Analysis. Sustain. Dev. 2023, 31, 1135–1148. [Google Scholar] [CrossRef]
  101. Hatcher, L.; O’Rourke, N. A Step-by-Step Approach to Using SAS for Factor Analysis and Structural Equation Modeling; SAS Institute: Cary, NC, USA, 2013. [Google Scholar]
  102. Hair, J.F. Multivariate Data Analysis; Prentice Hall: Englewood Cliffs, NJ, USA, 2011; ISBN 978-0-13-894858-0. [Google Scholar]
  103. Dumont, B.; Garel, J.P.; Ginane, C.; Decuq, F.; Farruggia, A.; Pradel, P.; Rigolot, C.; Petit, M. Effect of Cattle Grazing a Species-Rich Mountain Pasture under Different Stocking Rates on the Dynamics of Diet Selection and Sward Structure. Animal 2007, 1, 1042–1052. [Google Scholar] [CrossRef] [PubMed]
  104. Sepe, L.; Salis, M.; Francaviglia, R.; Fedrizzi, M.; Carroni, A.M.; Sabia, E.; Bruno, A.; Rufrano, D.; Ruda, P.; Dell’Abate, M.T.; et al. Environmental Effectiveness of the Cross Compliance Standard 4.6 Minimum Livestock Stocking Rates and/or Appropriate Regimens. Ital. J. Agron. 2015, 10, 715. [Google Scholar] [CrossRef]
  105. Vagnoni, E.; Franca, A.; Breedveld, L.; Porqueddu, C.; Ferrara, R.; Duce, P. Environmental Performances of Sardinian Dairy Sheep Production Systems at Different Input Levels. Sci. Total Environ. 2015, 502, 354–361. [Google Scholar] [CrossRef] [PubMed]
  106. Atzori, A.S.; Furesi, R.; Madau, F.A.; Pulina, P.; Rassu, P.G. Sustainability of Dairy Sheep Production in Pasture Lands: A Case Study Approach to Integrate Economic and Environmental Perspectives. Riv. Studi Sulla Sostenibilità 2015, 2015, 117–134. [Google Scholar] [CrossRef]
  107. Correddu, F.; Lunesu, M.F.; Caratzu, M.F.; Pulina, G. Recalculating the Global Warming Impact of Italian Livestock Methane Emissions with New Metrics. Ital. J. Anim. Sci. 2023, 22, 125–135. [Google Scholar] [CrossRef]
  108. Arca, P.; Vagnoni, E.; Duce, P.; Franca, A. How Does Soil Carbon Sequestration Affect Greenhouse Gas Emissions from a Sheep Farming System? Results of a Life Cycle Assessment Case Study. Ital. J. Agron. 2021, 16, 1789. [Google Scholar] [CrossRef]
  109. Bohrnstedt, G.W.; Knoke, D. Statistics for Social Data Analysis; F.E. Peacock Publishers: Itasca, IL, USA, 1994. [Google Scholar]
  110. Abdulai, A.; CroleRees, A. Determinants of Income Diversification amongst Rural Households in Southern Mali. Food Policy 2001, 26, 437–452. [Google Scholar] [CrossRef]
  111. Neudert, R.; Allahverdiyeva, N.; Mammadov, N.; Didebulidze, A.; Beckmann, V. Diversification of Livestock-Keeping Smallholders in Mountainous Rural Regions of Azerbaijan and Georgia. Land 2020, 9, 267. [Google Scholar] [CrossRef]
  112. Henke, R.; Cimino, O.; Vanni, F. The Role of Diversification in the Revenue Composition of Italian Farms. Ital. Rev. Agric. Econ. 2022, 77, 25–38. [Google Scholar]
  113. Wu, N.; Ismail, M.; Joshi, S.; Yi, S.; Shrestha, R.M.; Jasra, A.W. Livelihood Diversification as an Adaptation Approach to Change in the Pastoral Hindu-Kush Himalayan Region. J. Mt. Sci. 2014, 11, 1342–1355. [Google Scholar] [CrossRef]
  114. Simula, G. Uncertainty, Markets, and Pastoralism in Sardinia, Italy. In Pastoralism, Uncertainty and Development; Practical Action Publishing: Rugby, UK, 2023; pp. 1–180. ISBN 978-1-78853-245-7. [Google Scholar]
  115. Madau, F.A.; Arru, B.; Furesi, R.; Sau, P.; Pulina, P. Public Perception of Ecosystem and Social Services Produced by Sardinia Extensive Dairy Sheep Farming Systems. Agric. Food Econ. 2022, 10, 19. [Google Scholar] [CrossRef]
  116. Nori, M. Assessing the Policy Frame in Pastoral Areas of Europe; European University Institute: Florence, Italy, 2022. [Google Scholar]
  117. Cerrato, M.; Iasi, A.; Di Bennardo, F.; Pergola, M. Evaluation of the Economic and Environmental Sustainability of Livestock Farms in Inland Areas. Agriculture 2023, 13, 1708. [Google Scholar] [CrossRef]
  118. Nori, M.; Farinella, D. Migration, Agriculture and Rural Development: IMISCOE Short Reader; IMISCOE Research Series; Springer International Publishing: Cham, Switzerland, 2020; ISBN 978-3-030-42862-4. [Google Scholar]
  119. European Commission. Statistical Office of the European Union. The Representativeness of the Farm Accountancy Data Network (FADN): Some Suggestions for Its Improvement: 2020 Edition; Publications Office of the European Union: Luxembourg, 2020; ISBN 978-92-76-26959-5. [Google Scholar]
  120. Brandano, P. L’allevamento dei Ruminanti; Università degli Studi di Sassari, Facoltà di Agraria: Sassari, Italy, 2008. [Google Scholar]
Figure 1. Research method regarding the economic and environmental sustainability degree of dairy sheep farms.
Sustainability 15 16621 g001
Table 1. Sample distribution, demographic profile, and characteristics of farms selected.
Total = 219%
GenderMale19589.0
Female2411.0
Age≤404018.3
>4017981.7
ResidentProvince of Sassari8337.9
Province of Nuoro5424.7
Province of Oristano 4118.7
Province of Cagliari4118.7
EducationNo lower middle school2511.4
Lower middle school14063.9
High school4922.4
University52.3
DiversificationYes73.2
No21296.8
OrganicYes115.0
No20895.0
Total Agricultural Area (ha)0–100 17580.0
101–2003717.0
>20173.0
Livestock unit (LU)0–5015973.0
51–1004822.0
101–150105.0
>15021.0
Source: Our processing based on FADN data.
Table 2. Statistics of economic indicators and farms’ performances.
ECI 1 (EUR)ECI 2 (EUR)ECI 3 (EUR)ECI 4 (EUR)ECI 5 (%)ECI 6 (%)
Mean68,245.05108,590.892705.501384.024.960.27
St. dev.40,075.4956,905.76899.76618.894.000.34
N. of farms that perform better991001071237374
N. of farms that perform worse 12011911296146145
Source: Our processing based on FADN data.
Table 3. Statistics of environmental indicators and farms’ performances.
ENI 1 (EUR/UAA)ENI 2 (EUR/UAA)ENI 3 (EUR/UAA)ENI 4
(%)
ENI 5
(%)
ENI 6 (LU/UAA)
Mean20.3597.680.330.004.431.43
St. dev.142.82380.813.470.0313.450.84
N. of farms that perform better1718721721232139
N. of farms that perform worse202322718780
ENI 7
(%)
ENI 8
(N.)
ENI 9
(N.)
ENI 10
(ton CO2eq/LU/yr)
ENI 11
(ton CO2/UAA/yr)
Mean62.222.300.035.351.79
St. dev.32.530.780.230.520.63
N. of farms that perform better1224937181
N. of farms that perform worse 97170216148138
Source: Our processing based on FADN data.
Table 4. Correlation analysis between composite economic and environmental indices.
Number of FarmsCorrelation Coefficientp-Value
2190.11910.0785 *
* Statistically significant for p < 0.1. Source: Our processing based on FADN data.
Table 5. Hypothesis testing for each model adopted.
ModelRestrictionL(H1)L(H0)λd.f.χ2Decision
ENNo constant variable−35.817−36.7881.94410.0039Accept the null hypothesis
ECNo constant variable−182.688−183.0300.68410.0039Accept the null hypothesis
Table 6. Structural and socio-demographic variables affecting the composite economic index obtained through linear regression analysis.
VariableCoefficientStd. Errorp-Value
Gender0.1100.1260.386
Young0.1950.1020.058 *
Education−0.0220.0210.298
Organic0.3530.1760.047 **
Diversification−0.3110.2170.153
Adjusted R2: 0.547p-value (F): 0.026
* Statistically significant for p < 0.1; ** Statistically significant for p < 0.05. Source: Our processing based on FADN data.
Table 7. Structural and socio-demographic variables affecting the composite environmental index obtained through linear regression analysis.
VariableCoefficientStd. Errorp-Value
Gender−0.0310.0650.630
Young0.0010.0520.985
Education0.0060.0110.545
Organic0.0270.0900.766
Diversification −0.1430.1110.201
Adjusted R2: 0.005p-value (F): 0.542
* Statistically significant for p < 0.1; ** Statistically significant for p < 0.05. Source: Our processing based on FADN data.
Disclaimer/Publisher’s Note: The statements, opinions and data contained in all publications are solely those of the individual author(s) and contributor(s) and not of MDPI and/or the editor(s). MDPI and/or the editor(s) disclaim responsibility for any injury to people or property resulting from any ideas, methods, instructions or products referred to in the content.

