Article

Post-Investment Cost in Roads and Economic Development in a Peruvian Region

by
Mario Roberto Olaya Reyes
*,
Segundo Eloy Soto Abanto
,
Elmis Jonatan García Zare
and
Henrry Walter Zavaleta Pesantes
Jefatura de Investigación—SUBE, Universidad César Vallejo, Trujillo 13001, Peru
*
Author to whom correspondence should be addressed.
Sustainability 2023, 15(24), 16588; https://doi.org/10.3390/su152416588
Submission received: 14 September 2023 / Revised: 13 October 2023 / Accepted: 15 October 2023 / Published: 6 December 2023

Abstract

:
The objective of this research was to determine the relationship between the cost of post-investment in roads and economic development in the La Libertad region from 2015 to 2022. It was basic research with a quantitative approach, non-experimental design, and correlational scope. A documentary analysis was carried out by applying a record card, whose information collected was analyzed with descriptive, multiple correspondence and correlational techniques, finding that from 2015 to 2022, the post-investment costs reach PEN 85,562,363.47, resulting in the benefit of 1310.10 km. Likewise, it was found that economic development, through the indicator of monetary poverty, ranged between 20.83% and 31.90%, and that household access to the four basic services reached 77.9% in 2021 and 78.7% in 2022. It is concluded that in the La Libertad region, the costs of post-investment in roads are significantly related to economic development through the monetary poverty dimension in its two indicators: total and extreme poverty (r: −0.788, p-value: 0.02; r: −0.729, p-value: 0.04, respectively). The other dimensions did not show a relationship; however, these findings do not contradict the theoretical contributions and studies that do determine this.

1. Introduction

Infrastructure modernizes and enhances a country and its productive system, promoting territorial cohesion and meeting the needs of economic agents. In the 19th century, Karl Marx defined infrastructure as the foundation of modes of production, composed of property and production relations. This structure organized production and distribution, influencing the social status of individuals based on their class [1].
A road infrastructure is defined as a network of roads, streets, and pathways designed and built with the aim of facilitating the terrestrial transportation of people and goods. These road infrastructures are an essential component of a country or region’s basic infrastructure, playing a crucial role in connectivity, stimulating trade, fostering economic development, and enhancing population mobility [2].
Economic development is a long-term process aimed at improving the economic well-being and quality of life of a society through economic growth, job creation, poverty reduction, and an increase in the standard of living for its citizens [3,4]. Various schools of thought contribute to the theory of economic development; for example, Adam Smith emphasizes the importance of increasing the quantity and quality of production factors. Furthermore, the neoclassical growth model developed by Robert Solow and Trevor Swan highlights the influence of physical capital on per capita income differences among countries and on economic growth, giving rise to the Solow Economic Growth Model [1]. The Solow Economic Growth Model posits that long-term economic growth is rooted in capital accumulation, investment, savings, and technological advancement. It also argues that as an economy matures, it tends to reach a steady state where growth stabilizes as per capita production converges to a constant level, unless significant technological advancements drive economic expansion [5].
The development and economic growth of a nation is directly proportional to its road infrastructure [6]. Therefore, it is appropriate to know the pre- and post-investment costs that are allocated in countries for road construction to analyze their behavior to show whether there is variability due to external causes that may affect their progress, in order to promote the development of sustainable and resilient infrastructure [7], as indicated in the ninth Sustainable Development Goal (SDG): “Industry, innovation and infrastructure”.
The economic growth of Latin American (LATAM) member countries is driven by investment, but unfortunately there are factors that have a negative effect on its behavior, such as corruption, which must be reduced or prevented [8]. Its presence is seen as one of the most studied social phenomena at the global level, considered as a practice present in the continent [9]. If it is present from the awarding of the project, it is possible that costs will increase and this will affect the quality of the construction process, but if it occurs during maintenance, this will generate additional long-term cost overruns [10].
Investments in transportation stimulate economies, reduce climate problems, and integrate the population with other basic services, such as education and health [11]. The link between road infrastructure investment projects and growth is strong [12], both immediately and over time. However, it is not possible to focus only on growth, as it is important to have a holistic vision and pay attention to the service offered by the road in search of people’s satisfaction and well-being [13].
The European Court of Auditors [14] in its report states that, in order to invigorate economies at all territorial, national or regional levels, it is imperative to improve the accessibility of roads, which, in turn, increase the flow of people and goods. They also indicate that the objectives of road infrastructure projects are in line with economic development, among which are meeting the need for interregional transportation, reducing transit time and vehicle congestion, increasing safety and comfort, and reducing pollution.
In Peru, the Ministry of Transportation and Communications (MTC) is the entity responsible for transportation and land transit, among others, and its work is key to socioeconomic development [15], since it integrates the country, boosts trade, reduces poverty, and promotes citizen welfare. By the end of 2022, transportation infrastructure works in Peru reached USD 558 million invested in roads, airports, ports, and railways, which is a valuable asset that will be a foundation for Peru’s progress and social and economic wellbeing [16].
In La Libertad, road investments reached USD 157 million in 2022. However, in 2021 it reached USD 338 million, which is double the amount obtained at present. One of the most recognized works is the “Autopista del Sol”, which runs from Trujillo to Sullana, covering the regions of La Libertad, Lambayeque, and Piura, for which USD 209 million has been earmarked [16]. This behavior suggests that it is possible that economic development has been affected, but this assumption needs to be contrasted by means of an objective evaluation.
Some evident observations include the precarious conditions of regional roads in various rural areas of La Libertad, although this has been improving in recent years but not at the expected pace. In areas where projects have been executed, economic growth and development appear discouraging, suggesting an inverse relationship between the indicators under consideration. This link possibly arises because the projects undertaken in these contexts are carried out by external companies not native to the area of interest, and even the professional staff and labor force come from coastal areas, causing the costs associated with these projects to not benefit the local residents of these areas.
In view of the above, we reflect on the relationship between road infrastructure investment and economic development, as well as the behavior of each of these variables. Consequently, due to its importance, it is appropriate to show whether the set of road construction projects in La Libertad is effective, i.e., whether it is reflected in the development of the region’s economy. This research addressed post-investment costs, asking the following questions: What is the relationship between the cost of post-investment in roads and economic development in the region of La Libertad 2015–2022?; and specifically: What is the cost of post-investment in roads in La Libertad from 2015 to 2022? What are the post-investment costs in roads in the provinces of La Libertad from 2015 to 2022? What are the characteristics of the projects implemented according to their post-investment cost? What is the economic development by province in the La Libertad Region from 2015 to 2022?
This research is justified in its social relevance, because investment in transportation infrastructure and its subsequent maintenance is an important issue for any country or region, since roads are the backbone of the economy and progress. It is important to understand how road maintenance is being invested in the region of La Libertad and how it can be improved to boost economic and social development. For its theoretical justification, the research is based on the theoretical framework of transportation economics, which seeks to understand how investment in transportation infrastructure affects economic and social development. In addition, theories on infrastructure investment and its relationship with economic growth and sustainability were used. For its methodological justification, an analysis of investment in road maintenance in La Libertad was carried out using public data from reliable sources and at the same time characterizing these investments to know the details of the works involved. Finally, an economic justification is required, because it will have important economic implications since investment in transportation infrastructure can have a significant impact on economic growth and competitiveness. By understanding how road construction is being invested in La Libertad and how it contrasts with its economic development, areas for improving investment and increasing their impact can be identified [17].
The general objective of the research was to determine the relationship between the post-investment cost of roads and economic development in the La Libertad region from 2015 to 2022. Specifically: to determine the post-investment cost of roads in La Libertad from 2015 to 2022, to compare the post-investment costs of roads in the provinces of La Libertad from 2015 to 2022, to characterize the projects executed in La Libertad from 2015 to 2022 according to their post-investment costs, and to identify the economic development by province in the La Libertad Region from 2015 to 2022.
As a general hypothesis, it was proposed that the relationship between the post-investment cost of roads and economic development in La Libertad is significant.

2. Materials and Methods

The research is quantitative with a non-experimental design; the scope is descriptive, comparative, and correlational. The data collection technique is documentary analysis; variables and analysis procedures are detailed in the following sub-sections.

2.1. Data Collection

The data were obtained from the Road Submanagement of the Regional Infrastructure Management of the Regional Government of La Libertad. Access was granted to the investment costs of a total of 43 road projects (under the contracting modality) executed in 10 provinces of the La Libertad region during the period 2015–2022. The variables considered for the analysis were cost of road construction project execution, project supervision cost, and total project cost.
The four indicators of economic development, total monetary poverty, extreme monetary poverty, access to at least one basic service, and basic needs, were obtained from the National Institute of Statistics and Informatics (INEI) for the La Libertad Region during the period 2015–2022.

2.2. Post-Investment Cost in Road Construction

This refers to the costs of operation and maintenance of road projects, as well as the evaluation after their implementation. It will be measured through the sum of the costs in PEN of execution and supervision of public investment projects carried out in the region of La Libertad. It will be measured in post-investment costs of execution and post-investment costs of supervision in road projects executed between 2015 and 2022.

2.3. Cost of Road Construction Project Execution

This refers to the expenditure required to carry out the construction of a road. It includes all costs associated with planning, design, materials acquisition, labor, machinery, management, and any other expenses necessary to complete the road construction project. This cost can encompass a wide range of elements from land preparation to paving and signage installation.

2.4. Cost of Road Construction Project Supervision

This refers to the expenses associated with the supervision and control of a road construction project. This cost is allocated to finance the personnel, services, and resources required to ensure that the construction project proceeds according to established specifications, budget, and schedule. Supervising road construction projects involves overseeing the quality of the workforce, workplace safety, compliance with regulations, and overall project management. Supervision costs may include engineers’ and supervisors’ salaries, quality inspections, quality control equipment, and other expenses related to effective project management and control.

2.5. Total Cost of Road Construction Project

This refers to the overall expenditure required to carry out a road construction project from initiation to completion. For the purpose of this study, it will be the sum of the costs of road construction project execution and supervision.

2.6. Economic Development

This refers to a process of change both economically and socially, with the objective of satisfying the priority needs of the population within a framework of economic and political freedoms. It will be measured through total and extreme monetary poverty, access to basic services, and unmet basic needs in households in La Libertad from 2015 to 2022.

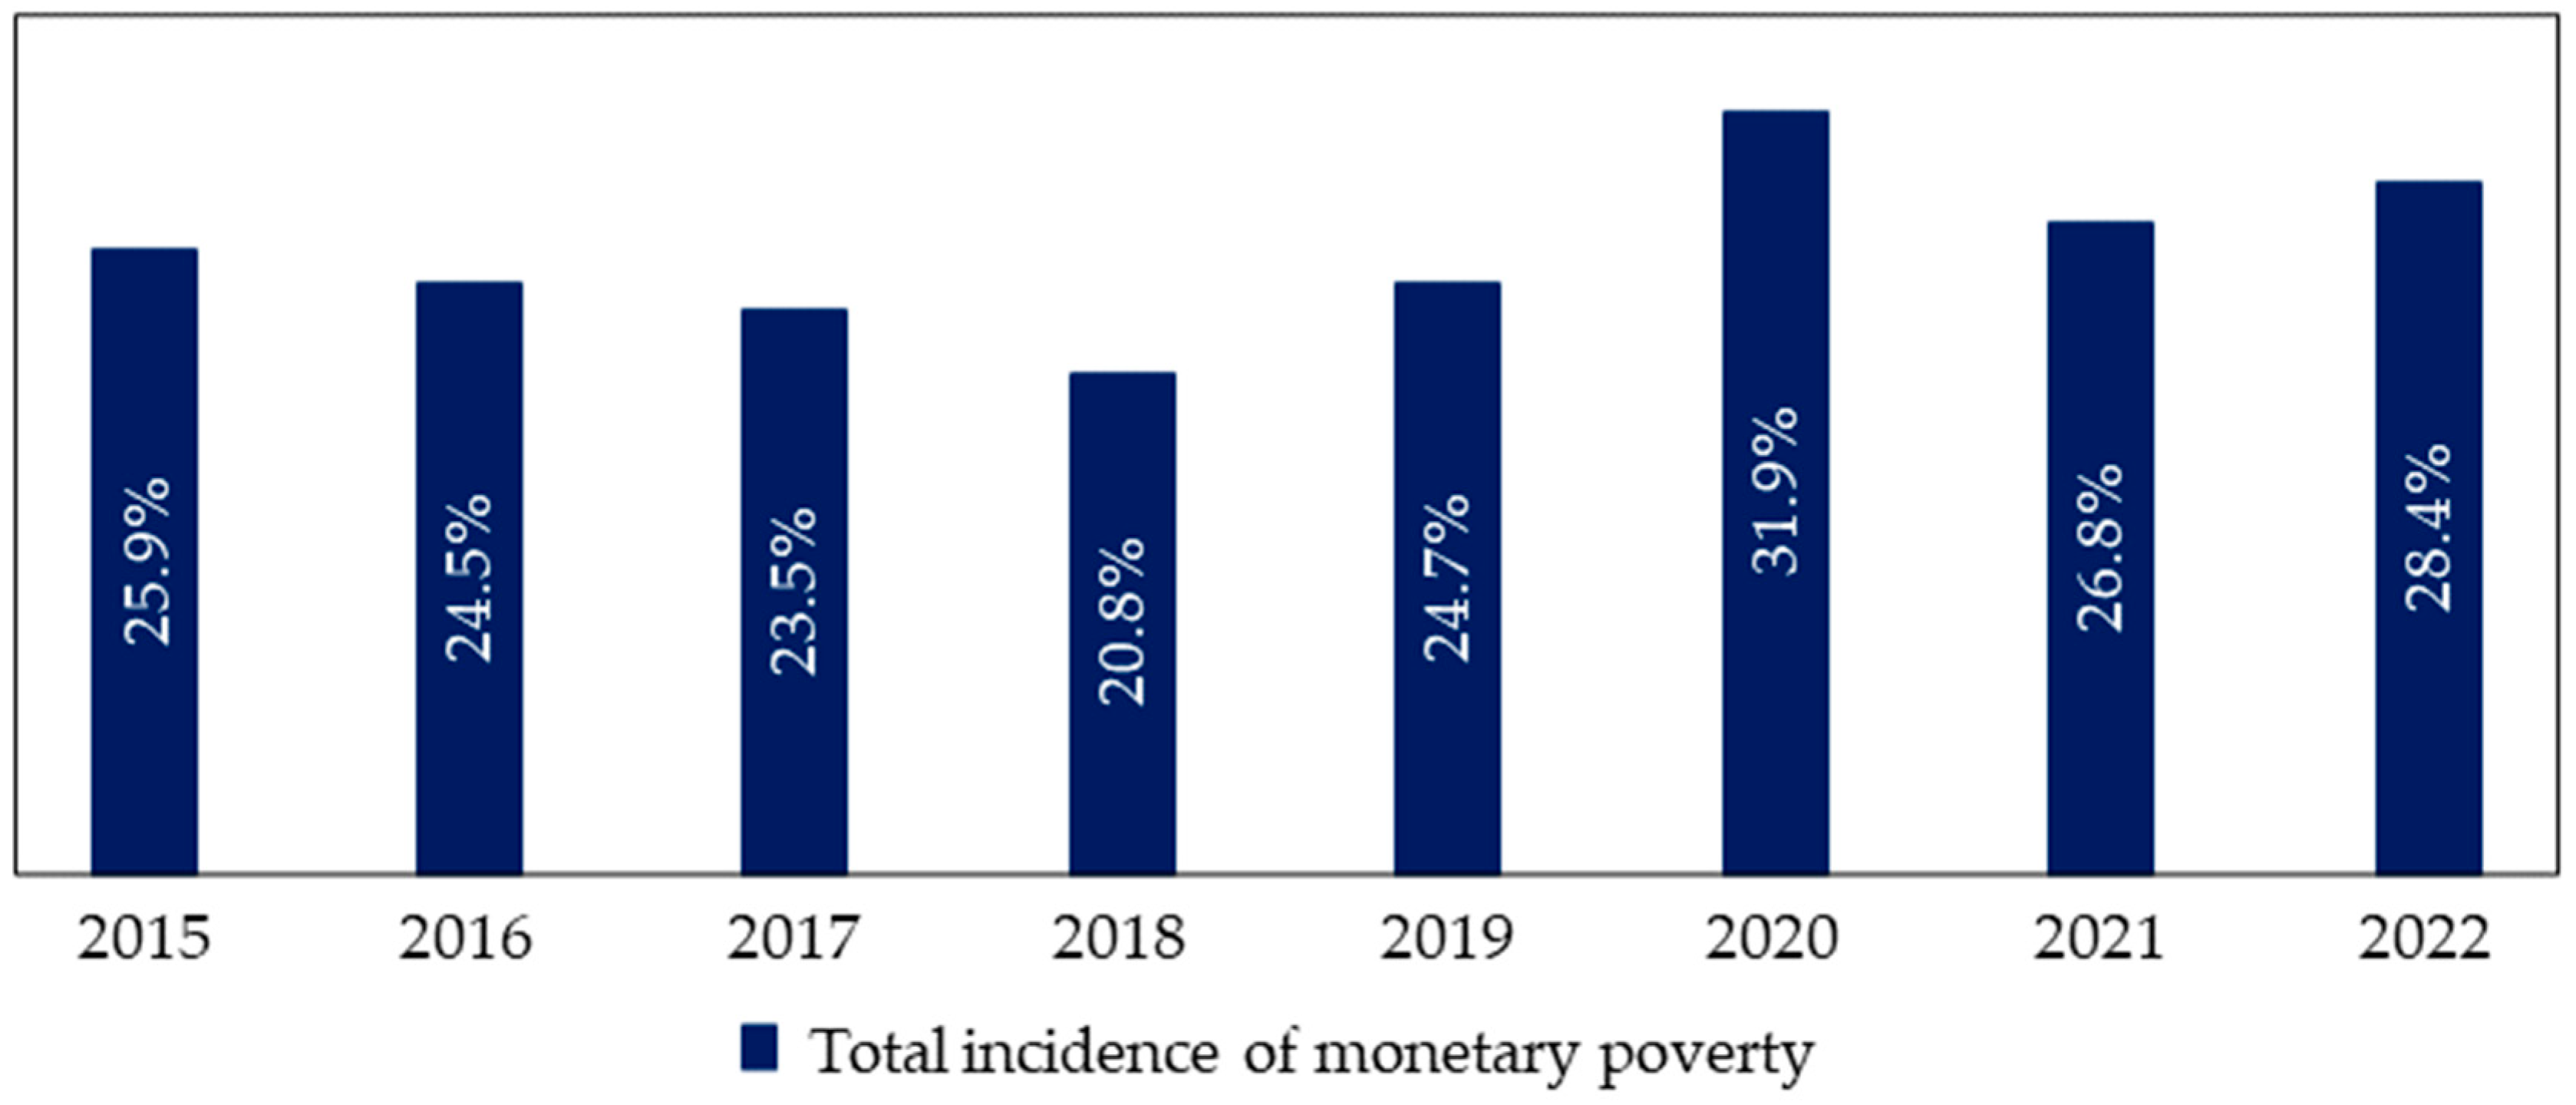
2.6.1. Total Monetary Poverty

This refers to the condition in which a person or household does not have sufficient income to meet their basic needs and lead a decent life. Total monetary poverty is generally measured using a poverty line that establishes an income threshold below which a person or household is considered to be living in poverty.

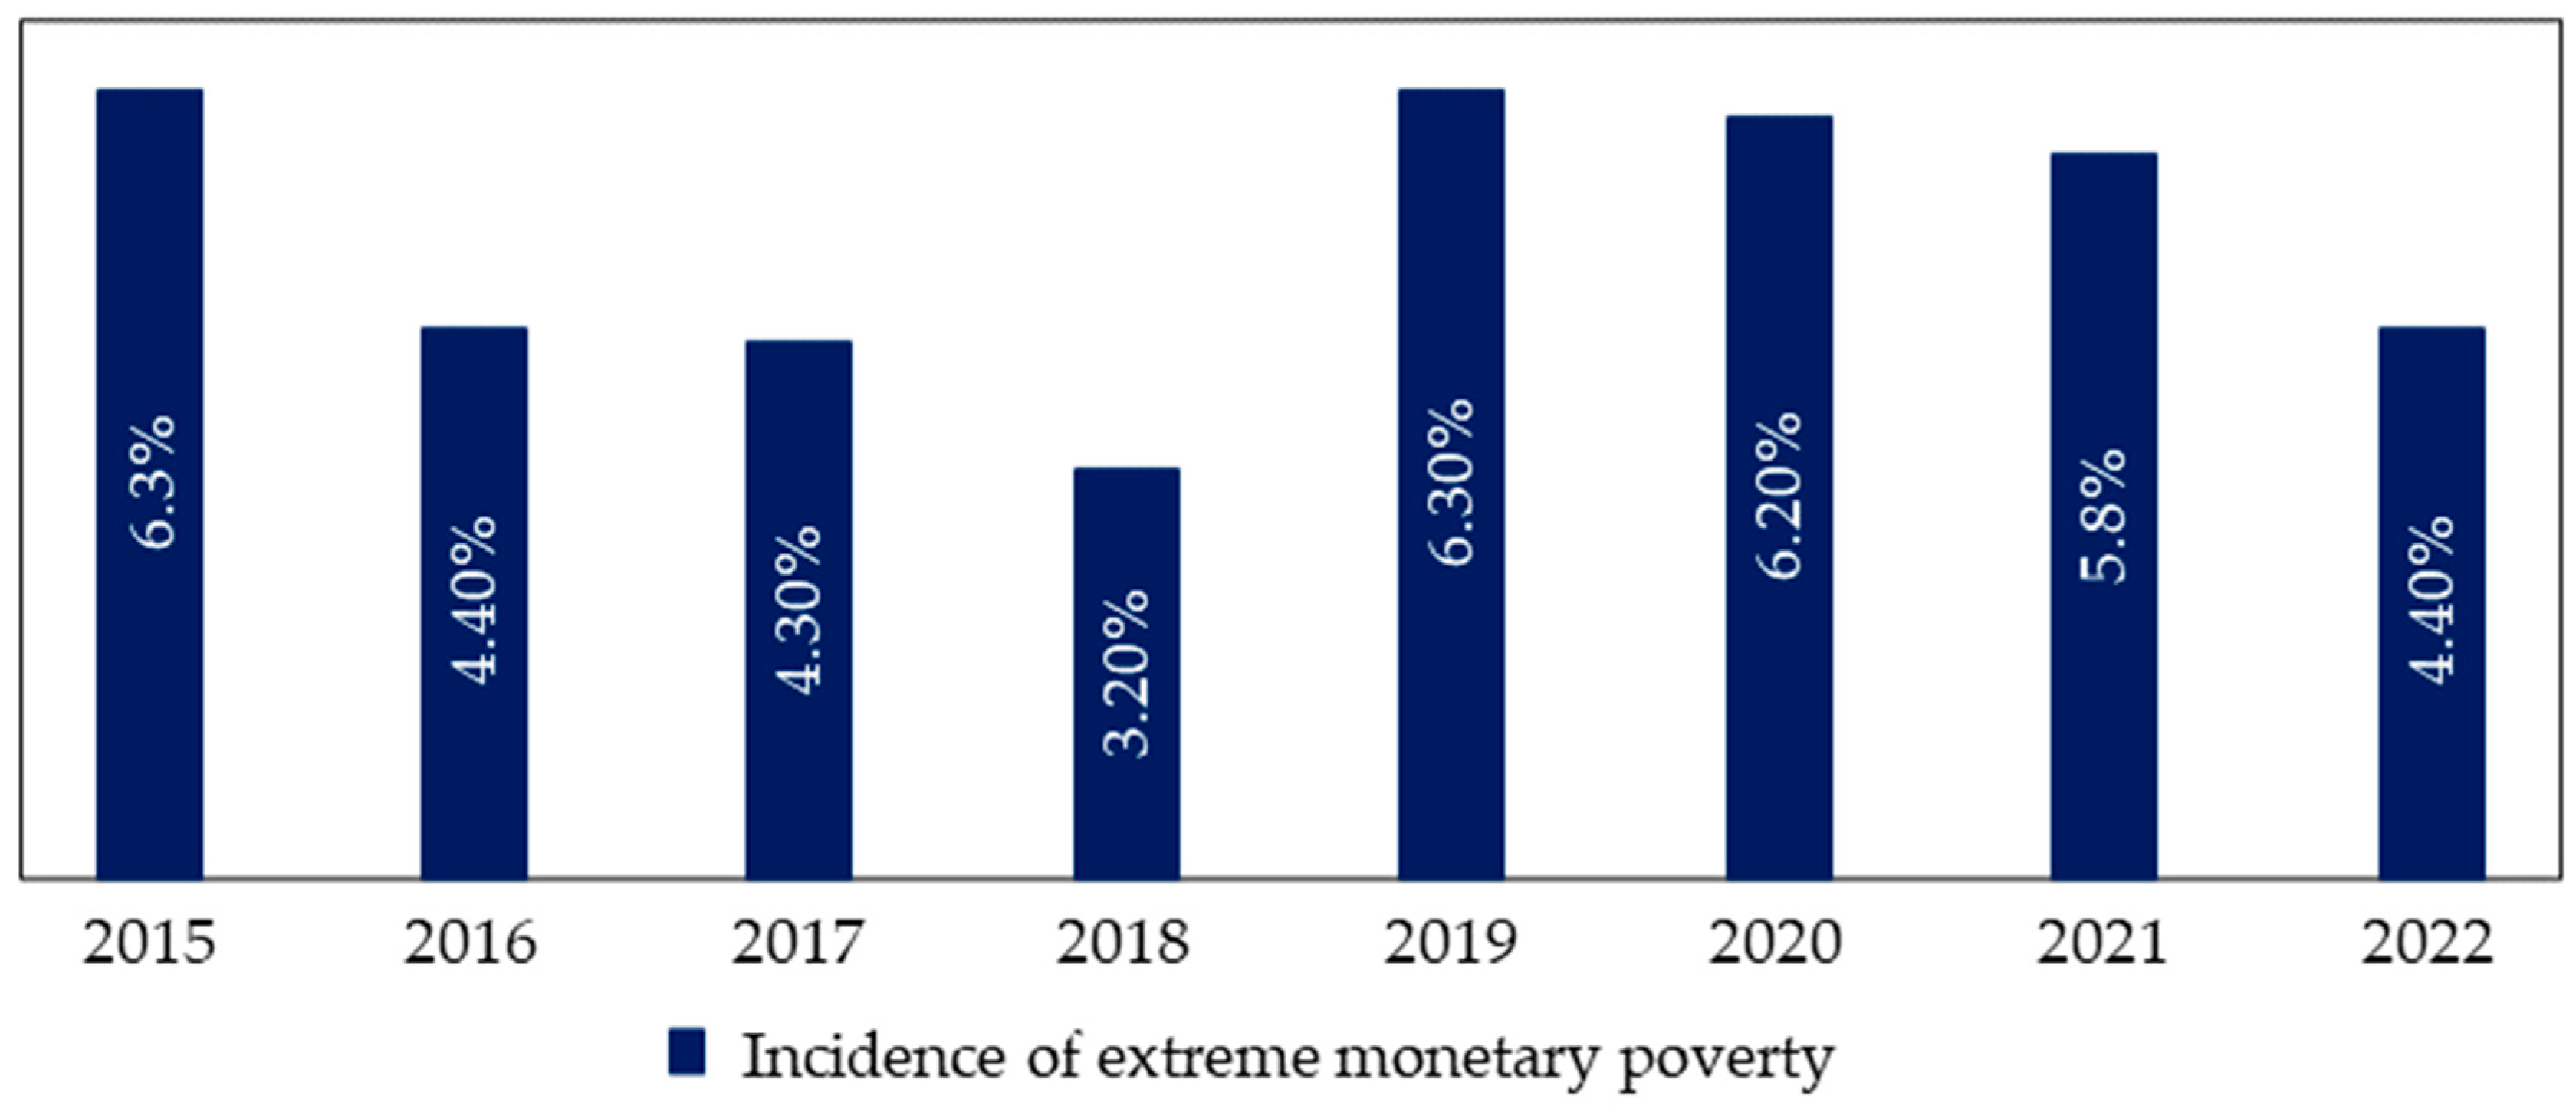
2.6.2. Extreme Monetary Poverty

This refers to the most severe form of poverty, in which a person or household lives in conditions of extreme deprivation and is unable to meet the most basic needs, such as adequate food, adequate housing, access to health services and education, among others. Extreme monetary poverty is also known as extreme poverty or indigence.

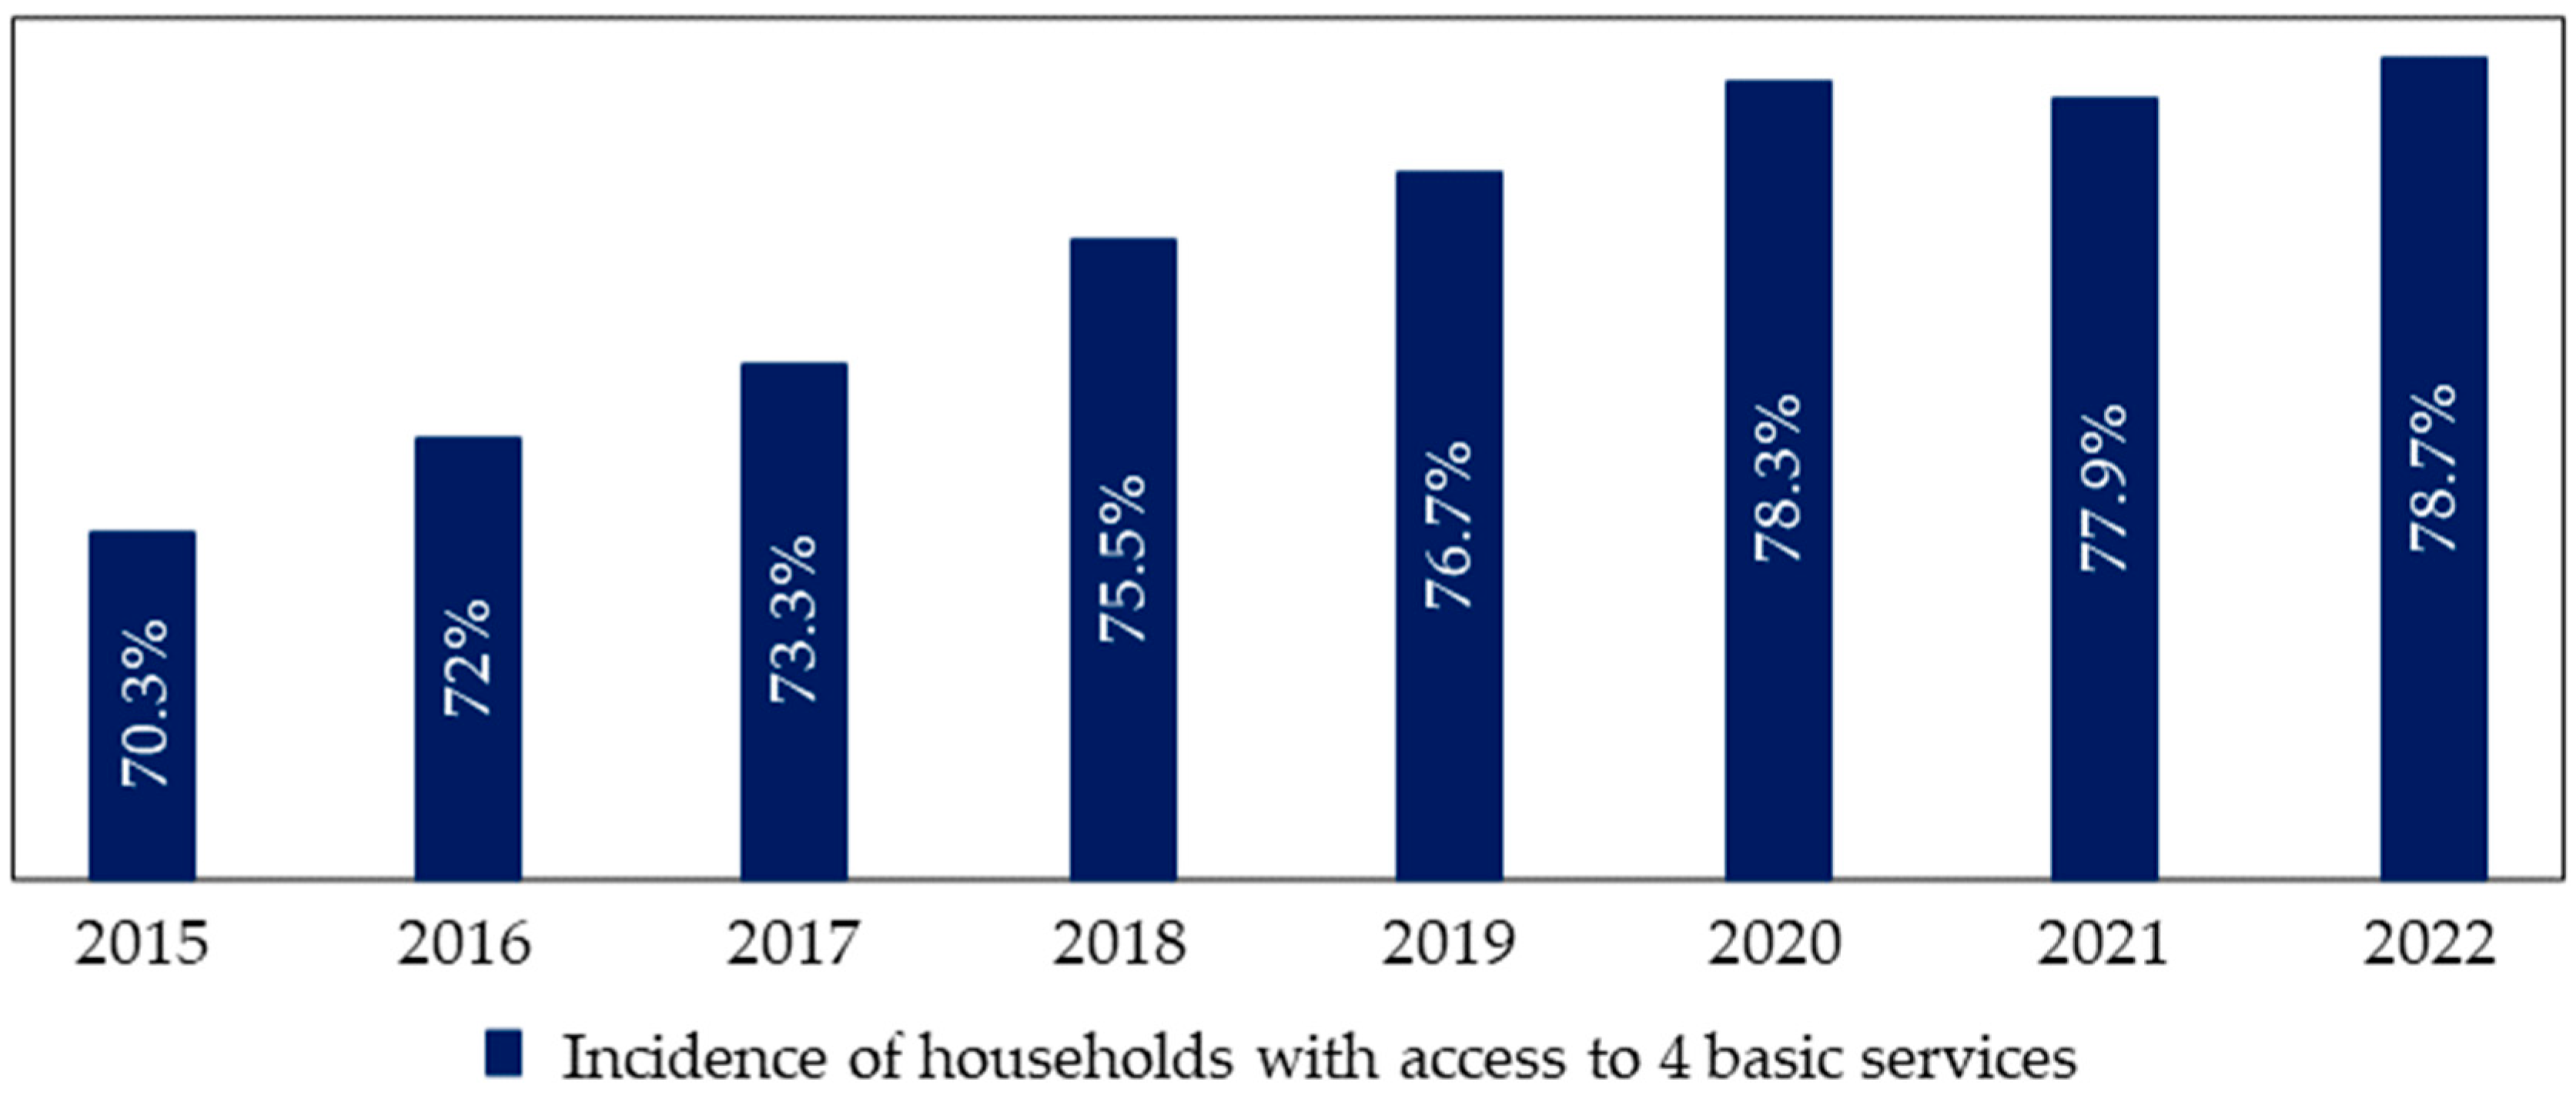
2.6.3. Access to Basic Services

This refers to the ability of people to meet their fundamental needs in terms of essential services, such as drinking water, sanitation, electricity, health care, education, and adequate housing. Access to basic services is an important indicator for assessing the well-being and level of development of a community or country.

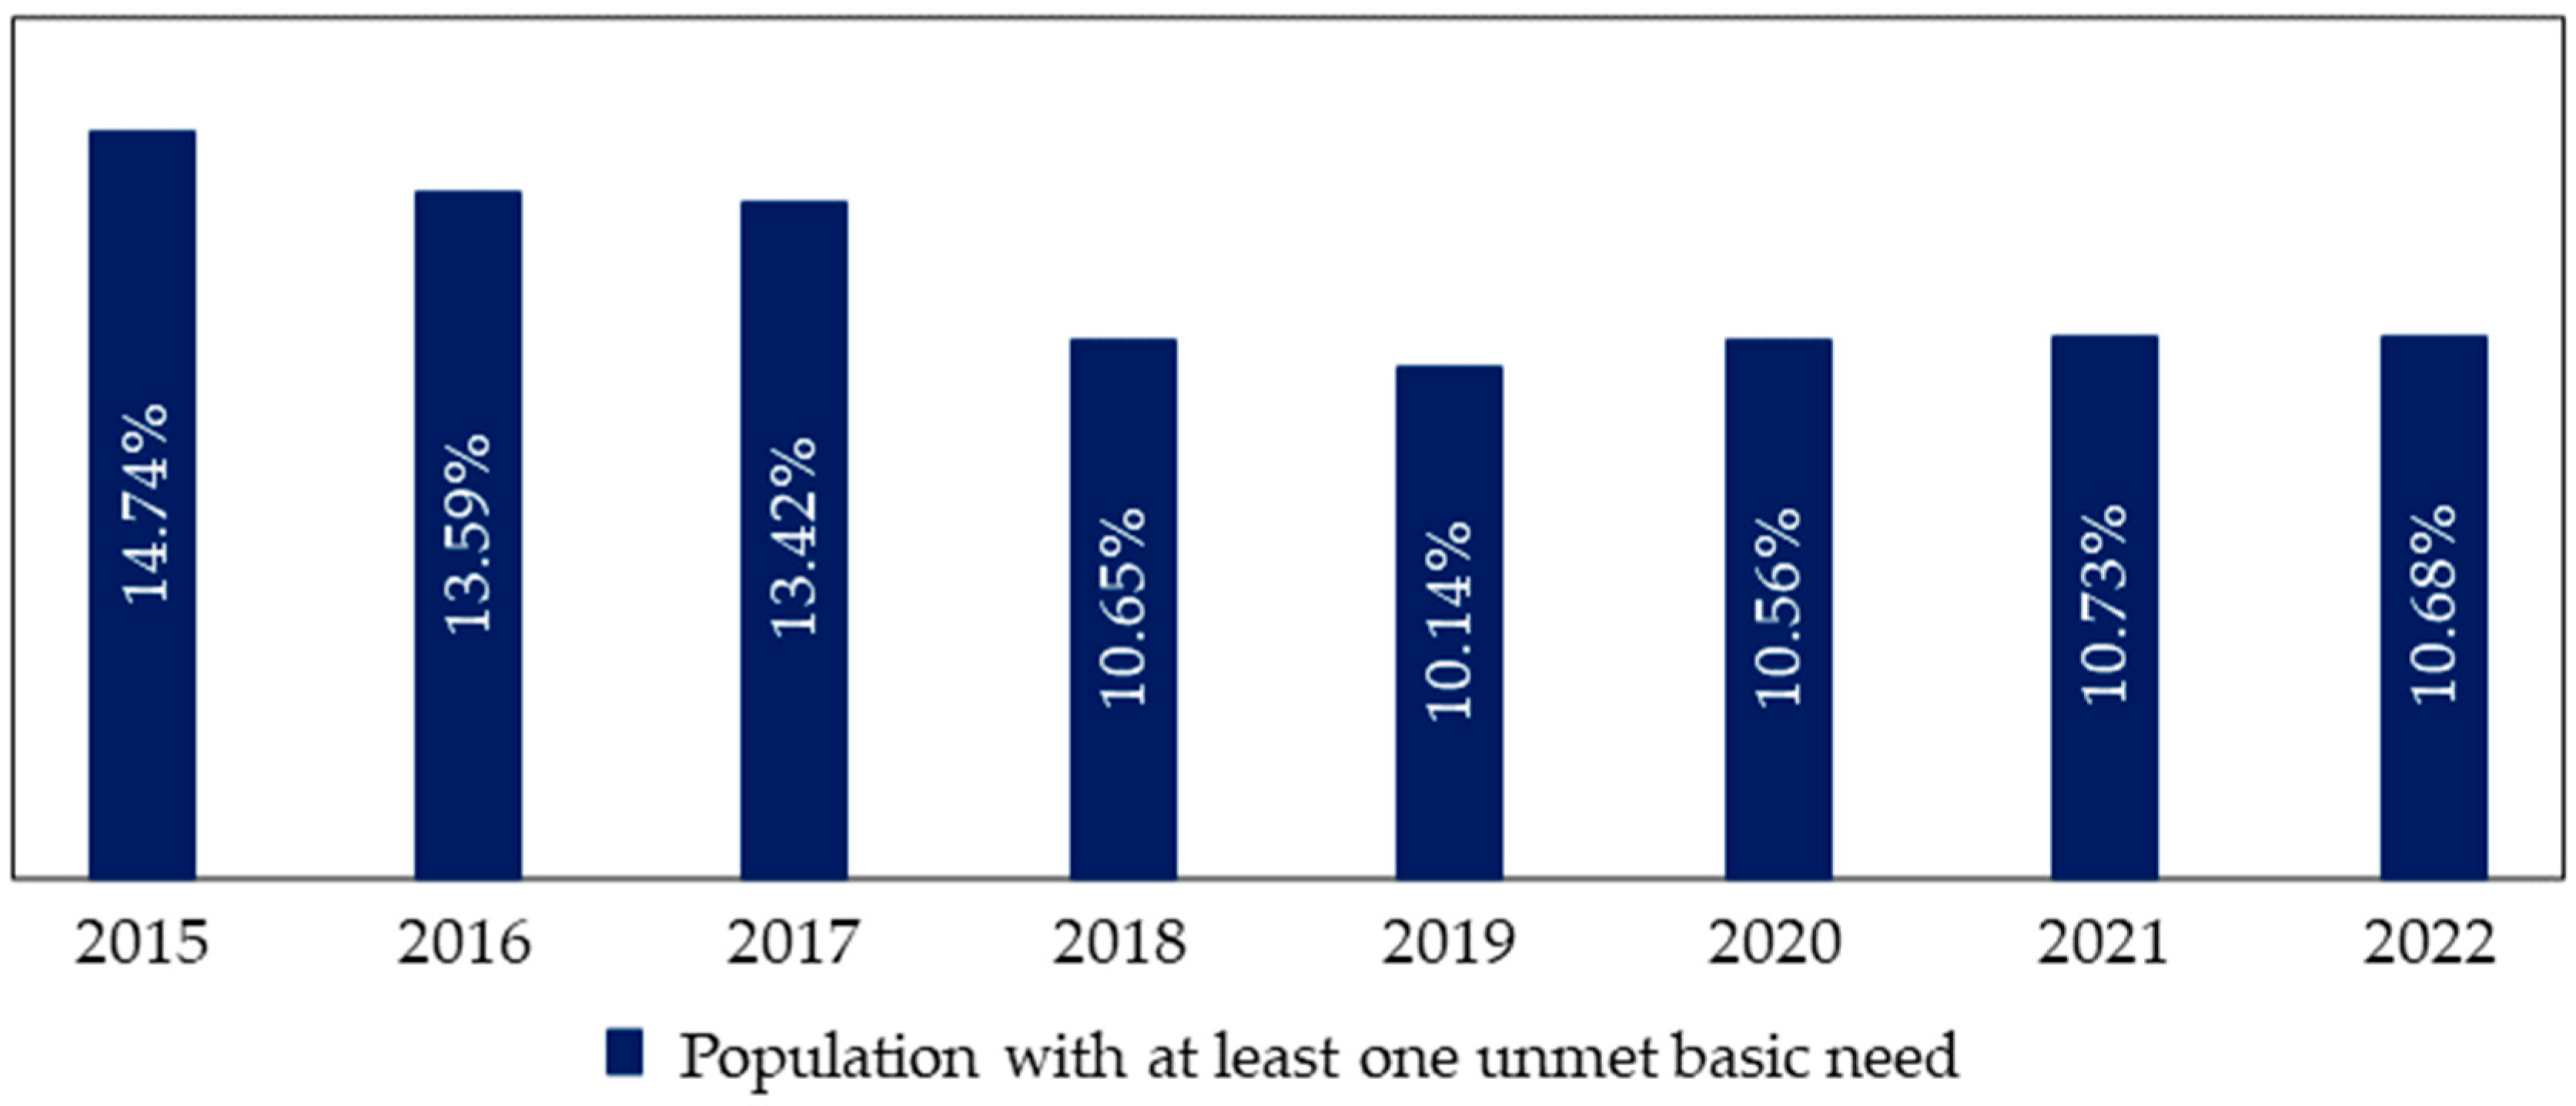
2.6.4. Unmet Basic Needs

This refers to the lack of access to or inability to meet the essential needs for a dignified life. These basic needs usually include adequate food, adequate housing, access to health services, basic education, drinking water, sanitation, and access to electricity. The presence of unmet basic needs is an indicator of poverty and inequality, as it shows the lack of access to minimally acceptable living conditions.

2.7. Statistical Analysis Method

The descriptive analysis was performed by means of simple and relative frequency tables, as well as statistical figures. For both, the temporality was considered for their classification and their evolution to 2022 was visualized. To characterize the post-investment costs, the method of multiple correspondence analysis (MCA) was used, determining the factors that generate a change in the value of the amounts. For the correlational analysis, the normality of the data was determined using the Shapiro–Wilk test. Subsequently, due to the presence of normality, the Pearson test was applied; in the case of the dimension with non-normality, it was decided to use Spearman’s Rho correlation test. The statistical software R v.4.3.0. was used with the integrated development environment (IDE) R Studio v. 2023.06.0.

3. Results

After compiling the preceding information from institutions that are part of the Regional Government of La Libertad-GRLL such as the Regional Contracting Management and the Regional Center for Strategic Planning-CERPLAN, a descriptive and inferential analysis was carried out in order to achieve the objectives proposed in this research. The results are presented considering the order of the specific objectives to finally determine what was proposed in the general objective.

3.1. Post-Investment Cost of Roads

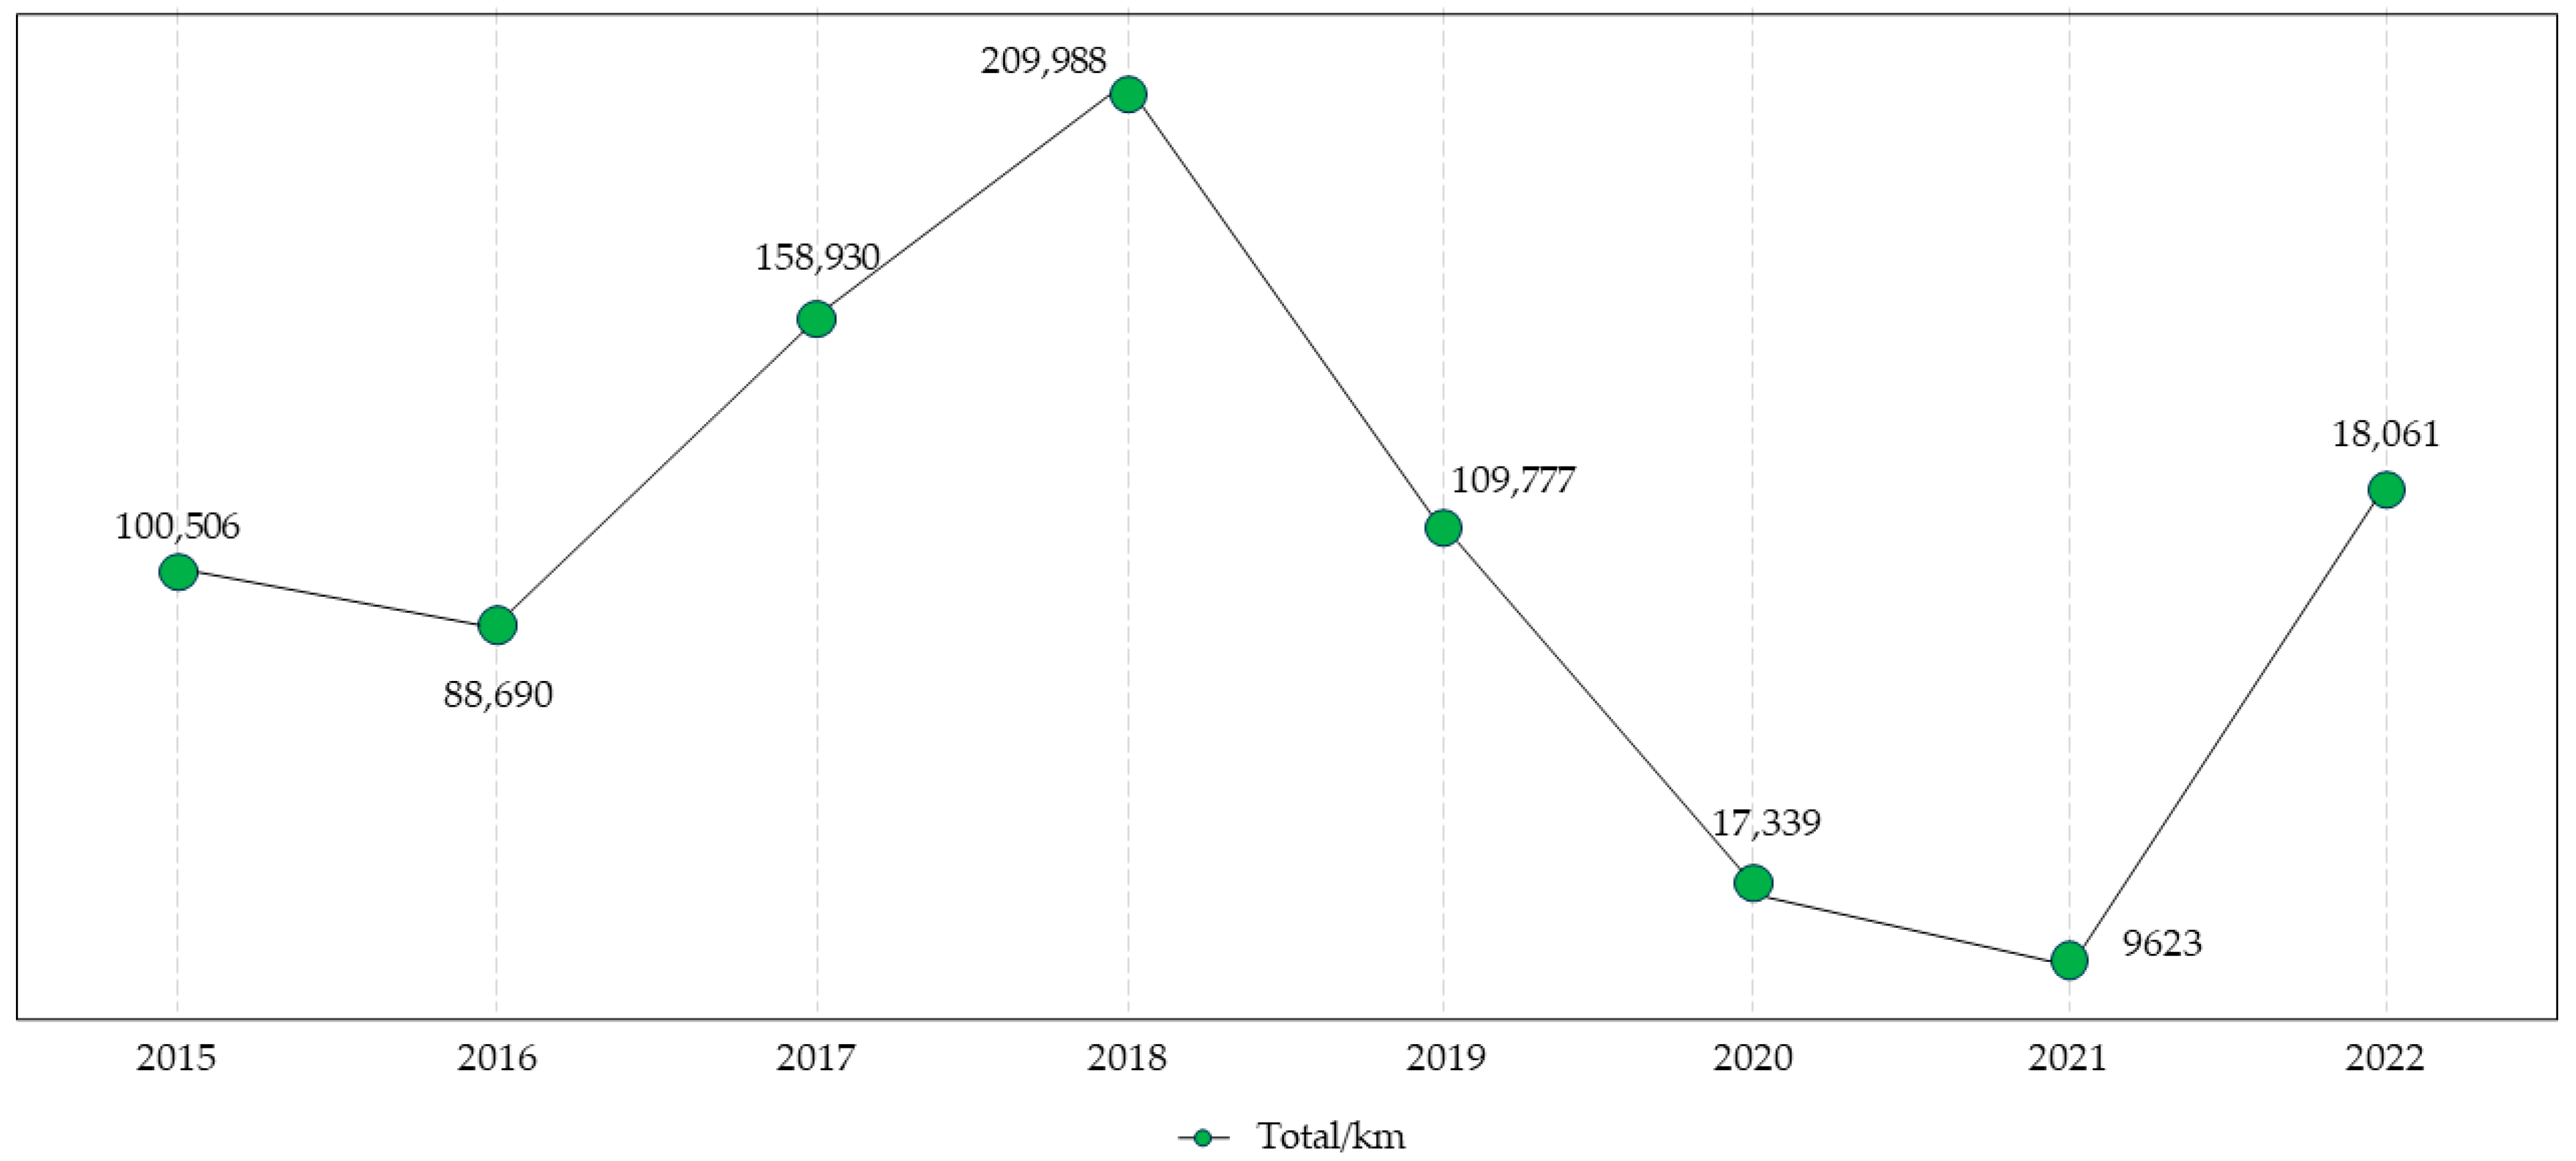
3.1.1. What Is the Post-Investment Cost of Roads in La Libertad from 2015 to 2022?

Table 1 shows that the largest number of projects were executed in 2020 and 2022, reaching 627.40 km and 370.49 km of roads, respectively. However, it was in 2022 that the maximum amount of execution in maintenance activities was presented, exceeding PEN forty million. From 2015 to 2022, the post-investment costs reach S/85,562,363.47, which benefited 1310.10 km.
Figure 1 shows that in 2015 the investment reached approximately PEN one hundred thousand per kilometer, maintaining this behavior until 2016, where it decreased to PEN eighty-eight thousand per kilometer. In the two following years, 2017 and 2018, it rose to S/158,930 and S/209,988, respectively. In 2019, a progressive decrease was observed, going from S/109,777 in 2019 to S/9623 in 2021; this was due to the COVID-19 pandemic. In 2022, it was observed that the investment cost rose to S/118,061, resuming its behavior due to the economic reactivation of the country.
In Table 2, we can see how the costs (execution, supervision, and total) exhibit significant variations over the 8-year period, as reflected in Figure 1. In particular, it is the execution costs that display large and diverse amounts during the recording period.

3.1.2. What Are the Post-Investment Costs for Road Projects in the Provinces of La Libertad during the Years 2015 and 2022?

Table 3 shows that the province with the lowest investment cost per kilometer was Sanchez Carrion, where it reached S/15,749.30. However, the provinces of Santiago de Chuco and Trujillo had the highest investment cost, reaching S/107,940.60 and S/117,585.07, respectively. This behavior is not related to the number of projects executed, since the province of Pataz had the highest number of projects, followed by Ascope and Otuzco.

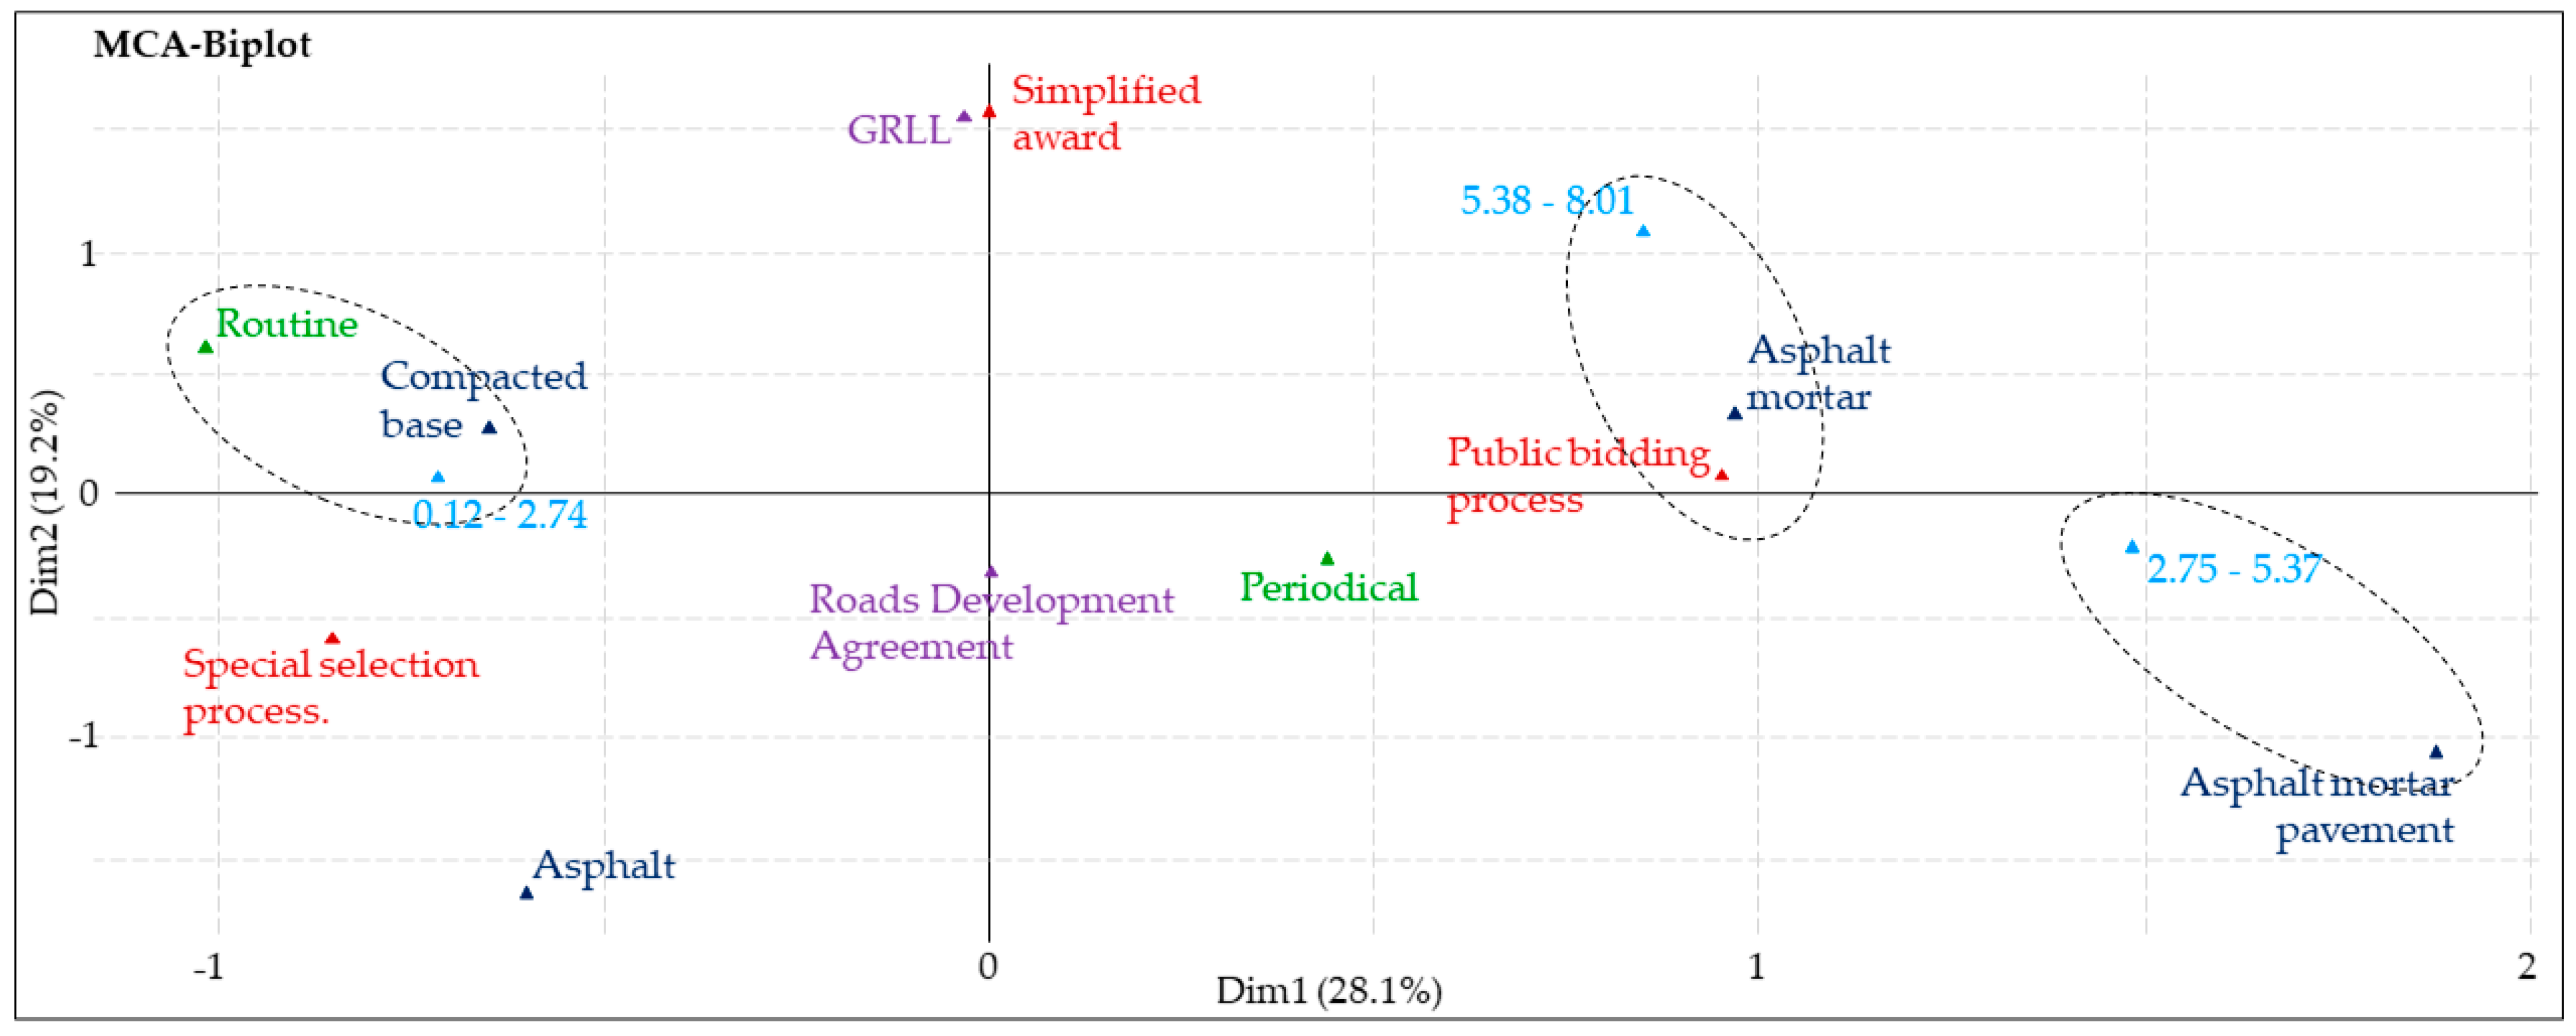
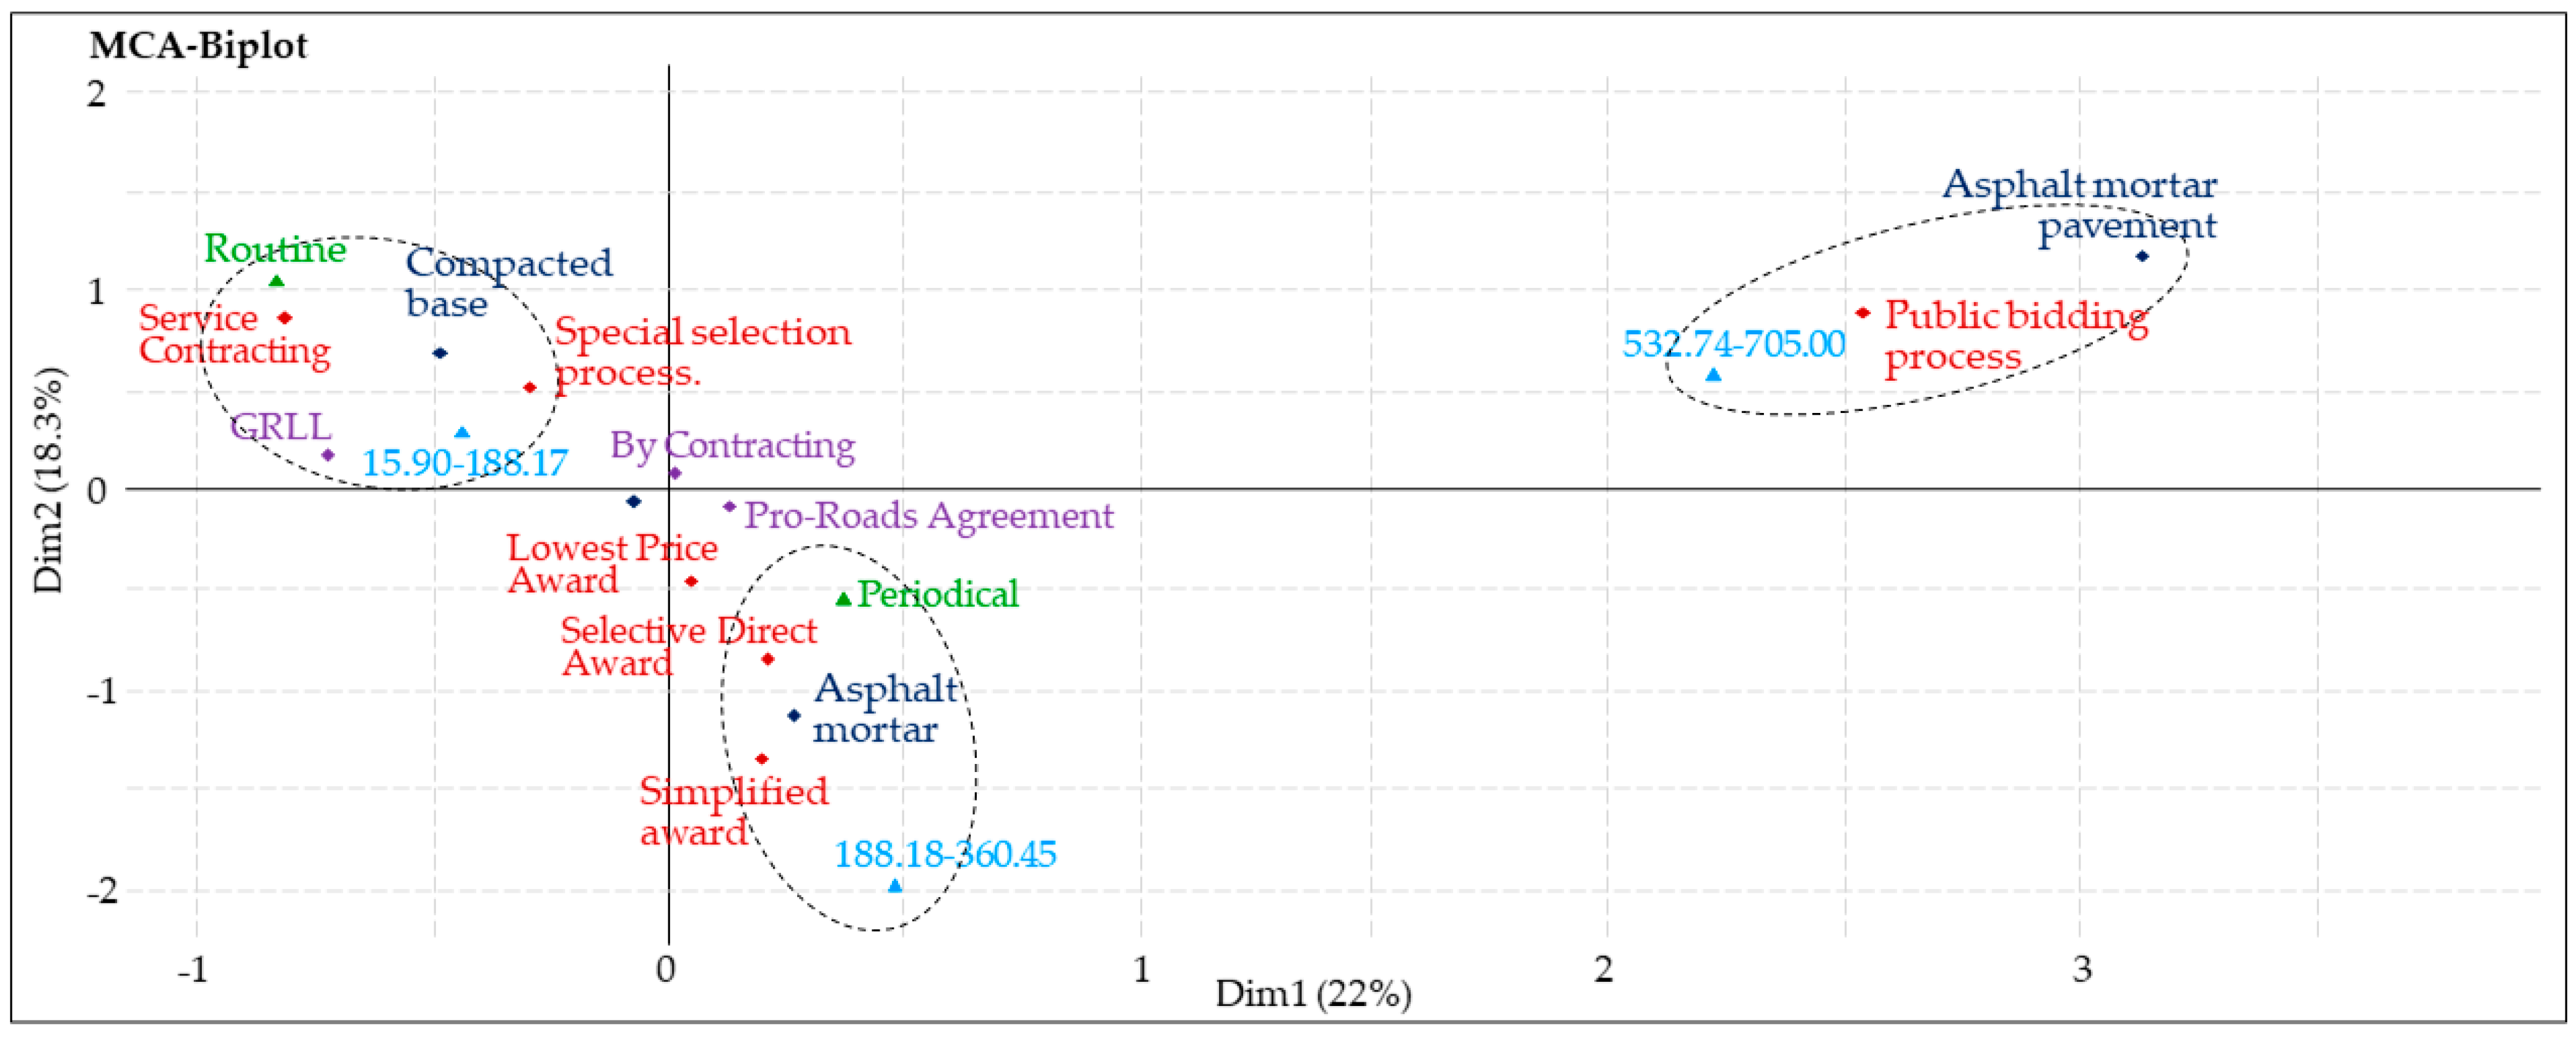
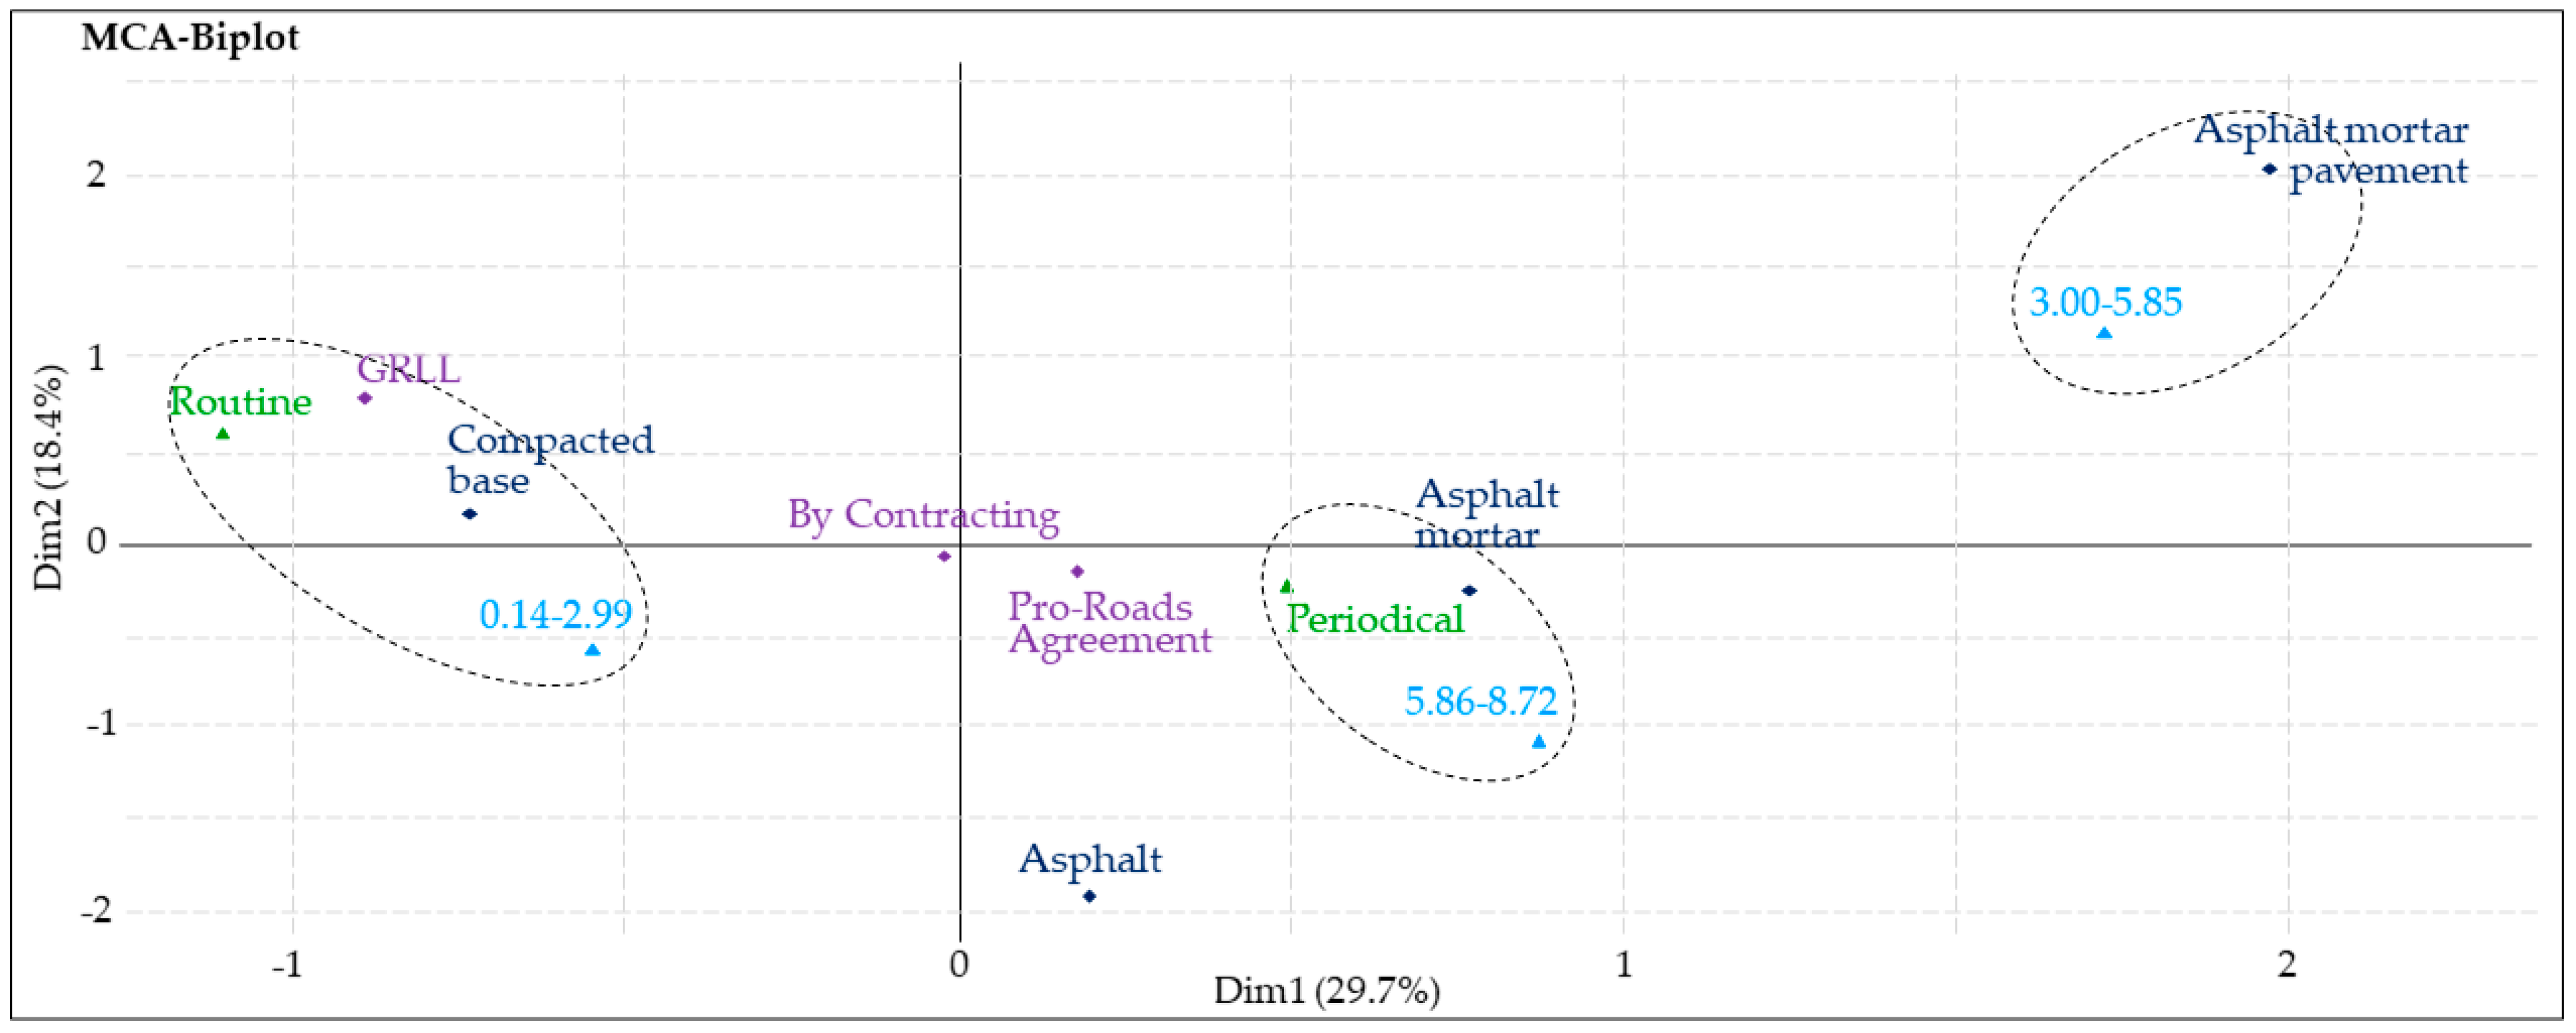
3.1.3. What Are the Characteristics of the Executed Projects Based on Their Post-Investment Cost?

When using the Multiple Correspondence Analysis (MCA) method, it was found that post-investment costs are characterized by certain factors detailed as follows:
In Figure 2, the projects from 2015 to 2022 reflect post-investment costs per execution that vary according to their characteristics; in detail, it can be indicated that those projects with a post-investment cost of execution ranging from PEN 121 thousand to 2.74 million present routine maintenance and affirmed rolling, and that their selection procedure was special. Likewise, projects with a post-investment cost of PEN 2.75 to 5.37 million presented an affirmed and asphalt mortar. Finally, those projects with a post-investment cost of PEN 5.38 and 8.01 million had an asphalt mortar and their selection procedure was by public bidding.
Figure 3 shows projects with post-investment costs for supervision that vary according to their characteristics. Those projects with a post-investment cost in supervision ranging from PEN 15.9 to 188.17 thousand present routine maintenance and an affirmed road surface, and were financed by the GRLL. Projects with a post-investment cost of PEN 188.18 to 360.45 thousand present an asphalt mortar wearing course and their selection process was a simplified adjudication. Finally, projects from PEN 360.46 to 532.73 thousand have pavement with asphalt mortar, and went through a public bidding selection process.
The projects from 2015 to 2022 reflect post-investment costs that vary according to their characteristics. Figure 4 shows that projects with a post-investment cost between 138 thousand and 2.99 million have an affirmed road surface; those projects between 3.00 and 5.85 million have an affirmed road surface and asphalt mortar; and, finally, those projects whose post-investment cost ranges between 5.86 and 8.72 million have asphalt mortar and periodic maintenance.

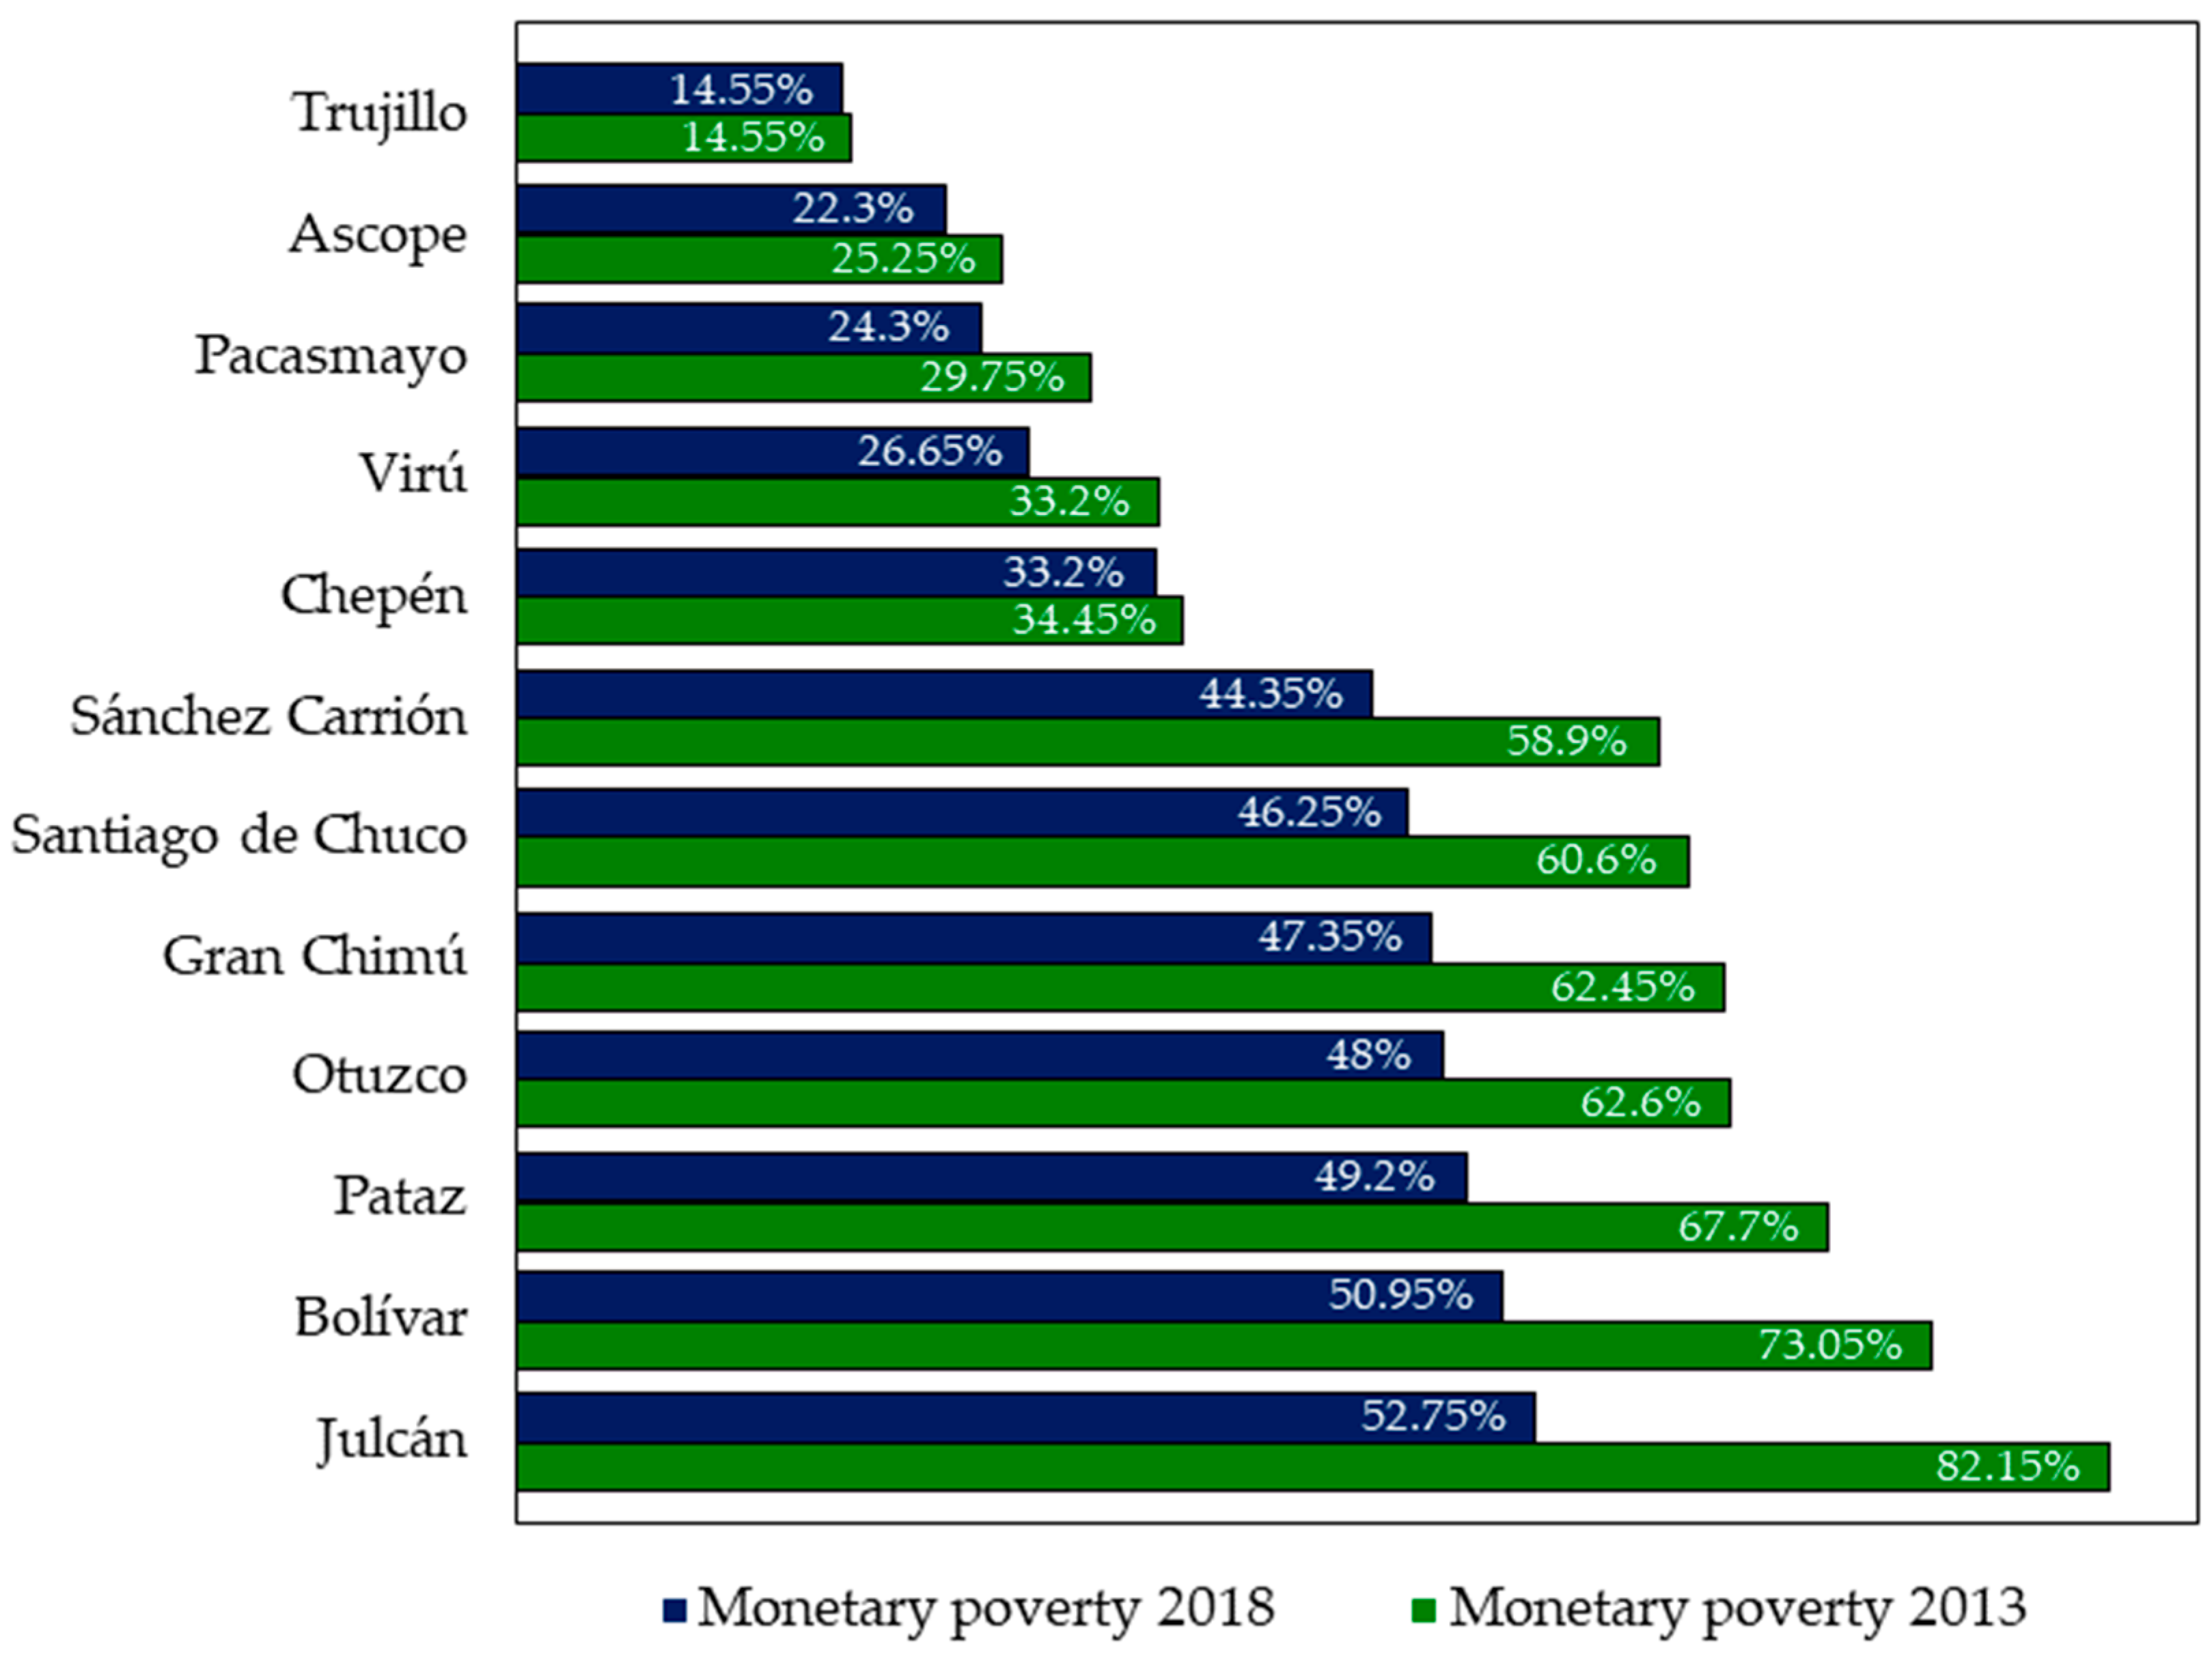
3.1.4. What Is the Economic Development by Province in the La Libertad Region during 2015 and 2022?

In Table 4, monetary poverty in Libertad in 2015 presented a value of 25.90%, but during the years 2016, 2017, and 2018 it was decreasing until it reached 20.80%. In 2019, it increased to 24.70% and in 2020, monetary poverty reached the highest percentage in the decade of 31.90%. In 2021, this percentage decreased to 26.80% and in 2022 it reached 28.40%. The trend of total monetary poverty can be observed in Figure 5.
Likewise, Figure 6 shows that in the 2013 study, monetary poverty was higher than that obtained in 2018. The provinces of Julcán, Bolívar, Pataz, Otuzco, Gran Chimú, Santiago de Chuco, and Sánchez Carrión presented percentages ranging from 58.90% to 82.15%; this gap decreased during five years, reaching from 44.35% to 52.75% in 2018.
Figure 7 shows that extreme monetary poverty in 2015 presented a percentage of 6.30%, decreasing until 2018, when it reached 3.20%. In 2019, this indicator increased until it reached what was obtained in 2015, and then decreased slightly in 2020, reaching 6.20%. In 2021, extreme monetary poverty reached 5.80% and in 2022 it reached 4.40%.
Figure 8 shows that access to the four basic services in Libertad households increased progressively from 2015 to 2020, reaching 78.30%. In 2021 and 2022, this indicator reached 77.90% and 78.70%, respectively.
Figure 9 shows that the population with at least one unsatisfied basic need decreased from 14.74% in 2015 to 10.14% in 2019. Subsequently, this indicator showed a slight upward trend with values of 10.56% in 2020, 10.73% in 2021 and 10.68% in 2022.

3.2. What Is the Relationship between Post-Investment Costs in Roads and Economic Development in the La Libertad Region from 2015 to 2022?

Table 5 shows that for the purpose of this analysis, the ratio of post-investment cost per kilometer was considered, since this indicator reflects the cost of maintenance both in execution and supervision, divided by the number of kilometers worked. Likewise, the indicators that will allow studying the economic development of La Libertad from 2015 to 2022 are observed. With this information, the Pearson test was applied, because when the normality analysis was performed with the Shapiro–Wilk test, a behavior adjusted to the normal distribution was obtained in post-investment cost ratio per kilometer, extreme monetary poverty, total monetary poverty, and basic services. The unmet basic needs indicator does not present this behavior; in this case, Spearman will be applied.
Table 6 displays the results of the correlation analysis between post-investment costs and economic development from 2015 to 2022. According to the values obtained, both total and extreme monetary poverty show a significant (r: −0.788, p-value: 0.02; r: −0.729, p-value: 0.04, respectively) and inverse relationship with post-investment costs, indicating that as post-investment costs increase, monetary poverty in La Libertad decreases. However, there was no significant relationship observed in access to the four basic services and unmet basic needs (r: −0.320, p-value: 0.44; r: −0.119, p-value: 0.78, respectively). This may reflect that the population is not immediately benefiting from access to basic services with these investments, highlighting the need for changes in government policies and the execution procedures for such projects so that families can access employment, increase their income, and enhance their living conditions and quality of life.

4. Discussion

When determining the post-investment cost of roads in La Libertad from 2015 to 2022, we sought to define this construct and found that it is the permanent service in social investment projects where operation and maintenance costs are present [18]. Likewise, this stage includes the operation and maintenance of the project, as well as the evaluation after its implementation [19]. Taking into account these contributions, the information collected from the Regional Government of La Libertad was studied, where it was found that the projects under study, dating from 2015 to 2022, generated a post-investment cost of S/85,562,363.47 PEN, which is reflected in 1310.10 km of road. Likewise, the largest amount of projects that were executed in 2019 and 2022 reached 627.40 km and 370.49 km of road, respectively, but it was in 2022 that presented the maximum amount of execution in maintenance activities, which exceeded PEN forty million. When analyzing the amount of investment per kilometer, it was found that the behavior was variable during the years evaluated, going from S/100,506 in 2015, to S/118,060.67 in 2022, but with a peak of S/209,988.29 in 2018. The effects of the COVID-19 pandemic were reflected in the behavior of post-investment costs, as during 2020 and 2021 costs of S/17,339 and S/9623 PEN were generated, respectively. These results are consistent with the findings found in international contexts such as Latin America and Europe, for example, in LATAM, Ecuador determined that the investment destined to road infrastructure was significant during the years 2007 and 2016 [20], Likewise, in Colombia, it was determined that since 1994, the investment in road infrastructure was low, reflected in a backlog in terms of road construction and maintenance of roads in those years, but currently the GDP is greater than 4% and investment in road infrastructure has increased annually by 10%, thanks to public policies and financing in conjunction with the private sector [21], In addition, the benefits of increased investment in road infrastructure are tangible in the short and long term [22]. In Europe, the Spanish reality was studied and it was pointed out that road infrastructure has long been given importance, considering it as a goal and focusing its value primarily on the increase in construction, although its impact on the economy and society is now being considered [23]. These coincidences allow determining that post-investment costs have increased in the last decade despite the context. Above all, it is observed that in South American countries, such as Ecuador and Colombia, the growth in road investment is reflected in their economic development or, at least, they aspire to achieve positive results in the social and economic aspects.
When comparing the post-investment costs of roads in the provinces of La Libertad for the years 2015 and 2022, the implications were taken into account. By improving road networks, transportation costs and times are reduced, generating greater access and favoring the economy and interregional relations [24]. Likewise, the availability of road infrastructure has a positive influence on municipal regional economic growth through production [25]. In this comparison by province, it was found that the province with the lowest investment cost per kilometer was Sanchez Carrion, where it reached S/15,749.30. However, the provinces of Santiago de Chuco and Trujillo had the highest investment costs, reaching S/107,940.60 and S/117,585.07, respectively. If we analyze what is happening in these provinces, it could be indicated that the theoretical contributions mentioned above are really reflected, since the province of Sanchez Carrion is a province with low economic development, compared to Trujillo.
Contrasting this with previous findings, similarities are found with a study conducted in the San Martin Region, which shows that the social and economic development of this region is directly related to road maintenance [26]. In addition, a management system for road infrastructure maintenance is key and should be implemented to achieve the economic development of cities and reduce vehicle operating costs, provide users with better road service, and reduce transportation times and accidents [27]. Similarities were found in other contributions [28] since the study indicated that efficient and adequate preventive maintenance of road infrastructure is key to generate the economic and social development of the country.
In the same way, the use of road infrastructure improves the quality of life, which is why it is necessary to invest in roads at the national level, or if it is not possible to expand, focus should be on boosting regions [29]. Furthermore, if regional economies grow, the country’s economy will grow as well [30]. Therefore, it can be indicated that post-investment in roads should be done in an equitable manner, covering the priority needs of the population and the various economic sectors, which will result in improving the quality of life of the inhabitants and boosting the economy of each province and the region.
When characterizing the projects executed in La Libertad from 2015 to 2022 according to their post-investment costs, the information collected was analyzed taking into account that road maintenance in public works is associated with the cost of execution, which is financed by the society [31]. Among the ways of financing these processes are recurrent resources, earmarked funds, and user charges. According to the results obtained, it was observed that the projects from 2015 to 2022 reflect post-investment costs that vary according to their characteristics, for example, projects with a post-investment cost between 138 thousand and 2.99 million present an affirmed rolling. Those projects between 3 and 5.85 million present an affirmed road surface with asphalt mortar. Finally, projects with a post-investment cost of between 5.86 and 8.72 million have an asphalt mortar and periodic maintenance. Similarly, it was found in the supervision stage that the adjudications are made through public bidding and selective direct adjudication, and the projects are commonly financed by the GRLL. These results are similar to those found in Colombia, where investment in road infrastructure has increased by 10% annually due to public policies and being financed by public and private sources [21]. Similarly, every project requires financing through the creation of money and is not determined by the variables and functions existing in the economic system [32]. Although it is true that in most projects there was no evidence of private sector participation, it can be indicated that government financing is key for the post-investment costs to be sustainable and to maintain good service to users, and at the same time the projects can influence the economic development of the region in the short term.
In identifying economic development by province in the La Libertad Region from 2015 to 2022, we consider that economic development is the capacity of regions or countries to generate wealth in order to promote and maintain the economic and social well-being of the population [33]. Accordingly, economic development was analyzed through the monetary poverty dimension. La Libertad region in 2014 presented a value of 27.4%, which was decreasing until reaching 20.8% in 2018. A year later, it increased to 24.7% and in 2020, monetary poverty reached the maximum percentage of 31.9% in the decade. In 2021, this percentage decreased to 26.8% and in 2022, it reached 28.4%. Likewise, the provinces with the highest monetary poverty are Julcán, Bolívar, Pataz, Otuzco, Gran Chimú, Santiago de Chuco, and Sánchez Carrión. The behavior of the dimension of the population with at least one unsatisfied basic need (UBN) was decreasing from 2015 with 14.74% to reach 10.56% in 2019. Subsequently, this indicator remained stable with values of 10.73% in 2021 and 10.68% in 2022. Access to the four basic services in La Libertad households increased progressively from 2015 to 2020, reaching 78.3%. In 2021 and 2022, it reached 77.9% and 78.7%, respectively. With these results, we can deduce that the main purpose of roads is regarding economic development [34]. In addition, road improvement generated benefits of accessibility, increased traffic, and economic development in households, measured in the long term [35]. With this, it can be indicated that in La Libertad region, there was a high percentage of monetary poverty, but despite having decreased from 2013 to 2018, some provinces still have a very high gap to the ideal percentage. Therefore, it is important that the projects be executed and the post-investment costs be realized in greater amounts.
The main purpose of the present research was to determine the existence of a relationship between post-investment costs and economic development in La Libertad Region, based on the fact that economic development is a long-term process of improving the economic well-being of a society, which includes increasing per capita income, reducing poverty, improving the quality of life, and creating employment opportunities [36]. This process is linked to investment, innovation, and education. Likewise, the World Bank indicated that investments in transportation stimulate economies, reduce climate problems, and integrate the population with other basic services, such as education and health [11]. According to the results obtained from the collected information, it was statistically found that post-investment cost and economic development between 2015 and 2022 are significantly related (r: −0.788, p-value: 0.02; r: −0.729, p-value: 0.04, for total and extreme poverty, respectively). This means that as post-investment costs increase, monetary poverty would be reduced. In the case of the indicators that households will have access to the four fundamental basic services and unmet basic needs, no relationship was found. This may be a reflection of the fact that the population is not benefiting immediately from these investments, which is why there is an urgent need for changes in government policies and procedures for the execution of these types of projects, so that families can have access to work, increase their income, and improve their living conditions and quality of life. This behavior may be due to multiple factors and what has been obtained here cannot refute what has been pointed out in theoretical contributions; even when addressing the contributions of the antecedents, it has been observed that their results coincide with what was expected. However, it differs from what was obtained in some dimensions studied in this research; for example, there are precedents that have supported the direct relationship between investment in road infrastructure (maintenance, construction, and conservation) and economic growth [37]. Similarly, in order to inspire economic progression, it is essential to invest in road infrastructure [10]; moreover, road networks have an impact on economic, social, cultural, and political dimensions [38].
On the other hand, it is known that some years ago importance was given to road infrastructure as such, considering it as a goal and focusing on increase related to its construction, whereas nowadays, the subject is viewed holistically, focusing on its contribution, and it is seen as a means to achieve economic, social, environmental, and political purposes [23]. Other research has shown the importance and mandatory nature of decentralizing the road network and thus generating sources of wealth [39], which differs from the findings of the present study. Likewise, in the San Martin Region, it was determined that road maintenance is related to the economic and social development of the region, which also differs from the results obtained in this study, but reinforces the idea that at the national level this link should be present [26].
Investment in road infrastructure is an incentive for economic growth in Peru. In this way, similarities are found with the dimension of access to basic services, but analyzing the reasons for the non-relation of the other dimensions, in this research the contributions of the predecessors can be valued despite not resorting to statistical methods to demonstrate their hypotheses or considering that the impacts of the investments will be reflected in the medium and long term.

5. Conclusions

Through a correlational analysis, it was determined that in the La Libertad region, during the years 2015 and 2022, post-investment costs in road project execution are significantly related to economic development, specifically through the dimension of monetary poverty. However, the other dimensions did not show a significant relationship but this does not contradict the theoretical contributions and studies that do establish such a relationship.
The post-investment cost in roads in the La Libertad region reached S/85,562,363.47 PEN between 2015 and 2022, generated by the maintenance of 1310.10 km of road. This cost is divided into S/80,247,513.76 for execution activities and S/5,314,849.71 for supervision activities. The years 2020 and 2022 had the highest post-investment costs, reaching S/10,878,133.83 and S/43,740,414.73 PEN, respectively.
At the provincial level, it was determined that the highest number of projects and post-investment costs occurred in Pataz with S/18,483,492.81 and Santiago de Chuco with S/18,263,873.32. However, when considering the cost per kilometer, Trujillo and Santiago de Chuco are the provinces with the highest post-investment per kilometer, reaching S/117,585.07 and S/107,940.60, respectively.
Most of the projects with post-investment costs ranging from PEN 138,000 to 2.99 million have characteristics such as gravel surface and a special selection process. Those with post-investment costs between PEN 3 and 5.85 million have a gravel surface and asphalt mortar, and those with costs ranging from PEN 5.86 to 8.72 million have periodic maintenance, asphalt mortar, and a selection process through public tender.
The economic development of the La Libertad region, as measured by monetary poverty, ranged between 26.80% and 28.40%, and access to the four basic services in households in La Libertad progressively increased from 2015, reaching 78.7% in 2022.

6. Recommendations

Resource allocation in road maintenance and improvement projects should be prioritized in provinces with the greatest economic need and development potential. Additionally, enhancing the supervision and control of post-investment road projects is essential to ensure compliance with quality standards and the efficient use of resources.
Governmental entities responsible for providing statistical information on economic aspects should consider including other indicators of economic development to gain a more comprehensive perspective on the outcomes of investments in road infrastructure. Furthermore, they should explore the possibility of conducting qualitative research to address the perceptions and experiences of local stakeholders regarding post-investment road projects and their impact on economic development.
Future researchers are advised to conduct more detailed studies that incorporate additional variables for evaluating the relationship between post-investment road costs and economic development, such as the impact on job creation. Moreover, expanding the analysis period is recommended to obtain a more comprehensive understanding of the long-term relationship between road investment and economic development.

Author Contributions

Conceptualization, M.R.O.R.; Methodology, M.R.O.R.; Software, E.J.G.Z.; Formal analysis, M.R.O.R. and S.E.S.A.; Investigation, M.R.O.R. and S.E.S.A.; Data curation, E.J.G.Z.; Writing—original draft, M.R.O.R.; Writing—review & editing, S.E.S.A. and H.W.Z.P.; Visualization, H.W.Z.P.; Supervision, S.E.S.A. All authors have read and agreed to the published version of the manuscript.

Funding

The APC was funded by Universidad César Vallejo.

Institutional Review Board Statement

Not applicable.

Informed Consent Statement

Not applicable.

Data Availability Statement

Access to data: https://bit.ly/3Rhrkv1 (accessed on 10 April 2023).

Conflicts of Interest

The authors declare no conflict of interest.

References

  1. Ashley, R. Fundamentals of Applied Econometrics; Wiley: Hoboken, NJ, USA, 2012. [Google Scholar]
  2. Coco, J. Infraestructuras y Crecimiento: Un Análisis Para España. Licentiate Thesis, Universidad de Valladolid, Valladolid, Spain, 2019. Available online: https://uvadoc.uva.es/bitstream/handle/10324/40408/TFG-E-899.pdf?sequence=1 (accessed on 2 September 2023).
  3. Smith, A. An Inquiry into the Nature and Causes of the Wealth of Nations; Strahan, W., Ed.; Methuen Publishing Ltd.: London, UK, 1776. [Google Scholar]
  4. Lucas, R.E. On the Mechanics of Economic Development; Universidad de Chicago: Chicago, IL, USA, 1988. [Google Scholar]
  5. Morettini, M. El Modelo de Crecimiento de Solow. 2009. Available online: http://nulan.mdp.edu.ar/id/eprint/1854/1/01466.pdf (accessed on 10 February 2023).
  6. Suárez, D.; Fiorentin, F.; Erbes, A. Dime cómo creces y te diré cómo inviertes. El impacto de la I+D, los recursos humanos y los sistemas de innovación en el crecimiento económico: Una comparación internacional. Rev. Bras. Inovação 2022, 19, e020009. [Google Scholar] [CrossRef]
  7. Weikert, F. Infraestructura resiliente: Un imperativo para el desarrollo sostenible en América Latina y el Caribe. Comer. Int. CEPAL 2021, 160, 1–80. [Google Scholar]
  8. Fernand, P.; Pastás, E. Corruption and economic growth in Latin America and the Caribbean. Rev. Econ. Del Caribe 2021, 29, 32–49. [Google Scholar]
  9. Palacios, J.P.; Rodríguez, R.E.; Fuerte, L.; Pereyra, V. Problemática de la corrupción en el Perú. Rev. Cienc. Soc. 2022, 28, 268–278. [Google Scholar] [CrossRef]
  10. Salas, Y. Inversión en Infraestructura vial y Crecimiento Económico: Revisión Para Antioquia (Colombia) 2017. Bachelor’s Thesis, Universidad Pontificia Bolivariana, Medellín, Colombia, 2020. [Google Scholar]
  11. Banco Mundial. Transporte: Panorama General. 16 June 2022. Available online: https://www.bancomundial.org/es/topic/transport/overview (accessed on 23 July 2023).
  12. Bojorque, J.; Chuquiguanga, C. Efecto de la infraestructura pública en el precio del suelo urbano. Caso de la ciudad de Cuenca, Ecuador. Urbano (Concepción) 2021, 24, 74–83. [Google Scholar] [CrossRef]
  13. Schwartz, J. Más Allá del Crecimiento: ¿Es bueno para el Bienestar de la Población Invertir en Infraestructura? 20 February 2023. Available online: https://blogs.worldbank.org/es/latinamerica/m-s-all-del-Crecimiento-es-bueno-para-el-bienestar-de-la-poblaci-n-invertir-en-infraestructura (accessed on 25 July 2023).
  14. Tribuna de Cuentas Europeo. 2013 Annual Report: EU Must Focus on Getting Better Results from Its Spending. Available online: https://www.eca.europa.eu/es/Pages/AR_2013.aspx (accessed on 28 July 2023).
  15. Ministerio de Transportes y Comunicaciones. Nosotros Portal MTC; Ministerio de Transportes y Comunicaciones: Lima, Peru. Available online: https://portal.mtc.gob.pe/nosotros/index.html (accessed on 30 July 2023).
  16. Banmericas, Inversiones Peruanas en Infraestructura de Transporte Caen en el 2022. Available online: https://www.bnamericas.com/es/noticias/inversiones-peruanas-en-infraestructura-de-transporte-caen-en-2022 (accessed on 10 April 2023).
  17. Hernández, R.; Mendoza, C. Metodología de la Investigación. Las Rutas Cuantitativa, Cualitativa y Mixta; Editorial Mc Graw Hill Education: Ciudad de México, Mexico, 2018. [Google Scholar]
  18. Andía, W. Inversión social: Enfoque para clasificar los proyectos. Prod. Gestión 2011, 14, 9–14. [Google Scholar]
  19. MEF. ¿Qué es la Pobreza Según Necesidades Básicas Insatisfechas? Política Económica y Social. MEF: Lima, Peru, 2023. Available online: https://www.mef.gob.pe/es/?option=com_content&language=es-ES&Itemid=100694&view=article&catid=750&id=4856&lang=es-ES (accessed on 15 February 2023).
  20. Pualasín Pullutacsi, M.P. Análisis de la Deuda Pública y la Inversión en Infraestructura vial Período 2007–2016. Licentiate Thesis, Universidad Técnica de Ambato, Ambato, Ecuador, 2021. Available online: https://repositorio.uta.edu.ec/jspui/handle/123456789/32480 (accessed on 20 March 2023).
  21. Saldaña Núñez, C.A. Efecto de la Inversión en Infraestructura vial al Desarrollo Económico y a la Competitividad de Colombia Entre los Años 1994 y 2016. Licentiate Thesis, Universidad La Gran Colombia, Bogota, Colombia, 2018. Available online: http://hdl.handle.net/11396/4042 (accessed on 25 March 2023).
  22. Galindo, F.S. Las carreteras y su influencia en el desarrollo económico y en el bienestar social de un país. Aula Abierta 1996, 67, 161–180. [Google Scholar]
  23. De Rus, G. La Nueva Política de Transporte: Apuntes Sobre el Anteproyecto de Ley de Movilidad Sostenible; FEDEA: Madrid, Spain, October 2022; Available online: https://documentos.fedea.net/pubs/ap/2022/ap2022-10.pdf (accessed on 1 April 2023).
  24. Sánchez, F. Fundamentos epistémicos de la investigación cualitativa y cuantitativa: Consensos y disensos. Rev. Digit. Investig. Docencia Univ. 2019, 13, 102–122. [Google Scholar] [CrossRef]
  25. Zepeda-Ortega, I.E.; Ángeles-Castro, G.; Carrillo-Murillo, D.G. Infraestructura carretera y crecimiento económico en México. Probl. Desarro. 2019, 50, 145–168. [Google Scholar] [CrossRef]
  26. Pizarro, S. Gestión del Programa de Mantenimiento de Carreteras y Desarrollo Socioeconómico. Dirección Regional de Transportes y Comunicaciones de San Martín, 2018. Ph.D. Thesis, Universidad César Vallejo, Trujillo, Peru, 2018. Available online: https://hdl.handle.net/20.500.12692/32006 (accessed on 1 April 2023).
  27. Peñaloza, K.L. Aplicación del Programa Modelo Desarrollo y Gestión de Carreteras-4 en Gestión Para el Mantenimiento de la Av. Amancaes, Rìmac, Lima. Bachelor’s Thesis, Universidad Peruana Los Andes, Junin, Peru, 2021. Available online: https://hdl.handle.net/20.500.12848/2055 (accessed on 15 April 2023).
  28. Pecho, Y. Importancia del Mantenimiento Preventivo de Puentes en el Perú. In En E. Carrera (Dir.), I Congreso Internacional de Ingeniería y Dirección de Proyectos III Congreso Regional IPMA–LATNET; Universidad de Piura, Facultad de Ingeniería: Lima, Peru, 2017; pp. 37–48. Available online: https://hdl.handle.net/11042/3992 (accessed on 15 April 2023).
  29. Zapana, J.M. Convergencia Económica en el Perú y el rol de la Infraestructura vial: 2001–2019. Licentiate Thesis, Pontificia Universidad Católica del Perú, San Miguel, Peru, 2021. Available online: https://tesis.pucp.edu.pe/repositorio/handle/20.500.12404/20434 (accessed on 15 April 2023).
  30. Vásquez, A.; Bendezú, L.; Consorcio de Investigación Económica y Social (CIES). Ensayos Sobre el rol de la Infraestructura vial en el Crecimiento Económico del Perú. 2008. Available online: https://www.cies.org.pe/es/publicaciones/diagnostico-y-propuesta/ensayos-sobre-el-rol-de-la-infraestructura-vial-en-el (accessed on 18 May 2023).
  31. Lecca, J.A. Criterios de Selección de Nuevos Sistemas de Gestión y Financiación Para la Conservación de Carreteras en el Perú. 2017. Available online: https://hdl.handle.net/20.500.12759/3736 (accessed on 21 May 2023).
  32. Schumpeter, J.A. Teoría del Desenvolvimiento Económico: Una Investigación Sobre Ganancias, Capital, Crédito, INTERÉS y ciclo Económico, 2nd ed.; Prados Arrarte, J., Translator; Fondo de Cultura Económica: Mexico DF, Mexico, 1997. [Google Scholar]
  33. Agurto Morán, S.T.; Maceda Espinoza, M.A. Inversión Pública en el Desarrollo Económico Regional de Tumbes en el Período 2010–2016. 2020. Available online: https://repositorio.unp.edu.pe/handle/20.500.12676/2696 (accessed on 21 May 2023).
  34. Neves, P.; Banco Mundial Blogs. Colombia: Las carreteras más transitadas. 16 January 2018. Available online: https://blogs.worldbank.org/es/voices/colombia-las-carreteras-mas-transitadas (accessed on 23 May 2023).
  35. Lancelot, E.; Ogita, S.; Castro, B.; Banco Mundial Blogs. ¿Las Mejoras en las Carreteras de Verdad Mejoran la Calidad de Vida? 2015. Available online: https://blogs.worldbank.org/es/voices/las-mejoras-en-las-carreteras-de-verdad-mejoran-la-calidad-de-vida (accessed on 23 May 2023).
  36. Vásquez, A.C.; Dávila, K.S. Una mirada al desarrollo económico local con enfoque al crecimiento socioeconómico. Cienc. Lat. Rev. Científica Multidiscip. 2021, 5, 8302–8335. [Google Scholar] [CrossRef]
  37. Carreño Benitez, C.C.; Jiménez Merchan, L.V. La Inversión en Infraestructura vial (Obras 4G) y el Crecimiento Económico en Colombia 2000–2015. Licentiate Thesis, Fundación Universitaria Los Libertadores, Bogota, Colombia, 2018. Available online: http://hdl.handle.net/11371/2935 (accessed on 11 June 2023).
  38. Fernández, C. La Unión Europea, las redes transeuropeas y la necesidad de un corredor central. Cuad. Estrateg. 2022, 210, 9–30. Available online: https://www.ieee.es/Galerias/fichero/cuadernos/CE_210/Cap_1_Union.pdf (accessed on 15 June 2023).
  39. Salomón, A.L. Caminos transversales por el interior de la provincia de Buenos Aires: El Plan Vial 1959–1963. Rev. Transp. Territ. 2019, 21, 189–211. [Google Scholar] [CrossRef]
Figure 1. Post-investment cost evolution—Ratio (soles/km).
Sustainability 15 16588 g001
Figure 2. Characterization of post-investment costs by—Ratio (soles/km).
Sustainability 15 16588 g002
Figure 3. Characterization of post-investment costs by supervision.
Sustainability 15 16588 g003
Figure 4. Characterization of post-investment costs.
Sustainability 15 16588 g004
Figure 5. Total monetary poverty in La Libertad for measuring economic development. Note: Information obtained from CEPPLAN-GRLL, based on INEI-ENAHO data.
Sustainability 15 16588 g005
Figure 6. Economic development according to total monetary poverty in the provinces of La Libertad, 2013 and 2018.
Sustainability 15 16588 g006
Figure 7. Extreme monetary poverty in La Libertad in order to measure economic development. Note: Information obtained from CEPPLAN-GRLL, based on INEI-ENAHO data.
Sustainability 15 16588 g007
Figure 8. Percentage of households with access to 4 basic services in La Libertad for measuring economic development. Note: Information obtained from CEPPLAN-GRLL, based on INEI-ENAHO data.
Sustainability 15 16588 g008
Figure 9. Percentage of households with at least one unsatisfied basic need in La Libertad to measure economic development.
Sustainability 15 16588 g009
Table 1. Post-investment cost in La Libertad from 2015 to 2022—Ratio (soles/km).
YearAmountkmExecution Cost (S/.)Supervision Cost (S/.)Total Cost (S/.)Total Cost (S/.)/km
2015125.122,444,334.2980,387.362,524,721.65100,506.44
2016248.824,189,573.37140,284.684,329,858.0588,690.25
2017387.2413,300,722.81564,306.9513,865,029.76158,929.73
2018130.296,084,385.73276,789.456,361,175.18209,988.29
2019126.972,844,222.68116,470.002,960,692.68109,777.26
202019627.409,873,702.971,004,430.8610,878,133.8317,338.52
2021393.77854,638.1947,700.00902,338.199622.89
202213370.4940,655,933.723,084,480.4143,740,414.13118,060.67
Total431310.1080,247,513.765,314,849.7185,562,363.47101,614.25
km: Kilometers of road.
Table 2. Summary statistics for the execution, supervision, and total cost of road construction projects in La Libertad for the years 2015–2022.
Execution Cost (S/.)Supervision Cost (S/.)Total Cost (S/.)
Minimum854,638.1947,700.00902,338.19
Maximum40,655,933.723,084,480.4143,740,414.13
Mean10,030,939.22664,356.2110,695,295.43
Sd.12,205,087.59963,650.9013,152,225.45
Cv (%)82.2%68.9%81.3%
Sd: Standard deviation; Cv (%): Coefficient of variation (percentage).
Table 3. Post-investment cost in La Libertad for the years 2015 and 2022—Ratio (soles/km).
ProvinceAmountkmExecution Cost (S/.)Supervision Cost (S/.)Total Cost (S/.)Total Cost (S/.)/km
Ascope6103.565,517,013.03416,778.605,933,791.6357,300.87
Bolívar283.925,304,195.86205,763.655,509,959.5165,658.85
Gran Chimú4103.657,941,998.09323,343.068,265,341.1579,746.65
Julcán3137.289,712,463.49851,190.2010,563,653.6976,949.69
Otuzco6208.875,230,355.73233,539.425,463,895.1526,159.94
Pataz9307.9417,424,426.811,059,066.0018,483,492.8160,023.23
Sánchez Carrión247.28670,442.4574,121.32744,563.7715,749.30
Santiago de Chuco5169.2016,875,383.921,388,489.4018,263,873.32107,940.60
Trujillo225.872,877,127.19164,210.703,041,337.89117,585.07
Virú4122.568,694,107.21598,347.369,292,454.5775,822.73
Total431310.1080,247,513.765,314,849.7185,562,363.4768,293.69
km: Kilometers of road.
Table 4. Economic development in La Libertad between 2015 and 2022.
YearTotal Monetary Poverty (%)Extreme Monetary Poverty (%)Homes with Access to 4 Basic Services (%)Population with at Least One NBI (%)
201525.906.3070.3014.74
201624.504.4072.0013.59
201723.504.3073.3013.42
201820.803.2075.5010.65
201924.706.3076.7010.14
202031.906.2078.3010.56
202126.805.8077.9010.73
202228.404.4078.7010.68 a
a valor estimado con disminución de 0.5 punto porcentual (INEI, 2022).
Table 5. Economic development and post-investment costs of La Libertad between 2015 and 2022.
YearPost-Investment Cost/kmExtreme Monetary Poverty (Proportion)Basic Services (Proportion)Monetary Poverty (Proportion)NBI (Proportion)
2015100,506.440.0630.7030.2590.1474
201688,690.250.0440.7200.2450.1359
2017158,929.730.0430.7330.2350.1342
2018209,988.290.0320.7550.2080.1065
2019109,777.260.0630.7670.2470.1014
202017,338.520.0620.7830.3190.1056
20219622.890.0580.7790.2680.1073
2022118,060.670.0440.7870.2840.1068
Table 6. Relationship between economic development and post-investment costs of Freedom between 2015 and 2022.
Dimensions of Economic DevelopmentShapiro-Wilk Test
(p-Value)
Correlation TestCoefficientp-Value
Total monetary poverty0.943Pearson−0.7880.02
Extreme monetary poverty0.117Pearson−0.7290.04
Access to 4 basic services0.376Pearson−0.3200.44
UBN (at least 1)0.026Spearman−0.1190.78
Disclaimer/Publisher’s Note: The statements, opinions and data contained in all publications are solely those of the individual author(s) and contributor(s) and not of MDPI and/or the editor(s). MDPI and/or the editor(s) disclaim responsibility for any injury to people or property resulting from any ideas, methods, instructions or products referred to in the content.

