Article

Path Planning of an Electric Vehicle for Logistics Distribution Considering Carbon Emissions and Green Power Trading

1
School of Mechanical Engineering and Rail Transit, Changzhou University, Changzhou 213164, China
2
Jiangsu Province Engineering Research Center of High-Level Energy and Power Equipment, Changzhou University, Changzhou 213164, China
3
Changzhou Xingyu Automotive Lighting Systems Co., Ltd., Changzhou 213022, China
*
Author to whom correspondence should be addressed.
Sustainability 2023, 15(22), 16045; https://doi.org/10.3390/su152216045
Submission received: 28 September 2023 / Revised: 8 November 2023 / Accepted: 15 November 2023 / Published: 17 November 2023

Abstract

:
As environmental awareness continues to grow and government policies provide incentives, electric vehicles (EVs) are becoming more widely used in logistics distribution. Considering green power trading and carbon emissions, this paper addresses the green vehicle routing problem (GVRP) and constructs an electric vehicle path model with time windows to minimize the total cost. To solve the model, a hybrid adaptive genetic algorithm (HAGA) is proposed. An improved nearest-neighbor algorithm is adopted to improve the quality of the initial population, and the adaptive crossover and mutation operators are introduced to achieve the better solution. In addition, based on the Schneider case, HAGA is used to solve the models with and without considering green power trading separately, and the results show that considering green power trading can reduce the total cost by 3.22% and carbon emissions by 23.38 kg. Finally, the experimental simulations further prove that with the increase in case size, HAGA can effectively reduce total cost. And it is beneficial for the popularization of electric vehicles in logistics distribution.

1. Introduction

Since the Industrial Revolution, due to increasingly intensive human activities, atmospheric CO2 concentration has increased by 50%, from 280 ppm in 1750 to 419 ppm in 2022. In 2019, the International Energy Agency (IEA) reported that since 2010, the power generation/heating and transportation sectors accounted for about two-thirds of the total CO2 emissions [1]. The huge increase in CO2 emissions has not only caused global climate change but also posed significant challenges to human life and production. To address this issue, it is urgent to develop a low-carbon economy that can promote sustainable development. The fundamental principle of a low-carbon economy is to lower energy consumption and carbon emissions while achieving economic growth [2].
The logistics industry is a vital component of economic activities and plays a crucial role in realizing a low-carbon economy. As a major energy consumption industry, the logistics industry generates a large amount of CO2 emissions during its operation, and it has caused severe environmental pollution problems. Thus, low-carbon logistics is the key to establishing a sustainable low-carbon economic system. In recent years, the rapid development of the e-commerce industry has further driven the growth of the logistics industry, requiring more vehicles for logistics services. The vehicle routing problem (VRP) is worth studying as it helps to minimize the transportation costs of logistics enterprises [3]. With the increasing awareness of environmental protection, the carbon emissions caused by fuel vehicles have also attracted more and more attention. Therefore, some researchers have extended this problem to the green vehicle routing problem (GVRP) to achieve a reduction in carbon emissions while reducing transportation costs. Costa et al. studied the GVRP to minimize CO2 emissions and solved the problem by an improved genetic algorithm (GA) [4]. Koç et al. studied the joint impact of location, fleet composition, and routing on emissions in a city logistics context, with the goal of minimizing the total depot, vehicle, and routing cost. Three speed zones were divided in city and a new adaptive large search algorithm was used to solve the problem [5]. Zhou et al. established the time-dependent green location-routing problem model considering the carbon cap-and-trade emission policy to minimize the total cost which consisted of fuel consumption, carbon emissions, construction cost of distribution centers, vehicle use, driving labor, and dispatch of vehicles, and solved the model through a two-stage hybrid heuristic algorithm [6].
However, governments have begun to restrict the sale of fuel vehicles due to the increasing demand for reducing carbon emissions and relieving the adverse effects of traffic on the environment [7]. For the advantages of low emissions and low noise, electric vehicles (EVs) are gradually replacing fuel vehicles as the mainstream for logistics services, providing an important means to achieve low-carbon logistics [8,9]. But there are some challenges when EVs participate in logistics services: (1) Compared to fuel vehicles, EVs have a shorter driving range. (2) EVs require charging to ensure the completion of long-distance logistics services. (3) EVs require more time to charge than the refueling time of fuel vehicles [10,11]. Based on the above points, many scholars had conducted research on electric vehicle routing problem (EVRP) to provide groundbreaking solutions for achieving low-carbon logistics and sustainable development. Conrad et al. assumed that charging time was constant, and it allowed EVs to be charged at selected customer locations when the state-of-charge (SoC) was low during logistics distribution [12]. However, the charging time is not a fixed value, and the delivery of goods must be within a time frame acceptable to the customer. Schneider et al. introduced an electric vehicle routing problem with time windows (EVRPTW), where the charging time depended on the SoC when an electric vehicle (EV) arrived at the station, and modified Solomon’s data sets for this purpose [13]. Wang et al. proposed a tailored hybrid heuristic that combined a large neighborhood search algorithm with a set partitioning component to solve the electric fleet size and mixed vehicle routing problem with time windows and recharging stations [14]. Although EVs themselves do not produce any harmful gases, carbon emissions will be indirectly caused when charging [15,16]. Zhang et al. studied the EVRP with the objective function of minimizing energy consumption and estimated the indirect carbon emissions from the EV based on the amount of battery energy used [17]. Li et al. proposed an optimization model of EVRP in view of the sharing economy considering carbon tax and time-of-use electricity price to minimize the total cost consisting of the operation, penalty, queuing (waiting at the charging stations), electricity, and environment costs [18]. Foroutan et al. proposed the green vehicle routing and scheduling problem with a heterogeneous fleet, including reverse logistics in the form of collecting returned goods along with weighted earliness and tardiness costs, to establish a trade-off between operational and environmental costs and to minimize both simultaneously [19]. Nolz et al. considered a consistent EVRP for the delivery of parcels with EVs where EVs returned to the depot to charge with a limited number of charging piles during the lunch break. It aimed to reduce carbon emissions and implement innovative and efficient last-mile logistics services [20]. Based on the hybrid electric vehicle routing problem, Seyfi et al. proposed a multimode hybrid electric vehicle routing problem where different drive modes had different costs and travel times on each arc of a given distribution network and established a mixed-integer linear model to minimize the total cost of the distances traveled at different modes. A method combining variable neighborhood search and mathematical programming was proposed to solve the problem [21].
As a new concept proposed in recent years, green power trading can not only be used to meet the demand of power users for purchasing and consuming green power, but also provide corresponding green power consumption certification [22]. Previous studies did not involve green power trading, but it helps to promote the use of renewable energy and reduce carbon emissions, and makes important contributions to achieving sustainable economic, social, and environmental development goals. Based on considering carbon emissions, this paper further introduces the green power trading mechanism to mitigate the negative impacts of EVs on the environment, and minimizes the total cost of the EV logistics distribution by rationally planning the distribution path with time windows. The main contributions of this paper are as follows:
  • When considering the environmental cost, the green power trading is introduced, and an objective function of the total minimum cost consisting of fixed cost, driving cost, charging cost, penalty cost, and environmental cost is proposed.
  • A hybrid adaptive genetic algorithm (HAGA) is designed to solve this function. During the initialization, an improved nearest-neighbor algorithm based on minimum cost (NNC) is proposed to improve the quality of the initial population. Meanwhile, adaptive crossover and mutation operators are introduced to achieve the better solution.
  • Based on the Schneider case, the experiment simulations are carried out, and the results show that HAGA can effectively solve the path optimization problem of EVs and reduce the total cost by 22.27%.
The remaining sections of this paper are organized as follows. Section 2 illustrates the assumptions and proposes the GVRP model. Section 3 describes the HAGA. Section 4 presents the detailed experimental case and settings along with the analysis of results. Section 5 concludes the paper and gives future directions for future research.

2. Model Construction

2.1. Problem Assumptions

This paper studies the GVRP, aiming to find the optimal solution that comprehensively considers economic and environmental benefits. EVs depart from the distribution center and provide logistics services to customers within the designated time windows. If the SoC is not enough to support EV to the next customer, the EV shall go to the nearest charging station for charging. After completing the distribution task, all EVs must be returned to the distribution center in a timely manner. The following assumptions are considered in the construction of the mathematical model.
  • All EVs used for distribution task are of the same type and fully charged when leaving the distribution center.
  • Only one EV is arranged for each distribution route to provide services to customers on its route. And each customer can only be served by one EV at most.
  • The power consumption of the EV is linearly related to its driving distance.
  • EV is fully charged with fast-charging mode at the charging station, and the charging capacity is linearly related to the charging time.
  • The speed of the EV is constant.
  • The green power considered in this paper only includes wind and photovoltaic generation.

2.2. Notations

According to the above assumption, the related notations are shown in Table 1.

2.3. EVRPTW Model

The objective function based on GVRP is to minimize the total cost. The total cost includes fixed cost, driving cost, charging cost, penalty cost, and environmental cost.
(1)
Fixed cost
The fixed cost C f mainly consists of the start-up cost and labor cost of EVs, and it can be expressed as:
C f = c f k K y k
(2)
Driving cost
The driving cost C d is linearly related to the driving distance, and it can be expressed as:
C d = c d k K i N j N d i j x i j k
(3)
Charging cost
The charging cost C r depends on the charging capacity of EVs at the charging station. The more the charging capacity, the greater the charging cost.
C r = c r k K i F B i k θ i k
(4)
Penalty cost
The penalty cost C t is incurred when a product fails to be delivered within the time windows designated by the customers, and it can be expressed as:
C t = e p u i V max e i t i k . a , 0 + l p u i V max t i k . a l i , 0 , k K
(5)
Environmental cost
The environmental cost C e consists of carbon emission cost C c and penalty cost C g of green power trading. Carbon emission cost is caused by the indirect carbon emissions by EVs when charging. As power purchasing users, EVs also need to fulfill the green power quota task, and the unfinished part of the quota needs to pay a certain fine. The comprehensive consideration of carbon emissions and green power trading has a significant impact on the achievement of low-carbon logistics, and it is beneficial to reduce environmental pollution and promote the widespread use of renewable energy.
C e = C c + C g
C c = c c k K i F μ η B i k θ i k
C g = c f g ε γ k K i F B i k θ i k
Then, the objective function F can be expressed as:
min F = C f + C d + C r + C t + C e
s.t.
i V , i j x i j k = 1 , j V , k K
i N , i j x i j k = i N , i j x j i k , j N , k K
i N x o i k = 1 , k K
j N x j o k = 1 , k K
i V , i j p i x i j k W , j V , k K
0 w j k . a w i k . a p i x i j k + W 1 x i j k , i , j N , i j , k K
t w i = max 0 , e i t i k . a , i N , k K
t r i = B i k r , i F , k K
t i j = d i j s , i , j N , i j
t i k . d = t i k . a + t w i + t s i + t r i , i V F , k K
t j k . a = i N j N , i j t i k . d + t i j x i j k , k K
0 < t k . e n d t max , k K
0 q j k Q δ d i j x i j k , i O F , j N , i j , k K
0 q j k q i k δ d i j x i j k + Q 1 x i j k , i V , j N , i j , k K
x i j k 0 , 1 , i , j N , i j , k K
y k 0 , 1 , k K
θ i k 0 , 1 , i F , k K
Constraint (9) ensures that each customer node must be visited exactly once. Constraint (10) guarantees that the routing traffic of each node is conserved. Constraints (11) and (12) ensure that each EV leaves and returns to the distribution center. Constraint (13) ensures that the loading capacity of the EV during the distribution task cannot exceed its maximum capacity. Constraint (14) ensures that when the EV arrives at a node, it must unload the goods before going to the next node. Constraint (15) calculates the waiting time for the EV to arrive at the node in advance. Constraint (16) calculates the charging time of the EV at the charging station. Constraint (17) calculates the driving time between two nodes. Constraint (18) indicates that the time to leave the node consists of arrival time, waiting time, service time, and charging time. Constraint (19) indicates that the time the EV reaches the next node is composed of the time it leaves the previous node and the driving time between the two nodes. Constraint (20) ensures that the working time of the EV does not exceed the maximum working hours in a day. Constraint (21) and (22) indicate the power consumption relationship between two nodes, and that the EV is fully charged when departing from distribution center and charging station. Constraints (23), (24), and (25) are 0–1 decision variables.

3. Model Solution

GVRP is an NP-hard problem, and solved by many modern heuristic optimization algorithms, such as neighborhood search, particle swarm optimization, GA, etc. Among these algorithms, GA is proved to be an effective and powerful algorithm [
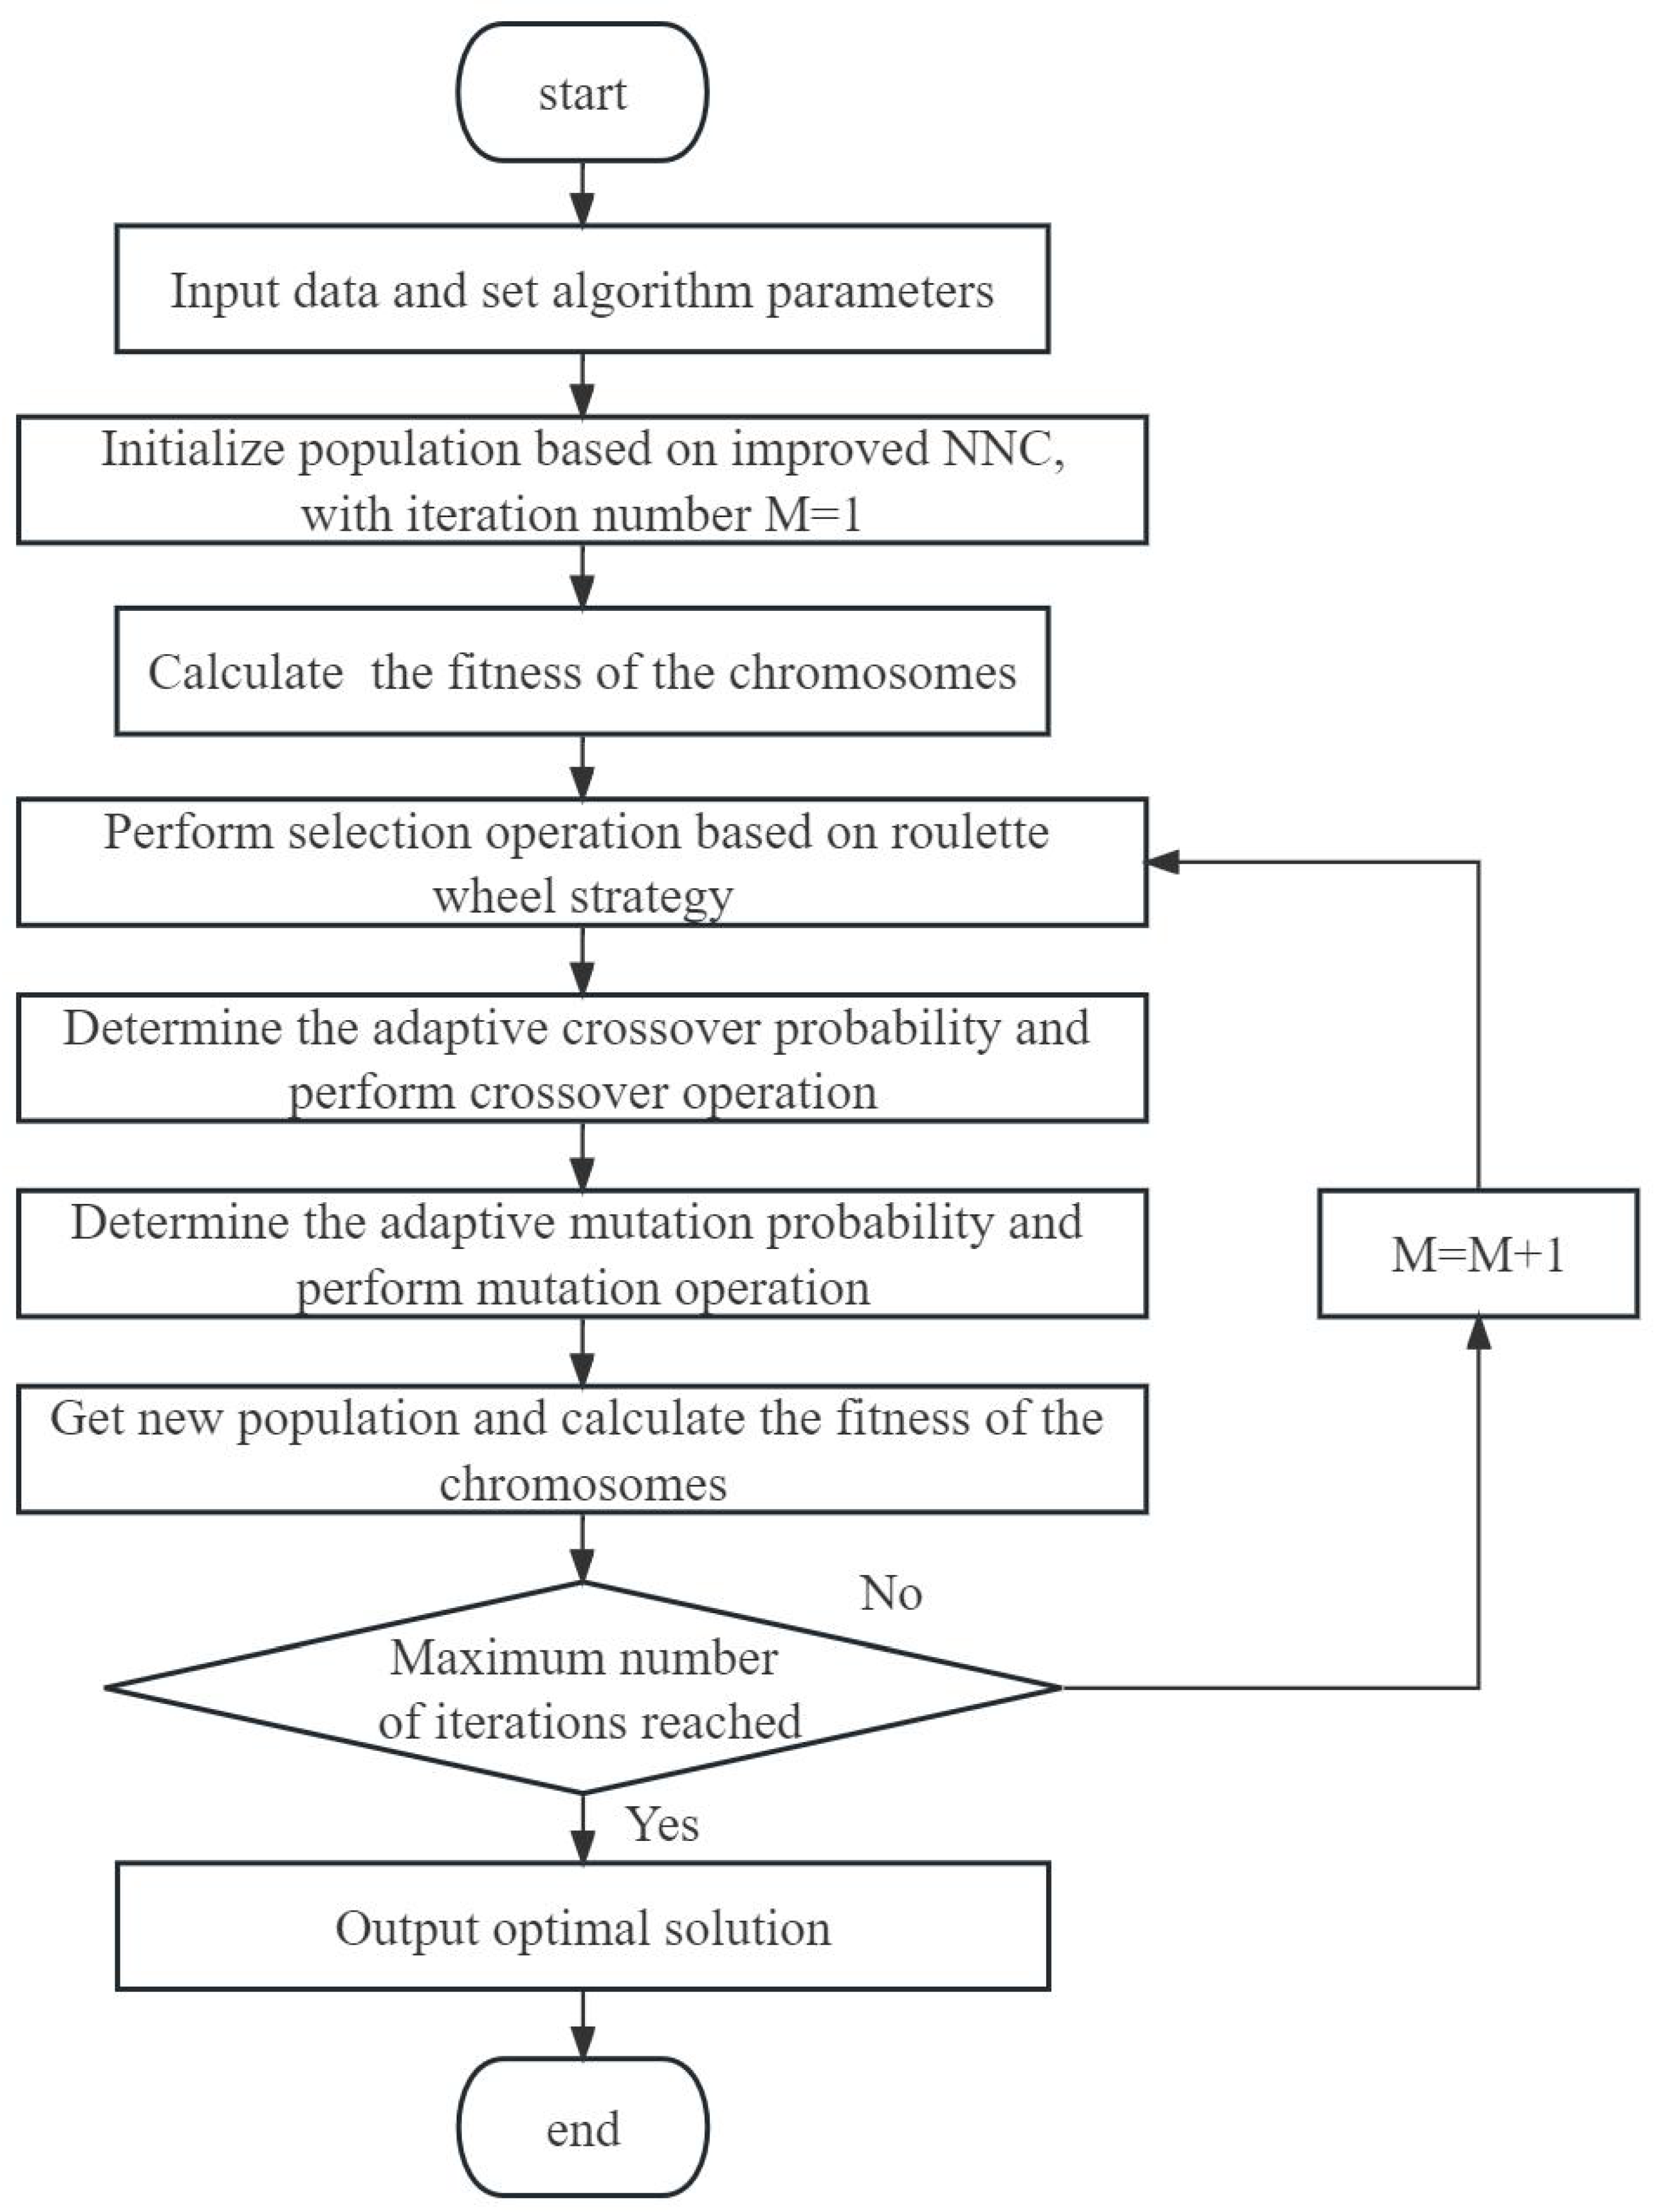
23]. The object of GA is the population, and each individual in the population is called a chromosome, which consists of genes and represents a solution to the problem according to a certain coding. Selection, crossover, and mutation operations are applied to the population to improve the fitness of population, so as to achieve the purpose of reaching the optimum. However, the traditional GA easily falls into local optimum; a HAGA is proposed to solve GVRP. An improved NNC is adopted to obtain a high-quality initial population, and adaptive crossover and mutation operators are used to achieve better global search ability. The specific flow chart is shown in Figure 1.

3.1. Solution Coding

To ensure that each customer can only be served by one EV, natural number encoding is adopted to encode the chromosomes with the staining length of v + k 1 before initializing the population, where v is the number of customers and k represents the number of EVs available [24]. For example, if there are currently three EVs providing distribution services to 10 customers, numbers 1 to 10 represent customers. Numbers 11 and 12 are only used to divide the chromosome and have no special significance. There are three charging stations, numbered 13 to 15. After encoding, the chromosome is represented as (4, 7, 3, 11, 5, 8, 6, 2, 12, 10, 1, 9), with three distribution paths. It is worth noting that in the proposed encoding, the chromosomes only represent customers information and the orders of access paths, and do not include the charging stations. As a result, it can prevent charging stations form participating in crossover and mutation operations. After each generation of population completes the update operation, distribution center and charging stations are inserted into the decoded chromosomes for calculating the fitness. The decoding process is shown in Figure 2.

3.2. Initialization of the Population

NNC is a construction algorithm, which can produce a better feasible solution and was first proposed by Solomon and applied to VRP [25,26]. An improved NNC is proposed to obtain the high-quality initial population, and its specific steps are as follows:
Step1: Dispatch the first EV from the available EVs at the start of logistics distribution and randomly visit the first customer node.
Step2: The customer node that is closest to the last visited customer node and has not been visited is selected and inserted into the current path.
Step3: Repeat Step2 until the maximum capacity limit of the current EV is reached and save the current path. Then, dispatch a new EV from the distribution center until all customer nodes have been accessed.
The distance d c i j between two customer nodes can be expressed by time, and it consists of three parts: (1) h i j , which is the time to move from the previous customer node to the next customer node, which includes the driving time and the charging time in the midway; (2)  T i j , which is the time difference between the start service time of the next customer node and the completion service time of the previous customer node; (3)  u i , which is the time difference between the latest service time and the start service time of the customer node. Then, d c i j can be expressed as:
d c ij = λ 1 h i j + λ 2 T i j + λ 3 u i
where λ 1 , λ 2 , λ 3 stand for the weights and λ 1 + λ 2 + λ 3 = 1, λ 1 > 0, λ 2 > 0, λ 3 > 0.

3.3. Fitness Assessment

To calculate the fitness, the charging stations need to be inserted into the initial path. If the SoC of an EV at a customer node on the path is less than 20% of its maximum SoC, the EV needs to drive to the nearest charging station for charging. Then the fitness function can be expressed as:
f i t n e s s = 1 Z
Z = F + F 1 + F 2
F 1 = M 1 k K i V j V , i j max p i x i j k W , 0
F 2 = M 2 k K max t k . e n d t max , 0
where the fitness function is the reciprocal of function Z. The total cost F is calculated through (8). F 1 limits that the total customer load demands of EVs do not exceed the maximum capacity. F 2 limits that the time for the EV to return to the distribution center after the distribution task cannot exceed its maximum working time. M 1 and M 2 are two very large numbers, such as M 1 = M 2 = 10 5 .

3.4. Population Regeneration

(1)
Selection
To ensure the better chromosomes selected with higher probability and eliminate the inferior chromosomes, the roulette wheel selection is adopted for selection operation.
(2)
Crossover and mutation
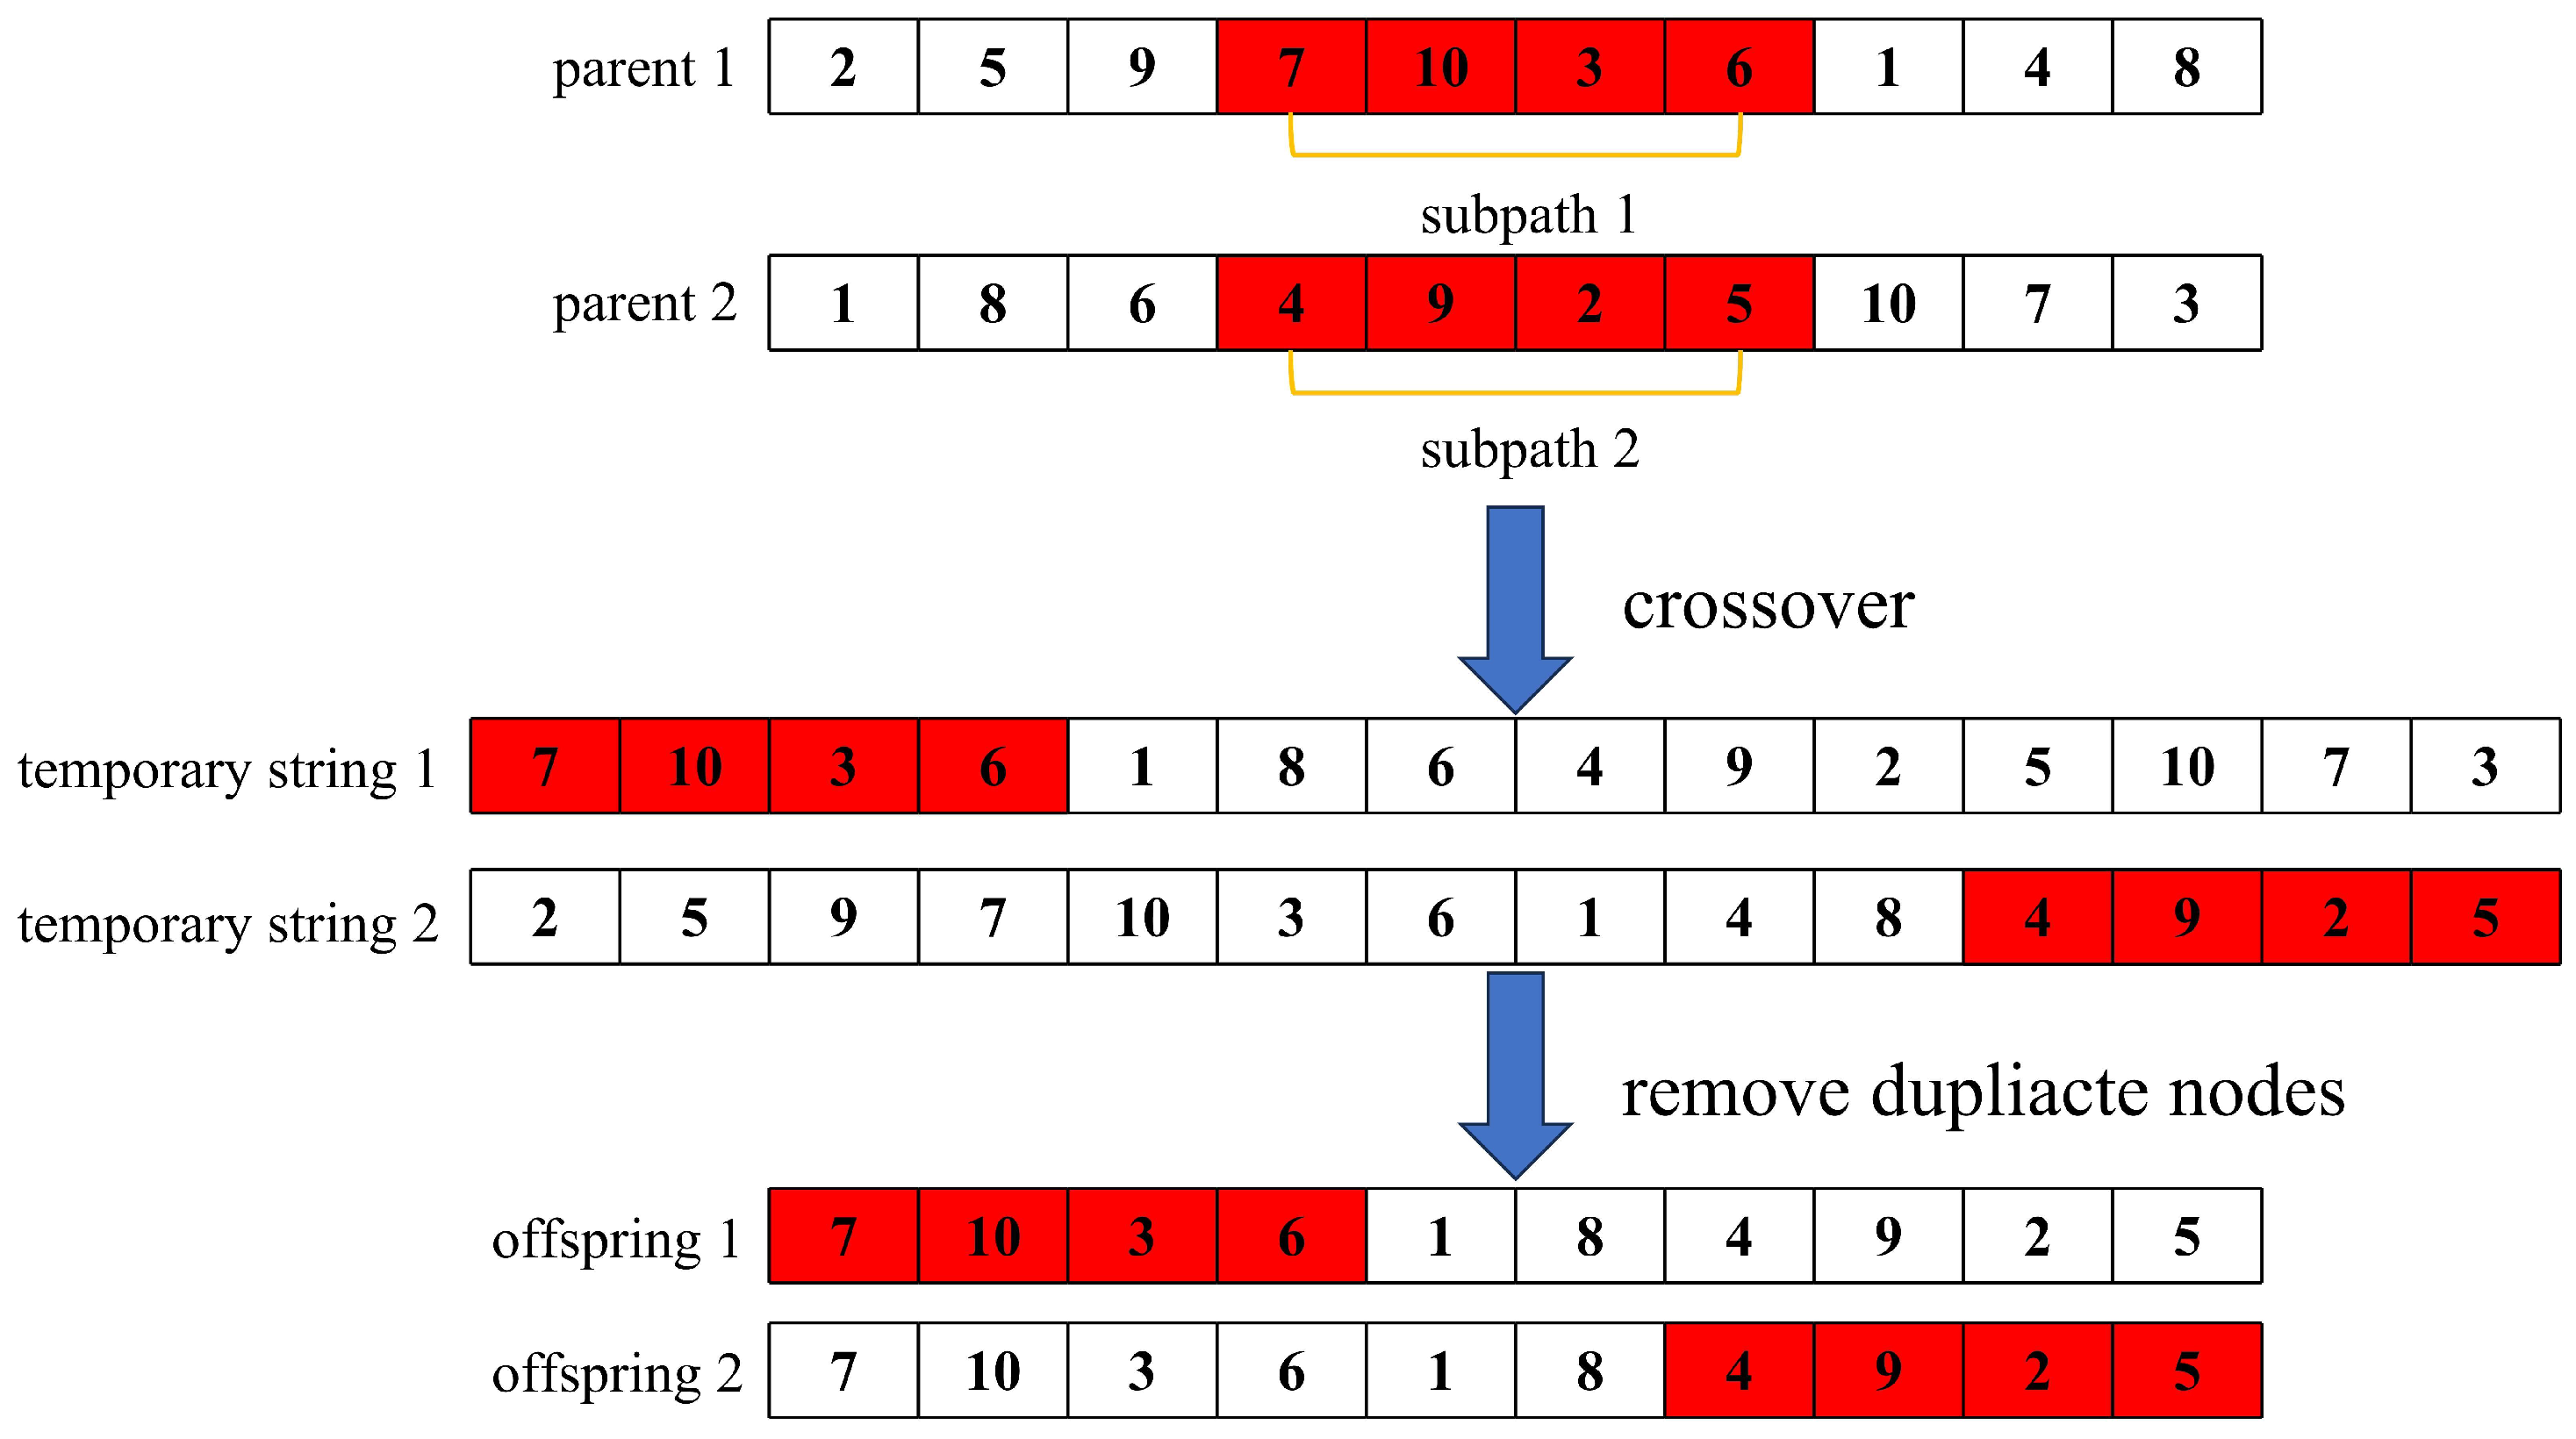
To obtain a better solution, this paper adopts an improved-order crossover operation and a two-point interchange mutation operation. The specific steps of the improved-order crossover operation are as follows: Firstly, determine the parent 1 and parent 2 that need to undergo the crossover operation, and randomly select two gene crossover points. The region between the two crossover points is called the cross subpath. Secondly, copy the cross subpath 1 in parent 1 and place it in the front of parent 2. Similarly, copy the cross subpath 2 in parent 2 and place it at the back of parent 1. Finally, delete the duplicated genes in parent 1 and parent 2, respectively, to form two new crossover offsprings [27], as shown in Figure 3.
In traditional GA, both the crossover probability and mutation probability are constants, which can cause the algorithm to converge slowly at the beginning of the iteration and rapidly at the end, resulting in local optimum. To address this issue, adaptive crossover and mutation operators are adopted. The adaptive P c and P m are as follows:
P c = P c 1 P c 1 P c 2 f c f a v g f max f a v g , f c f a v g P c 1 , f c < f a v g
P m = P m 1 P m 1 P m 2 f max f m f max f a v g , f m f a v g P m 1 , f m < f a v g
where P c 1 , P c 2 , P m 1 , and P m 2 are values in [0, 1]; f m a x is the maximal fitness in the population; f a v g is the average fitness in the population; f c is the larger fitness of the two crossover chromosomes; f m is the fitness of the mutation chromosome. After the improvement, the P c and P m of the chromosomes with larger fitness become smaller, while the chromosomes with smaller fitness are the opposite, so the high-quality chromosomes can be inherited, and the global search ability of the algorithm is improved.

4. Results and Analysis

4.1. Results

The data set rc101_21 modified by Schneider based on the famous Solomon data set is adopted, and customer nodes are randomly and uniformly distributed [13]. According to [16], the customer demand, service time, and expected time window are randomly selected from [0, 200], [0.1, 0.5], and [0, 7], respectively. The specific data are shown in Table 2.
In Table 2, node “0” is the distribution center; nodes “1–40” are the 40 customer nodes, and nodes “41–45” stand for the five charging stations. The specific locations of all nodes are shown in Figure 4.
The proportions of thermal power generation and wind and photovoltaic generation come from the National Bureau of Statistics and the National Energy Administration, respectively. The CO2 emission coefficient of thermal power generation is determined according to the data from the National Climate Center, and the electricity price is taken from the industrial and commercial electricity price released by the State Grid Jiangsu Electric Power Co., Ltd. in May 2023. The green power quota coefficient is sourced from the notification issued by the National Development and Reform Commission and the National Energy Administration regarding the responsibility weighting and related matters for renewable energy power consumption in 2023. The rated power data of fast charging stations is sourced from State Grid Corporation of China. The maximum working hours of the EV in a day come from [13]. The number of EVs available in the distribution center is set 5; fixed cost of the EV, driving cost per unit mileage, penalty cost of unit time, and the relevant data of the EV come from [16]. Unit penalty price of green power is from [28]. Specific model parameters are shown in Table 3.
Based on a large number of experiments, the HAGA is adopted to solve the model with the population number = 200, the iteration number = 500, λ 1 = 0.7, λ 2 = 0.2, λ 3 = 0.1, P c 1 = 0.9, P c 2 = 0.6, P m 1 = 0.2 and P m 2 = 0.009. The HAGA is programmed using MATLAB R2016b and executed on a computer equipped with an Intel Core i7-8750H running at 2.2 GHz and 8 GB of RAM. The models with and without considering green power trading are solved separately. The results are shown in Figure 5 and Table 4.
In Figure 5, there are five EVs for logistics distribution, and every EV is charged once during its distribution. In Table 4, the total cost F of the model considering green power trading is CNY 2126.63, which is CNY 70.7 lower than the total cost without considering green power. The carbon emission considering green power trading is 51.88 kg, lower than the carbon emission, which is 75.26 kg without considering green power trading. The environmental cost C e , composed of carbon emission cost and green power trading penalty cost, is CNY 31.33, while the environmental cost without considering green power trading is CNY 37.63. It is obvious that using EVs for logistics distribution based on green power trading is an effective measure to reduce carbon emission and total cost.

4.2. Algorithm Performance Analysis

(1)
Impact of initial population
To address the influence of the initial population, the initial population is generated by random method and improved NNC. Without considering adaptive crossover and mutation operators, the solution results of the model after 500 iterations are shown in Table 5.
In Table 5, NNC-GA can reduce the total cost F by 31.68%, mainly reducing penalty costs, and greatly improving customer satisfaction. The computation time of NNC-GA is reduced by 12.86% compared to GA.
(2)
Impact of adaptive crossover and mutation operators
Based on the random initial population and the initial population generated by the improved NNC, the experiment simulations are conducted with and without the adaptive operators, respectively. And the results are shown in Table 6.
In Table 6, AGA can efficiently reduce the total cost F by 22.55%. Based on HAGA, the total cost F can be reduced by 11.88% compared to NNC-GA. The total cost F based on HAGA is minimum (2126.63 CNY) and is reduced by 22.27% compared to AGA. The computation time of HAGA increases by 93.42% compared to NNC-GA.
Based on the cases with 10, 20, 30 and 40 customers, HAGA and NNC-GA are used to solve the models with and without considering green power trading. The results are shown in Table 7. For better evaluating the results, we defined the cost saving, which is calculated through (33).
Cost   saving   ( % ) = F No F Yes F No × 100 %
where F N o is the total cost without considering green power trading, and F Y e s is the toal cost with considering green power trading.
In Table 7, when the number of customers is 10, the results of both NNC-GA and HAGA are the same. As the number of customers increases, HAGA can reduce more total cost compared to NNC-GA. The introduction of green power trading also further reduces the total cost and carbon emissions, especially when the number of customers is 40, the total cost is saved by 3.22% and the carbon emission is reduced by 23.38 kg.
Moreover, the optimal solution with the total minimum cost is used to compare the performances before and after the improvement of the algorithm, as shown in Figure 6.
In Figure 6, the HAGA converges in the 489th generation, and the NNC-GA converges in the 378th generation. Although the HAGA does not perform as well as NNC-GA in terms of convergence performance, the result is better. The improved NNC ensures the quality of the initial population and is beneficial for accelerating the convergence speed of the algorithm. Adaptive operators are introduced in the crossover and mutation to allow the low-quality chromosomes to undergo crossover and mutation operations with a greater probability. Then the population would evolve better, and it can enable the algorithm to converge to a better solution.

5. Conclusions

With the increasingly serious environmental pollution problem and the encouragement of government policies, it is an inevitable trend for logistics enterprises to adopt EVs. In addition to the positive impact on the environment, EVs have also made significant contributions to the economy and society. EVs are an effective means to enhance the competitiveness of logistics enterprises and promote sustainable economic development. Aiming to reduce environmental pollution while minimizing logistics costs for enterprises and achieving optimization of logistics resource allocation, this paper introduces the green power trading and studies an EV logistics distribution path optimization model with time windows. The model aims to minimize the total cost, which includes fixed cost, driving cost, charging cost, penalty cost, and environmental cost. Furthermore, HAGA is proposed to solve this issue. The improved NNC is proposed to obtain the high-quality initial population, and the adaptive operators are introduced in the crossover and mutation to achieve a better solution. HAGA overcomes the limitations of the traditional GA and ensures both population quality and convergence, thereby the optimization ability of the GA is improved. Based on the Schneider case, the experimental simulations are carried out and the results show that while customer demands are met, carbon emissions are also significantly reduced. The NNC-GA can reduce the total cost by 31.68% compared to the traditional GA. And the adaptive operators are effective at minimizing the total cost to CNY 2126.63. The experimental simulations based on different scale cases show that green power trading can effectively reduce total cost and carbon emissions.
This paper assumes that the power consumption and speed of EVs are constant, but in practice, these are variable and how to consider these factors is one goal of our future work. At the same time, the integration mechanism of green certificate and green power is only considered in this paper, while considering the distribution and usage of power throughout the whole region, the separation trading mechanism of green certificate and green power is necessary to be introduced, and it is another goal of our future work.

Author Contributions

Conceptualization, R.O. and H.Q.; methodology, R.O.; software, R.O.; validation, R.O.; formal analysis, R.O. and H.Q.; investigation, R.O. and Y.H.; writing—original draft preparation, R.O.; writing—review and editing, R.O.; visualization, H.Q.; supervision, H.Q. and Z.W.; resources, X.Z. All authors have read and agreed to the published version of the manuscript.

Funding

This research was funded by Soft Science Research of Changzhou City under the grant number [CR20232092] and Innovation & Entrepreneurship Training Program for College Students of Changzhou University under the grant number [202310292277B].

Institutional Review Board Statement

Not applicable.

Informed Consent Statement

Not applicable.

Data Availability Statement

The data presented in this study are not available due to privacy.

Conflicts of Interest

The authors declare no conflict of interest.

References

  1. Zhang, S.; Zhou, Z.; Luo, R.; Zhao, R.; Xiao, Y.; Xu, Y. A low-carbon, fixed-tour scheduling problem with time windows in a time-dependent traffic environment. Int. J. Prod. Res. 2022, 61, 6177–6196. [Google Scholar] [CrossRef]
  2. He, Z.; Chen, P.; Liu, H.; Guo, Z. Performance measurement system and strategies for developing low-carbon logistics: A case study in China. J. Clean. Prod. 2017, 156, 395–405. [Google Scholar] [CrossRef]
  3. Yu, V.F.; Jodiawan, P.; Gunawan, A. An Adaptive Large Neighborhood Search for the green mixed fleet vehicle routing problem with realistic energy consumption and partial recharges. Appl. Soft Comput. 2021, 105, 107251. [Google Scholar] [CrossRef]
  4. de Oliveira da Costa, P.R.; Mauceri, S.; Carroll, P.; Pallonetto, F. A Genetic Algorithm for a Green Vehicle Routing Problem. Electron. Notes Discret. Math. 2018, 64, 65–74. [Google Scholar] [CrossRef]
  5. Koç, C.; Bektas, T.; Jabali, O.; Laporte, G. The impact of depot location, fleet composition and routing on emissions in city logistics. Transp. Res. B-Meth. 2016, 84, 81–102. [Google Scholar] [CrossRef]
  6. Zhou, Y.; Liu, C.; Xu, Q. Time-Dependent Green Location-Routing Problem under Carbon Cap-and-Trade Policy. Transp. Res. Rec. 2023, 2677, 1135–1150. [Google Scholar] [CrossRef]
  7. Keskin, M.; Catay, B.; Laporte, G. A simulation-based heuristic for the electric vehicle routing problem with time windows and stochastic waiting times at recharging stations. Comput. Oper. Res. 2021, 125, 105060. [Google Scholar] [CrossRef]
  8. Hiermann, G.; Puchinger, J.; Ropke, S.; Hartl, R.F. The Electric Fleet Size and Mix Vehicle Routing Problem with Time Windows and Recharging Stations. Eur. J. Oper. Res. 2016, 252, 995–1018. [Google Scholar] [CrossRef]
  9. Moon, S.; Lee, D.J. An optimal electric vehicle investment model for consumers using total cost of ownership: A real option approach. Appl. Energy. 2019, 253, 113494. [Google Scholar] [CrossRef]
  10. Ding, N.; Yang, J.; Han, Z.; Hao, J. Electric-Vehicle Routing Planning Based on the Law of Electric Energy Consumption. Mathematics 2022, 10, 3099. [Google Scholar] [CrossRef]
  11. Juvvala, R.; Sarmah, S.P. Evaluation of policy options supporting electric vehicles in city logistics: A case study. Sustain. Cities Soc. 2021, 74, 103209. [Google Scholar] [CrossRef]
  12. Conrad, R.G.; Figliozzi, M.A. The recharging vehicle routing problem. In Proceedings of the Industrial Engineering Research Conference (IERC), Reno, NV, USA, 21–25 May 2011. [Google Scholar]
  13. Schneider, M.; Stenger, A.; Goeke, D. The Electric Vehicle-Routing Problem with Time Windows and Recharging Stations. Transp. Sci. 2014, 48, 500–520. [Google Scholar] [CrossRef]
  14. Wang, W.; Zhao, J. Partial linear recharging strategy for the electric fleet size and mix vehicle routing problem with time windows and recharging stations. Eur. J. Oper. Res. 2023, 308, 929–948. [Google Scholar] [CrossRef]
  15. Liu, L.; Chen, C.; Zhao, Y.; Zhao, E. China’s carbon-emissions trading: Overview, challenges and future. Renew. Sustain. Energy Rev. 2015, 49, 254–266. [Google Scholar] [CrossRef]
  16. Liao, W.; Liu, L.; Fu, J. A Comparative Study on the Routing Problem of Electric and Fuel Vehicles Considering Carbon Trading. Int. J. Environ. Res. Public Health 2019, 16, 3120. [Google Scholar] [CrossRef]
  17. Zhang, S.; Gajpal, Y.; Appadoo, S.S.; Abdulkader, M.M.S. Electric vehicle routing problem with recharging stations for minimizing energy consumption. Int. J. Prod. Econ. 2018, 203, 404–413. [Google Scholar] [CrossRef]
  18. Li, Y.; Lim, M.K.; Tan, Y.; Lee, S.Y.; Tseng, M.L. Sharing economy to improve routing for urban logistics distribution using electric vehicles. Resour. Conserv. Recycl. 2020, 153, 104585. [Google Scholar] [CrossRef]
  19. Foroutan, R.A.; Rezaeian, J.; Mahdavi, I. Green vehicle routing and scheduling problem with heterogeneous fleet including reverse logistics in the form of collecting returned goods. Appl. Soft Comput. 2020, 94, 106462. [Google Scholar] [CrossRef]
  20. Nolz, P.C.; Absi, N.; Feillet, D.; Seragiotto, C. The consistent electric-Vehicle routing problem with backhauls and charging management. Eur. J. Oper. Res. 2022, 302, 700–716. [Google Scholar] [CrossRef]
  21. Seyfi, M.; Alinaghian, M.; Ghorbani, E.; Catay, B.; Sabbagh, M.S. Multi-mode hybrid electric vehicle routing problem. Transp. Res. Part E Logist. Transp. Rev. 2022, 166, 102882. [Google Scholar] [CrossRef]
  22. Tang, C.; Liu, X.; Zhang, C. Does China’s green power trading policy play a role?—Evidence from renewable energy generation enterprises. J. Environ. Manag. 2023, 345, 118775. [Google Scholar] [CrossRef]
  23. Zhu, Y.; Li, C.; Zhang, C.; Lee, K.Y. The NR-EGA for the EVRP Problem with the Electric Energy Consumption Model. Energies 2022, 15, 3681. [Google Scholar] [CrossRef]
  24. Cai, W.; Zhang, Y.; Huang, F.; Ma, C. Delivery routing problem of pure electric vehicle with multi-objective pick-up and delivery integration. PLoS ONE 2023, 18, e0281131. [Google Scholar] [CrossRef]
  25. Duan, Z.; Yang, D.; Wang, S.; Yang, Z.; Jiang, B. Improved ant colony optimization algorithm for time-dependent vehicle routing problem. Control Theory Appl. 2010, 27, 1557–1563. [Google Scholar]
  26. Solomon, M.M. Algorithms for the vehicle routing and scheduling problems with time window constrains. Oper. Res. 1987, 35, 254–265. [Google Scholar] [CrossRef]
  27. Zhang, J.; Li, C. Research on Dynamic Distribution Vehicle Route Optimization under the Influence of Carbon Emission. Chin. J. Manag. Sci. 2022, 30, 184–194. [Google Scholar]
  28. Chen, Y. Low-Carbon Scheduling of Virtual Power Plants Containing Large-Scale Electric Vehicles. Master’s Thesis, Southeast University, Nanjing, China, 2021. [Google Scholar]
Figure 1. Flow chart of hybrid adaptive genetic algorithm (HAGA).
Sustainability 15 16045 g001
Figure 2. Decoding process.
Sustainability 15 16045 g002
Figure 3. Improved-order crossover operation.
Sustainability 15 16045 g003
Figure 4. Location map of logistics distribution system.
Sustainability 15 16045 g004
Figure 5. Optimal path graph of green vehicle routing problem (GVRP) considering green power trading.
Sustainability 15 16045 g005
Figure 6. Total minimum cost of two algorithms.
Sustainability 15 16045 g006
Table 1. Notation definition.
NotationDefinition
Sets
ODistribution center
VSet of customers
FSet of charging stations
KSet of EVs
NSet of all nodes, N = O V F
Parameters
c f Fixed cost of EV
c d Driving cost per unit mileage
c r Electricity price
c c Carbon price
c f g Unit penalty price of green power
e p u Waiting cost per unit time
l p u Late penalty cost per unit time
[ e i , l i ]Time window acceptable to customer i, i V
μ Proportion of thermal power generation
η CO2 emission coefficient of thermal power generation
ε Green power quota coefficient of EV
γ Proportion of wind and photovoltaic power generation
QBattery capacity of EV
WMaximum capacity of EV
sSpeed of EV
δ Unit mileage power consumption of EV
rCharging rate of EV
d i j Distance from node i to node j, i , j N
p i Demand of customer i, i V
t s i Service time at node i, i N
t m a x Maximum working hours of EV in a day
t i j Driving time from node i to node j, i , j N
Decision variables
y k If EV k is used, y k is 1, otherwise y k is 0
x i j k If EV k moves from node i to node j, x i j k is 1, otherwise x i j k is 0
θ i k If EV k is charged at charging station i, θ i k is 1, otherwise θ i k is 0
B i k Charging capacity of vehicle k at charging station i, i F , k K
w i k . a Load of EV k arrives at node i, i N , k K
w i k . d Load of EV k departs from node i, i N , k K
t w i Waiting time at node i, i N
t r i Charging time at node i, i F
t i k . a Time EV k arrives at node i, i V F , k K
t i k . d Time EV k departs from node i, i V F , k K
t k . e n d Time for EV k to return to the distribution center, k K
q i k SoC of EV k at node i, i N , k K
Table 2. Logistics distribution information.
NodeCoordinateDemand (kg)Ready Time (h)Due Time (h)Service Time (h)
0(40, 50)00160
1(10, 20)15046.50.1
2(22, 75)500.52.50.5
3(22, 85)200130.5
4(57, 29)2002.550.1
5(25, 85)100010.5
6(8, 40)200010.5
7(5, 35)100140.2
8(44, 5)100120.3
9(42, 10)200250.1
10(8, 56)200240.5
11(88, 30)1001.54.50.3
12(38, 15)1001.530.4
13(72, 35)500.520.4
14(87, 30)150120.2
15(64, 42)100240.2
16(85, 35)100350.1
17(67, 85)10035.50.5
18(42, 5)100360.5
19(65, 82)1003.55.50.4
20(15, 75)100230.1
21(60, 85)1004.550.2
22(60, 80)50460.3
23(55, 82)503.55.50.4
24(38, 5)150240.5
25(18, 80)50150.1
26(65, 85)502.55.50.5
27(42, 12)2004.56.50.3
28(20, 82)200450.3
29(42, 15)500.520.5
30(25, 30)50570.2
31(0, 40)100350.3
32(55, 80)100010.5
33(6, 68)10013.50.4
34(85, 25)150350.5
35(65, 55)2003.55.50.3
36(55, 20)2004.56.50.5
37(73, 52)1502.54.50.4
38(63, 65)504.570.2
39(60, 12)10046.50.3
40(18, 75)100130.3
41(48, 13)00160
42(26, 47)00160
43(63, 52)00160
44(55, 79)00160
45(32, 80)00160
Table 3. Parameter settings.
ParameterValue
Q27 kWh
δ 0.2 kWh/km
r60 kW
s40 km/h
W1000 kg
c f CNY 100
c d 1.5 CNY/km
c r 0.74 CNY/kWh
e p u 20 CNY/h
l p u 40 CNY/h
c c 0.5 CNY/kg
μ 73%
η 0.65 kg/kWh
c f g 0.44 CNY/kWh
ε 0.25
γ 13.8%
t m a x 16 h
Table 4. Results of the models with and without considering green power trading.
Green Power TradingConsideringNot Considering
Number of EVs55
C f (CNY)500500
Driving distance (km)799.04896.76
C d (CNY)1198.561345.14
C r (CNY)80.9185.69
C t (CNY)315.83228.87
C e (CNY)31.3337.63
Carbon emissions (kg)51.8875.26
Unfinished green power quota (kWh)12.250
F (CNY)2126.632197.33
Table 5. Impact of initial population on genetic algorithm (GA).
AlgorithmF (CNY) C f (CNY) C d (CNY) C r (CNY) C t (CNY) C e (CNY)Computation Time (s)
GA3532.54500.001534.22101.371357.7039.2553.89
NNC-GA2413.45500.001289.7886.88503.1533.6446.96
Table 6. Impact of adaptive crossover and mutation operators on GA.
AlgorithmF (CNY) C f (CNY) C d (CNY) C r (CNY) C t (CNY) C e (CNY)Computation Time (s)
GA3532.54500.001534.22101.371357.7039.2553.89
AGA2735.87500.001422.7897.65677.6337.81113.08
NNC-GA2413.45500.001289.7886.88503.1533.6446.96
HAGA2126.63500.001198.5680.91315.8331.3390.83
Table 7. Results of different cases.
AlgorithmNumber of CustomersConsidering Green Power TradingF (CNY)Carbon Emission (kg)Cost Saving (%)
NNC-GA10Yes740.4817.590.19%
10No741.9024.09-
20Yes1163.3532.060.71%
20No1171.6347.02-
30Yes1552.1841.690.94%
30No1566.8359.90-
40Yes2413.4555.704.39%
40No2524.2883.67-
HAGA10Yes740.4817.590.19%
10No741.9024.09-
20Yes1112.0831.530.63%
20No1119.0943.19-
30Yes1512.8736.750.73%
30No1523.9553.90-
40Yes2126.6351.883.22%
40No2197.3375.26-
Disclaimer/Publisher’s Note: The statements, opinions and data contained in all publications are solely those of the individual author(s) and contributor(s) and not of MDPI and/or the editor(s). MDPI and/or the editor(s) disclaim responsibility for any injury to people or property resulting from any ideas, methods, instructions or products referred to in the content.

