Article

Factors Influencing Carbon Emissions in High Carbon Industries in the Zhejiang Province and Decoupling Effect Analysis

1
School of Economics and Management, Shanghai University of Electric Power, Shanghai 201306, China
2
State Grid Zhejiang Electric Power Co., Ltd., Huzhou Power Supply Company, Huzhou 313099, China
*
Author to whom correspondence should be addressed.
Sustainability 2023, 15(22), 15975; https://doi.org/10.3390/su152215975
Submission received: 19 September 2023 / Revised: 26 October 2023 / Accepted: 7 November 2023 / Published: 15 November 2023

Abstract

:
High-carbon emission industries are the most important source of carbon emissions in the Zhejiang Province. Due to the differences in the development level of various industries, it is necessary to adjust the carbon emission reduction strategies of various industries. As the first ecological province in China, the promotion of carbon emission reduction in high-carbon industries in the Zhejiang Province plays an important leading role in the development of low-carbon economy in other industries and other provinces in China. Taking eight high-carbon industries in Zhejiang Province as the research object, this paper uses the LMDI factor decomposition model to deconstruct the influencing factors and effects of carbon emissions in eight industries in the Zhejiang Province from 2010 to 2021. On this basis, the Tapio decoupling model is applied to study the reasons and driving factors of the decoupling between economic growth and carbon emissions. The results showed that: (1) During the study period, the total carbon emissions of eight industries in the Zhejiang Province increased by 24,312,200 t, showing an overall upward trend. (2) The effect of economic growth and population size led to the rapid growth of carbon emissions in eight industries in the Zhejiang Province, and the effect of energy intensity on carbon emission reduction was the most significant; the effect of industry structure presented a trend of first promoting and then inhibiting, and the effect of carbon emission coefficient always inhibited carbon emissions. (3) The population size has restricted decoupling efforts; energy intensity has the greatest impact on the realization of industry decoupling; energy structure and industry structure decoupling efforts are small; the carbon emission coefficient has always influenced decoupling efforts. This research paper will provide suggestions and policies for the development of low-carbon economy in Zhejiang Province.

1. Introduction

The rapid development of the modern economy has spawned a large amount of carbon emissions, aggravating global warming, and the greenhouse effect has become a common environmental threat to all mankind, attracting extensive attention from scholars around the world [1,2]. However, China is one of the countries with the largest amount of carbon emissions in the world, and the pressure of carbon emission reduction is gradually increasing [3]. According to the International Energy Agency (IEA), China’s total carbon emissions will reach 11.9 billion tons in 2021, ranking first in the world [4]. Industry is the main contributor to energy consumption in China, and industrial carbon emissions account for more than 70% of the total carbon emissions created by society [5], which seriously hinders the goal of green and low-carbon development in China. As an important carrier of economic development and the main battlefield of energy conservation and emission reduction, industry takes the lead in achieving carbon peak for other industries in China, playing an important demonstrative and leading role. Therefore, clarifying the key drivers of industrial carbon emissions and reducing carbon from the source will help China to actively yet prudently promote carbon to peak carbon neutrality. In July 2022, the Ministry of Industry and Information Technology, the National Development and Reform Commission and the Ministry of Ecology and Environment jointly issued the “Implementation Plan for Carbon Peak in the Industrial Sector”, pointing out the direction for China’s industrial green and low-carbon development. In this context, it is of great practical significance to study the carbon emission characteristics, driving factors and decoupling effect of regional industrial sectors for carbon emission reduction and low-carbon development of industrial sectors [6].
The Zhejiang Province is located in the economically developed Yangtze River Delta region of China, which is known as the birthplace of “clear water and green mountains are Jinshan and silver mountains”; therefore, determining whether the industry in the Zhejiang Province can continue to play a leading role in the new journey to achieve the goal of a “carbon peak” is crucial. In August 2020, it was proposed that a beautiful China pilot demonstration zone be built in the Zhejiang Province, and by June 2021, the Opinions of the CPC Central Committee and The State Council on Supporting Zhejiang’s High-quality Development and Building a Common Prosperity Demonstration Zone were released, and green and low-carbon development has become one of the core concepts of Zhejiang’s industrial future construction and development. In addition, according to the “Digital China Development Report (2021)” issued by the National Cyberspace Administration, Zhejiang Province’s digital development level ranks first in the country. Relying on its own green and digital development foundation, the Zhejiang Province established the “Zhejiang Industrial Carbon Efficiency Evaluation and Reform Innovation Center” in the New energy Cloud Carbon neutral Innovation Center of the State Grid in September 2022. In order to explore industrial carbon efficiency reform, the Zhejiang Province has become the vanguard of the national industrial digital carbon reduction. In March 2023, the Zhejiang Province issued the “Zhejiang Province Industrial Carbon Peak Implementation Plan”, which pointed out that industrial carbon dioxide emissions in the Zhejiang Province mainly come from the eight high-carbon industries in the industrial sector: steel, building materials, petrochemicals, chemicals, paper, chemical fiber, textile and electricity. According to statistical data, the carbon emissions of eight industries in the Zhejiang Province accounted for nearly 70% of the total carbon emissions of its industry. It can be seen that the carbon emission reduction work of high-carbon industries has become the top priority of energy conservation and emission reduction work in the Zhejiang Province. Therefore, this paper takes eight high-carbon industries in the Zhejiang Province as the research object. Firstly, the LMDI decomposition method is applied to analyze the influencing factors of carbon emissions in eight industries, and then the Tapio decoupling model is applied to analyze the decoupling situation of carbon emissions in eight industries and the speed of economic growth, as well as the internal reasons for the decoupling. At the same time, the LMDI method is combined to analyze the decoupling efforts of each influencing factor. Therefore, some suggestions and policies are put forward for the carbon emission reduction of high-carbon industries in the Zhejiang Province. This paper has important practical significance for realizing the goal of carbon emission reduction and low-carbon transformation of industrial structure in the Zhejiang Province, improving industrial energy efficiency and formulating relevant carbon emission reduction policies. In addition, this study can also provide a realistic theoretical and practical basis for industrial digital control of carbon emissions in other provinces and cities in China.
In light of the increasingly serious problem posed by carbon emissions, the influencing factors of these emissions have attracted the attention of scholars around the world. Scholars around the world have conducted a lot of research on the selection of research methods used to investigate the drivers of carbon emission change [7,8]. In all the research methods of carbon emission driver decomposition, the commonly used methods are regression analysis and decomposition analysis. In regression analysis, the IPAT model [9] and the STIRPAT model [10] are the most commonly used. Chontanawat [11] studied the factors of increasing carbon emissions in ASEAN countries from 1971 to 2013 based on the IPAT model and found that the only way to reduce carbon emissions is to improve energy utilization efficiency. Shan et al. [12] studied the role of carbon emission drivers in Turkey based on the STIRPAT model, and the results showed that green technology innovation and renewable energy inhibited the growth of carbon emission, while energy consumption, population size and per capita income played a clear role in promoting carbon emission. Cheng et al. [13] investigated whether the urbanization expansion contributed to the increase in carbon emissions in our country based on the STIRPAT model.
The most common methods of decomposition are structural decomposition (SDA) [14,15] and exponential factorization (IDA) [16,17]. Compared with other methods, the IDA method can analyze continuous time series, and the calculation is simpler and more flexible. The IDA method includes the Laplace index method and Dee’s index method, and the LMDI method is a kind of Dee’s index method. The advantages of this method are convenient data acquisition, no residual term [18], and the ability to solve the problem of zero and negative values [19,20]. Therefore, The LMDI method is widely used in the study of carbon emission drivers at the national, provincial, city and industry levels. Based on China’s demand and export carbon footprint from 2009 to 2016, Cai et al. [21] constructed an SDA model to study the driving factors of carbon footprint change. Based on the LMDI decomposition model, Ortega-Ruiz et al. [22] decomposed the driving factors of India’s carbon emissions from 1990 to 2016, and the results showed that economic growth promoted a 276% increase in India’s carbon emissions, while energy intensity reduced its carbon emissions by 47%. Gu et al. [23] quantified the carbon emissions of Shanghai using the LMDI model and the SD method. The research of Chen et al. [24] shows that the best carbon emission reduction strategy for Nanjing is to control the two influential factors of industrial energy consumption and industrial structure change.
A summary of past carbon emission factors is presented in Table 1.
A decomposition analysis of carbon emission drivers is conducive to formulating corresponding emission reduction policies according to carbon emission drivers, and decoupling analysis of economic development and carbon emissions is an effective method of measuring whether various industries have achieved low-carbon development [26,27]. At present, the Tapio decoupling model is widely used. This model has the advantages of a flexible base period selection, stable results and clear judgment criteria. Therefore, the decoupling model has been widely applied to the research on carbon emissions and economic growth [28,29]. Wang et al. [30] divided China into eastern, middle and western regions for carbon decoupling research, and the results showed that the decoupling effect of the energy intensity effect was poor. Liu et al. [31] studied the decoupling of carbon emission growth and economy in the six central provinces and found that the six central provinces were in a weak decoupling state as a whole, and the decoupling effect was good. The decoupling status varies greatly among different provinces. Simbi et al. [32] studied African countries and found that the carbon emissions offset by industrial structure and carbon emission efficiency were not enough to decouple economic development from carbon emissions. Amir et al. [33] analyzed the decoupling of carbon emissions from industrial sector and economic growth in Pakistan during 1991–2018 and found that the decoupling state was unstable.
A summary of past carbon emission decoupling is presented in Table 2.
In summation, some studies have analyzed the driving factors and decoupling state of carbon emissions, but most of the previous studies focused on a single industry level, such as the national and provincial levels, and the research on carbon emissions of provincial industrial sectors is insufficient, especially the research on high-carbon industries that play a decisive role in the development trend of carbon emissions. And most of the existing literature focuses on the judgment of the decoupling state, without in-depth analysis of the internal reasons for the decoupling of various industries. Therefore, this study focuses on eight high-carbon industries in the Zhejiang Province. Firstly, the LMDI decomposition method is used to decompose and analyze the influencing factors of carbon emissions in eight industries, and then the Tapio decoupling model is used to analyze the decoupling between carbon emissions and economic growth rate of eight industries and the internal reasons for the decoupling. Combined with the LMDI method to analyze the decoupling efforts of each influencing factor, so as to put forward targeted suggestions and policies for the carbon emission reduction of high-carbon industries in the Zhejiang Province, the specific technical route is shown in Figure 1.

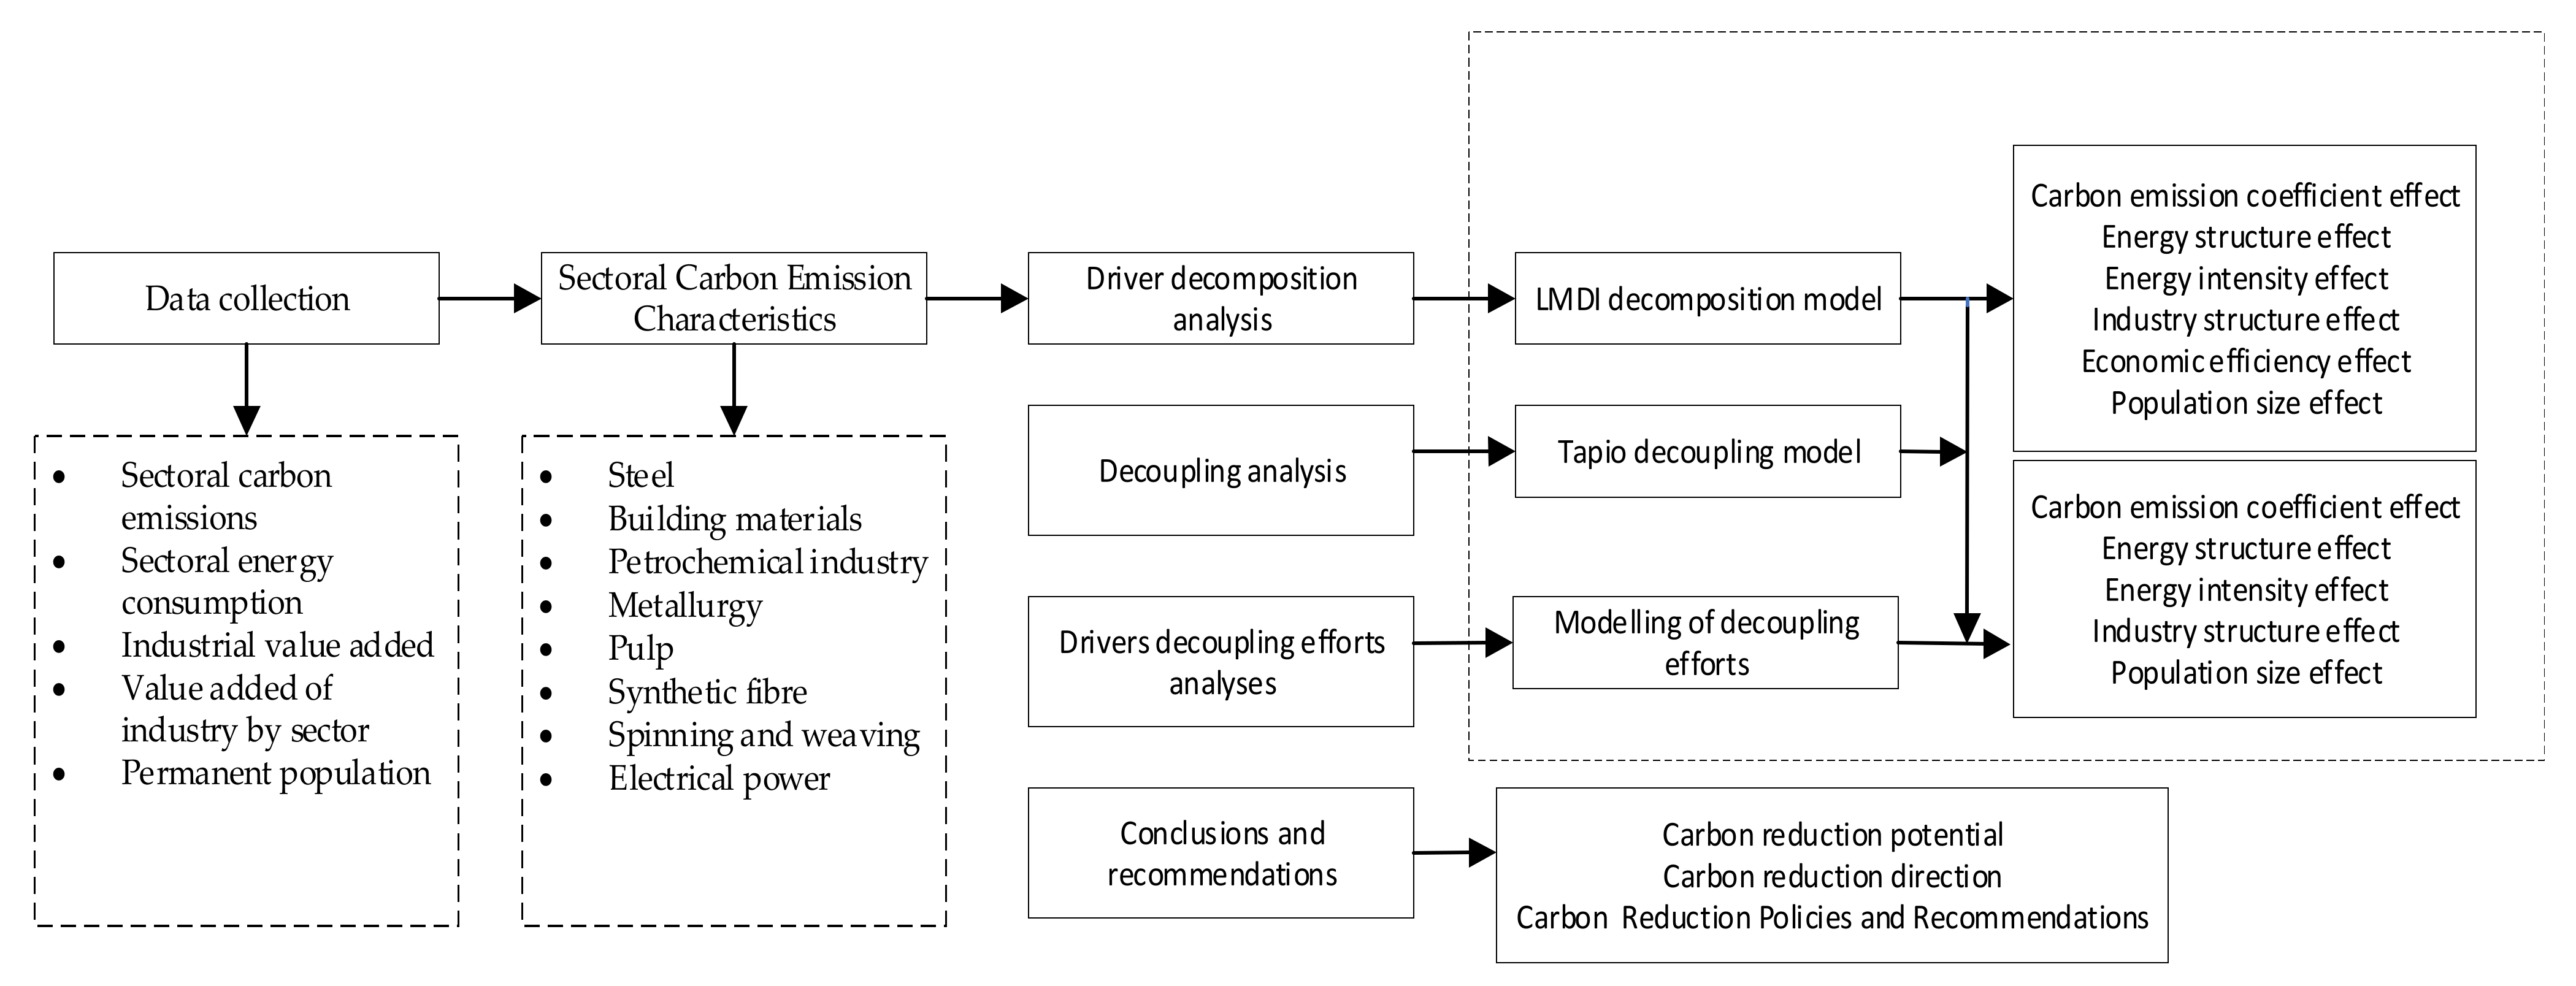
2. Data Sources and Research Methodology

2.1. Data Resource

In this paper, various energy consumption, carbon emissions, industry added value and other relevant data of eight high-carbon industries in the Zhejiang Province from 2010 to 2021 are selected from the new energy cloud platform of the National Grid. The population and industrial added value of the Zhejiang Province at the end of the year came from the Zhejiang Statistical Yearbook. The energy consumption of electricity production or heat consumption is derived from the China Energy Statistical Yearbook and China Electric Power Statistical Yearbook. The data of carbon oxidation rate and carbon emission coefficient of fossil energy sources are derived from the IPCC Guidelines for National Greenhouse Gas Emission Inventories. In addition, in order to eliminate the price impact factor, the industrial GDP and industrial value added over the past few years are converted to 2010 as the base period.

2.2. Carbon Emission Accounting

This paper adopts the IPCC carbon emission factor method to measure the carbon emissions from fossil energy consumption of eight high-carbon industries in the Zhejiang Province, and the carbon emission calculation formula is as follows [34]:
C = i j E i j × E F i j × O i j × 44 / 12
where C represents energy carbon emissions; E i j , E F i j and O i j denote the energy consumption, carbon emission factor and carbon oxidation rate of j energy sources in sector i , respectively; 44 / 12 is the carbon conversion factor.
As electricity and heat are secondary energy sources, the carbon emission factors for each year will vary depending on the level of process and the type of energy source, so they need to be calculated separately, and the formulas for calculating the carbon emission factors for electricity and heat are as follows [35]:
E F t = j C j t E f o s s i l t + E n u c l e a r t + E h y d r o t
where E F t denotes the carbon emission factor for electricity or heat in year t ; C j t denotes the carbon emissions of j energy sources consumed in year t for the production of electricity or heat; and E f o s s i l t , E n u c l e a r t and E h y d r o t denote the fossil, nuclear and hydro energy consumed in year t for the production of electricity or heat.
In order to display the types of energy directly, this paper divides the types of energy consumption into coal energy, petroleum energy, natural gas energy, thermal energy and electric energy.

2.3. LMDI Decomposition Model Construction

Based on Kaya’s constant equation, the LMDI factor decomposition model is constructed to analyze the carbon emission drivers of the eight high-carbon industries in the Zhejiang Province, and the sum of the effects of six influencing factors, namely, carbon emission coefficients, energy structure, energy intensity, industry structure, economic efficiency and population size, is selected to represent the growth trend of carbon emissions. According to the factor decomposition of LMDI method, the formula of carbon emission is obtained as [36]:
C = i j C i j = i j C i j E i j × E i j E i × E i Q i × Q i Q × Q P × P = i j C I × E S × E I × S I × Q P × P
Δ C t o t = C t C 0 = Δ C C I + Δ C E S + Δ C E I + Δ C S I + Δ C Q P + Δ C P
where P is the population at the end of the year. Q is the total industrial GDP. Q i is the value added of the industry i ; E i is the total energy consumption of the industry i ; E i j is the consumption of energy type j of industry i ; C i j represents the carbon emissions from energy type j for industry i ; C is the total carbon emission from the eight industries; C I is the carbon emission coefficient; E S is the energy structure; E I is the energy intensity; S I is the structure of the industry; Q P is the economic efficiency; P is the size of the population; denotes the effect of the carbon emission coefficient. Δ C C I denotes the carbon emission factor effect; Δ C E S denotes the energy structure effect; Δ C E I denotes the energy intensity effect; Δ C S I denotes the industry structure effect; Δ C Q P denotes the economic efficiency effect; Δ C P denotes the population size effect; Δ C t o t denotes the total effect; C t and C 0 denote the carbon emissions in the target year and the base year, respectively.
Of these, the formulae for the various effects are as follows [36]:
Δ C C I = i j W i j ln C I t C I 0
Δ C E S = i j W i j ln E S t E S 0
Δ C E I = i j W i j ln E I t E I 0
Δ C S I = i j W i j ln S I t S I 0
Δ C Q P = i j W i j ln Q P t Q P 0
Δ C P = i j W i j ln P t P 0
W i j = C i j t C i j 0 ln C i j t ln C i j 0
In addition, in order to facilitate the comparison of the degree of contribution of different influencing factors, this paper adopts the contribution degree to measure the impact of each factor on carbon emissions, and when the contribution degree is larger, it indicates that the influencing factor has a stronger effect on carbon emissions. The formula for the specific contribution degree is as follows [36]:
c o n = Δ C m m C m × 100 %
where c o n represents the degree of contribution, Δ C m indicates the contribution value of each influencing factor, and m C m represents the absolute value of the contribution value.

2.4. Tapio Decoupling Model

Based on the Tapio decoupling model, the decoupling relationship between carbon emissions and economic growth of the eight high-carbon emitting industries in the Zhejiang Province is shown in the following equation [37]:
ε = Δ C / C 0 Δ G / G 0 = ( C t + 1 C t ) / C t ( G t + 1 G t ) / G t
where ε is the decoupling coefficient; Δ C and C 0 are the change in carbon emissions and the base period carbon emissions, respectively; Δ G and G 0 are the Change in industry value added and base period industry value added, respectively. The specific decoupling status can be seen in Table 3 [37].

2.5. Tapio Decoupling Effort Model

Combining the LMDI decomposition model and the Tapio decoupling model, after removing the economic efficiency effect, the decoupling effort formulas of each influencing factor on economic growth and carbon emissions are obtained as follows [36]:
D = Δ C t o t Δ C Q P Δ C Q P = Δ C C I Δ C Q P Δ C E S Δ C Q P Δ C E I Δ C Q P Δ C S I Δ C Q P Δ C P Δ C Q P = D C I + D E S + D E I + D S I + D P
where D is the total decoupling effort coefficient after excluding the effect of economic efficiency; D C I , D E S , D E I , D S I , and D P denote the decoupling effort of carbon emission factor, energy structure, energy intensity, industry structure, and population size on carbon emission reduction, respectively. When D ≥ 1, it represents a strong decoupling effort; when 0 < D < 1, it represents a weak decoupling effort; and when D ≤ 0, there is no decoupling effort.

3. Study on the Current Situation of Eight High-Carbon Industries in the Zhejiang Province

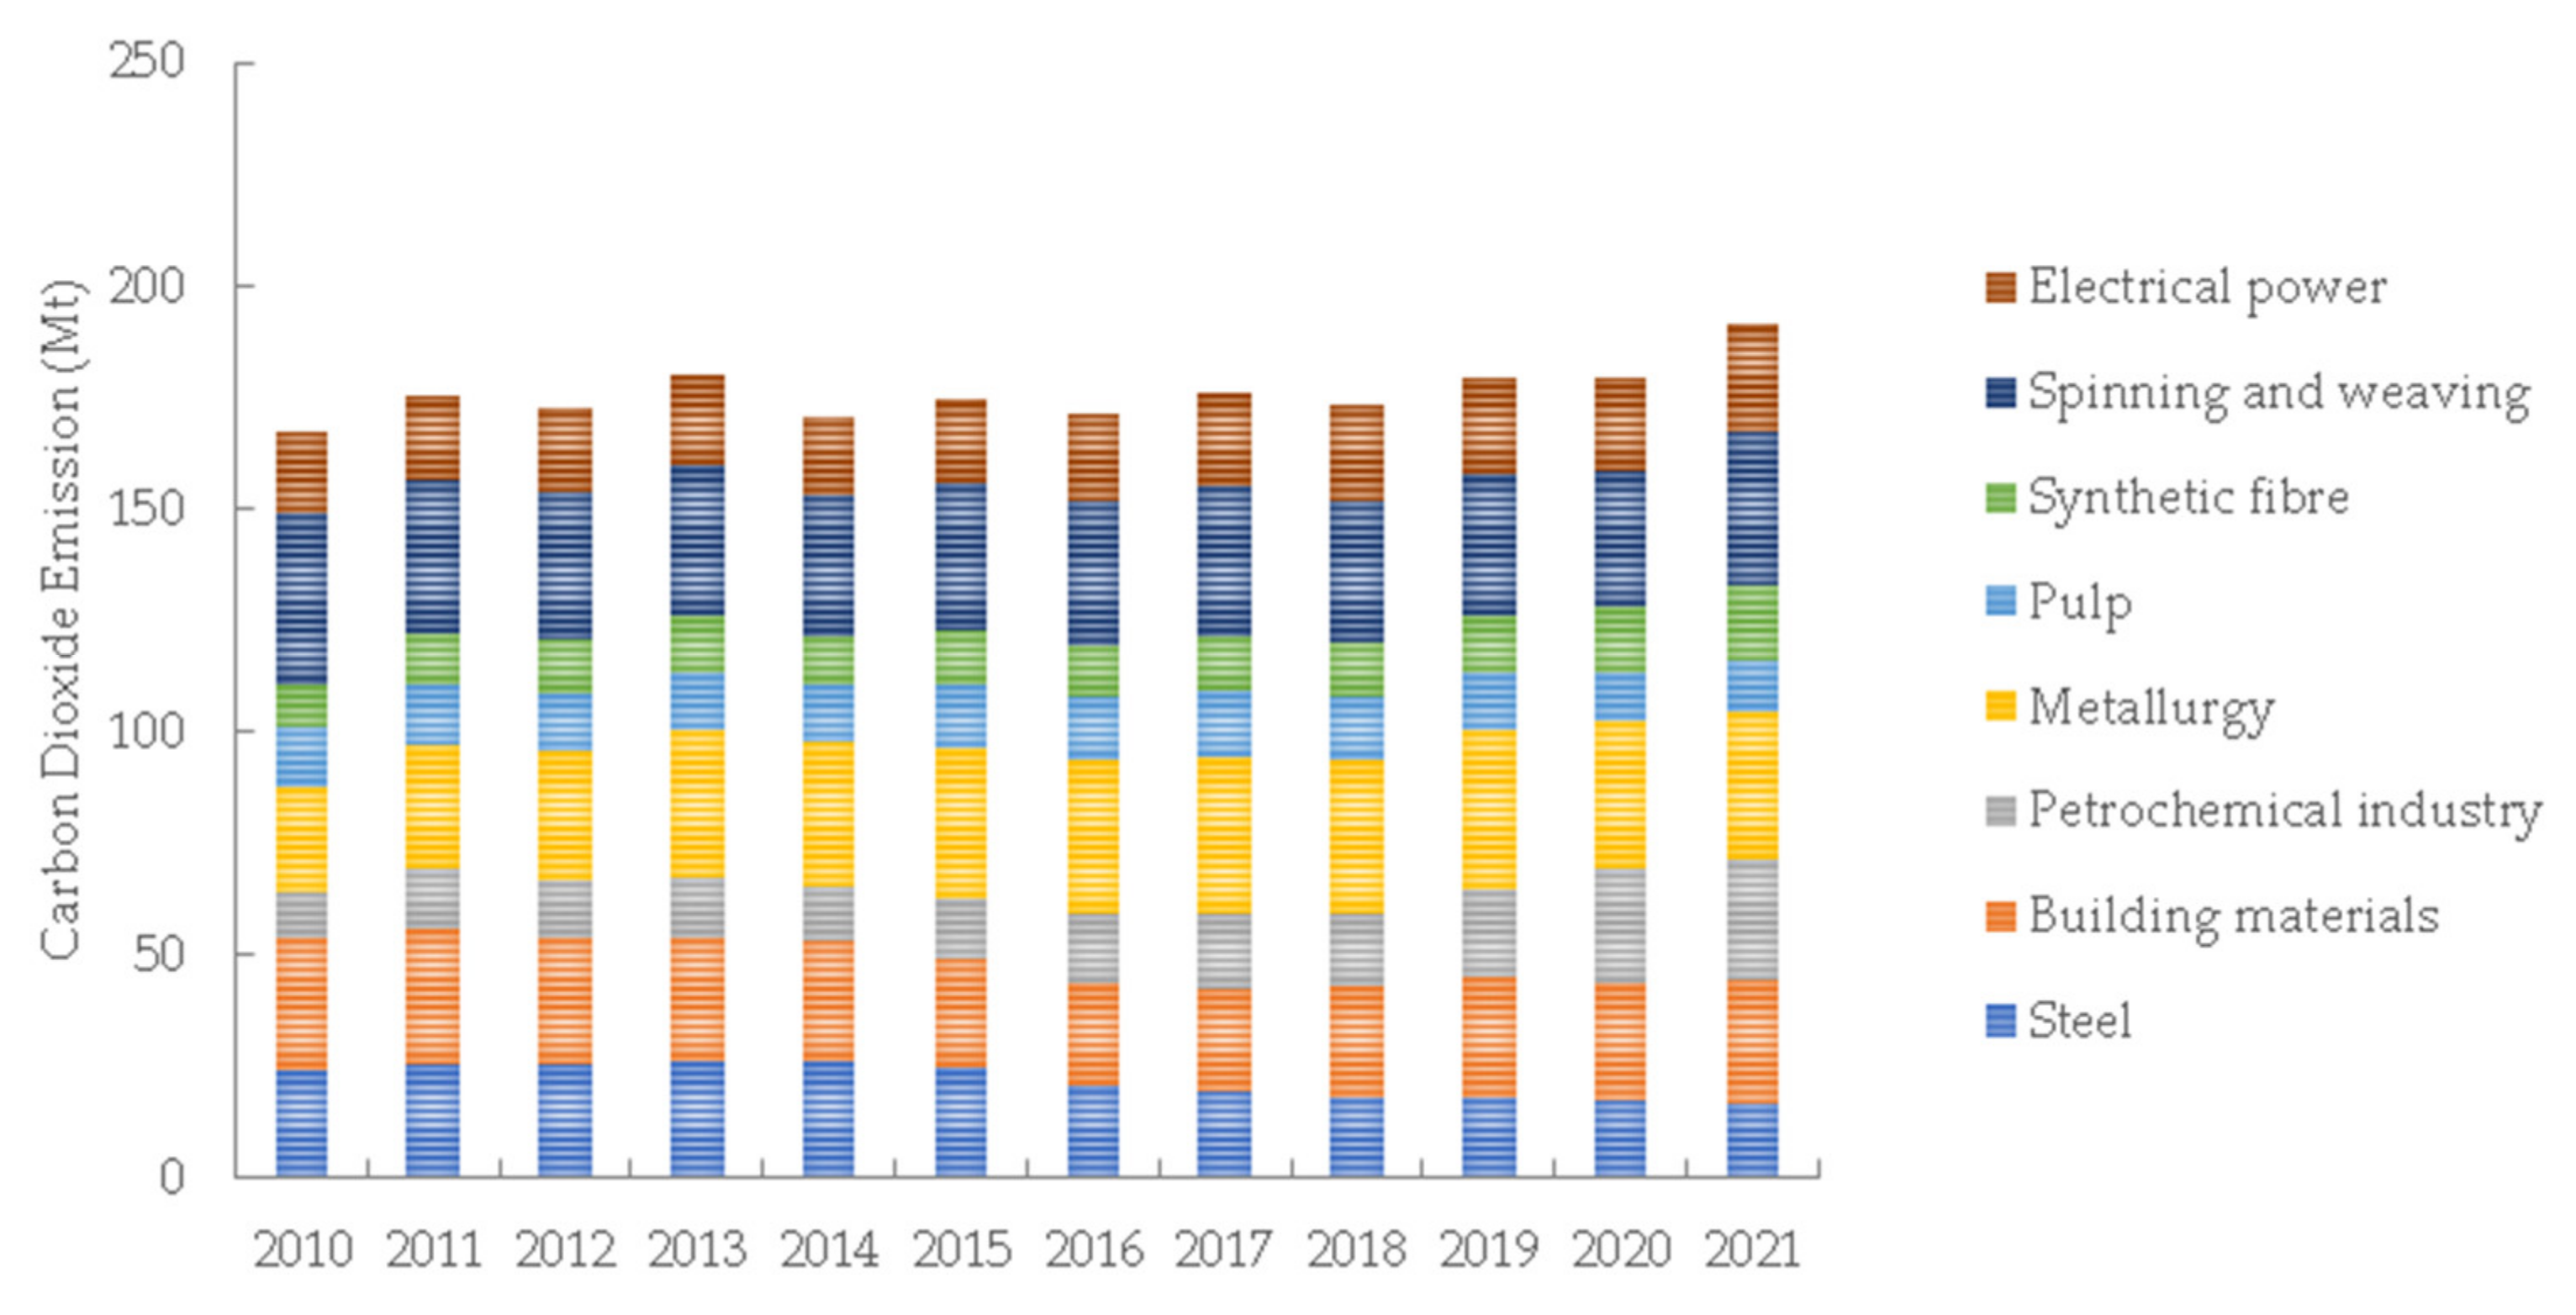
3.1. Analysis of the Current Situation of Carbon Emissions from Eight Major Industries in the Zhejiang Province

In recent years, the level of industrial development in the Zhejiang Province has rapidly increased, and the growth rate of industrial carbon emissions has also increased. In 2021, the total industrial carbon emissions in the Zhejiang Province reached 285,214,000 t. Eight high-carbon industries—iron and steel, building materials, petrochemicals, chemical industry, papermaking, chemical fiber, textile and electric power—make the largest contribution to the industrial carbon emissions in the Zhejiang Province. In 2021, the total carbon emissions of eight major industries in the Zhejiang Province amounted to 191,215,300 t accounting for 67.04% of the total industrial carbon emissions in the Zhejiang Province. The total carbon emissions of the eight major industries in the Zhejiang Province from 2010 to 2021 rose from 166,904,100 t to 191,215,300 t, an increase of 24,311,200 t. The carbon emission of the petrochemical, chemical, chemical fiber and electric power industries showed positive growth, while that of the iron and steel, building materials, papermaking and textile industries decreased. As shown in Figure 2, among the eight high-carbon industries in the Zhejiang Province, carbon emissions are mainly concentrated in the building materials, chemical and textile industries.
Carbon emission intensity reflects carbon productivity, and the carbon emission intensity of the eight major industries in the Zhejiang Province shows a downward trend (Figure 3), and the carbon emission intensity declined more significantly in 2010–2019, indicating that the Zhejiang Province has made some progress in terms of energy efficiency and energy structure transformation, but some industries showed a slow upward trend after 2019, which may be due to the impact of the COVID-19. This has led to a partial deterioration of the economic development level of some industries, and an increase in the carbon emission intensity of others. Among the eight industries, the iron and steel industry has the highest carbon emission intensity, i.e., the lowest carbon emission efficiency, with an average annual carbon emission intensity of 8.37 t/million CNY; the electric power industry has the lowest carbon emission intensity and the highest carbon emission efficiency, with an average annual carbon emission intensity of 1.76 t/million CNY; which suggests that the electric power industry has a higher quality of economic development, whereas the iron and steel industry has a worse quality of economic development. From 2010 to 2021, the carbon emission intensity of the building materials industry decreased the most, reaching 66.28%; the carbon emission intensity of the petrochemical industry decreased the least, by −2.22%. Therefore, in the future, the Zhejiang Province should focus on the energy consumption of the petrochemical industry and promote the low-carbon transformation of the petrochemical industry.

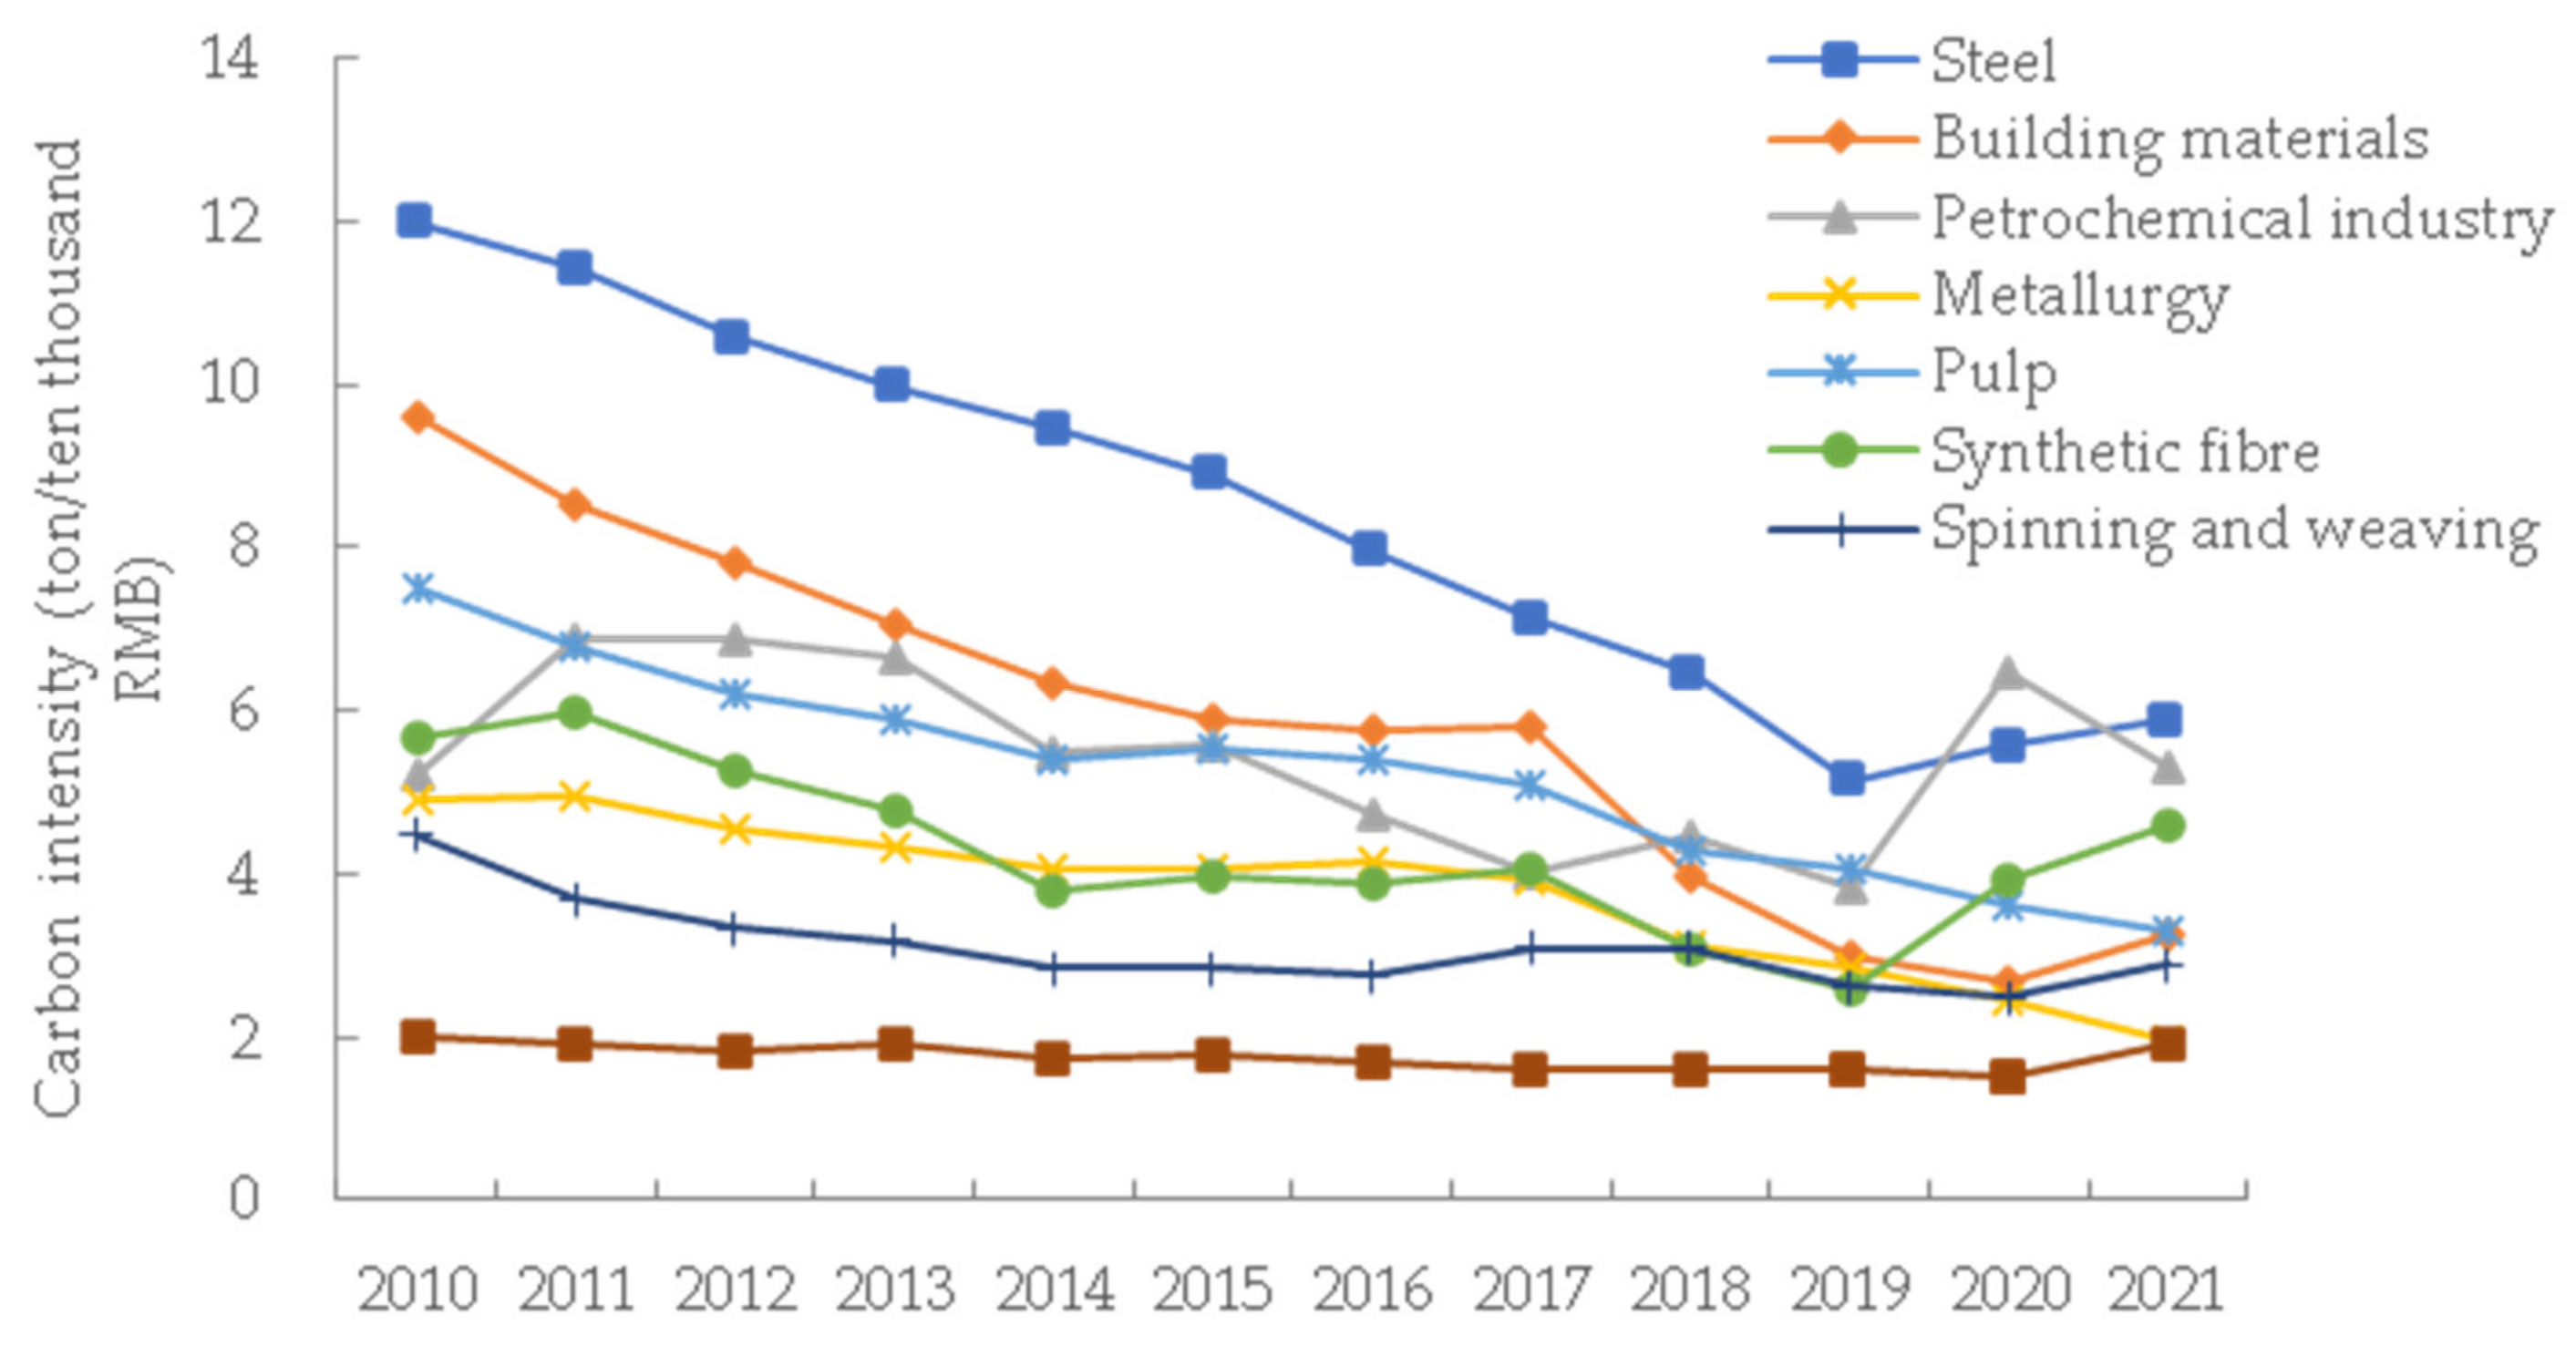
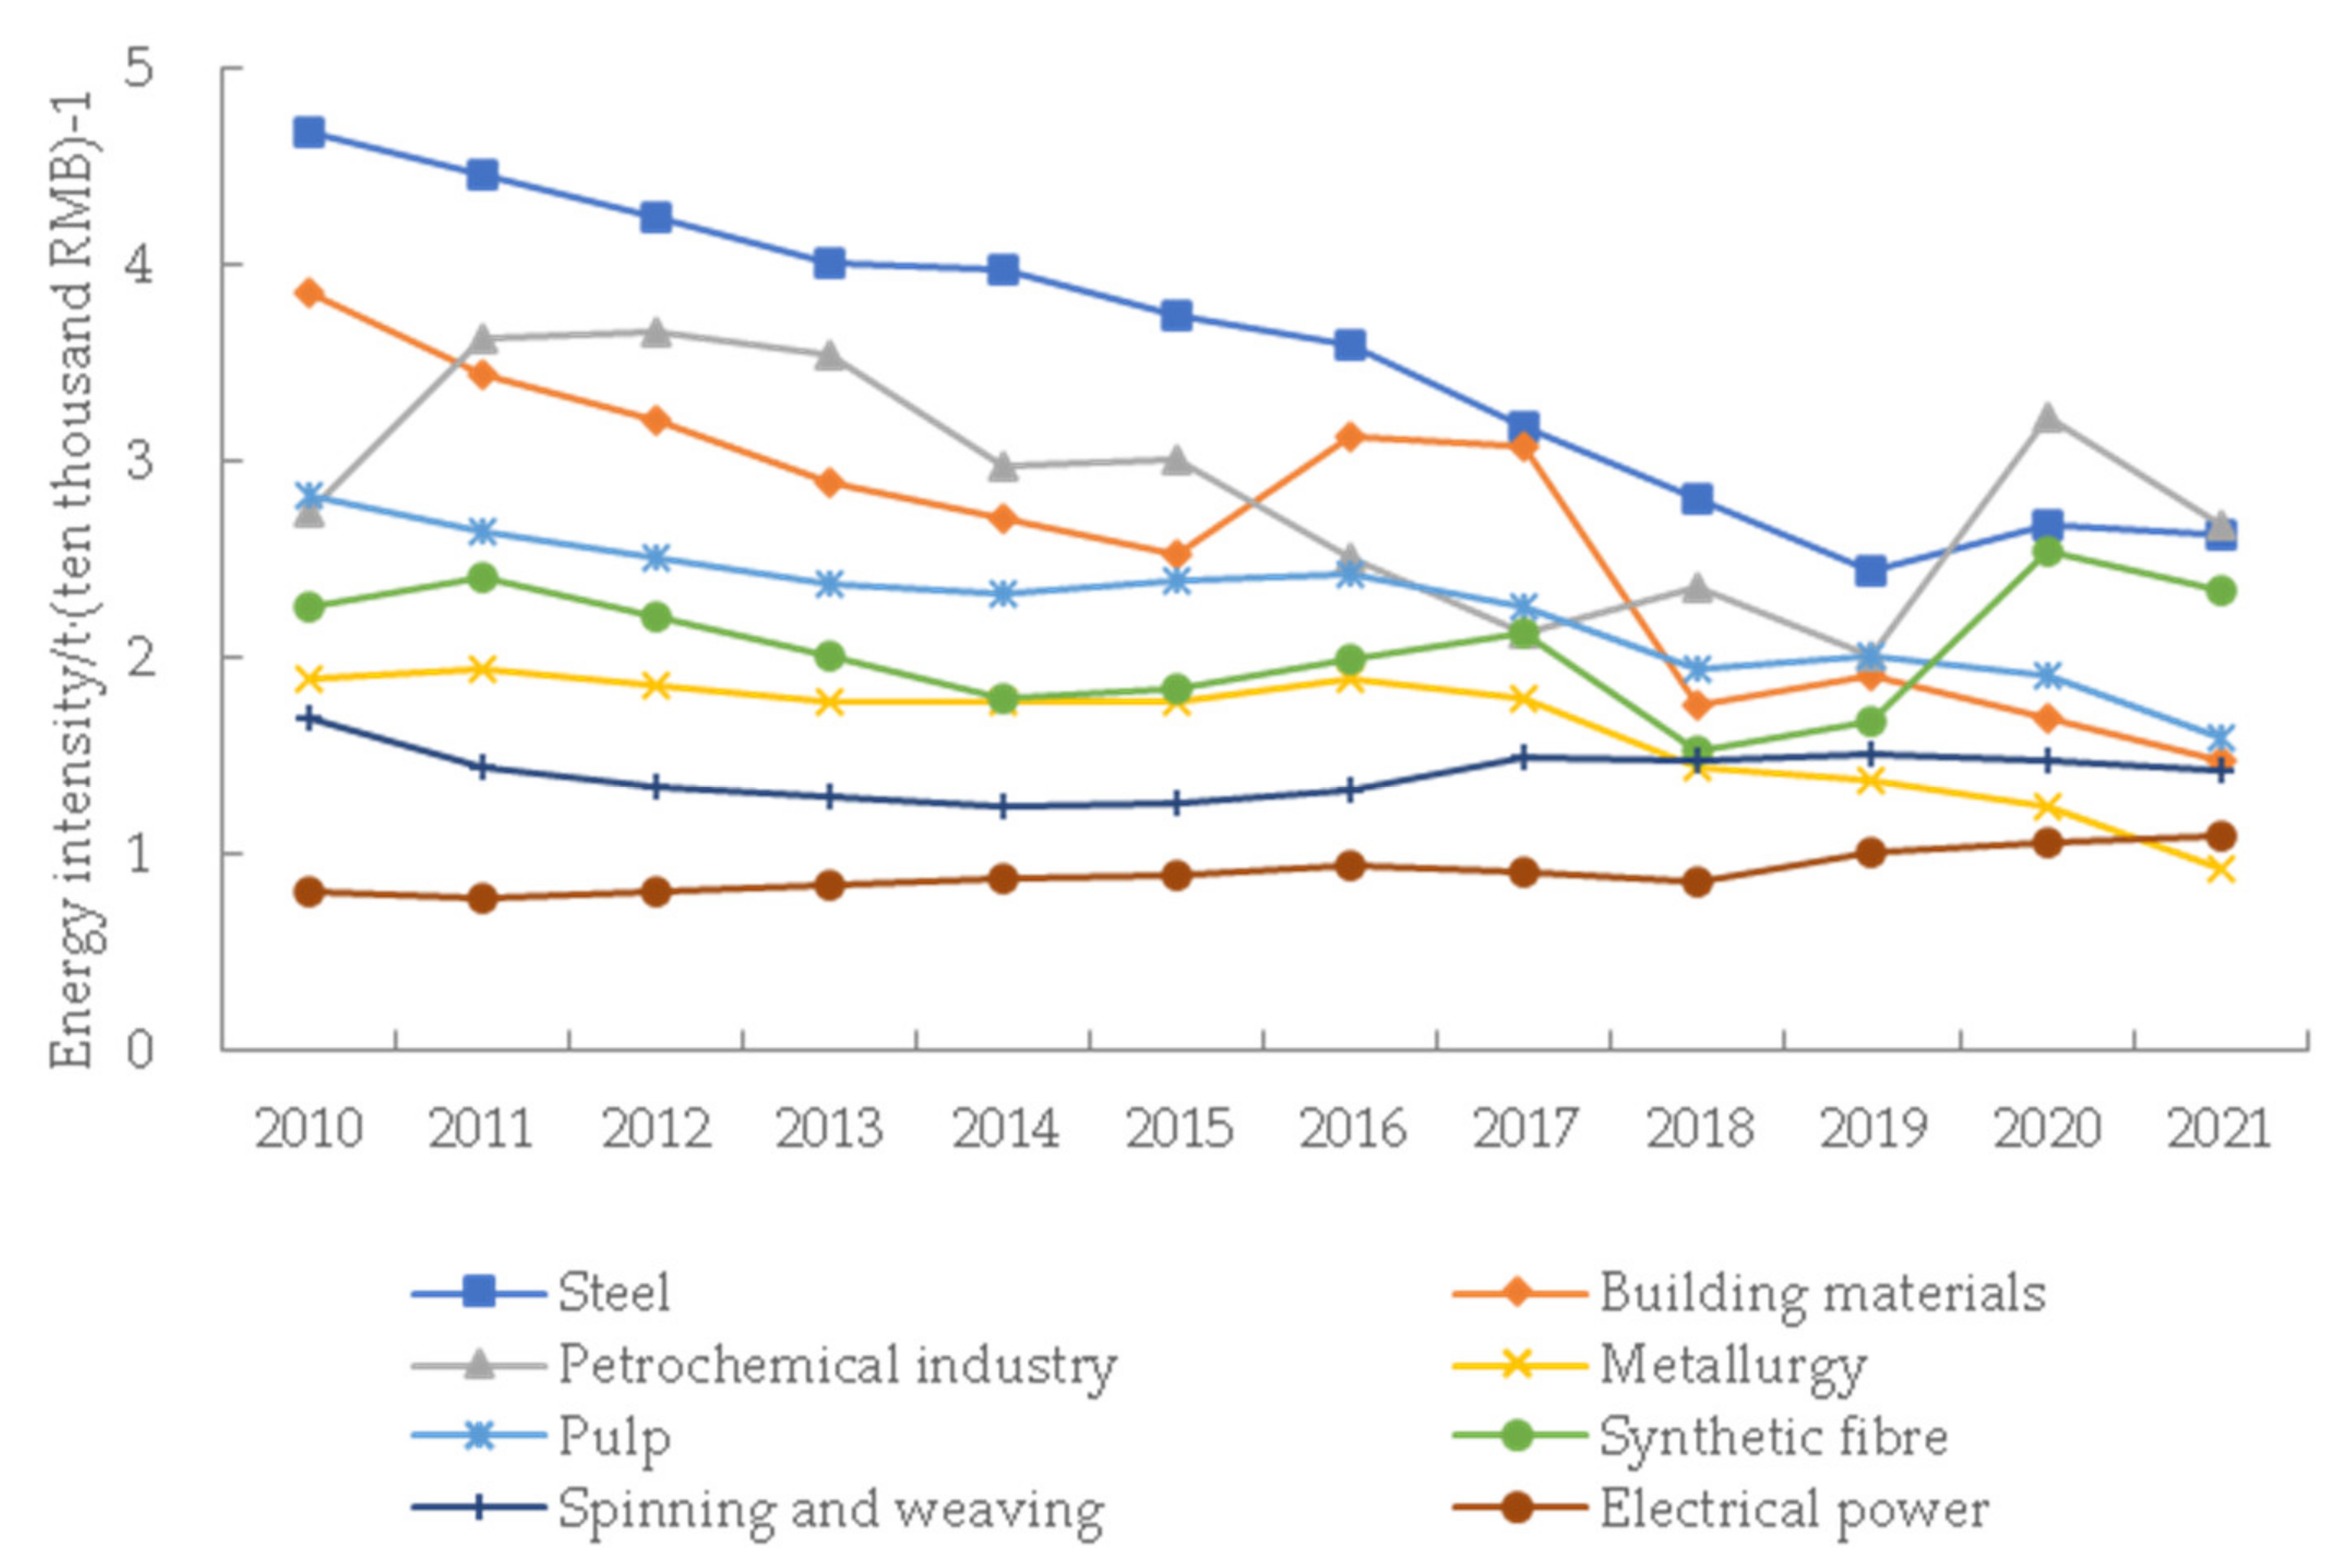
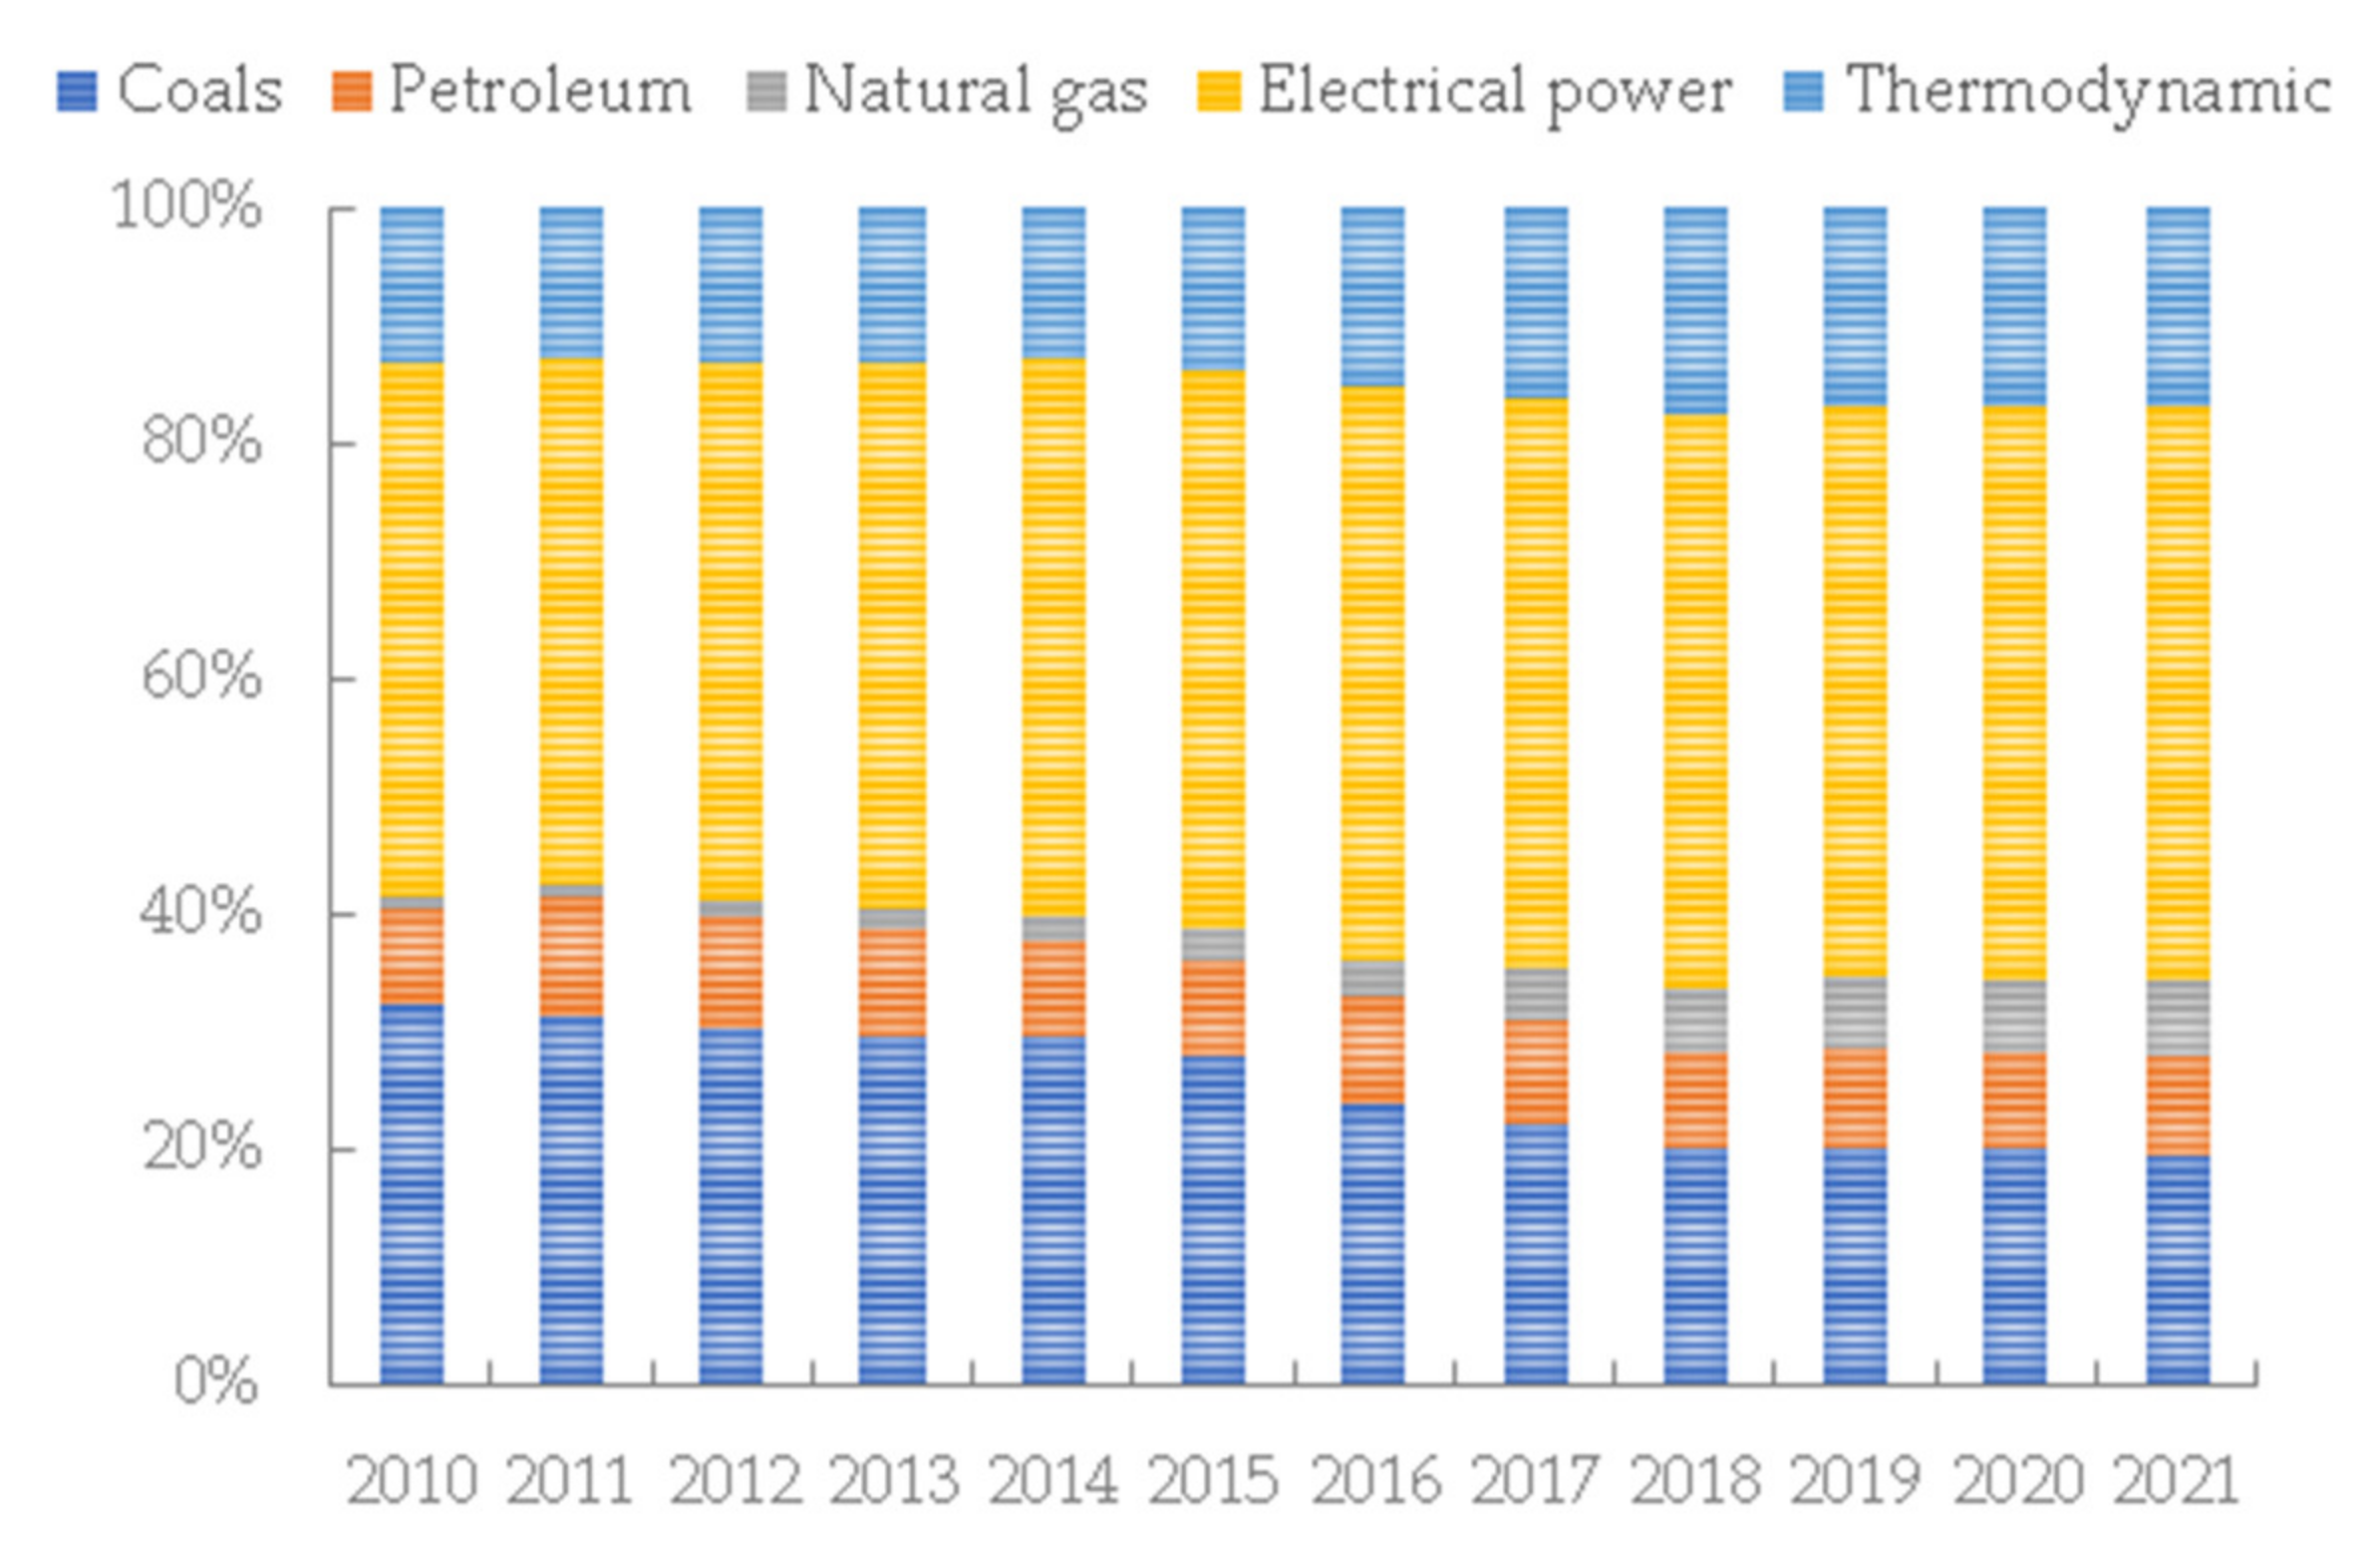
3.2. Analysis of the Current Situation of Energy Consumption in Eight Industries in the Zhejiang Province

In 2021, the total energy consumption of the eight high-carbon industries in the Zhejiang Province will be 94,407,900 t, and the energy consumption structure of different industries has significant differences. From an industry perspective, the petrochemical, building materials and iron and steel industries account for 78.4%, 62.99% and 60.29% of fossil energy consumption from 2010 to 2021, respectively, and are the most dominant industries in fossil energy consumption. As shown in (Figure 4), the energy consumption intensity of the eight major industries in the Zhejiang Province from 2010 to 2021 generally exhibited a downward trend, indicating that the eight major industries in the Zhejiang Province have made greater efforts to save energy and reduce emissions and improve energy efficiency, and the industry’s use of energy has gradually shifted from high energy consumption to low energy consumption. The energy consumption intensity of high-energy-consuming industries represented by building materials and iron and steel shows an obvious decline, while the energy intensity of the petrochemical industry is still high and rising year by year, and the energy intensity of the electric power and textile industries is low, with an annual average value of 0.91 tonnes of standard coal per million CNY and 1.42 tonnes of standard coal per million CNY, respectively, which indicates that the energy-use efficiency of their industries is high. The energy consumption structure of eight major industries in the Zhejiang Province from 2010 to 2021 is shown in Figure 5, the proportion of fossil energy consumption in eight major industries in the Zhejiang Province gradually decreased with economic development, and the proportion of energy consumption of coal decreased from 32.08% to 19.24% from 2010 to 2021, and the overall proportion of fossil energy consumption decreased from 41.55% to 34.17%. And the proportion of electricity energy consumption rises from 45.25% in 2010 to 49.10% in 2021, indicating that eight major industries in the Zhejiang Province are gradually adopting clean energy sources, mainly electricity, to replace fossil energy.

4. Analysis of Carbon Emission Influencing Factors of Eight Industries in the Zhejiang Province

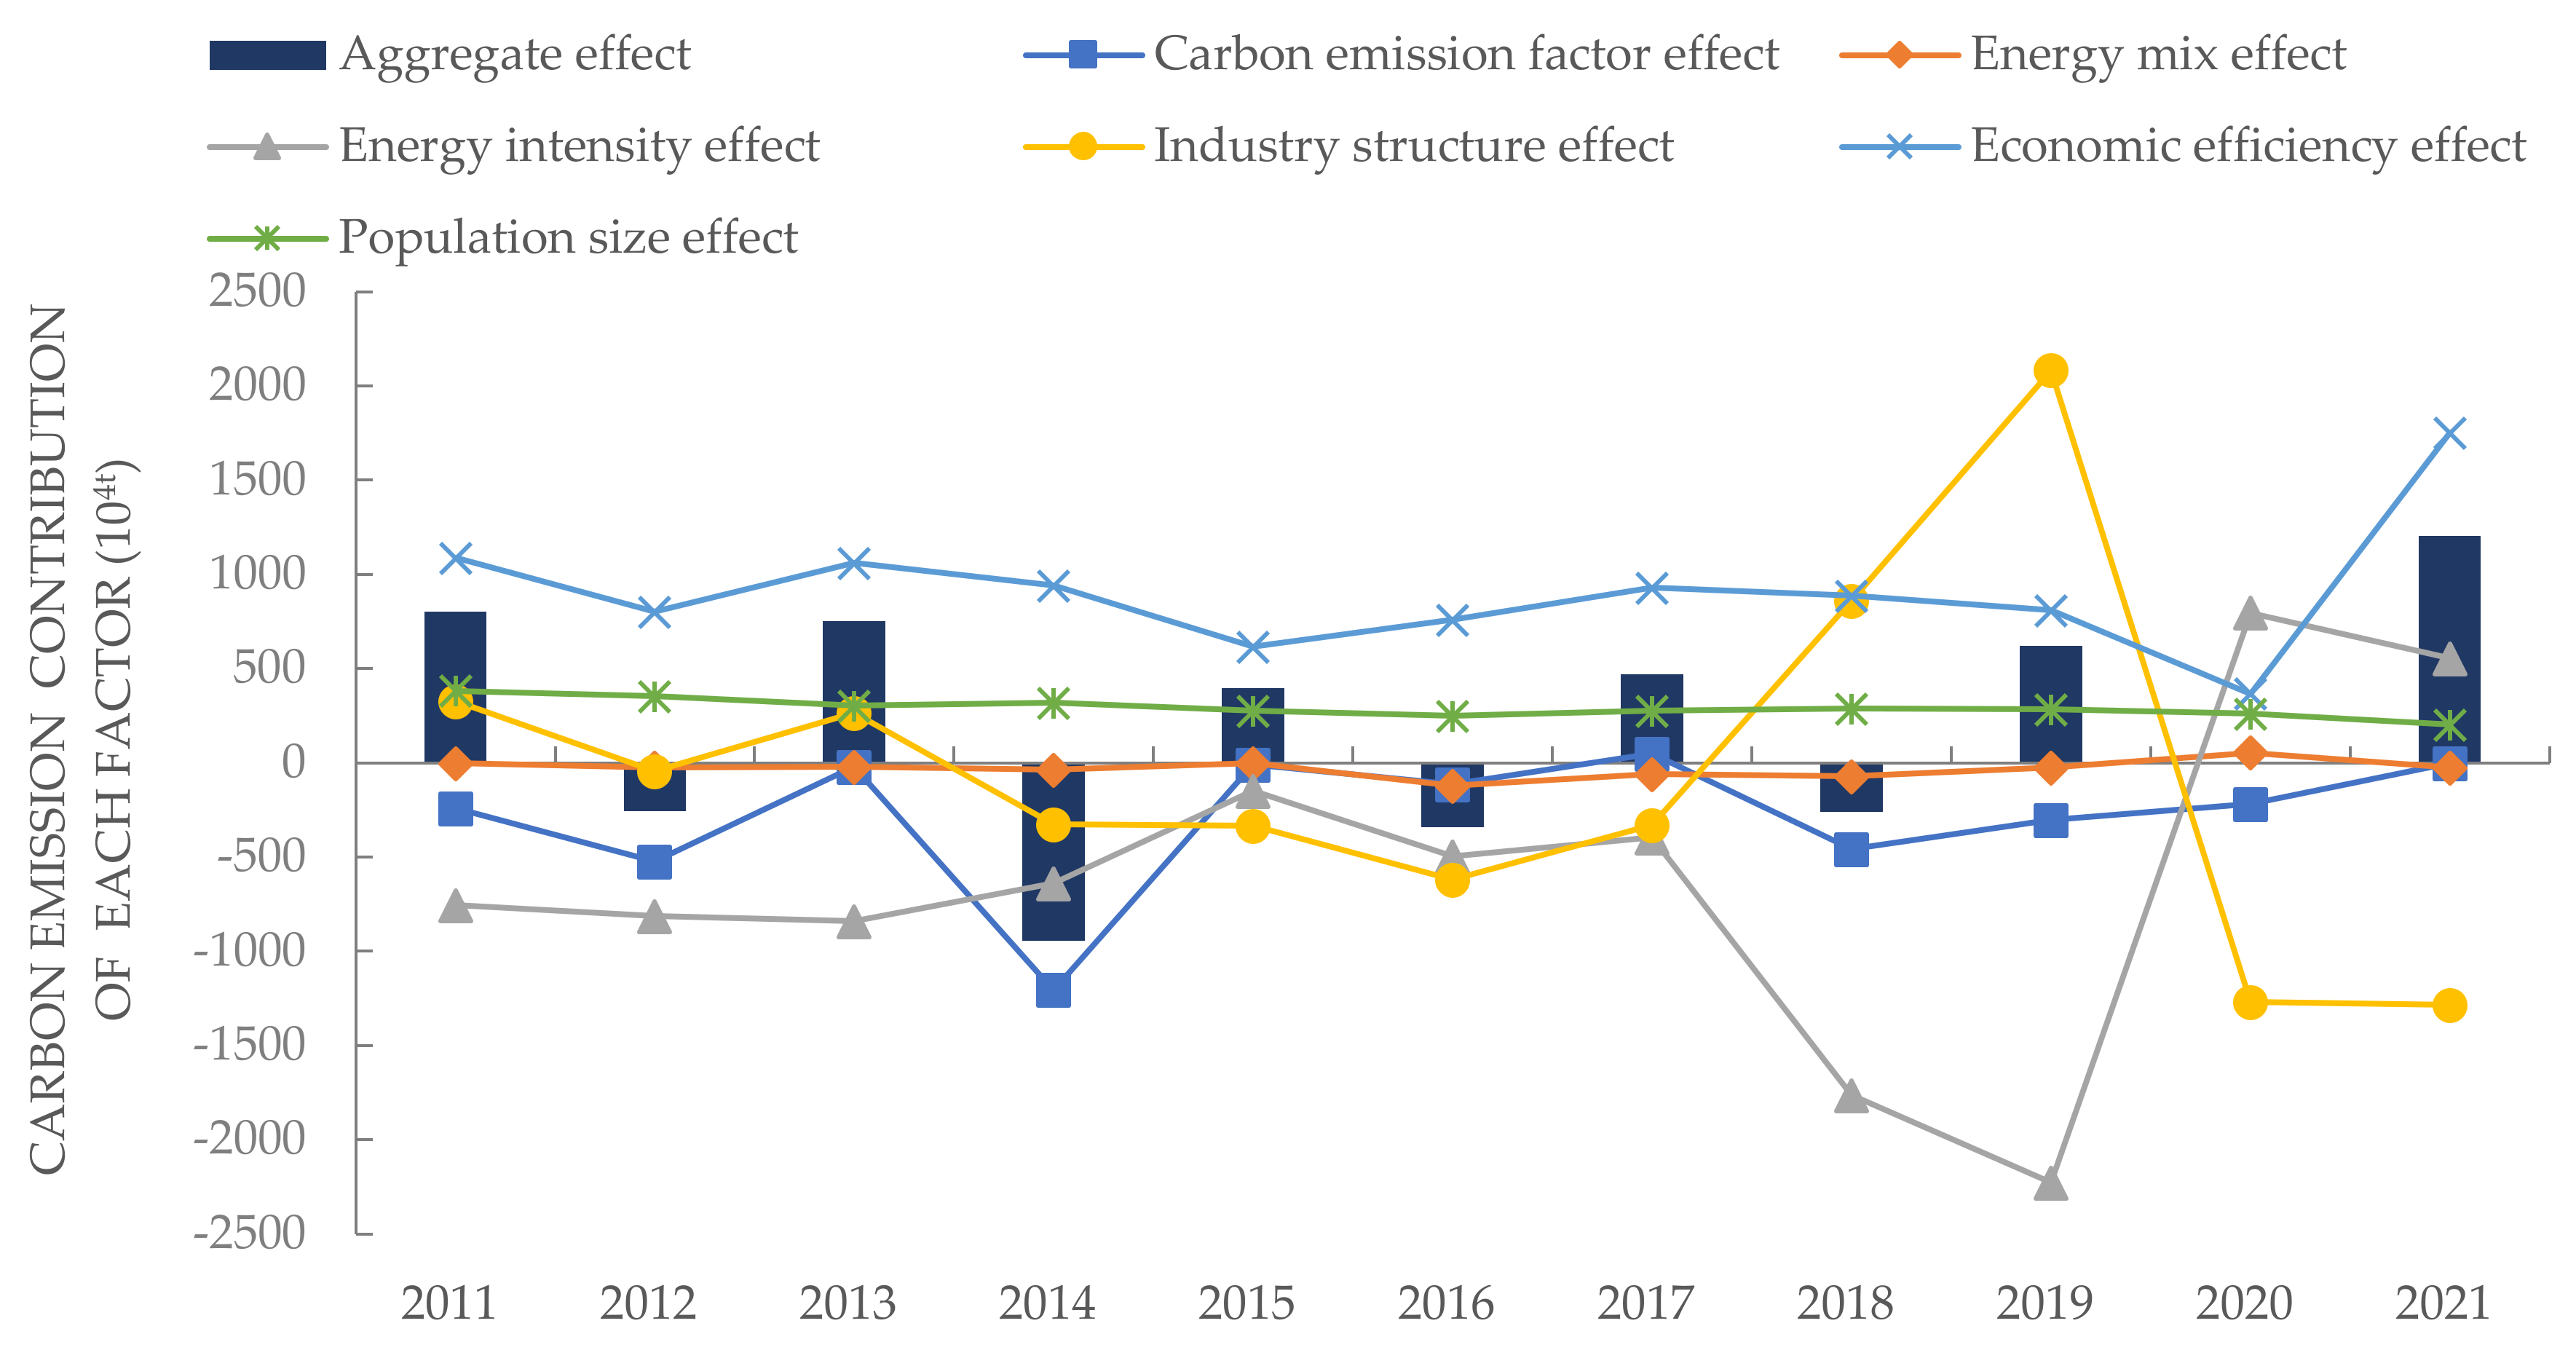
4.1. Analysis of Overall Results

Using the LMDI decomposition method to decompose the factors of the eight high-carbon industries in the Zhejiang Province from 2010 to 2021, in order to facilitate the study of the overall changes in the driving factors, this paper divides the study period into three time periods: 2010–2014, 2014–2018 and 2018–2021. The results are obtained as shown in Table 4. Overall (Figure 6), there are significant differences in the degree of influence of each driver on the changes in carbon emissions in the eight industries in the Zhejiang Province, and the economic efficiency effect and population scale effect are positive in all periods, indicating that the economic effect and population scale effect play a driving role in the changes in carbon emissions in the eight industries in the Zhejiang Province, while the carbon emission coefficient, energy intensity, energy structure and industry structure effect play a significant role in carbon emission reduction of high-carbon industries. Therefore, accelerating the construction of clean energy power generation projects, improving the energy utilization rate, optimizing the energy structure and adjusting the industry structure can help reduce carbon emissions.

4.2. Population Size Effects

The population size effect has a positive impact on carbon emissions in all three time periods, indicating that it contributes to carbon emissions, and the population size effect shows a decreasing trend on the whole. The electric power, textile and paper industries contribute significantly to carbon emissions, with the average relative contribution of 11.68%, 10.03% and 9.95%, respectively. This shows that as the population of the Zhejiang Province grows year by year, the consumption of electricity and energy, the supply of textiles and clothing and the demand for paper increase significantly, and thus the impact on the increase in carbon emissions is becoming more and more obvious.

4.3. Economic Efficiency Effect

The economic efficiency effect contributes more to the cumulative carbon emissions of the eight industries than the cumulative contribution of inhibiting factors in the three time periods, indicating that the economic efficiency effect is the most important factor contributing to the increase in carbon emissions. The economic efficiency effect of the iron and steel, petrochemicals, and paper industries had the most significant contribution to carbon emissions in 2010–2014, with their relative contribution values reaching 39.14%, 39.04%, and 35.08%. In 2014–2018, the promotion effect of economic efficiency significantly weakened; the relative contribution value of each industry, except for the electric power and chemical fiber industries, declined compared with the previous time period; and the electric power industry, which has the most significant economic efficiency effect, had a relative contribution value of 57.20%. The economic efficiency effect of each industry, except for the textile industry, declined compared with the 2010–2014 time period from 2018–2021, indicating that the relative contribution value of economic efficiency effect to carbon emissions is higher than that of 2010–2014. In 2018–2021, the economic efficiency effect of all industries except the textile industry decreased compared with that of 2010–2014, indicating that the promotion effect of economic efficiency effect on carbon emission of the industry as a whole shows a slowing trend, but at present it is still the most important factor that promotes the increase in carbon emission of the industry in the Zhejiang Province. Thus, determining how to take into account the economic efficiency and carbon emission reduction is an ongoing problem that needs to be solved.

4.4. Industry Structure Effect

The industry structure effect has always shown an inhibiting effect on carbon emissions in the three time periods of the textile industry and the electric power industry, in which the inhibiting effect on the electric power industry is gradually increasing, and the relative contribution to the inhibition of carbon emissions reached a maximum of −33.63% in 2018–2021. The industry structure effect of the eight industries in the Zhejiang Province fluctuates greatly in the direction of carbon emission influence in different time periods, and the number of industries in which the industry structure effect showed inhibition in 2010–2014 was four; the number of industries in which the industry structure effect showed inhibition in 2014–2018 was reduced to three; and the inhibition of the industry structure effect in 2018–2021 increased overall compared with that in 2014–2018, with the number of industries rising to five, of which the number of industries in which the industry structure effect showed inhibition in 2014–2018 rose to five. The number of industries rose to five, of which the paper and chemical fiber industries shifted from promotion to inhibition, and the chemical, petrochemical and building materials industries showed promotion, and the overall promotion was improved compared to that in 2014–2018. This shows that the level of industry structure of the eight industries in the Zhejiang Province has not been effectively optimized and adjusted, and the focus of future emission reduction in the Zhejiang Province can be placed on these energy-intensive industries. Green building materials products can be developed in the building materials industry to improve the added value of products and promote industrial transformation. In the petrochemical industry, the petrochemical and chemical industry can achieve industrial restructuring by reducing fossil energy consumption, such as by “replacing coal with electricity” and “replacing coal with gas”, among other measures to improve the green development of its industry added value.

4.5. Energy Intensity Effect

As a whole, the energy intensity effect has led to a significant reduction in carbon emissions in all three time periods, and is the most important factor in suppressing carbon emissions from the industry, which indicates that the energy efficiency level of the eight major industries in the Zhejiang Province has been continuously improved, and the eight industries have strengthened the renovation and upgrading of industrial energy-saving technologies during the production process, which has led to the outstanding contribution of the energy intensity effect to the reduction of carbon emissions. The industries whose energy intensity effects always inhibit carbon emissions are the building materials, chemical, paper and iron and steel industries, and their relative contributions in the three phases reached −44.14%, −31.27%, −31.28% and −27.52%, indicating that the building materials, chemical, iron and steel, and paper industries have higher levels of energy efficiency, and their energy intensity is on a downward trend during the study period. The energy intensity of building materials, chemical industry, iron and steel industry and paper industry decreased by 2.39 t of standard coal/million CNY, 0.96 t of standard coal/million CNY, 1.24 t of standard coal/million CNY and 2.05 t of standard coal/million CNY, respectively, with decreases of 61.74%, 50.57%, 43.90% and 43.72%, respectively, and the level of energy efficiency greatly improved. From 2018 to 2021, the inhibitory effect of energy intensity on carbon emissions decreased compared with the previous period, mainly due to the impact of the COVID-19 pandemic after 2020, the rise in foreign trade exports in the Zhejiang Province and the energy consumption of industrial enterprises that compensated for the increase in energy consumption, which exacerbated the increase in carbon emissions from the industry. The energy intensity effect of the power and petrochemical industries drive carbon emissions, especially the power industry. Its relative contribution to the average value was 12.47%. This is because the power industry’s energy intensity rose the most, reaching 33.75%, with a more obvious reduction in the level of energy efficiency. Therefore, in the future, the Zhejiang Province will focus on carbon emission reduction in the electric power industry and will put forward targeted suggestions and policies on how to reduce energy intensity and improve energy efficiency in this industry.

4.6. Energy Structure Effect

During the study period, the cumulative relative contribution of the energy structure effect to carbon emissions was −13.29%, indicating that the energy structure effect inhibited carbon emissions as a whole, but to a very limited extent. From 2010 to 2014, the number of industries in which the effect of energy structure was inhibitory was seven, and only the petrochemical industry was promotional, because the petrochemical industry has the highest consumption of fossil energy sources such as coal and oil, reaching 87.47%. This has an obvious promotional effect on carbon emissions due to the fact that the carbon emission coefficient of fossil energy is the highest. From 2014 to 2018, the power industry shifted from an inhibiting role to a facilitating role, probably due to the tight energy supply of the power industry during this period, which increased the use of high-carbon energy sources, such as coal, and led to an increase in carbon emissions. Five industries showed an inhibiting role from 2018 to 2021: petrochemicals, chemical fibers and the power industry. Although the overall fossil energy consumption of the eight industries in the Zhejiang Province from 2010 to 2021 shows a decreasing trend, as the consumption of electricity is rapidly increasing, although electricity is a clean energy source, the Zhejiang Province’s current electricity is still generated via coal-based thermal power generation, resulting in steady carbon emissions. For example, in the period of 2018–2021, the Zhejiang Province’s annual thermal power generation rose from 259.8 billion kilowatt-hours to 305.3 billion kWh, a 17.51% increase in thermal power generation. This indicates that in the case of yearly industrial electricity consumption increases, the Zhejiang Province should increase the construction of wind, light, water, nuclear and other clean energy power, slowing down the growth rate of thermal power generation, closing the high energy consumption and low output thermal power generating units; there should be greater reliance on their coastal advantages, and active promotion of the completion of the construction of offshore wind power cluster projects in coastal cities such as Jiaxing, Zhoushan, Ningbo, Taizhou, Wenzhou and so on. Additionally, we should promote the implementation of photovoltaic projects in the whole county to ensure that carbon emission reduction targets are achieved. At present, the energy consumption structure of the eight industries in the Zhejiang Province is still dominated by coal-based energy. High-carbon energy is still the most important source of energy in the industrial sector in the Zhejiang Province, the energy structure of a single and centralized situation has not been sufficiently improved, and on the road to optimize the energy structure of the eight industries in the Zhejiang Province, we still have a long way to go.

4.7. Carbon Emission Factor Effect

Since 2010, the carbon emission coefficient effect has made a non-negligible contribution to carbon emission reduction, and the carbon emission coefficients have always inhibited carbon emissions. The carbon emission coefficients of energy in the eight major industries in the Zhejiang Province follow the carbon emission coefficients stipulated in the IPCC report, in which the carbon emission coefficients of fossil energy sources, such as coal-based, oil-based and natural gas, are unchanged, whereas electricity and heat belong to the secondary energy sources, and thus the carbon emission coefficients change every year depending on the process technology and the type of energy source used. In recent years, China has been vigorously developing new power systems based on new energy sources, and although China is still dominated by thermal power generation, the proportion of hydropower, wind power, nuclear power, and solar photovoltaic power generation is increasing, in addition to the proportion of self-generated and self-consumed electricity in industrial parks in the Zhejiang Province. In June 2021, the Development and Reform Commission of the Zhejiang Province issued the ‘Renewable Energy Development’ report, which states that the total amount of new wind and solar energy generated in the Zhejiang Province is planned to increase from 17 million kilowatts in 2020 to 34 million kilowatts in 2025. This plan will also play an important role in carbon emission reduction in the industry in the Zhejiang Province.
Carbon emission contribution of each factor is presented in Figure 7.

5. Analysis of the Decoupling of Carbon Emissions and Economic Growth in Eight Major Industries in the Zhejiang Province

5.1. Velocity Decoupling Analysis

The decoupling status of carbon emissions and economic growth of eight major industries in the Zhejiang Province from 2010 to 2021 is calculated using the Tapio decoupling model, as shown in Table 5. The decoupling index of the eight high-carbon industries in the Zhejiang Province shows an upward trend as a whole, and all the other industries show a decoupling from 2010 to 2014, except for the chemical industry, which is connected by expansion. The decoupling index of the eight high-carbon industries in the Zhejiang Province shows an overall upward trend, and all the other industries show decoupling status except the chemical industry, which exhibited an expansion connection in 2010–2014. This indicates that the overall decoupling status of the high-carbon industries in the Zhejiang Province in this time period is good, and the development of the high-carbon industries in the Zhejiang Province is not in a serious situation because the high-carbon industries in the province are at the beginning of the upward trend, and the growth rate of carbon emissions is lower than the growth rate of the economic growth. The development of the high-carbon industries in the province has yet to become serious. The degree of decoupling of the chemical industry has increased from expansion connection to weak decoupling, and the petrochemical industry has changed from weak decoupling to expansion connection; the degree of decoupling of the paper, textile and electric power industries have all changed from strong decoupling to weak decoupling, and the decoupling status as a whole has deteriorated. This indicates that the Zhejiang Province is in a state of rapid economic development in this stage, and there is an urgent need to vigorously develop the industry, and the scale of the ‘high-energy-consuming, high-emission’ industries is rapidly expanding, exacerbating the growth of carbon emissions. From 2018 to 2021, the decoupling characteristics of carbon emissions of the eight major industries in the Zhejiang Province in this period included the expansion of negative decoupling, weak decoupling and strong decoupling types, with petrochemicals and chemical fibers in a poorer state of decoupling. This indicates that the petrochemical and chemical fiber industries are in an accelerated state of development in this time period, and the economic growth is more dependent on carbon emissions.

Analysis of Reasons for Decoupling

Since the decoupling model only explains the relationship between carbon emissions and economic development, and does not explain the reasons for the decoupling situation, in order to analyze the reasons for the changes in decoupling, this paper introduces the decoupling elasticity index and the energy efficiency elasticity index. The calculation formula is as follows [37]:
ε = ε 1 × ε 2 = Δ C / C Δ E / E × Δ E / E Δ G / G
where ε 1 represents the energy structure decoupling elasticity index; ε 2 represents the energy efficiency decoupling elasticity index.
As can be seen in Table 6, the eight industries as a whole were in a decoupled state from 2010 to 2018, and only the petrochemical industry was in an expansion connection, indicating that its energy consumption was increasing, while carbon emissions were also increasing. The growth rate of the two was comparable to that of the rest of the industries that were in a decoupled state, indicating that their energy structure had a better effect on emission reduction, and the chemical fiber industry shifted from a weak decoupling to an expansion connection in 2018–2021, indicating that the chemical fiber and petrochemical industries are still in a highly carbonized energy structure, and that they need to strengthen the application of cleaner energy technologies.
As can be seen from Table 7, from 2010 to 2014, the petrochemical and chemical fiber industries were expansion-connected, and the chemical industry was expansion-negative decoupled, mainly because of the increase in energy consumption; from 2014 to 2018, only the petrochemical and electric power industries were expansion-connected, and the rest of the industries were decoupled, indicating a reduction in the degree of dependence on energy consumption for economic growth; from 2018 to 2021, the petrochemical and chemical fiber industries were transformed and became expansion-negative decoupled, indicating that their economic growth came at the cost of excessive energy consumption, and that they had a low level of efficiency in the use of energy, and less effective energy saving.

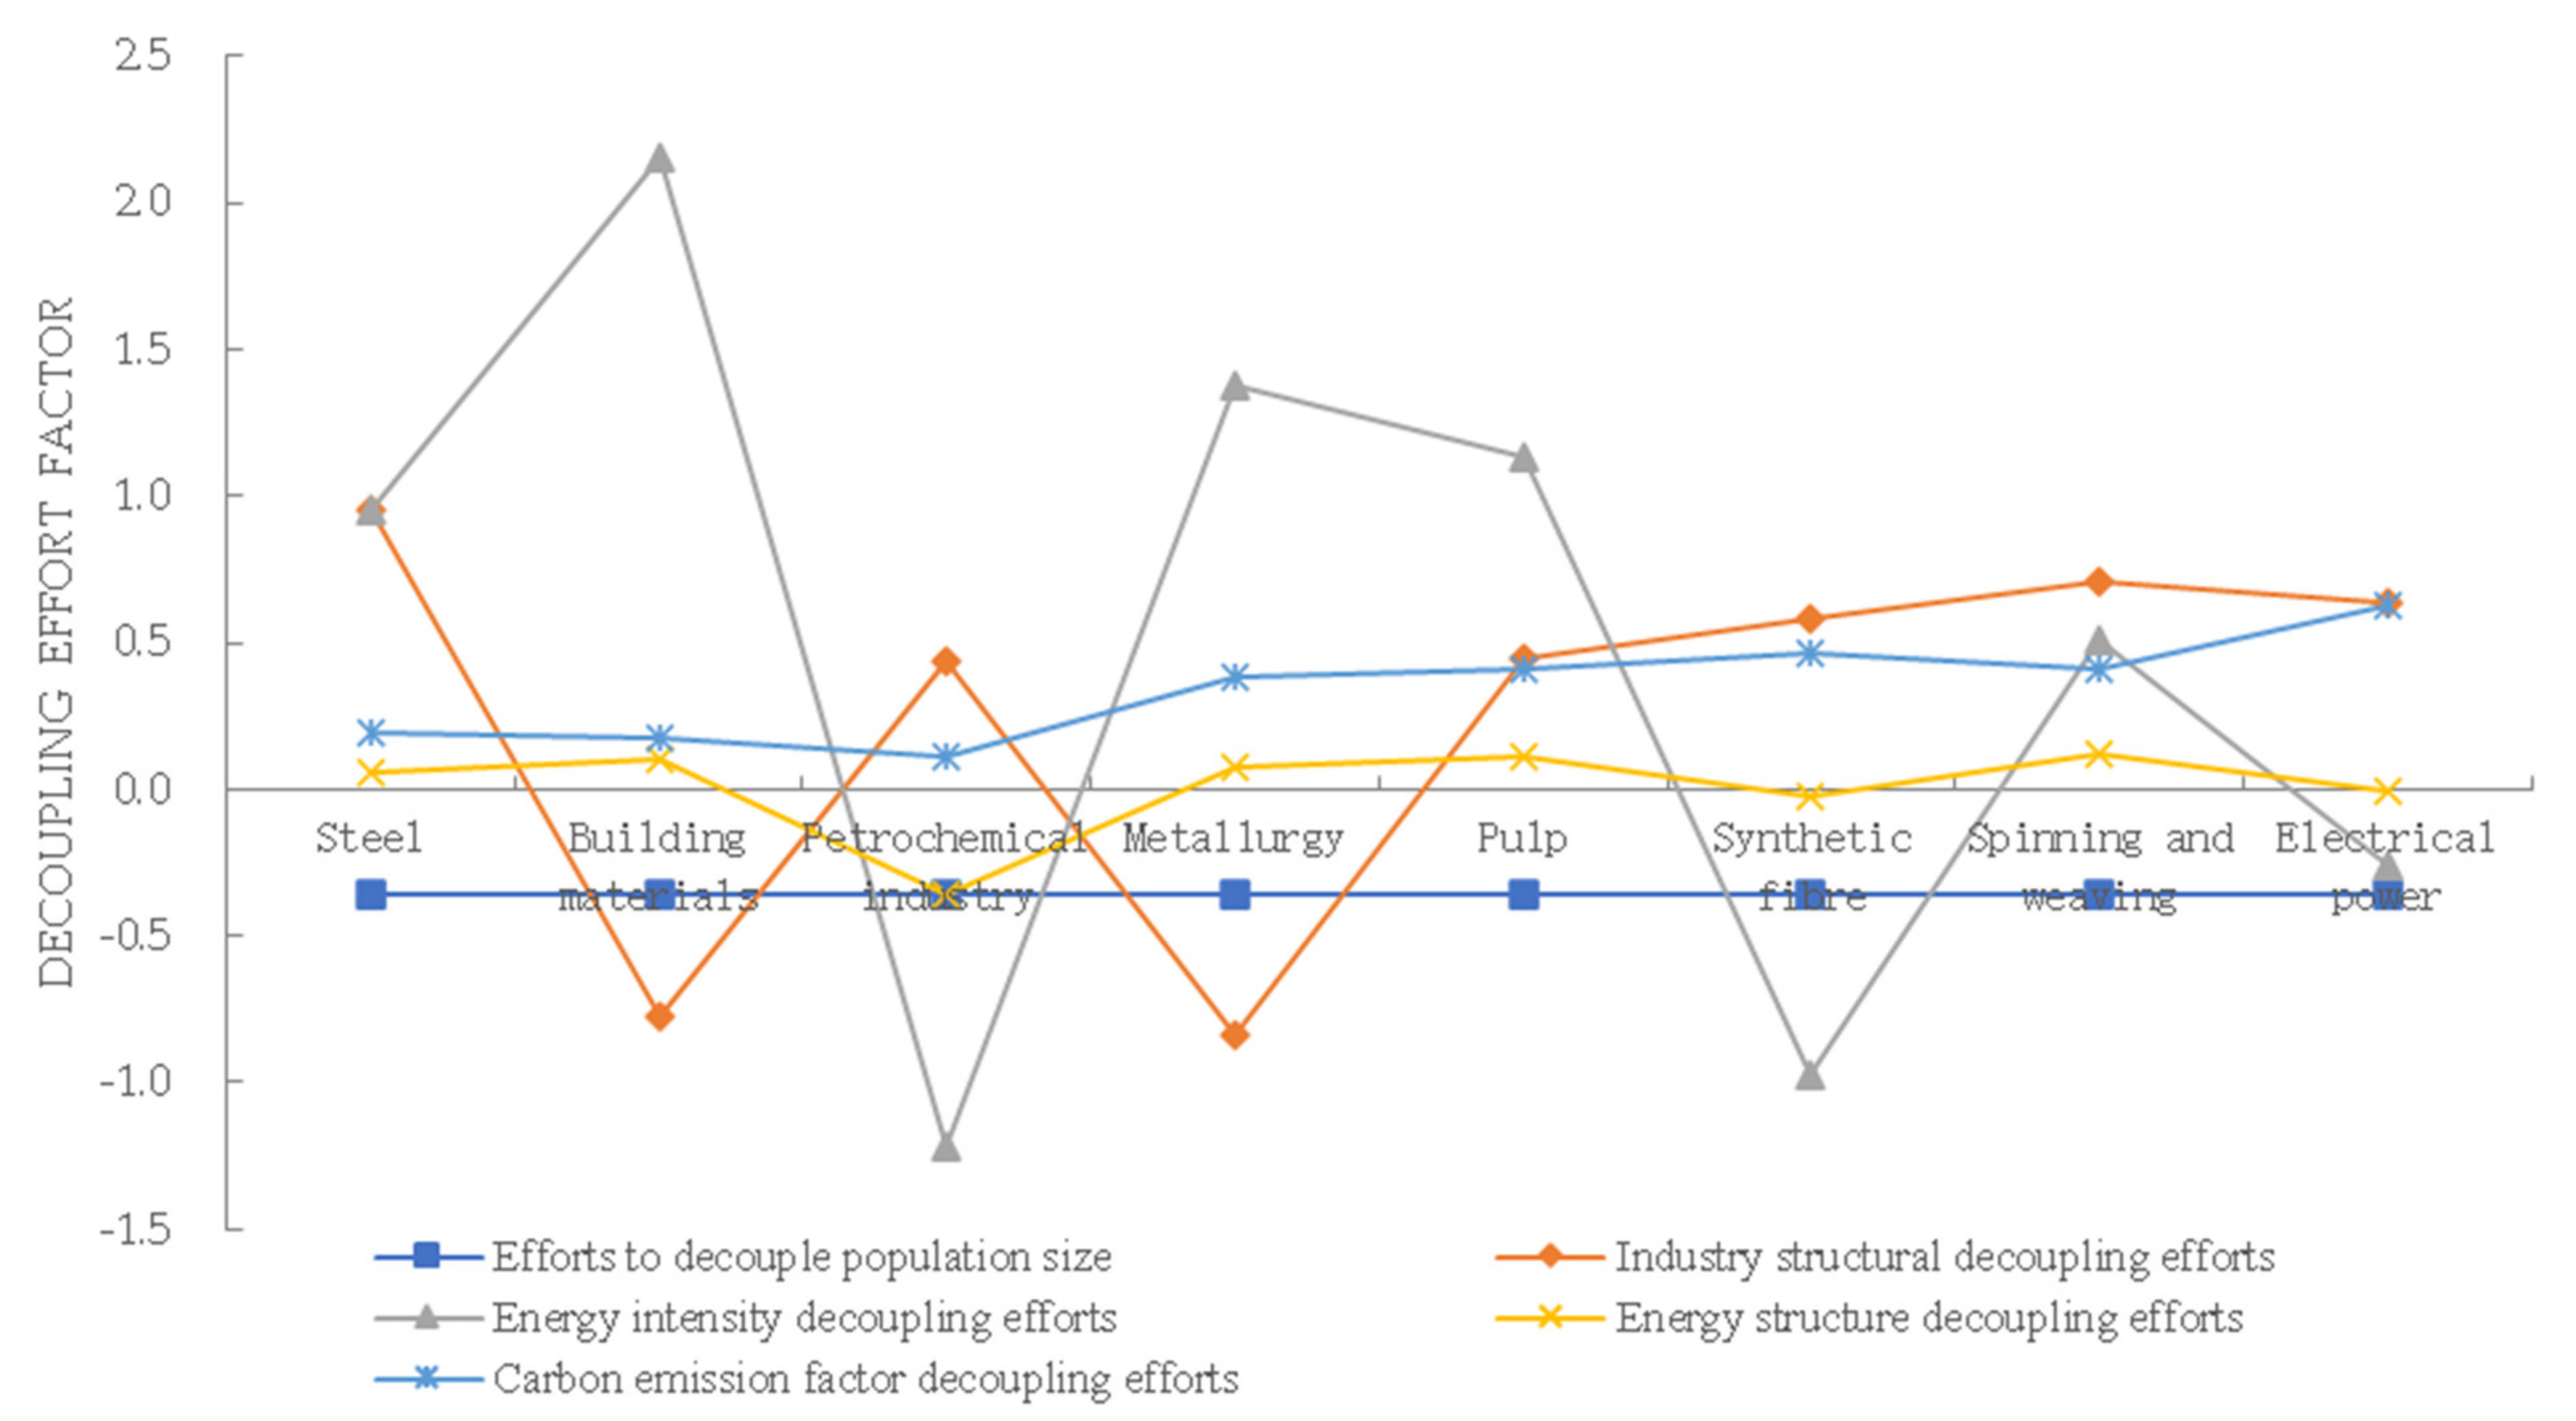
5.2. Analysis of Efforts to Decouple Carbon Emission Impact Factors

The decoupling effort model was constructed through the Tapio decoupling model and combined with the LMDI factor decomposition model to analyze the decoupling effort value of each influencing factor of the eight major industries in the Zhejiang Province. The purpose of this was to determine the degree of decoupling effort of each influencing factor, this is shown in Table 8 and Figure 8.
Table 8 shows that the population size effect of the eight industries in the Zhejiang Province made no decoupling efforts during the three study periods. The industry structure made different decoupling efforts for different industries during the three time periods. In 2010–2014, weak decoupling efforts were made for the industry structure effect in four industries, namely, building materials, petrochemicals, textiles and electric power industries. The value of decoupling efforts in the iron and steel industry shifted from negative to positive in 2014–2018, and the textile industry shifted from weak decoupling efforts to strong decoupling efforts; only the building materials and chemical industry did not make decoupling efforts in 2018–2021, and the textile industry made weak decoupling efforts, while the rest of the industries made strong decoupling efforts. This indicates that the Zhejiang Province has made greater efforts to optimize and adjust the structure of the industry and promotes a more rational structure for the eight major industries in the Zhejiang Province.
With regard to the energy intensity effect, the decoupling efforts of the building materials, chemical and paper industries in terms of the energy intensity effect have generally shown an upward trend over the three phases, indicating that the level of energy utilization in these industries has been improving and the correlation with economic growth has been weakening. However, the petrochemical, chemical fiber and electric power industries have not achieved an overall decoupling effort in terms of the energy intensity effect, so the energy efficiency levels of the petrochemical, chemical fiber and electric power industries have yet to be strengthened in the Zhejiang Province.
In terms of energy structure effects, during the study period, decoupling efforts were made in the iron and steel, building materials, chemical, paper and textile industries. Only the petrochemical industry did not make decoupling efforts, mainly because of its high consumption of petroleum-based energy and the continued dominance of fossil energy consumption in this industry. In the future, the Zhejiang Province needs to make efforts to increase the proportion of low-carbon raw materials in the petrochemical industry to achieve the reduction of carbon emissions from the root cause; and actively promote the complementary coupling of various energy sources, such as hydrogen, wind power and photovoltaic energy.
With regard to the carbon emission factor effect, during the study period, the carbon emission factor effect made decoupling efforts for all eight industries, among which the power industry had the highest value of decoupling efforts, mainly due to the fact that the power industry consumes the largest amount of electricity, and the carbon emission factor effect is changed mainly because of the different ways of generating electricity. In recent years, China’s wind power, photovoltaic, hydropower and nuclear power and other clean energy power accounted for an increasing proportion of the total, so the carbon emission coefficient effect has a significant decoupling effort.

6. Conclusions and Recommendations

6.1. Main Conclusions

Based on the LMDI factor decomposition method and Tapio decoupling model, this study analyzed the carbon emission driving factors of eight high-carbon industries in the Zhejiang Province from 2010 to 2021 and analyzed the decoupling efforts of carbon emission and economic development, and deeply studied the main reasons leading to the change in carbon emission in eight high-carbon industries in the Zhejiang Province. At the same time, the decoupling of economic development and carbon emissions was evaluated, and the following conclusions are drawn:
(1)
From the perspective of total carbon emissions, from 2010 to 2021, the total carbon emissions of eight industries in the Zhejiang Province increased by 24.312,200 t, and the total carbon emissions showed a continuous upward trend, but the overall carbon emission intensity showed a downward trend. In the total energy consumption of eight industries in 2021, the proportion of carbon emissions of fossil energy such as coal and petroleum was 32.70%, indicating that currently, in the energy consumption structure of eight industries in the Zhejiang Province, fossil energy consumption dominated by coal and petroleum still occupies a strong position, and there is still room for optimization of the energy consumption structure of eight industries in the Zhejiang Province.
(2)
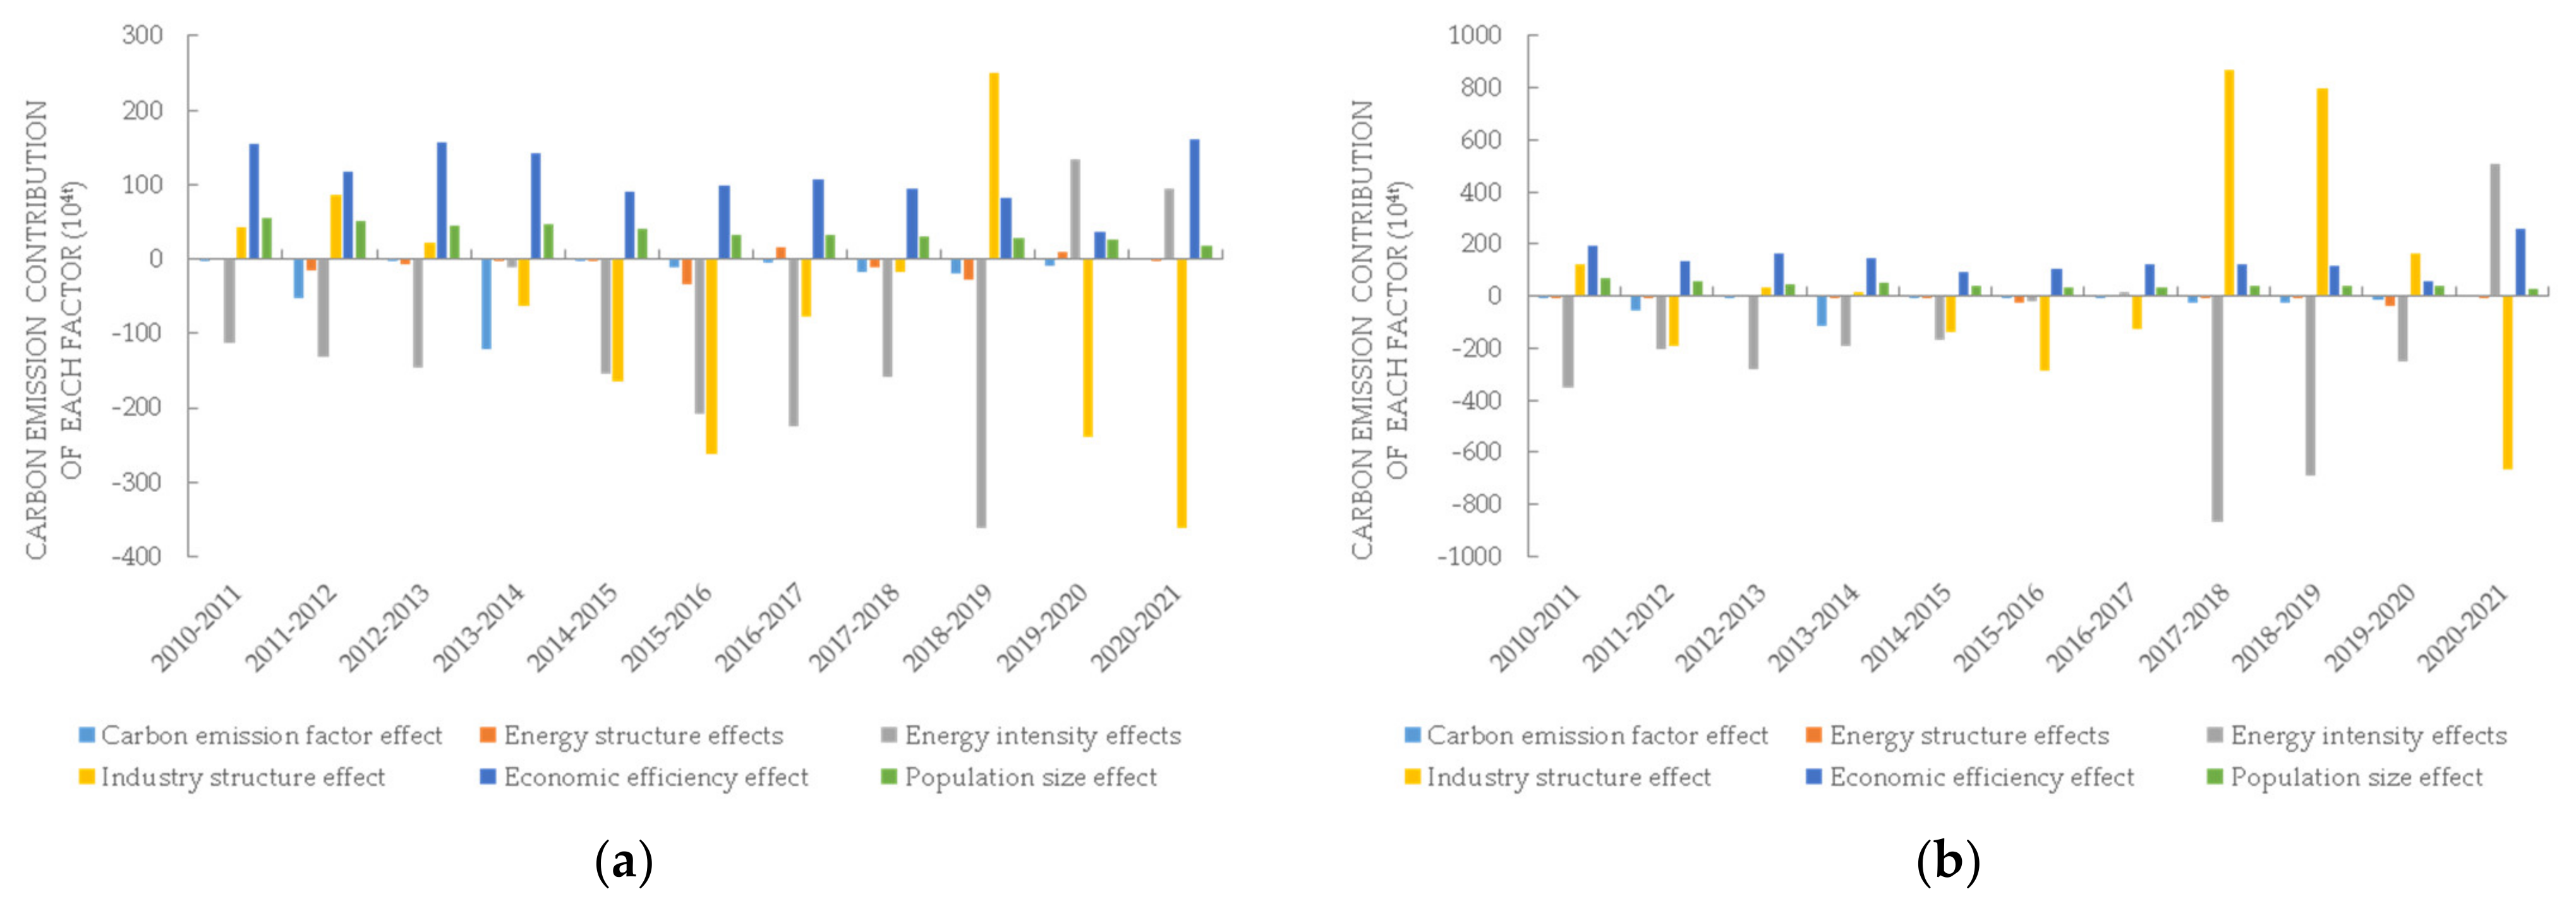
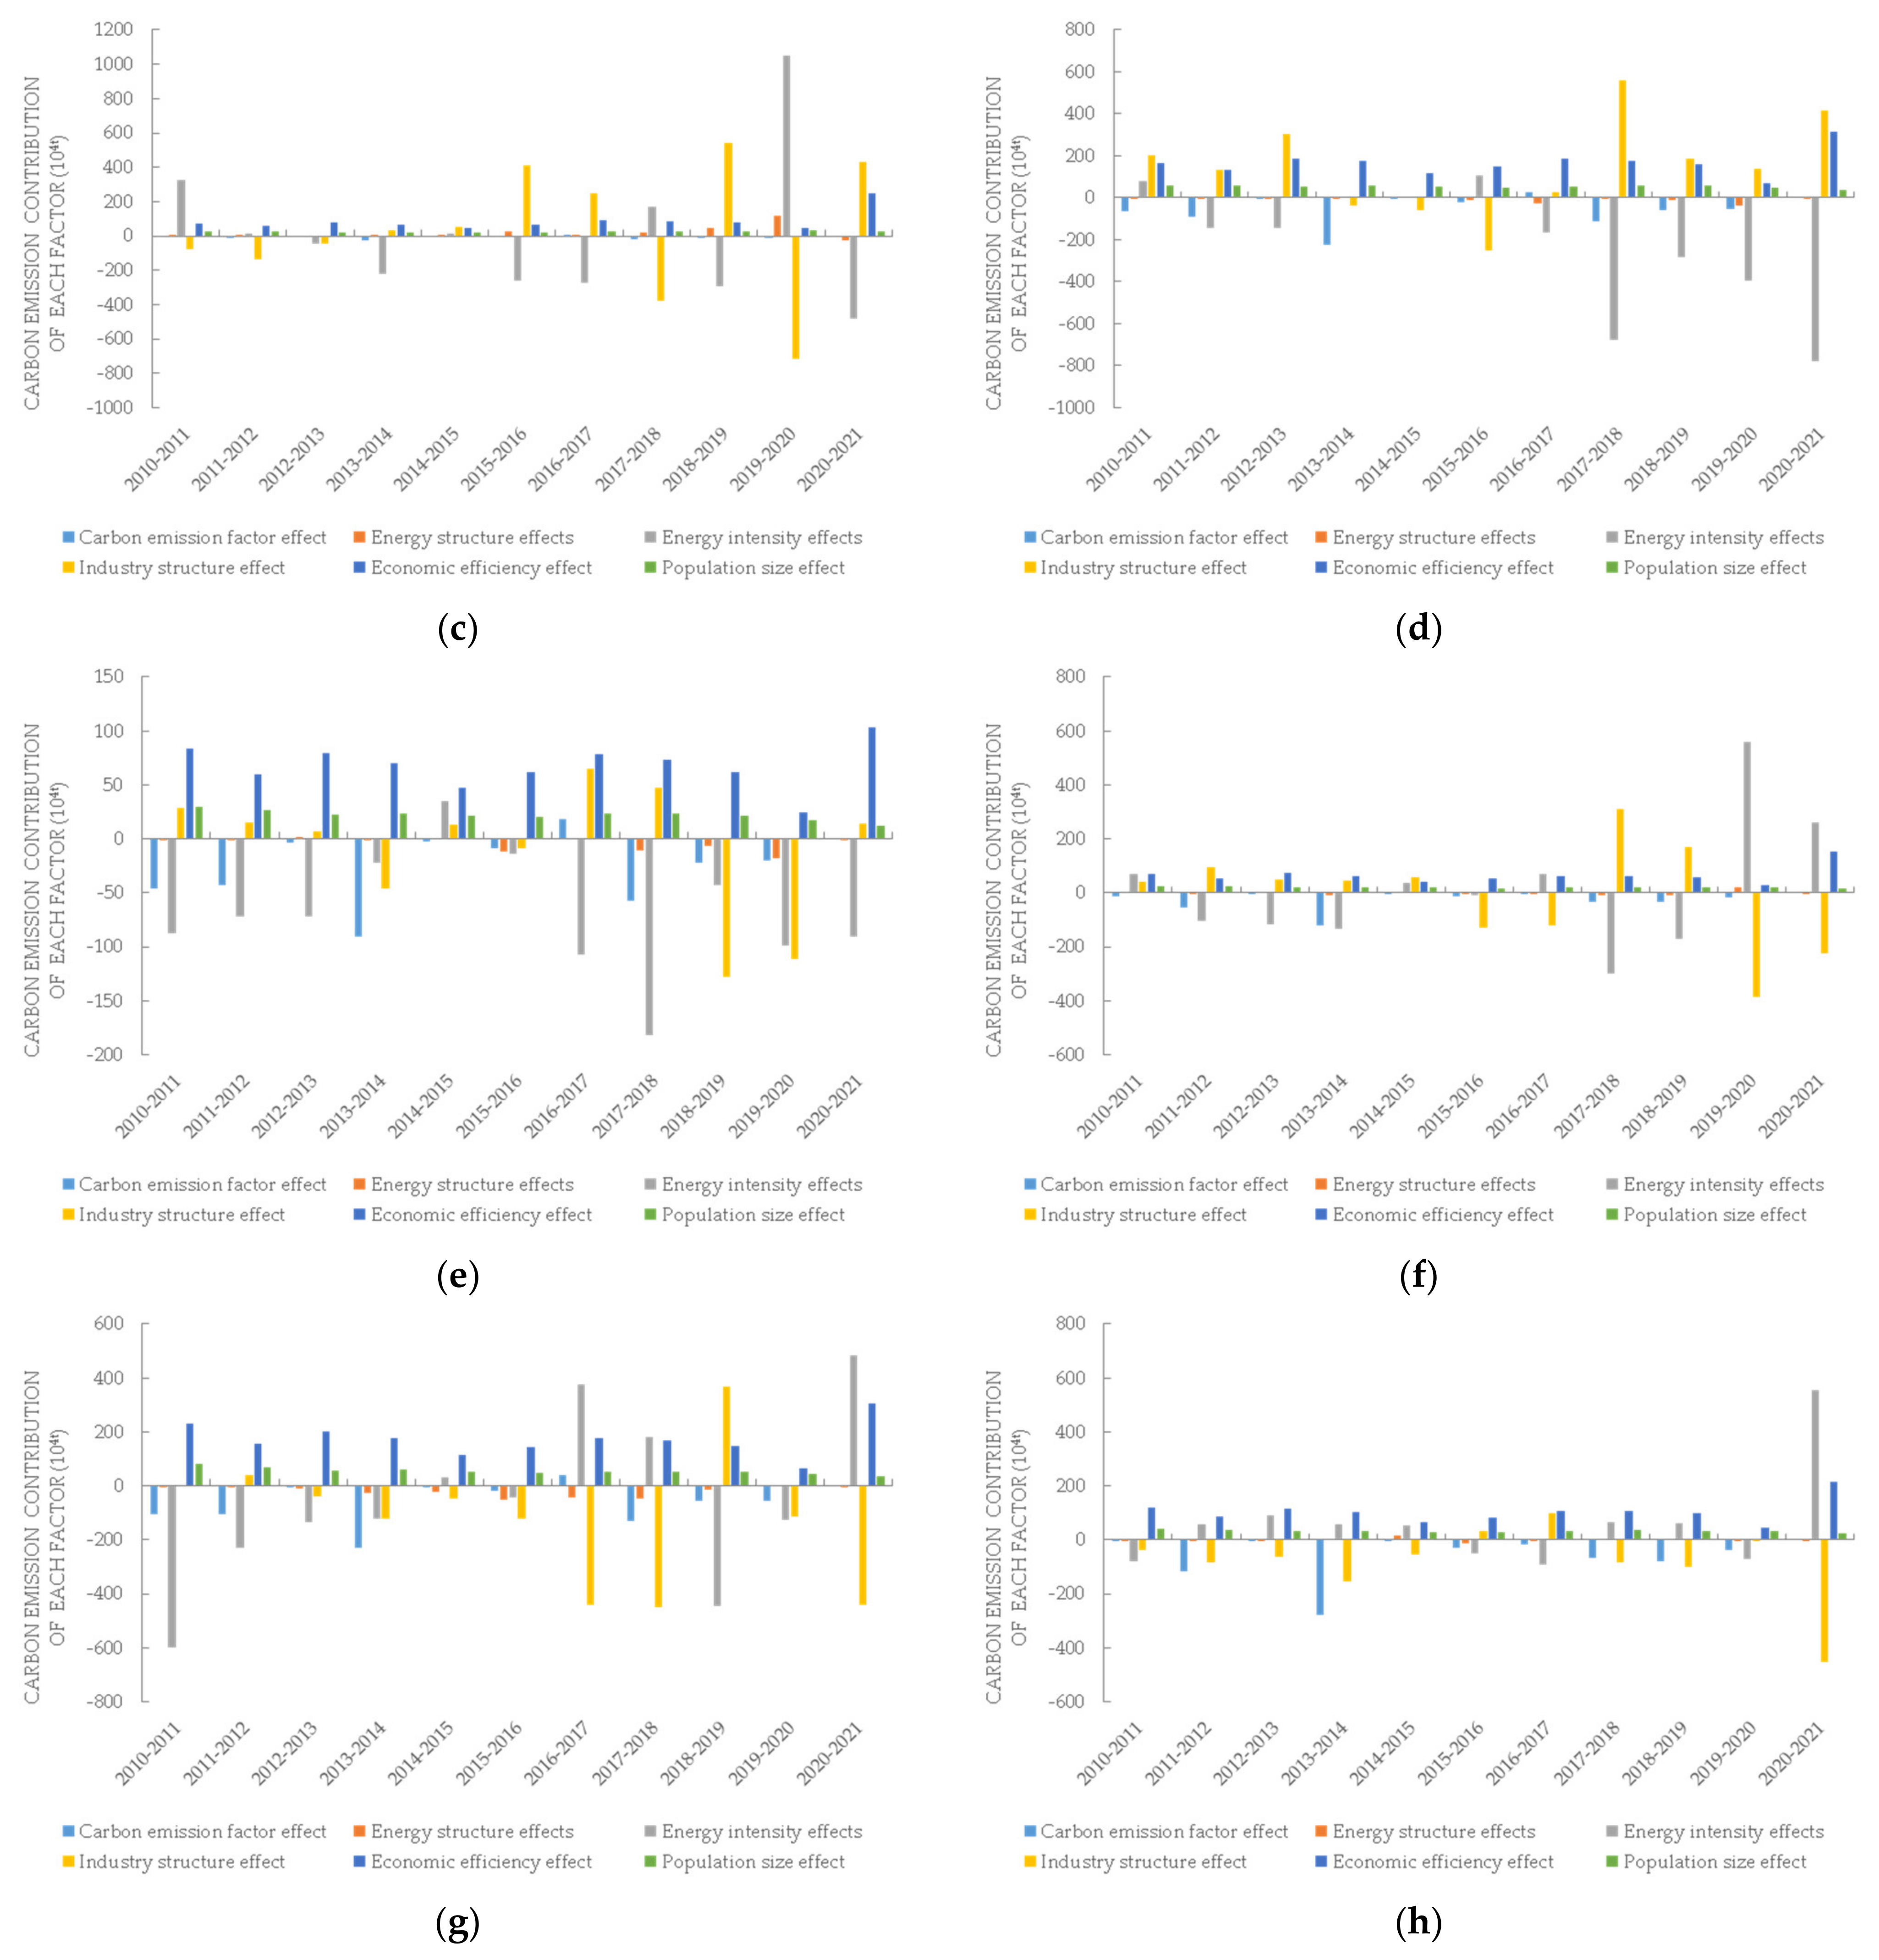
From the perspective of driving factors of carbon emissions, the growth of carbon emissions is mainly caused by the economic growth effect and the population size effect, among which the economic growth effect is the most important driving factor. Among the eight industries in the Zhejiang Province, the main factors inhibiting carbon emissions are the energy intensity effect and the energy structure effect, but the overall inhibition effect weakened from 2018 to 2021, indicating that the energy consumption of the eight industries in the Zhejiang Province is growing rapidly, and the energy structure has not been well optimized and adjusted. Energy use intensity and energy use structure are still the most important research directions in the pursuit of industry carbon emission reduction. The effect of industry structure on different industries is different. The effect of industry structure in steel, paper making, chemical fiber, textile and power industry mainly inhibits the effect, while the effect of industry structure in building materials, petrochemical and chemical industry generally has a promoting effect. During the study period, the effect of the carbon emission coefficient always inhibits carbon emissions and is an important factor in reducing carbon emissions.
(3)
From the perspective of speed decoupling and decoupling efforts of driving factors, the decoupling coefficient of the eight major industries is on the rise as a whole. Except petrochemical and chemical fiber industries, the remaining industries have realized the decoupling of carbon emissions and economic growth. The most important factors that have not decoupled economic growth from carbon emissions are the unreasonable industry structure and the gradual expansion of population size.

6.2. Policy Recommendations

Based on the above conclusions, the following suggestions are proposed to promote the carbon emission reduction of eight high-carbon industries in the Zhejiang Province: (1) Clarify the emission reduction key directions of various industries and optimize the energy structure of the industry. Strengthen restrictions on total energy consumption and total carbon emissions in the petrochemical, chemical, chemical fiber and power industries. Optimize the energy structure of the petrochemical, building materials and steel industries, and encourage the use of clean energy such as hydropower, wind power and photovoltaics to replace fossil energy. (2) Improve energy efficiency. Make full use of low-carbon production technology and energy-saving equipment, increase scientific research efforts, promote technological innovation, so as to promote industry energy efficiency, promote energy intensity reduction and ultimately accelerate the decoupling between economic growth and carbon emissions. (3) Promote the optimization and upgrading of industrial structure and accelerate the development of high-end industries. Actively promote various industries to adapt to the new normal of China’s economic development, especially the elimination of backward and excess capacity in traditional industries such as building materials, petrochemicals and chemicals. Accelerate the transformation of the structure of high-end manufacturing industries such as computers and electronic equipment and improve the quality of industry development. (4) Change the economic development mode of the industry. The shift from economic dependence on fossil energy to technological dependence, the increase in carbon emission tax mechanism for industries with high energy consumption and low output such as chemical fiber and petrochemical industry, and the forced carbon emission reduction of industries are conducive to further realizing the strong decoupling of carbon emissions and economic development. (5) Formulate carbon emission reduction policies and action plans according to the different characteristics of the development status of various industries. In combination with the historical carbon emission level, economic development level and emission reduction potential of various industries, further improve the industrial carbon emission reduction system in the Zhejiang Province, take key industries as the dimension, make statistical analysis of energy consumption and carbon emission of the industry, identify the key management and management investment industries, and provide support for the government to guide various industries to make reasonable production plans and formulate carbon emission quotas, among other business strategies.

6.3. Limitation and Future Studies

This paper has important practical significance for realizing the goal of carbon emission reduction and low-carbon transformation of industrial structure in the Zhejiang Province, improving industrial energy efficiency, and formulating relevant carbon emission reduction policies. However, this paper still has some limitations. This paper focuses on the driving factors and decoupling of carbon emissions of high-carbon industries in the Zhejiang Province, while other industries with relatively low carbon emissions are not involved. Future studies on other industries in the Zhejiang Province can be increased. At the same time, the peak value and time of carbon peaking in high-carbon industries in the Zhejiang Province is also a point worth paying attention to. In future studies, researchers can investigate and and analyze the peak value and time of carbon peaking in their industries to provide a theoretical basis for the Zhejiang Province to realize the goal of “double carbon” as soon as possible.

Author Contributions

All authors contributed to the study’s conception and design. Material preparation and analysis were performed by Y.X., C.Y. and W.H. The first draft of the manuscript was written by C.Y.; H.W. provided data support and valuable advice regarding the experimental design. All authors commented on previous versions of the manuscript. All authors have read and agreed to the published version of the manuscript.

Funding

This research was funded by National Social Science Fund of China, grant number 19BGL003; the Science and Technology Project of State Grid Corporation Headquarters, grant number SGTYHT/21-JS-223.

Institutional Review Board Statement

Not applicable.

Informed Consent Statement

Not applicable.

Data Availability Statement

The initial data for the paper mainly originated from the National Grid New Energy Platform (NO. SGTYHT/21-JS-223). The data mentioned in the dissertation can be disclosed; other data cannot be disclosed due to confidentiality issues.

Conflicts of Interest

Author H.W. has received research grants from State Grid Corporation. The funders had no role in the design of the study; in the collection, analyses, or interpretation of data; in the writing of the manuscript; or in the decision to publish the results. The other authors declare no conflicts of interest.

References

  1. Zhu, B.Z.; Su, B.; Li, Y.Z. Input–output and structural decomposition analysis of India’s carbon emissions and intensity. 2007/08–2013/14. Appl. Energy 2018, 230, 1545–1556. [Google Scholar] [CrossRef]
  2. Green, F.; Stern, N. China’s changing economy: Implications for its carbon dioxide emissions. Clim. Policy 2017, 17, 423–442. [Google Scholar] [CrossRef]
  3. Chen, H.; Qi, S.; Zhang, J. Towards carbon neutrality with Chinese characteristics: From an integrated perspective of economic growth-equity-environment. Appl. Energy 2022, 324, 119719. [Google Scholar] [CrossRef]
  4. Tang, L.; Yang, J. Towards a low-carbon future for China’s power supply chain: Critical sectors identification and scenario analysis. J. Environ. Manag. 2023, 347, 119115. [Google Scholar] [CrossRef] [PubMed]
  5. Chen, S.M. The present situation and prospect of low carbon industrial development in China. City 2022, 1, 63–69. [Google Scholar]
  6. Gu, R.; Li, C.; Li, D.; Yang, Y.; Gu, S. The Impact of Rationalizatin and Upgrading of Industrial Structure on Carbon Emissions in the Beijing-Tianjin-Hebei Urban Agglomeration. Int. J. Environ. Res. Public Health 2022, 19, 7997. [Google Scholar] [CrossRef]
  7. Kim, J.; Lim, H.; Jo, H.H. Do aging and low fertility reduce carbon emissions in Korea? Evidence from IPAT augmented EKC analysis. Int. J. Environ. Res. Public Health 2020, 17, 2972. [Google Scholar] [CrossRef]
  8. Georgescu, I.; Kinnunen, J. The role of foreign dirsect investments, urbanization, productivity, and energy consumption in Finland’s carbon emissions: An ARDL approach. Environ. Sci. Pollut. Res. 2023, 30, 87685–87694. [Google Scholar] [CrossRef] [PubMed]
  9. Fang, P. Short-term carbon emission prediction method of green building based on IPAT model. Int. J. Glob. Energy Issues 2023, 45, 1–13. [Google Scholar]
  10. Cui, H.; Wang, H.; Zhao, Q. A study on the factors influencing regional carbon emissions in China based on dynamic panel model. Sci. Technol. Manag. Res. 2019, 39, 238–244. [Google Scholar]
  11. Chontanawat, J. Decomposition analysis of CO2 emission in ASEAN: An extended IPAT model. Energy Procedia 2018, 153, 186–190. [Google Scholar] [CrossRef]
  12. Shan, S.; Genç, S.Y.; Kamran, H.W.; Dinca, G. Role of green technology innovation and renewable energy in carbon neutrality: A sustainable investigation from Turkey. J. Environ. Manag. 2021, 294, 113004. [Google Scholar] [CrossRef]
  13. Cheng, Z.; Hu, X. The effects of urbanization and urban sprawl on CO2 emissions in China. Environ. Dev. Sustain. 2023, 25, 1792–1808. [Google Scholar] [CrossRef]
  14. Su, B.; Ang, B.W. Multi-region comparisons of emission performance: The structural decomposition analysis approach. Ecol. Indic. 2016, 67, 78–87. [Google Scholar] [CrossRef]
  15. Wang, H.; Ang, B.W.; Su, B. Multiplicative structural decomposition analysis of energy and emission intensities: Some method-ological issues. Energy 2017, 123, 47–63. [Google Scholar] [CrossRef]
  16. Ang, B.W.; Goh, T. Index decomposition analysis for comparing emission scenarios: Applications and challenges. Energy Econ. 2019, 83, 74–87. [Google Scholar] [CrossRef]
  17. Zhang, C.; Su, B.; Zhou, K.; Yang, S. Analysis of electricity consumption in China (1990–2016) using index decomposition and decoupling approach. J. Clean. Prod. 2019, 209, 224–235. [Google Scholar] [CrossRef]
  18. Wang, W.; Li, M.; Zhang, M. Study on the changes of the decoupling indicator between energy-related CO2 emission and GDP in China. Energy 2017, 128, 11–18. [Google Scholar] [CrossRef]
  19. Lin, X.; Zhang, Y.; Zou, C.; Peng, L. CO2 emission characteristics and reduction responsibility of industrial subsectors in China. Sci. Total Environ. 2020, 699, 134386. [Google Scholar] [CrossRef]
  20. Zhang, M.; Bai, C. Exploring the influencing factors and decoupling state of residential energy consumption in Shandong. J. Clean. Prod. 2018, 194, 253–262. [Google Scholar] [CrossRef]
  21. Cai, H.; Qu, S.; Wang, M. Changes in China’s carbon footprint and driving factors based on newly constructed time series input–output tables from 2009 to 2016. Sci. Total Environ. 2020, 711, 134555. [Google Scholar] [CrossRef] [PubMed]
  22. Ortega-Ruiz, G.; Mena-Nieto, A.; García-Ramos, J.E. Is India on the right pathway to reduce CO2 emissions? Decomposing an enlarged Kaya identity using the LMDI method for the period 1990–2016. Sci. Total Environ. 2020, 737, 139638. [Google Scholar] [CrossRef] [PubMed]
  23. Gu, S.; Fu, B.T.; Thriveni, T.; Fujita, T.; Ahn, J. Coupled LMDI and system dynamics model for estimating urban CO2 emission mitigation potential in Shanghai, China. J. Clean. Prod. 2019, 240, 118034. [Google Scholar] [CrossRef]
  24. Chen, M.; Zhang, C.; Chen, C.; Li, J.; Cui, W. Main Pathways of Carbon Reduction in Cities under the Target of Carbon Peaking: A Case Study of Nanjing, China. Sustainability 2023, 15, 8917. [Google Scholar] [CrossRef]
  25. Hao, J.; Gao, F.; Fang, X.; Nong, X.; Zhang, Y.; Hong, F. Multi-factor decomposition and multi-scenario prediction decoupling analysis of China’s carbon emission under dual carbon goal. Sci. Total Environ. 2022, 841, 156788. [Google Scholar] [CrossRef] [PubMed]
  26. Han, Y.; Zhang, J.; Yuan, M. Carbon emissions and economic growth in the Yellow River Basin: Decoupling and driving factors. Front. Environ. Sci. 2022, 10, 2466. [Google Scholar] [CrossRef]
  27. Dong, J.; Li, C.B.; Wang, Q.Q. Decomposition of carbon emission and its decoupling analysis and prediction with economic development: A case study of industrial sectors in Henan Province. J. Clean. Prod. 2021, 321, 129019. [Google Scholar] [CrossRef]
  28. Yu, J.; Shao, C.; Xue, C.; Hu, H. China’s aircraft-related CO2 emissions: Decomposition analysis, decoupling status, and future trends. Energy Policy 2020, 138, 111215. [Google Scholar] [CrossRef]
  29. Wu, Y.; Tam, V.W.; Shuai, C.; Shen, L.; Zhang, Y.; Liao, S. Decoupling China’s economic growth from carbon emissions: Empirical studies from 30 Chinese provinces (2001–2015). Sci. Total Environ. 2019, 656, 576–588. [Google Scholar] [CrossRef]
  30. Wang, Q.; Wang, S.S.; Tang, Y.B. A comparison of decomposition the carbon emissions from economic growth in transport sector of selected provinces in eastern, central and Western China. J. Clean. Prod. 2019, 229, 570–581. [Google Scholar] [CrossRef]
  31. Liu, K.; Zhao, M.; Xie, X.; Zhou, Q. Study on the Decoupling Relationship and Rebound Effect between Economic Growth and Carbon Emissions in Central China. Sustainability 2022, 14, 10233. [Google Scholar] [CrossRef]
  32. Simbi, C.H.; Lin, J.; Yang, D.; Ndayishimiye, J.C.; Liu, Y.; Li, H.; Xu, L.; Ma, W. Decomposition and decoupling analysis of carbon dioxide emissions in African countries during 1984–2014. J. Environ. Sci. 2021, 102, 85–98. [Google Scholar] [CrossRef] [PubMed]
  33. Amir, I.; Tang, X.; Jahangir, S.; Yang, Y.; Rasool, S.F. Decoupling mechanism of industry carbon emissions, carbon intensity and economic growth in Pakistan. Indoor Built Environ. 2023, 32. [Google Scholar] [CrossRef]
  34. Zhang, Z.; Xie, H.; Zhang, J.; Wang, X.; Wei, J.; Quan, X. Prediction and trend analysis of regional industrial carbon emission in China: A study of NanJing city. Int. J. Environ. Res. Public Health 2022, 19, 7165. [Google Scholar] [CrossRef]
  35. Chen, F.; Zhao, T.; Wang, D. Research on China cities’ total factor productivity of carbon emission: Based on decoupling effect. Int. J. Environ. Res. Public Health 2022, 19, 2007. [Google Scholar] [CrossRef]
  36. Jiang, Q.; Lin, J.; Wei, Q.; Zhang, R.; Fu, H. Demystifying the Economic Growth and CO2 Nexus in Fujian’s Key Industries Based on Decoupling and LMDI Model. Sustainability 2023, 15, 3863. [Google Scholar] [CrossRef]
  37. Moutinho, V.; Moreira, A.C.; Silva, P.M. The driving forces of change in energy-related CO2 emissions in Eastern, Western, Northern and Southern Europe: The LMDI approach to decomposition analysis. Renew. Sustain. Energy Rev. 2015, 50, 1485–1499. [Google Scholar] [CrossRef]
  38. Cui, Q.; Jia, Z. Transfer of embodied carbon emissions from provincial transportation industry in China. Multimodal Transp. 2023, 2, 100105. [Google Scholar] [CrossRef]
Figure 1. Paper technology roadmap.
Sustainability 15 15975 g001
Figure 2. Total carbon emissions from eight high-carbon industries in the Zhejiang Province from 2010 to 2021.
Sustainability 15 15975 g002
Figure 3. Carbon emission intensity of eight high-carbon industries in The Zhejiang Province from 2010 to 2021.
Sustainability 15 15975 g003
Figure 4. Energy consumption intensity of eight high-carbon industries in the Zhejiang Province from 2010 to 2021.
Sustainability 15 15975 g004
Figure 5. Energy consumption structure of high carbon industry in the Zhejiang Province from 2010 to 2021.
Sustainability 15 15975 g005
Figure 6. Contribution value of each driver of carbon emissions of eight major high-carbon industries in the Zhejiang Province from 2010 to 2021.
Sustainability 15 15975 g006
Figure 7. (a) Steel; (b) building materials; (c) petrochemical industry; (d) metallurgy; (e) pulp; (f) synthetic fiber; (g) spinning and weaving; (h) electrical power [38].
Sustainability 15 15975 g007aSustainability 15 15975 g007b
Figure 8. Relative contribution of various drivers of carbon emissions in eight high−carbon industries in the Zhejiang Province from 2010 to 2021 [38].
Sustainability 15 15975 g008
Table 1. A summary of past carbon emission factors [25].
LiteratureObject/PeriodMethodsFindings
Kim et al. (2020) [7]16 provinces in Korea (1998–2016)EKC and IPAT modelYounger Pop (+)
Pop aging (−)
Georgescu and Kinnunen (2023) [8]Finland (2000–2020)ARDLEC (+)
LP (−) and URB (−)
Chontanawat (2018) [11]Association of Southeast Asian Nations (1971–2013)IPATPop, IPC (+)
EUE (−)
Shan et al. (2021) [12]Turkey (1990–2018)STIRPAT and ARDLEC, Pop, IPC (+)
GTI, REC (−)
Cheng et al. (2023) [13]Chinese cities (1997–2018)STIRPAT and OLSUL, US (+)
Cai et al. (2020) [21]China (2009–2016)SDAEI, PI (−)
Ortega-Ruiz et al. (2020) [22]India (1990–2016)LMDIGDP (+)
EI (−)
Gu et al. (2020) [23]Shanghai in China
(1995–2016)
LMDI and SDGDP (+)
EI, ES, EC (−)
Chen et al. (2023) [24]Nanjing in China
(2020–2035)
LEAP and LMDIEI, CI (−)
Note: “+”: promote; “−”: inhibitory. Variables: population size (POP); energy consumption (EC); labor productivity (LP); urbanization (URB); income per capita (IPC); energy use efficiency (EUE); green technology innovation (GTI); renewable energy consumption (REC); urbanization level (UL); urban sprawl (US); emission intensity (EI); primary input (PI); economic growth (GDP); economic structure (ES); emission coefficient (EC); carbon intensity (Ci). Methods: environmental kuznets curve (EKC); auto-regressive distributed lag (ARDL); structural decomposition analysis (SDA); system dynamics (SD); long-range energy alternatives planning system (LEAP).
Table 2. A summary of past carbon emission decoupling [25].
LiteratureObject/PeriodMethodsFindings
Han et al. (2020) [26]30 provinces in China (2006–2018)Tapio decoupling and LMDIGradual shift towards strong decoupling.
Dong et al. (2021) [27]Industrial sector in Henan, China (2006–2018)Tapio decoupling and LMDIDeclining trend in the decoupling index.
Yu et al. (2020) [28]Civil Aviation Administration of China (1979–2016)Tapio decouplingMostly expansive decoupling.
Wu et al. (2019) [29]30 provinces in China (2001–2015)Tapio decoupling and LMDIGDP and CI; mostly strong decoupling.
Wang et al. (2019) [30]China’s transport sector (2000–2016)Tapio decouplingDecoupling has taken place in the east, but has not yet stabilized in the central and western regions.
Liu et al. (2022) [31]Six provinces in central China (2000–2019)Decoupling elasticity coefficientMostly weak decoupling
Simbi et al. (2021) [32]African countries
(1984–2014)
Gravity model, Tapio
decoupling and LMDI
In Central Africa and Zimbabwe, decoupling of industrial structure and carbon efficiency has not yet been achieved.
Amir al. (2023) [33]Pakistan’s industrial sector (1991–2018)Tapio decouplingUnstable decoupling status for most of the period.
Table 3. Discriminant of the degree of decoupling of carbon emissions from economic growth.
Classification of DecouplingDecoupling Status Δ C / C 0 Δ G / G 0 ε
DecouplingWeak decoupling++0 < ε < 0.8
Strong decoupling+ ε < 0
Recession decoupling ε > 1.2
Negative decouplingWeak negative decoupling0 < ε < 0.8
Strong negative decoupling+ ε < 0
Expansion negative decoupling++ ε > 1.2
ConnectionGrowing connection++0.8 < ε < 1.2
Decaying connection0.8 < ε < 1.2
Table 4. Decomposition of carbon emission drivers for eight high-carbon sectors in the Zhejiang Province from 2010 to 2021 (relative contribution, %).
TimeEffectSteelBuilding MaterialsPetrochemical IndustryMetallurgyPulpSynthetic FiberSpinning and WeavingElectrical Power
2010–2014 Δ C C I −12.00−8.07−5.47−18.65−21.83−17.65−16.53−27.85
Δ C E S −1.68−0.401.06−0.35−0.17−0.41−1.44−0.26
Δ C E I −27.52−49.0810.05−9.64−30.26−26.83−39.778.54
Δ C S I 6.01−0.89−30.7328.850.4121.95−4.34−23.81
Δ C Q P 39.1430.7839.0431.5435.0824.5828.1029.32
Δ C P 13.6510.7913.6510.9612.258.589.8210.22
2014–2018 Δ C C I −1.75−1.89−1.86−5.62−6.15−7.21−4.31−17.95
Δ C E S −1.65−1.754.65−2.26−2.69−1.77−5.980.48
Δ C E I −40.09−51.35−30.93−36.38−33.23−29.8120.49−3.63
Δ C S I −28.1515.7229.3113.7714.5717.37−39.24−1.32
Δ C Q P 21.0621.8024.8731.3132.3632.6922.3657.20
Δ C P 7.307.498.3810.6610.9911.157.6219.42
2018–2021 Δ C C I −3.07−2.85−1.97−3.69−5.63−3.47−10.56−6.93
Δ C E S −2.15−3.3712.06−1.52−3.230.77−1.420.18
Δ C E I −14.95−32.0023.35−47.79−30.3444.69−8.0832.49
Δ C S I −39.8221.8122.5624.37−29.45−30.63−17.95−33.63
Δ C Q P 31.7031.8332.3317.9324.7216.4349.3421.37
Δ C P 8.318.157.734.706.624.0112.655.41
Table 5. Decoupling of carbon emissions from eight major industries in the Zhejiang Province from 2010 to 2021.
Sector2010–20142014–20182018–2021
ε Decoupling State ε Decoupling State ε Decoupling State
Steel0.335Weak decoupling−1.347Strong decoupling−0.470Strong decoupling
Building materials−0.380Strong decoupling−0.280Strong decoupling0.603Weak decoupling
Petrochemical industry0.750Weak decoupling1.191Growing connection2.768Expansion negative decoupling
Metallurgy1.094Growing connection 0.272Weak decoupling−0.244Strong decoupling
Pulp−0.088Strong decoupling0.409Weak decoupling−0.990Strong decoupling
Synthetic fiber0.406Weak decoupling0.560Weak decoupling1.597Expansion negative decoupling
Spinning and weaving−0.574Strong decoupling0.049Weak decoupling0.404Weak decoupling
Electrical power−0.060Strong decoupling0.710Weak decoupling0.710Weak decoupling
Note: ε  is the decoupling factor.
Table 6. Energy structure decoupling elasticity index of eight industries in the Zhejiang Province from 2010 to 2021.
Sector2010–20142014–20182018–2021
ε 1 Decoupling State ε 1 Decoupling State ε 1 Decoupling State
Steel0.571Weak decoupling1.084Decaying connection1.339Recession decoupling
Building materials2.062Recession decoupling1.740Recession decoupling0.794Weak decoupling
Petrochemical industry0.908Growing connection1.085Growing connection1.129Growing connection
Metallurgy0.711Weak decoupling0.599Weak decoupling7.703Recession decoupling
Pulp−0.243Strong decoupling0.686Weak decoupling1.295Recession decoupling
Synthetic fiber0.441Weak decoupling0.737Weak decoupling0.912Growing connection
Spinning and weaving4.387Recession decoupling0.130Weak decoupling0.685Weak decoupling
Electrical power−0.099Strong decoupling0.760Weak decoupling0.737Weak decoupling
Table 7. Energy efficiency decoupling elasticity index of eight industries in the Zhejiang Province from 2010 to 2021.
Sector2010–20142014–20182018–2021
ε 2 Decoupling State ε 2 Decoupling State ε 2 Decoupling State
Steel0.586Weak decoupling−1.243Strong decoupling−0.351Strong decoupling
Building materials−0.184Strong decoupling−0.161Strong decoupling0.759Weak decoupling
Petrochemical industry0.826Growing connection1.098Growing connection2.452Expansion negative decoupling
Metallurgy1.540Expansion negative decoupling0.455Weak decoupling−0.032Strong decoupling
Pulp0.361Weak decoupling0.596Weak decoupling−0.764Strong decoupling
Synthetic fiber0.920Growing connection0.760Weak decoupling1.751Expansion negative decoupling
Spinning and weaving−0.131Weak decoupling0.374Weak decoupling0.591Weak decoupling
Electrical power0.606Weak decoupling0.934Growing connection0.964Growing connection
Table 8. Decoupling efforts of carbon emission influencing factors of eight major industries in the Zhejiang Province from 2010 to 2021.
Effect2010–20142014–20182018–2021
DPDSIDEIDESDCIDPDSIDEIDESDCIDPDSIDEIDESDCI
Steel−0.35 −0.18 0.71 * 0.05 * 0.33 * −0.35 1.35 ** 1.89 ** 0.08 * 0.08 * −0.39 1.94 ** 0.02 * 0.03 * 0.15 *
Building materials−0.35 0.12 * 1.57 ** 0.01 * 0.29 * −0.35 −0.47 2.26 ** 0.08 * 0.08 * −0.39 −2.37 2.81 ** 0.25 * 0.15 *
Petrochemical industry−0.35 0.83 * −0.19 −0.03 0.15 * −0.35 −1.43 1.19 ** −0.20 0.07 * −0.39 2.41 ** −5.79 −1.02 0.13 *
Metallurgy−0.35 −0.92 0.34 * 0.01 * 0.60 * −0.35 −0.28 0.99 * 0.07 * 0.17 * −0.39 −1.48 3.28 ** 0.19 * 0.37 *
Pulp−0.35 0.00 0.86 * 0.01 * 0.65 * −0.35 −0.41 0.83 * 0.08 * 0.18 * −0.39 2.19 ** 1.89 ** 0.29 * 0.41 *
Synthetic fiber−0.35 −0.94 1.15 ** 0.02 * 0.77 * −0.35 −0.51 0.75 * 0.04 * 0.20 * −0.39 4.05 ** −6.11 −0.18 0.39 *
Spinning and weaving−0.35 0.15 * 1.36 ** 0.05 * 0.62 * −0.35 1.61 ** −0.81 0.26 * 0.19 * −0.39 0.24 * 1.13 ** 0.03 * 0.41 *
Electrical power−0.35 0.85 * −0.33 0.01 * 1.03 ** −0.35 0.08 * 0.00 * −0.02 0.29 * −0.39 1.08 ** −0.51 0.00 0.55 *
Note: DP, DSI, DEI, DES, and DCI are decoupling effort values for population size, industry structure, energy intensity, energy structure and carbon emission factor effects, respectively. *, ** denote a weak decoupling effort and a strong decoupling effort, respectively.
Disclaimer/Publisher’s Note: The statements, opinions and data contained in all publications are solely those of the individual author(s) and contributor(s) and not of MDPI and/or the editor(s). MDPI and/or the editor(s) disclaim responsibility for any injury to people or property resulting from any ideas, methods, instructions or products referred to in the content.

