
Land-Use Dynamics and Water Quality in Andean Basins

 , , and
Abstract
:1. Introduction
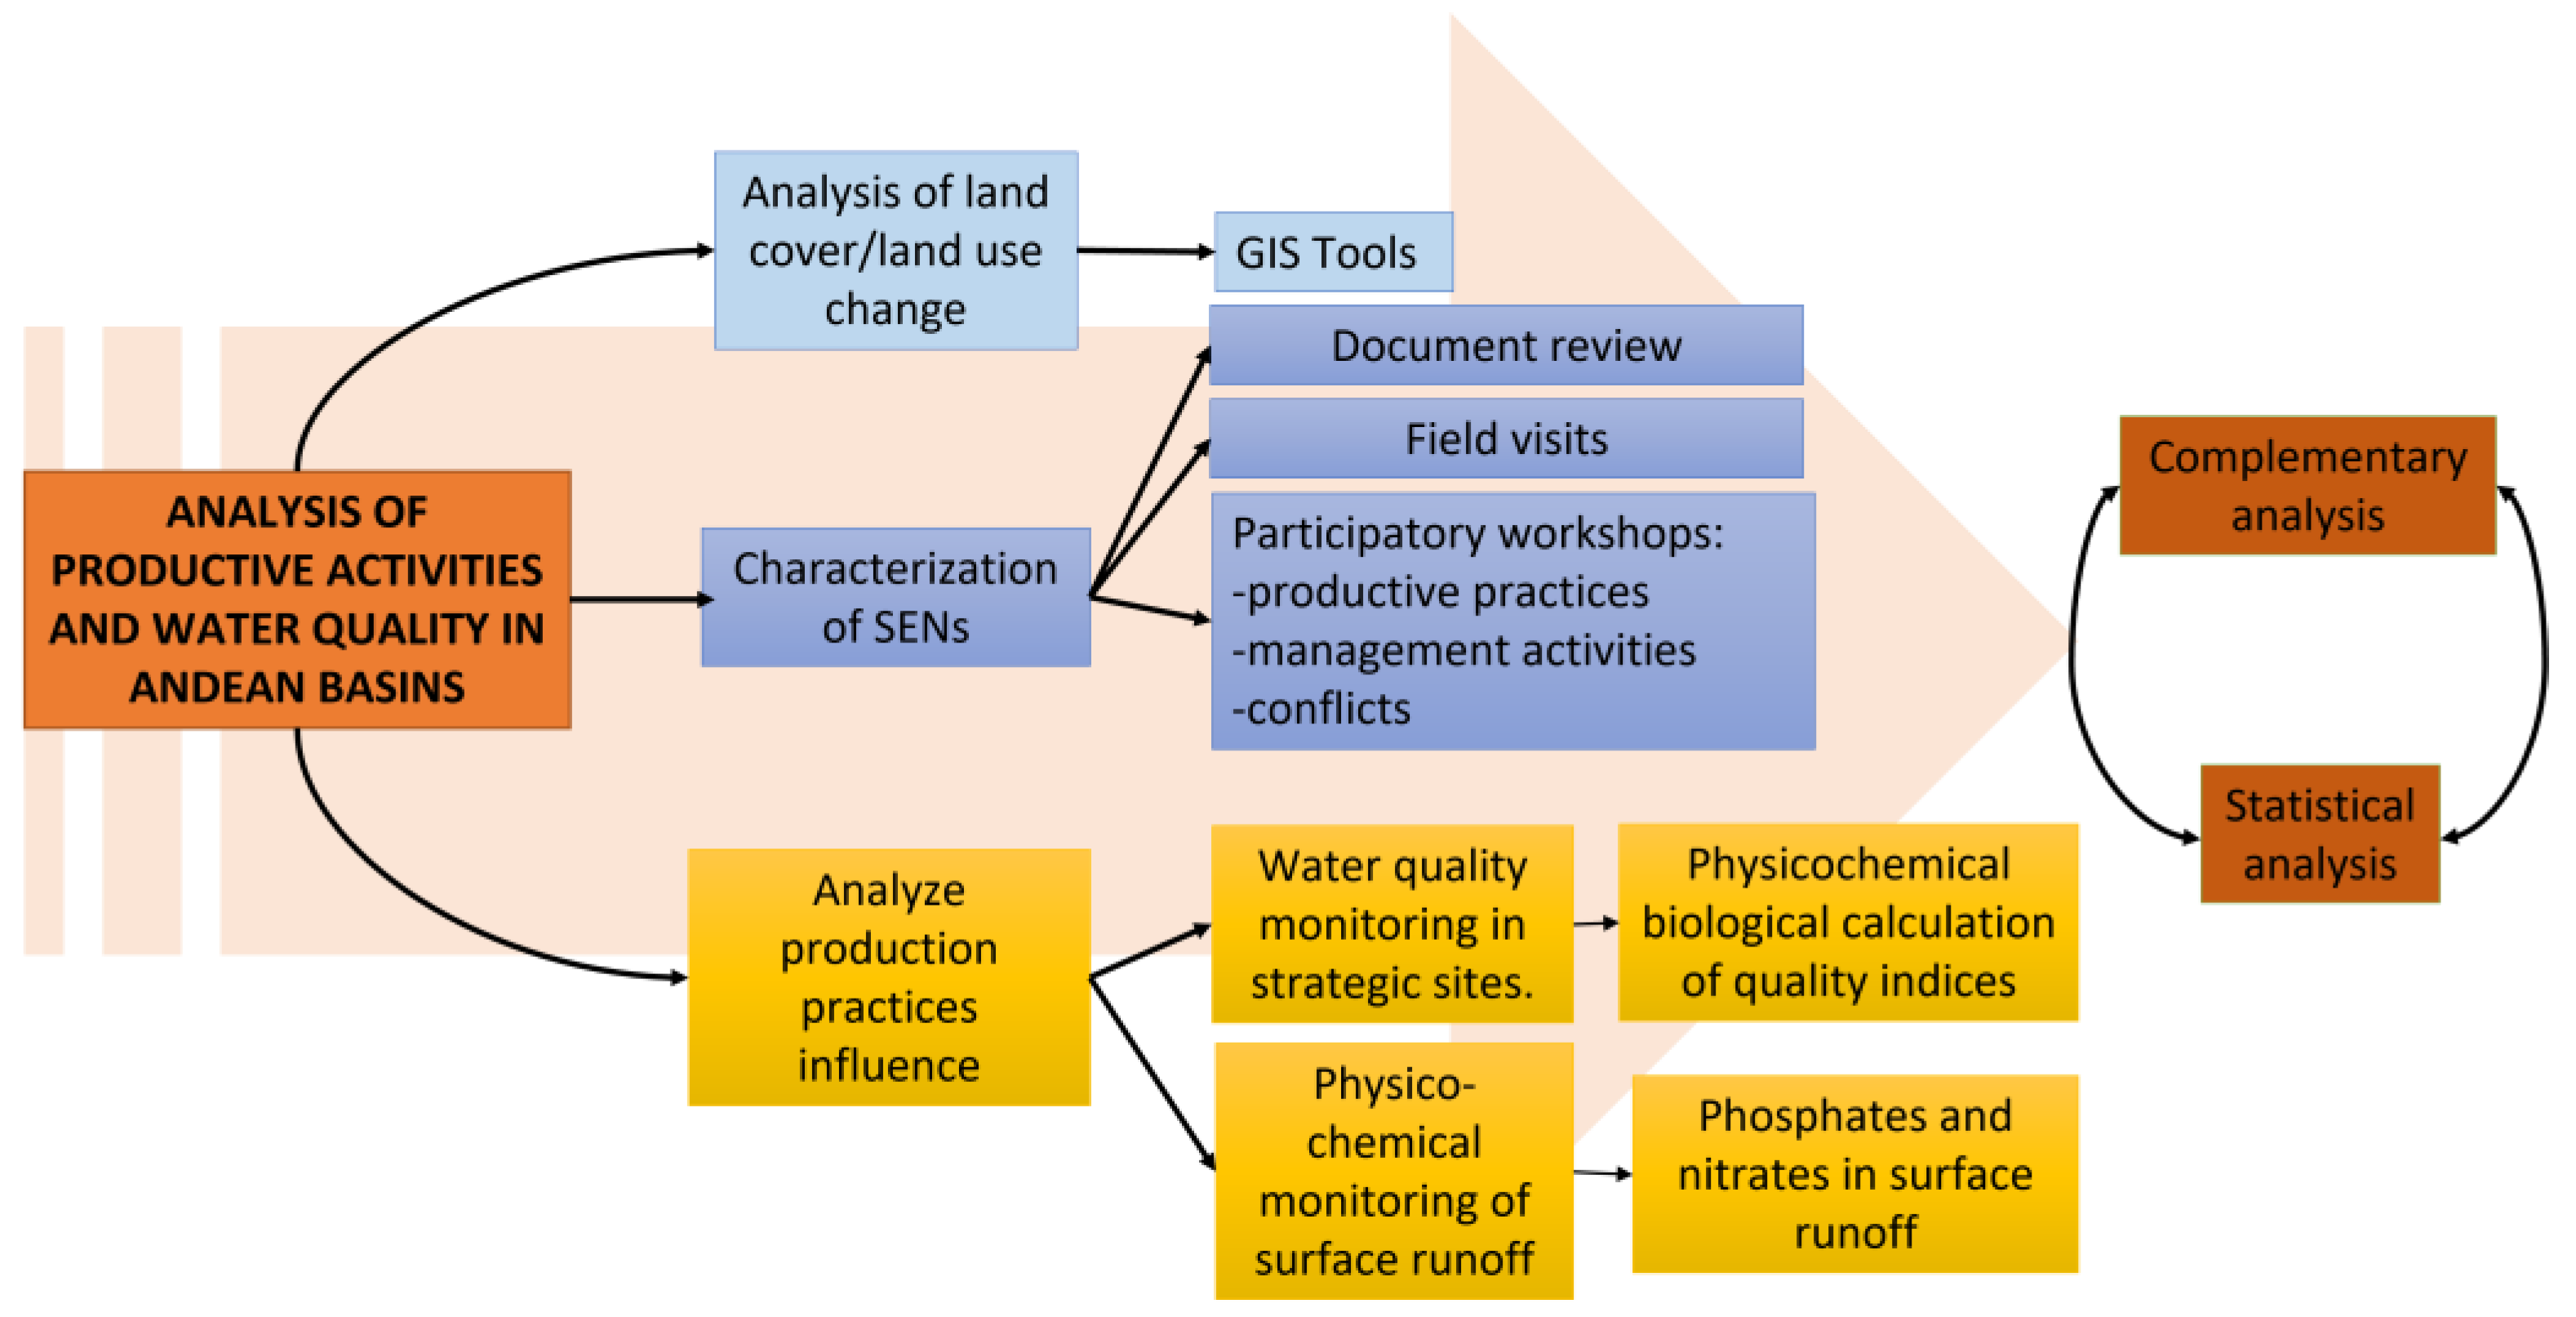
2. Materials and Methods
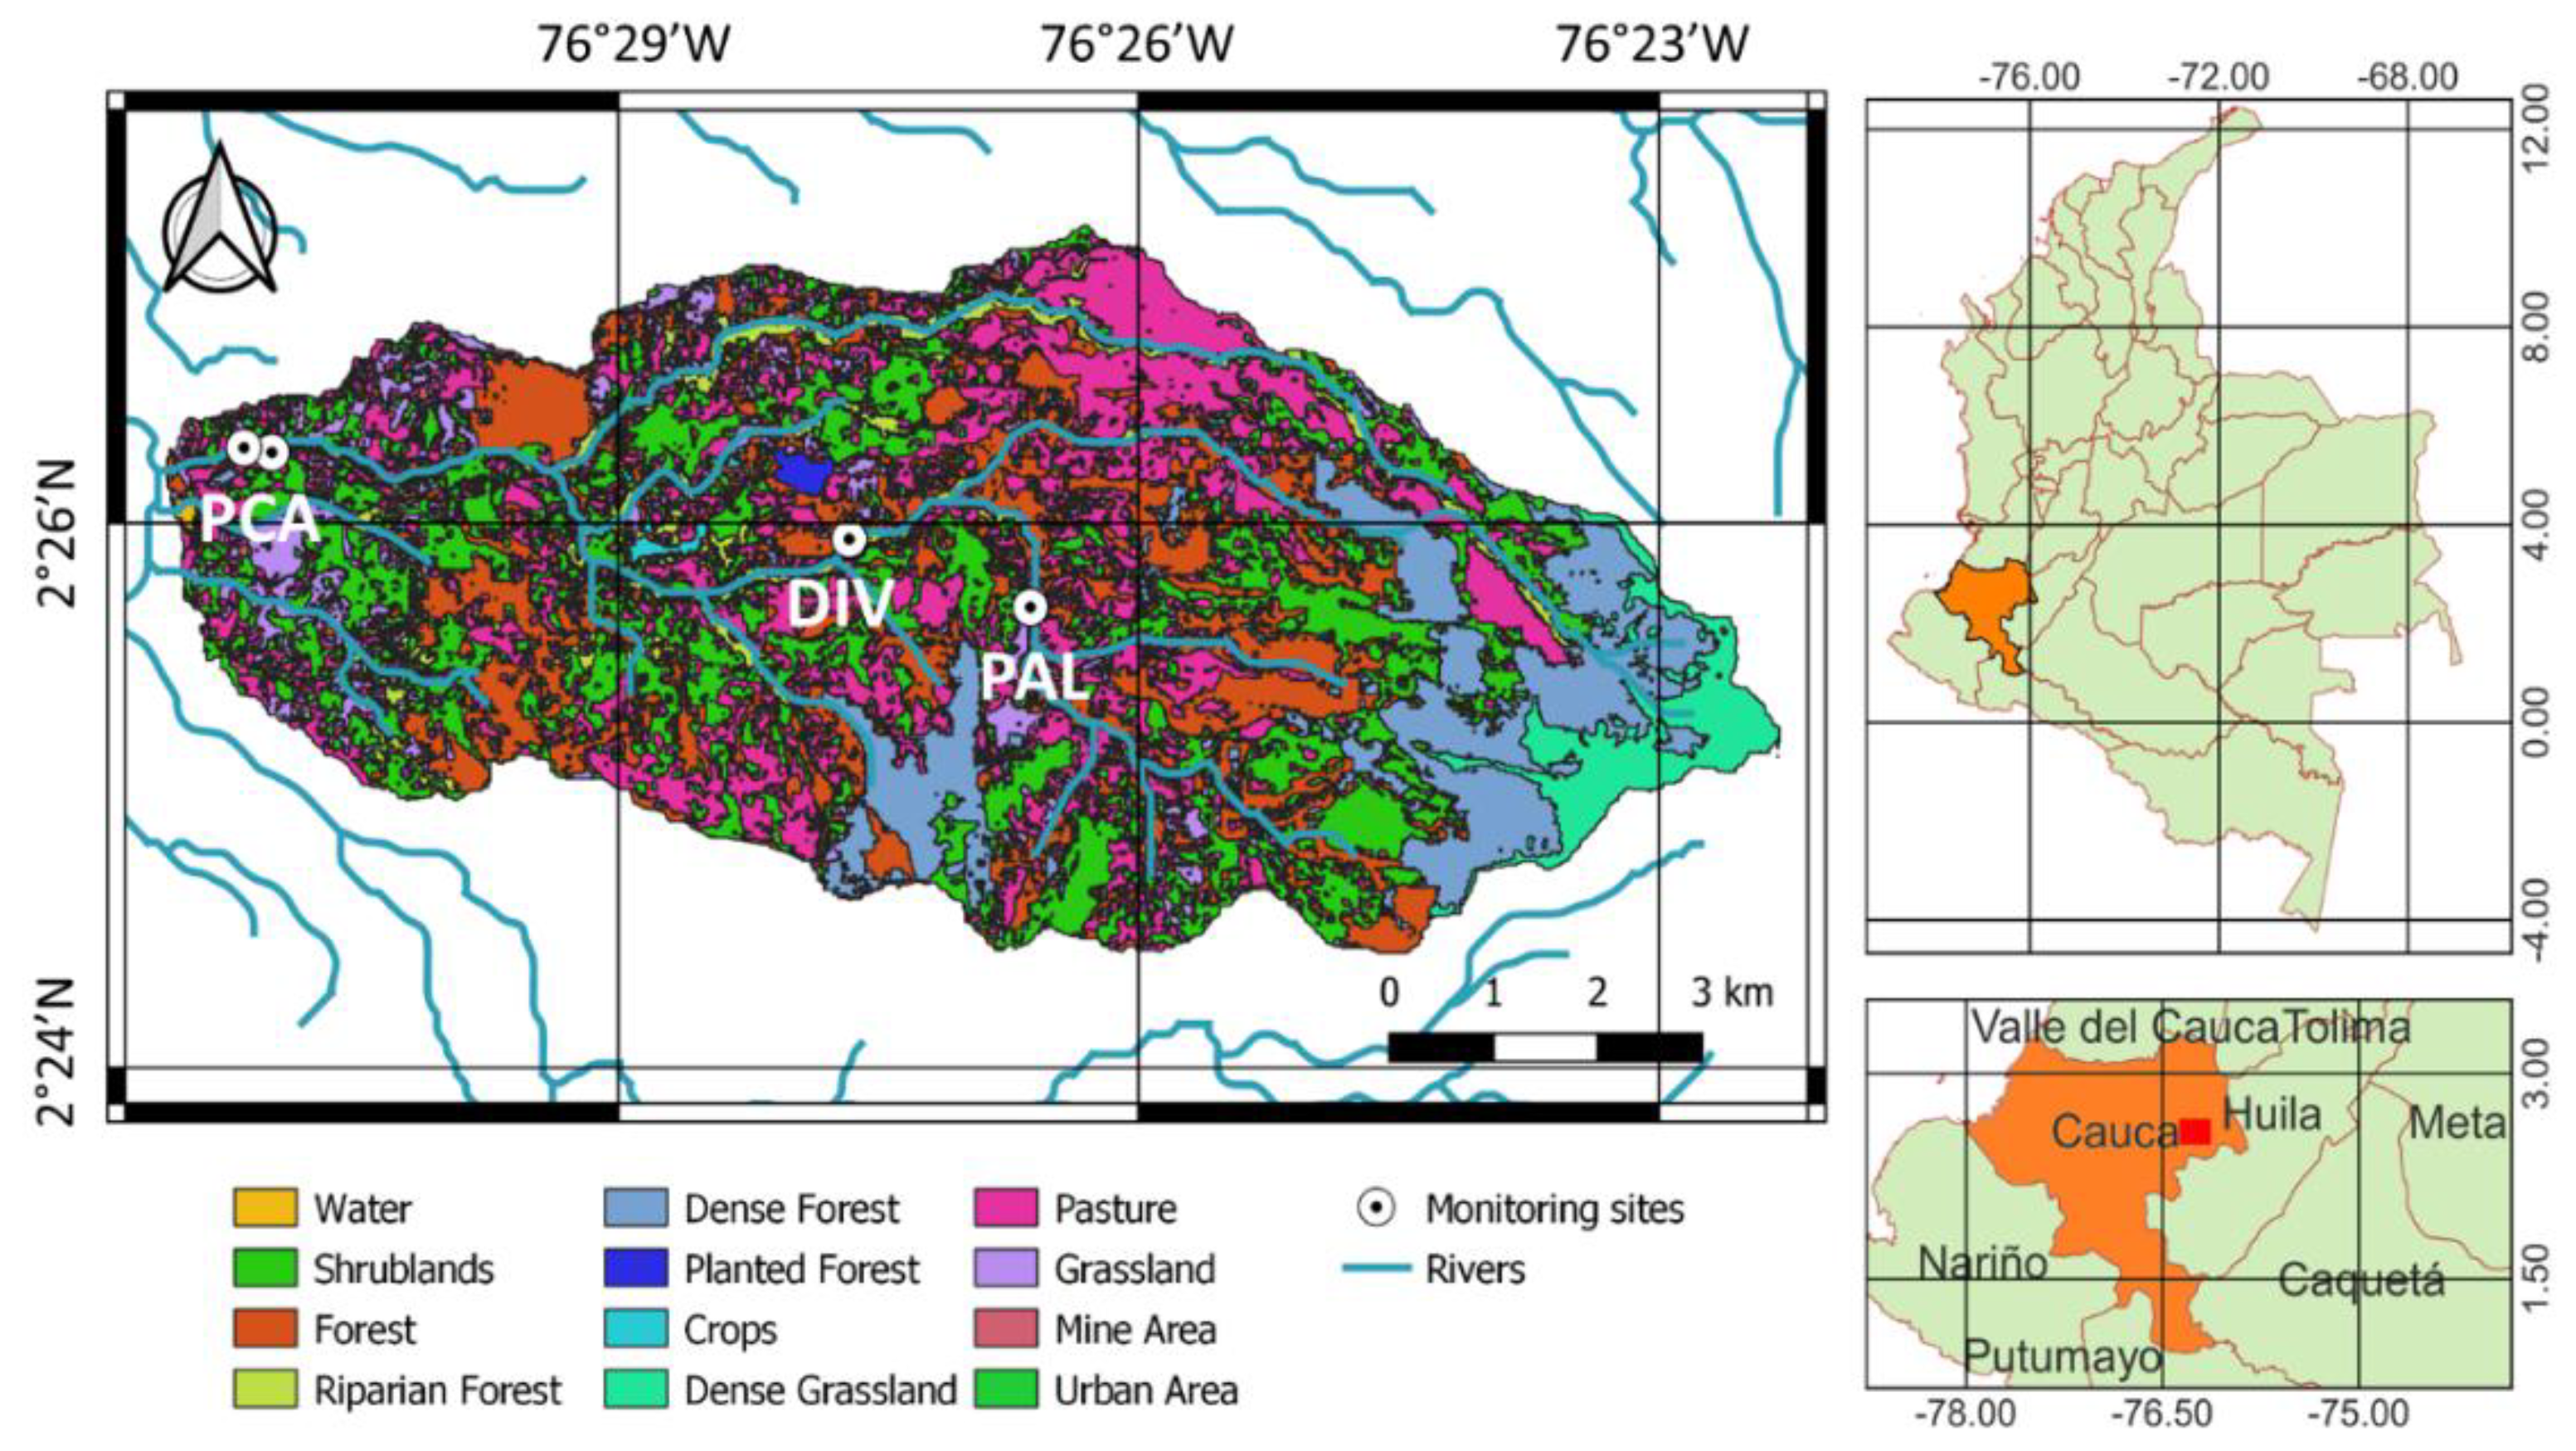
2.1. Study Area
2.2. Methods
2.2.1. Land-Cover and Land-Use Change Analysis
2.2.2. Characterization of SENs
2.2.3. Water Quality Analysis in the LPRB
Water Quality Monitoring in Strategic Sites
- Physicochemical parameters for water monitoring
- Biological parameters for water monitoring
Water Quality Assessment Indices
Surface Water Runoff Analysis
Experimental Design and Correlation Analysis
3. Results
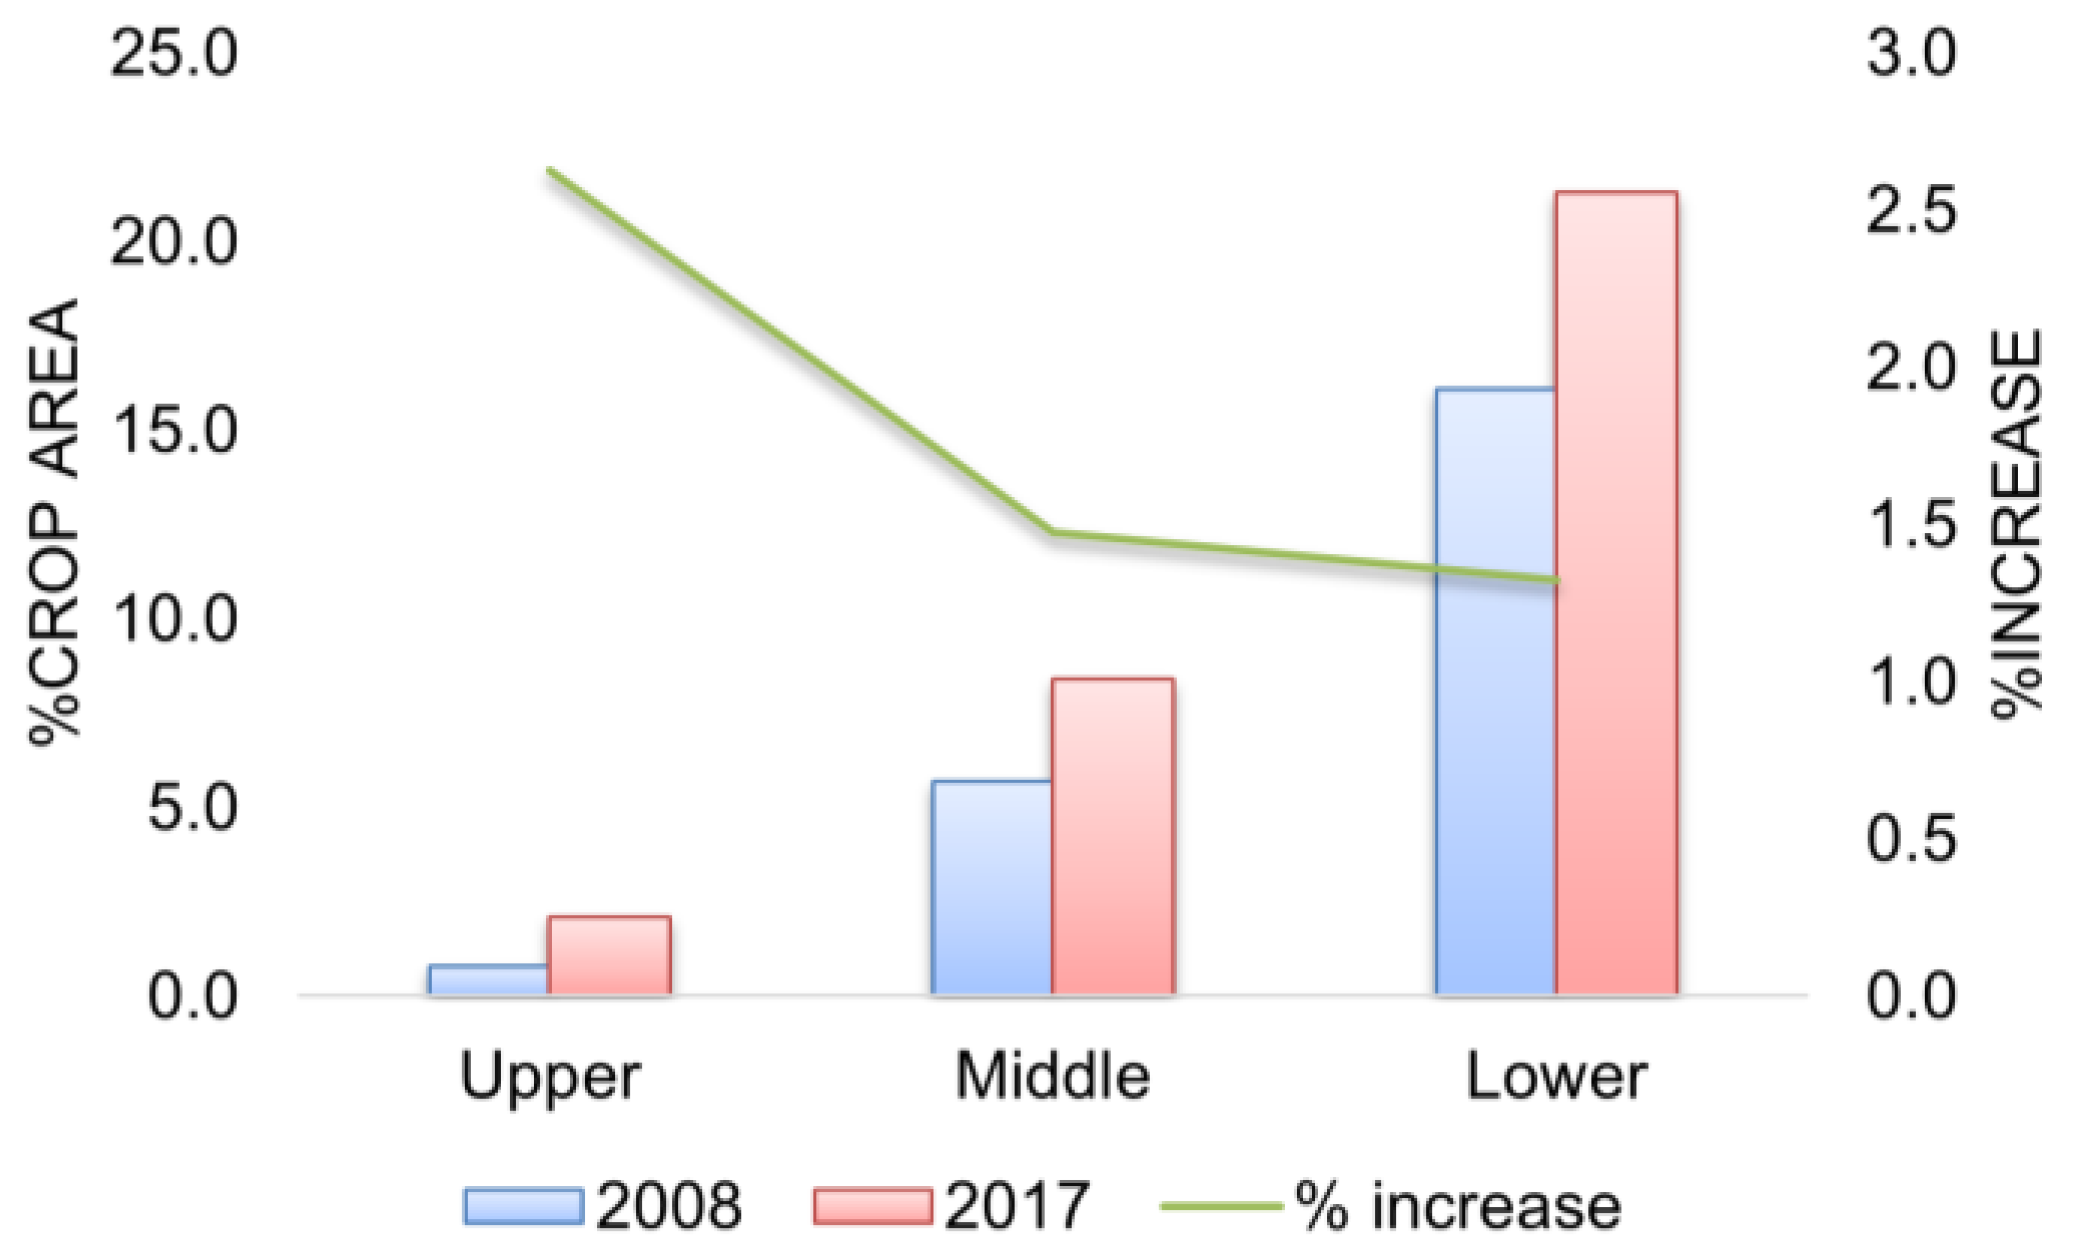
3.1. Land Cover and Land-Use Change Analysis
3.2. Characterization of SENs
3.2.1. Agricultural Activities in the Upper Area of the LPRB
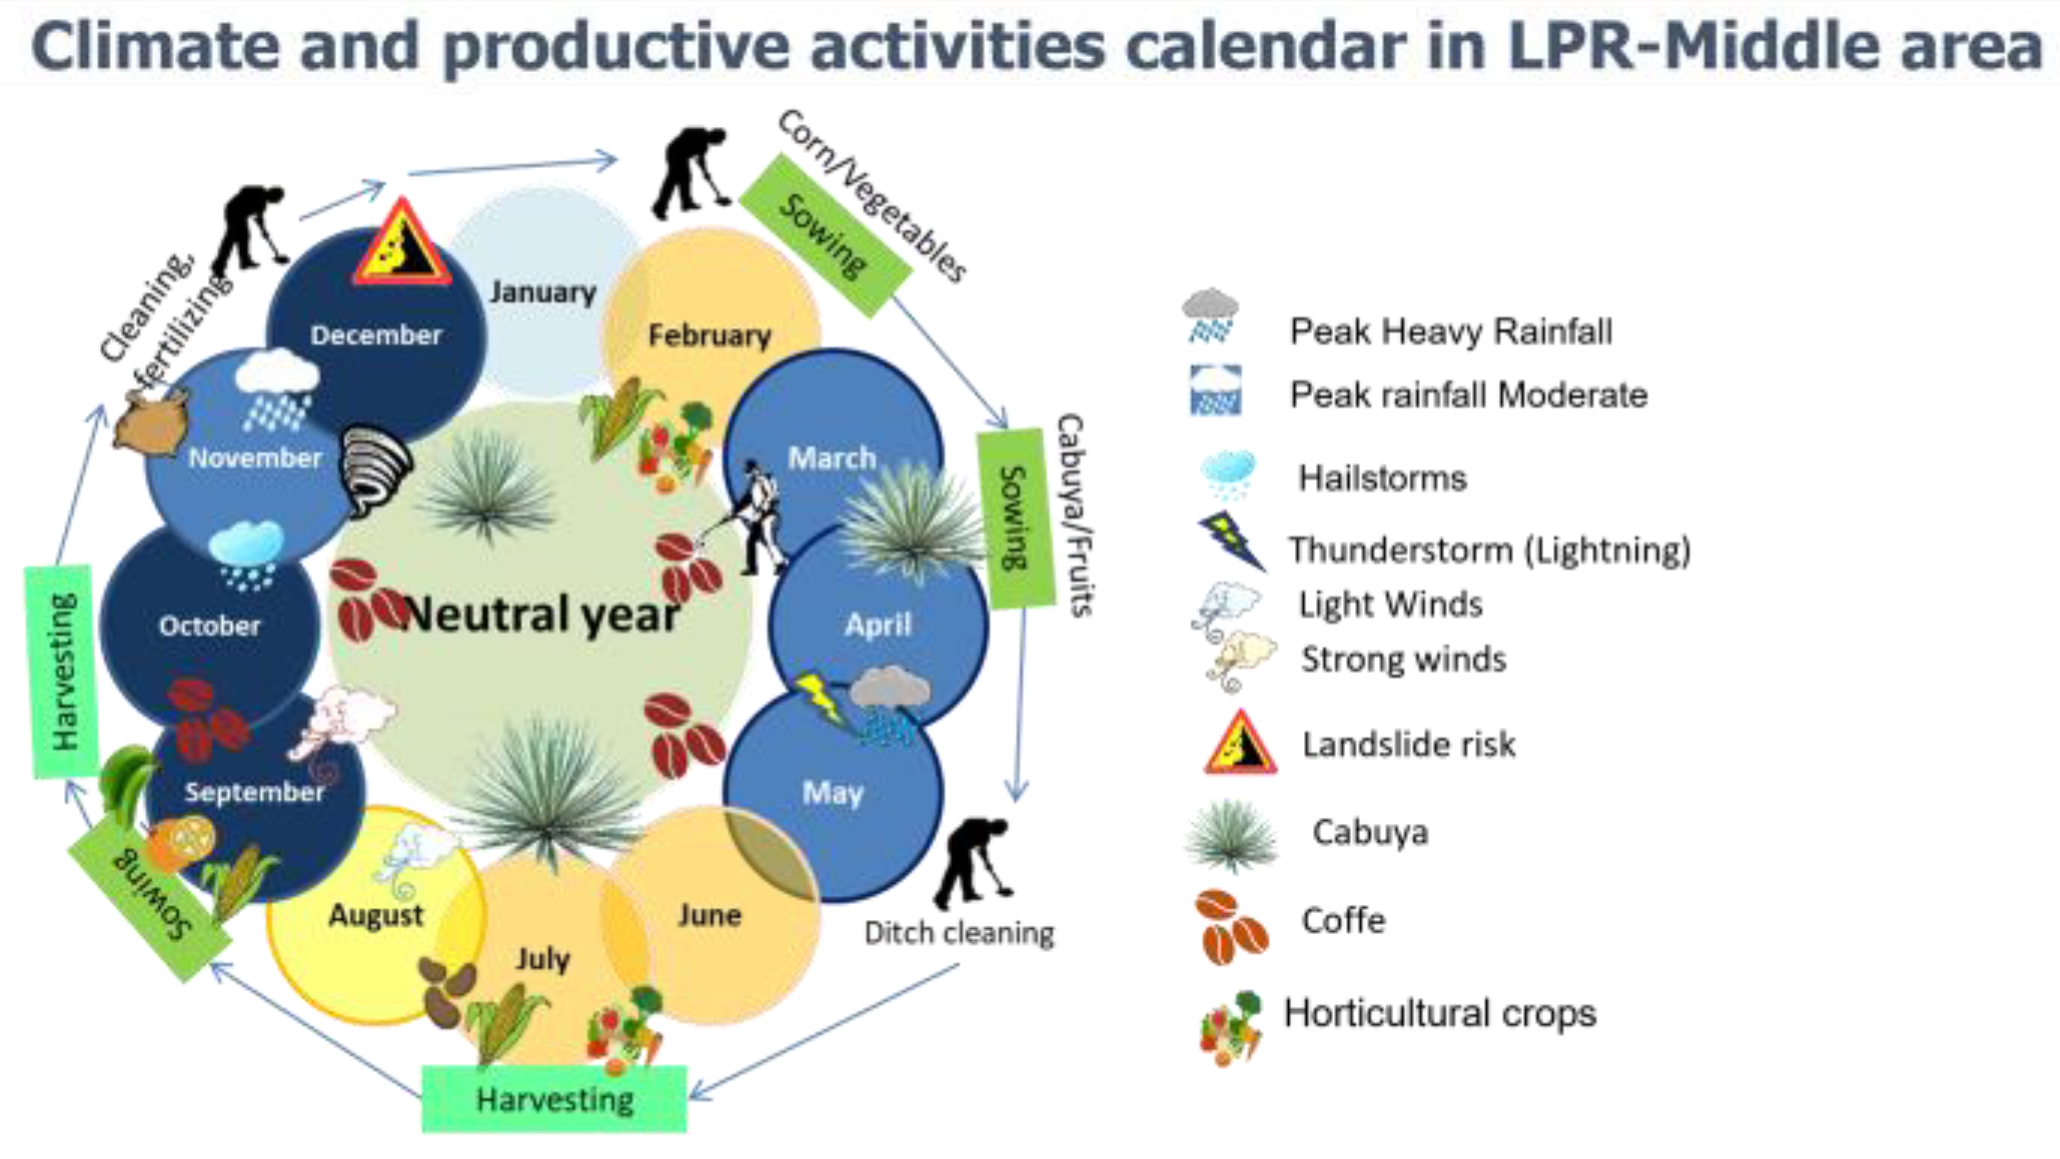
3.2.2. Agricultural Activities in the Middle Area of LPRB
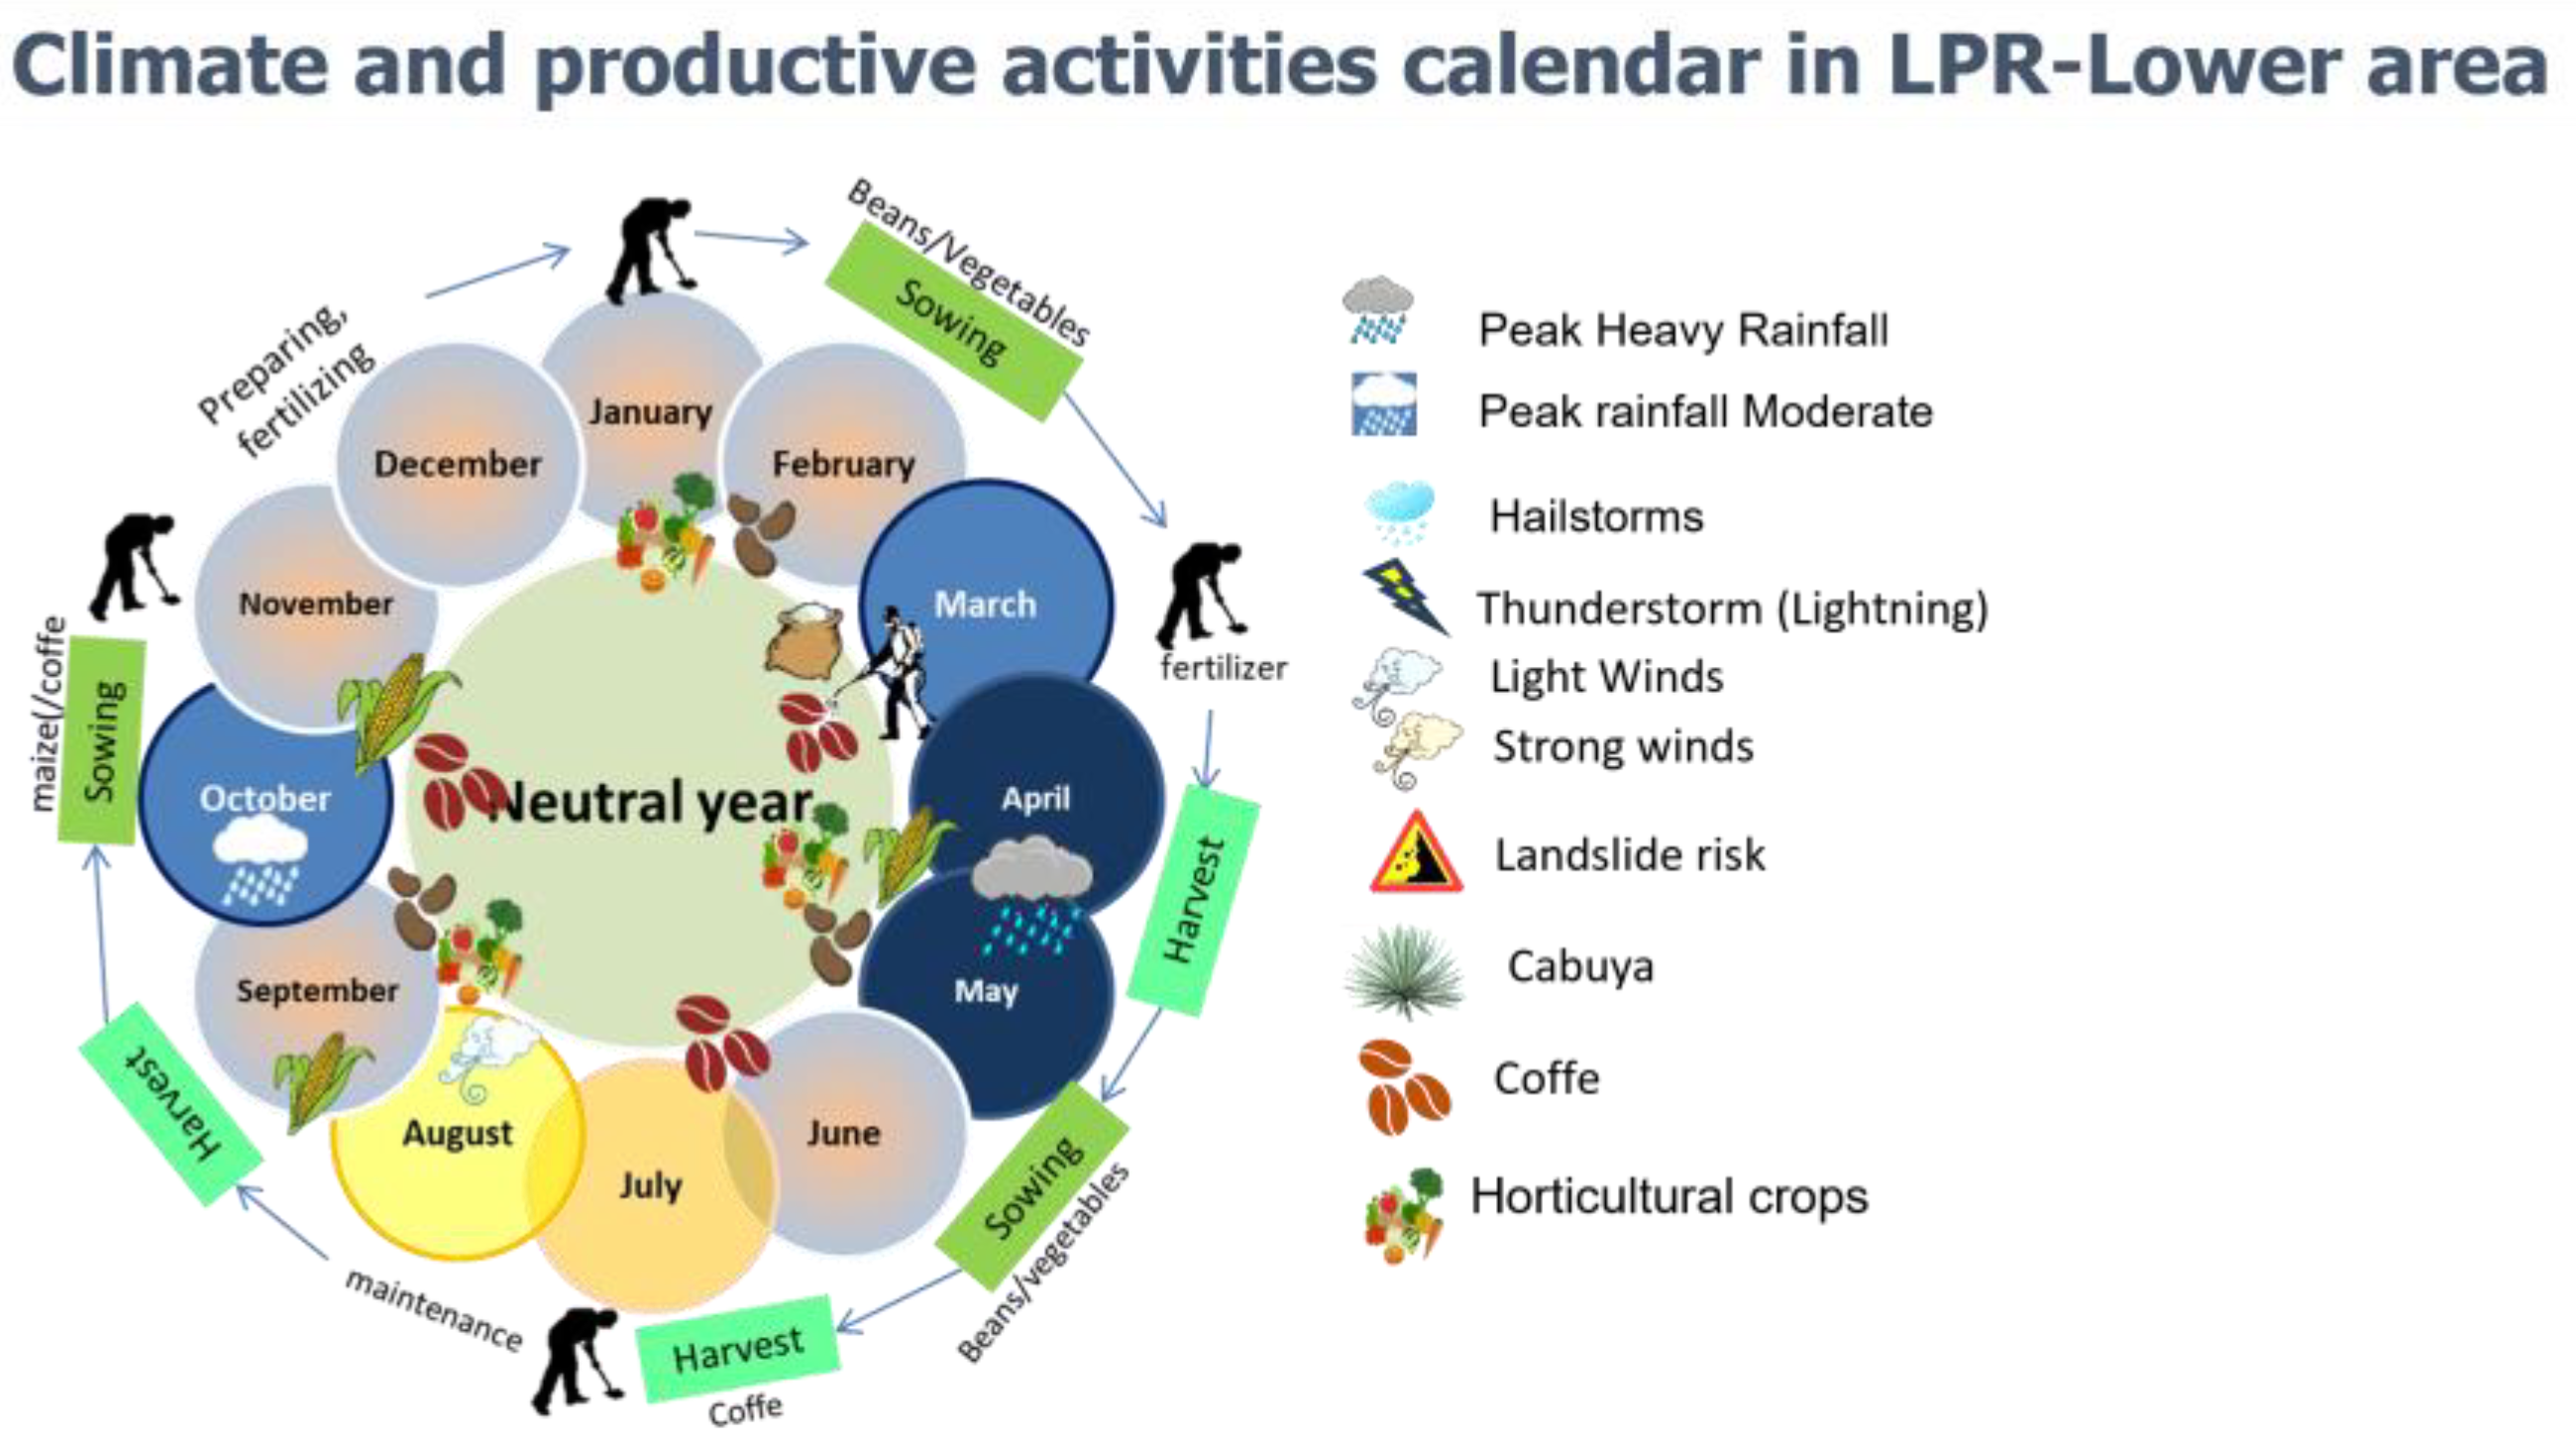
3.2.3. Agricultural Activities in the Lower Area of the LPRB
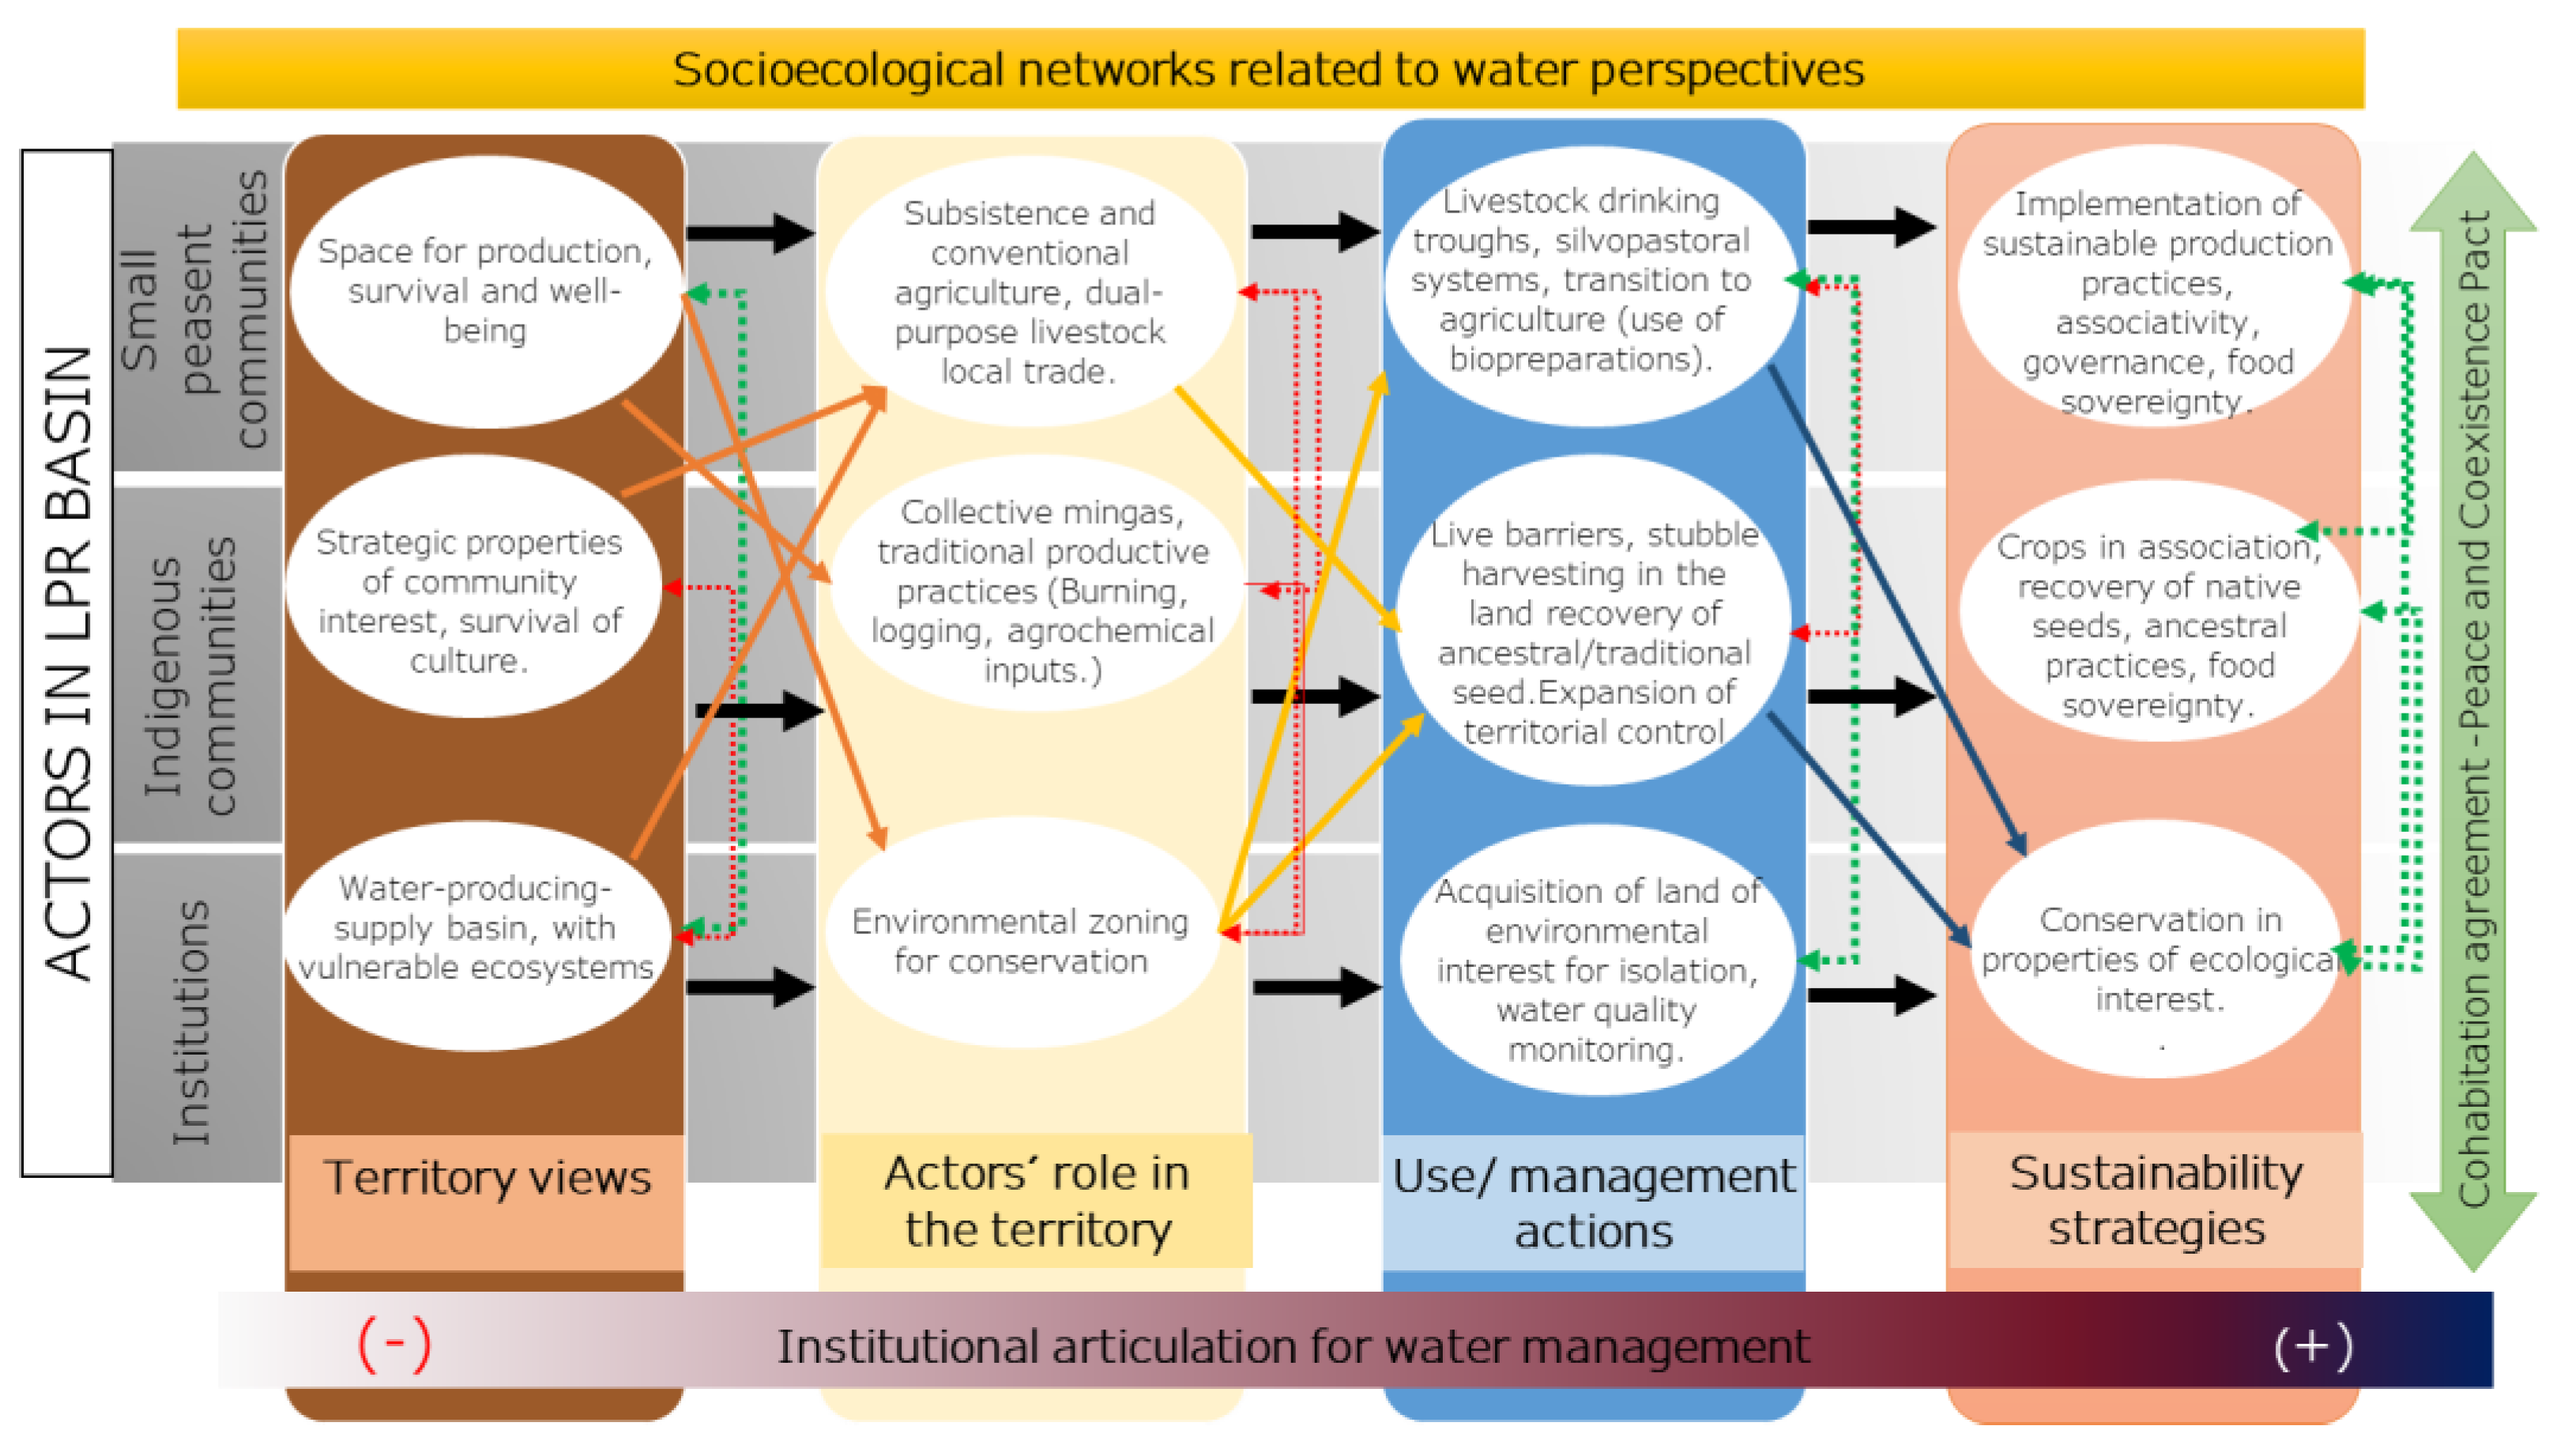
3.2.4. Socioecological Dynamics Network
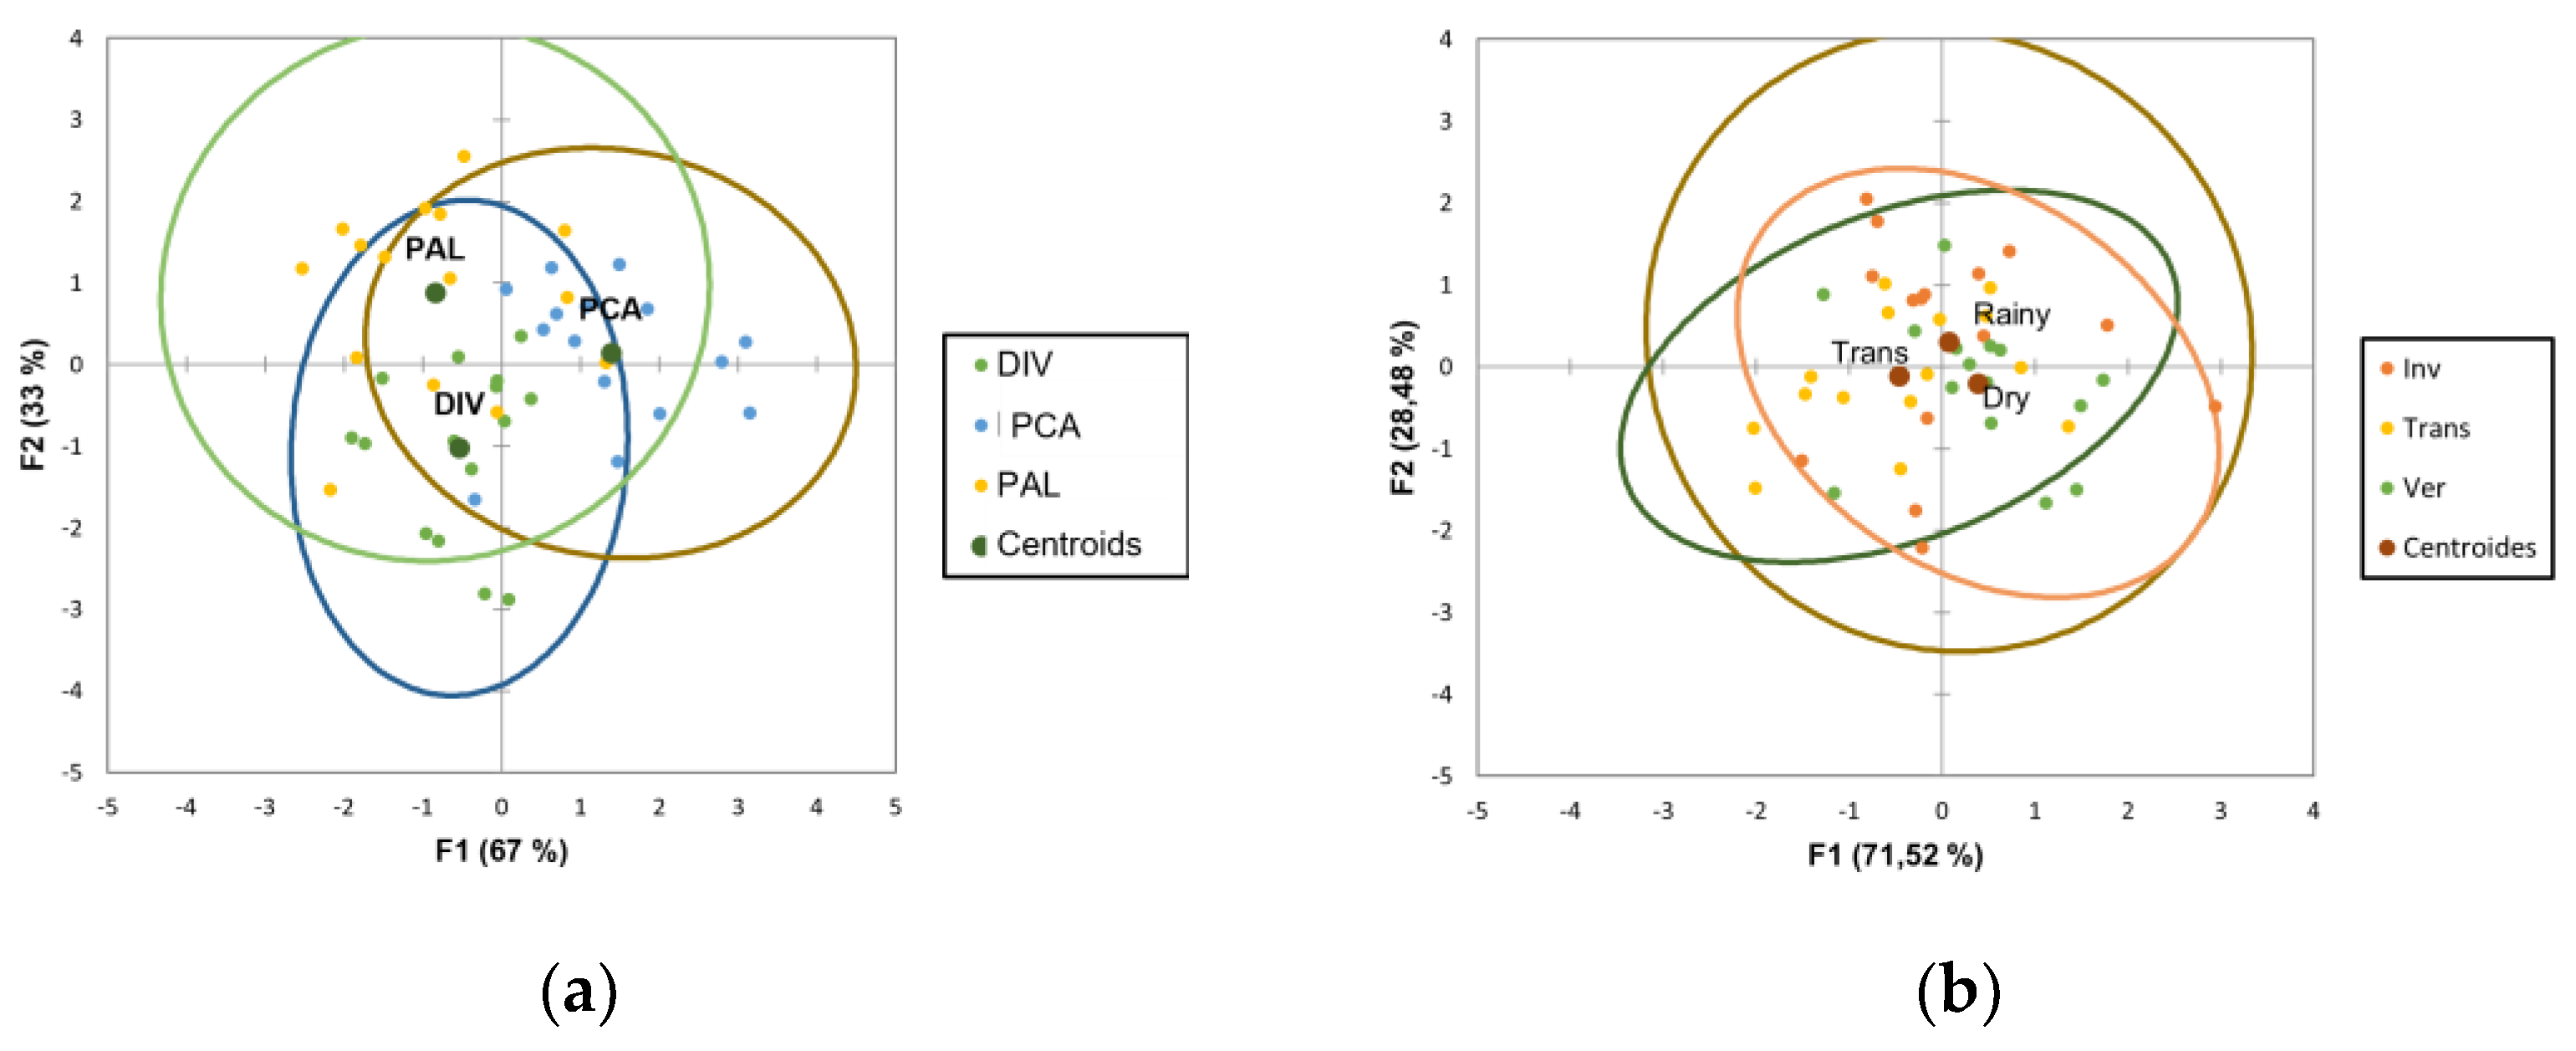
3.3. Water Quality Analysis in the LPRB
3.3.1. Water Quality Monitoring in Strategic Sites
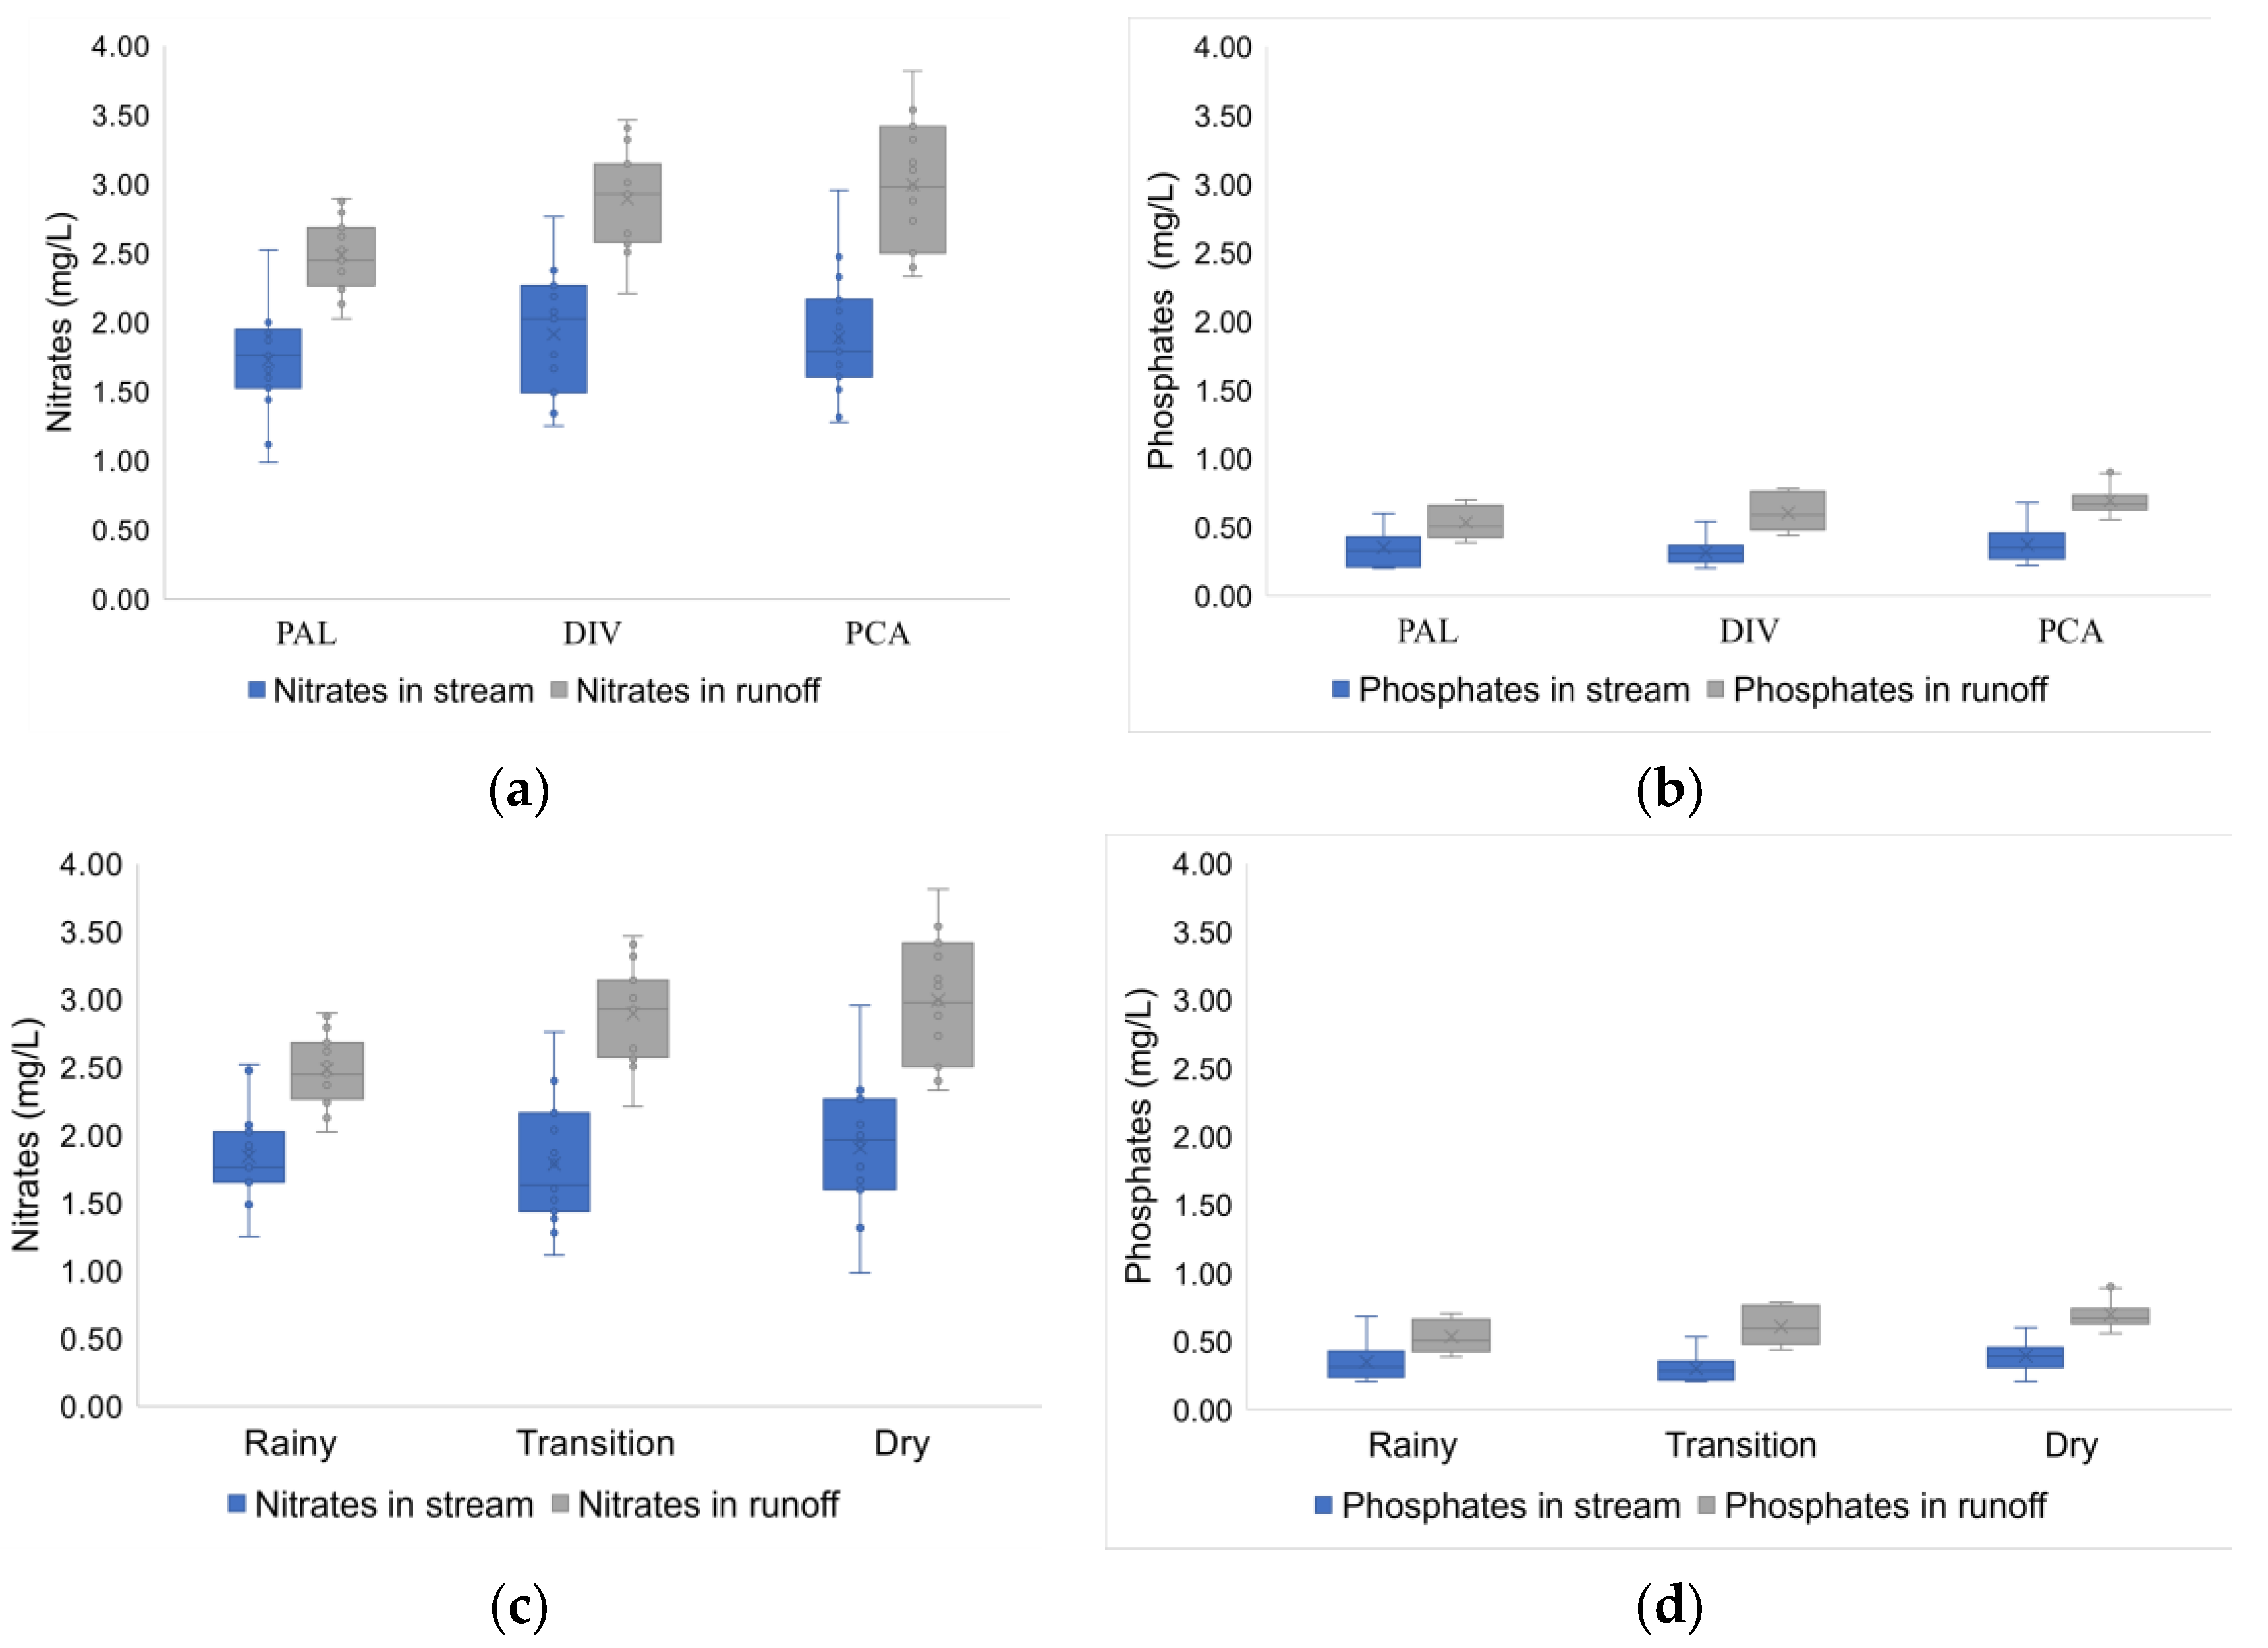
- Physicochemical parameters
- 2.
- Biological parameters
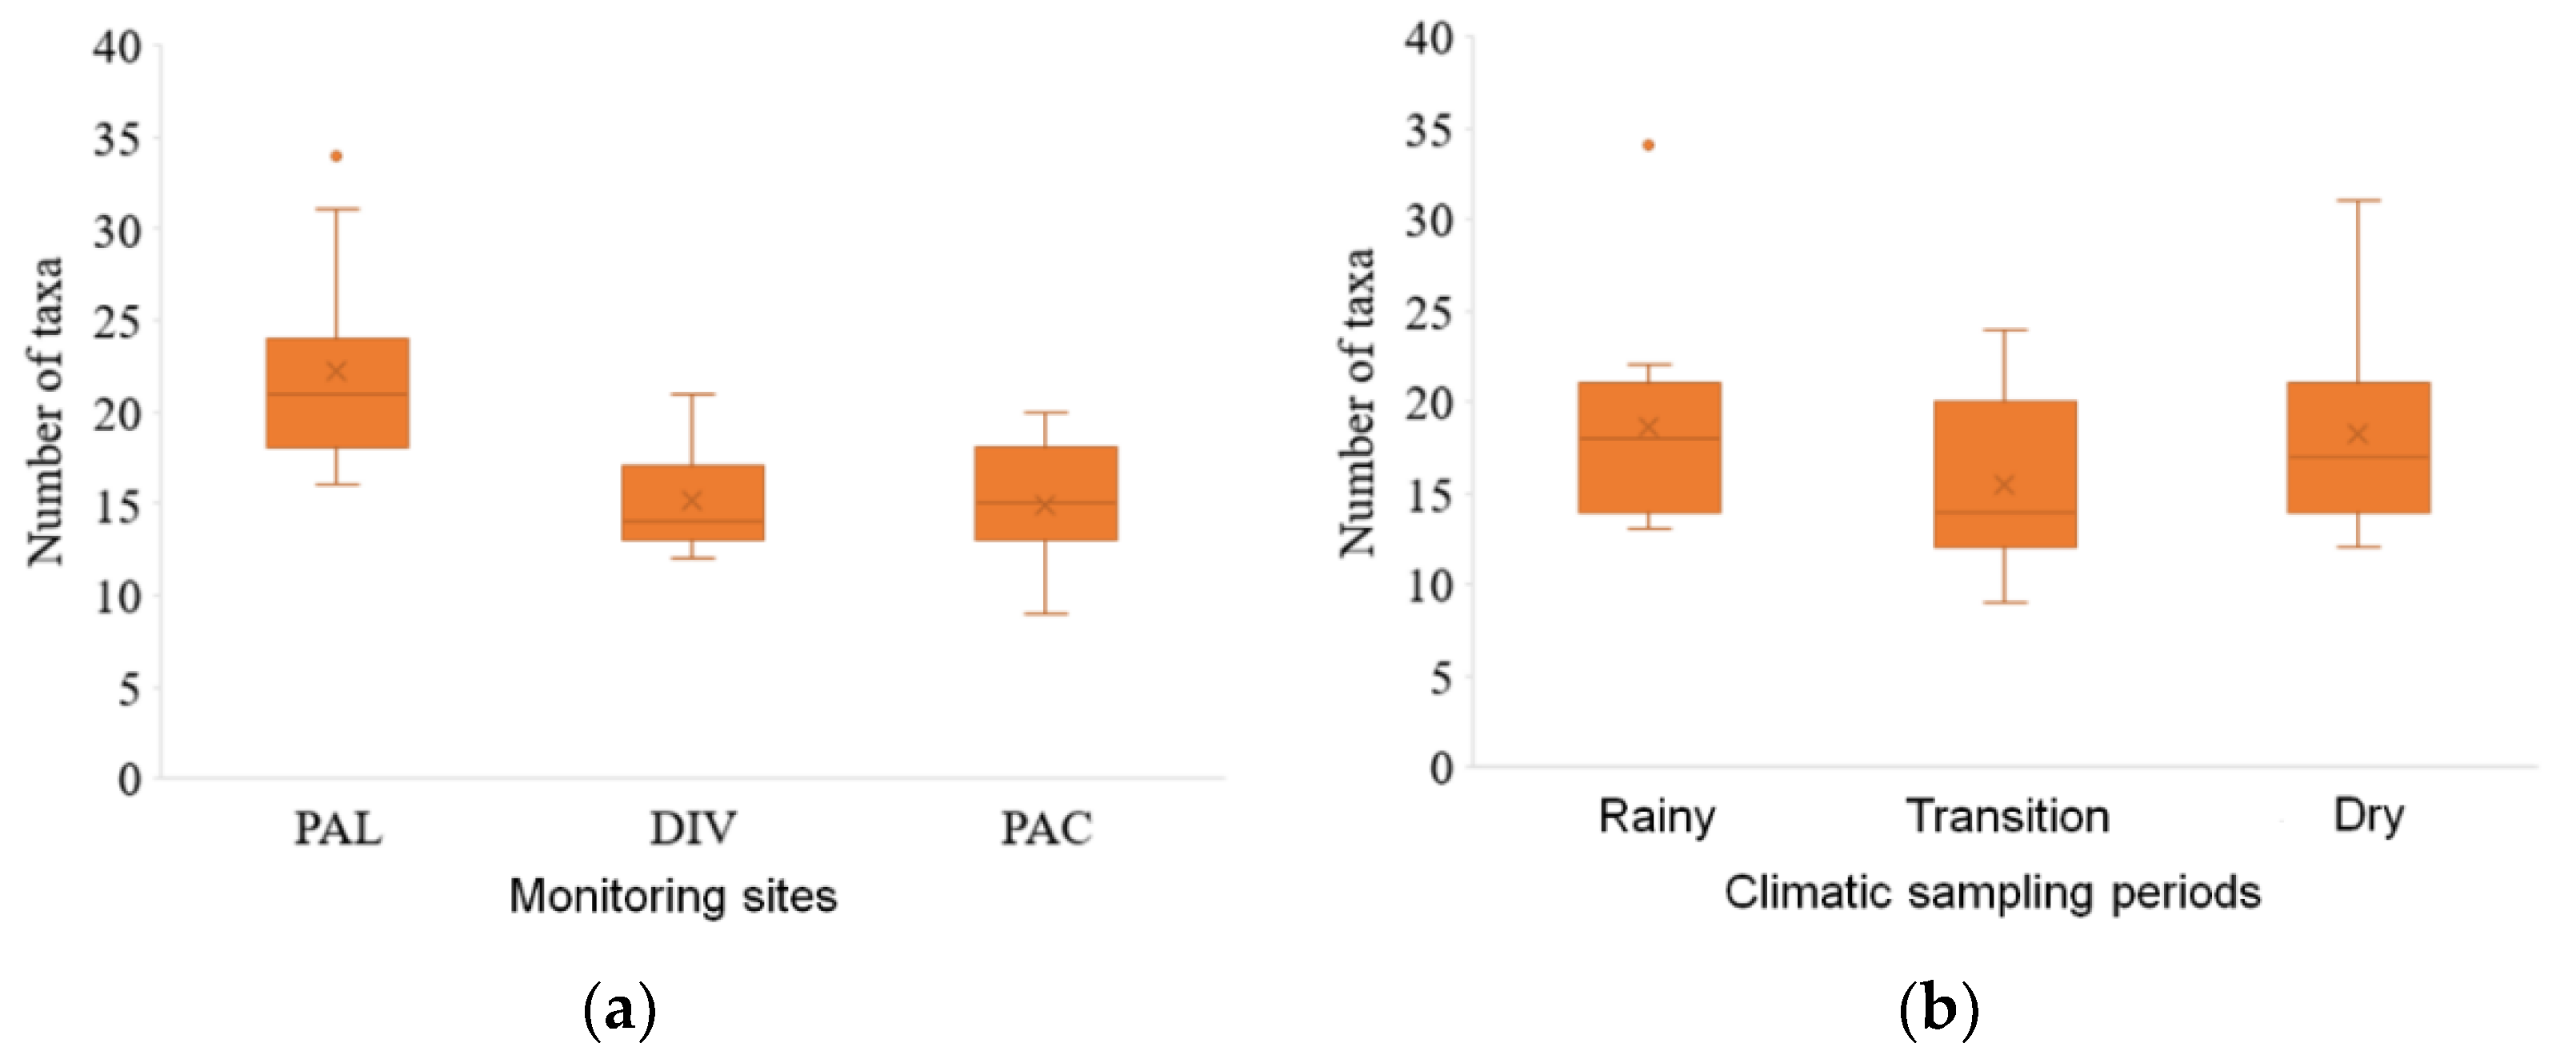
- 3.
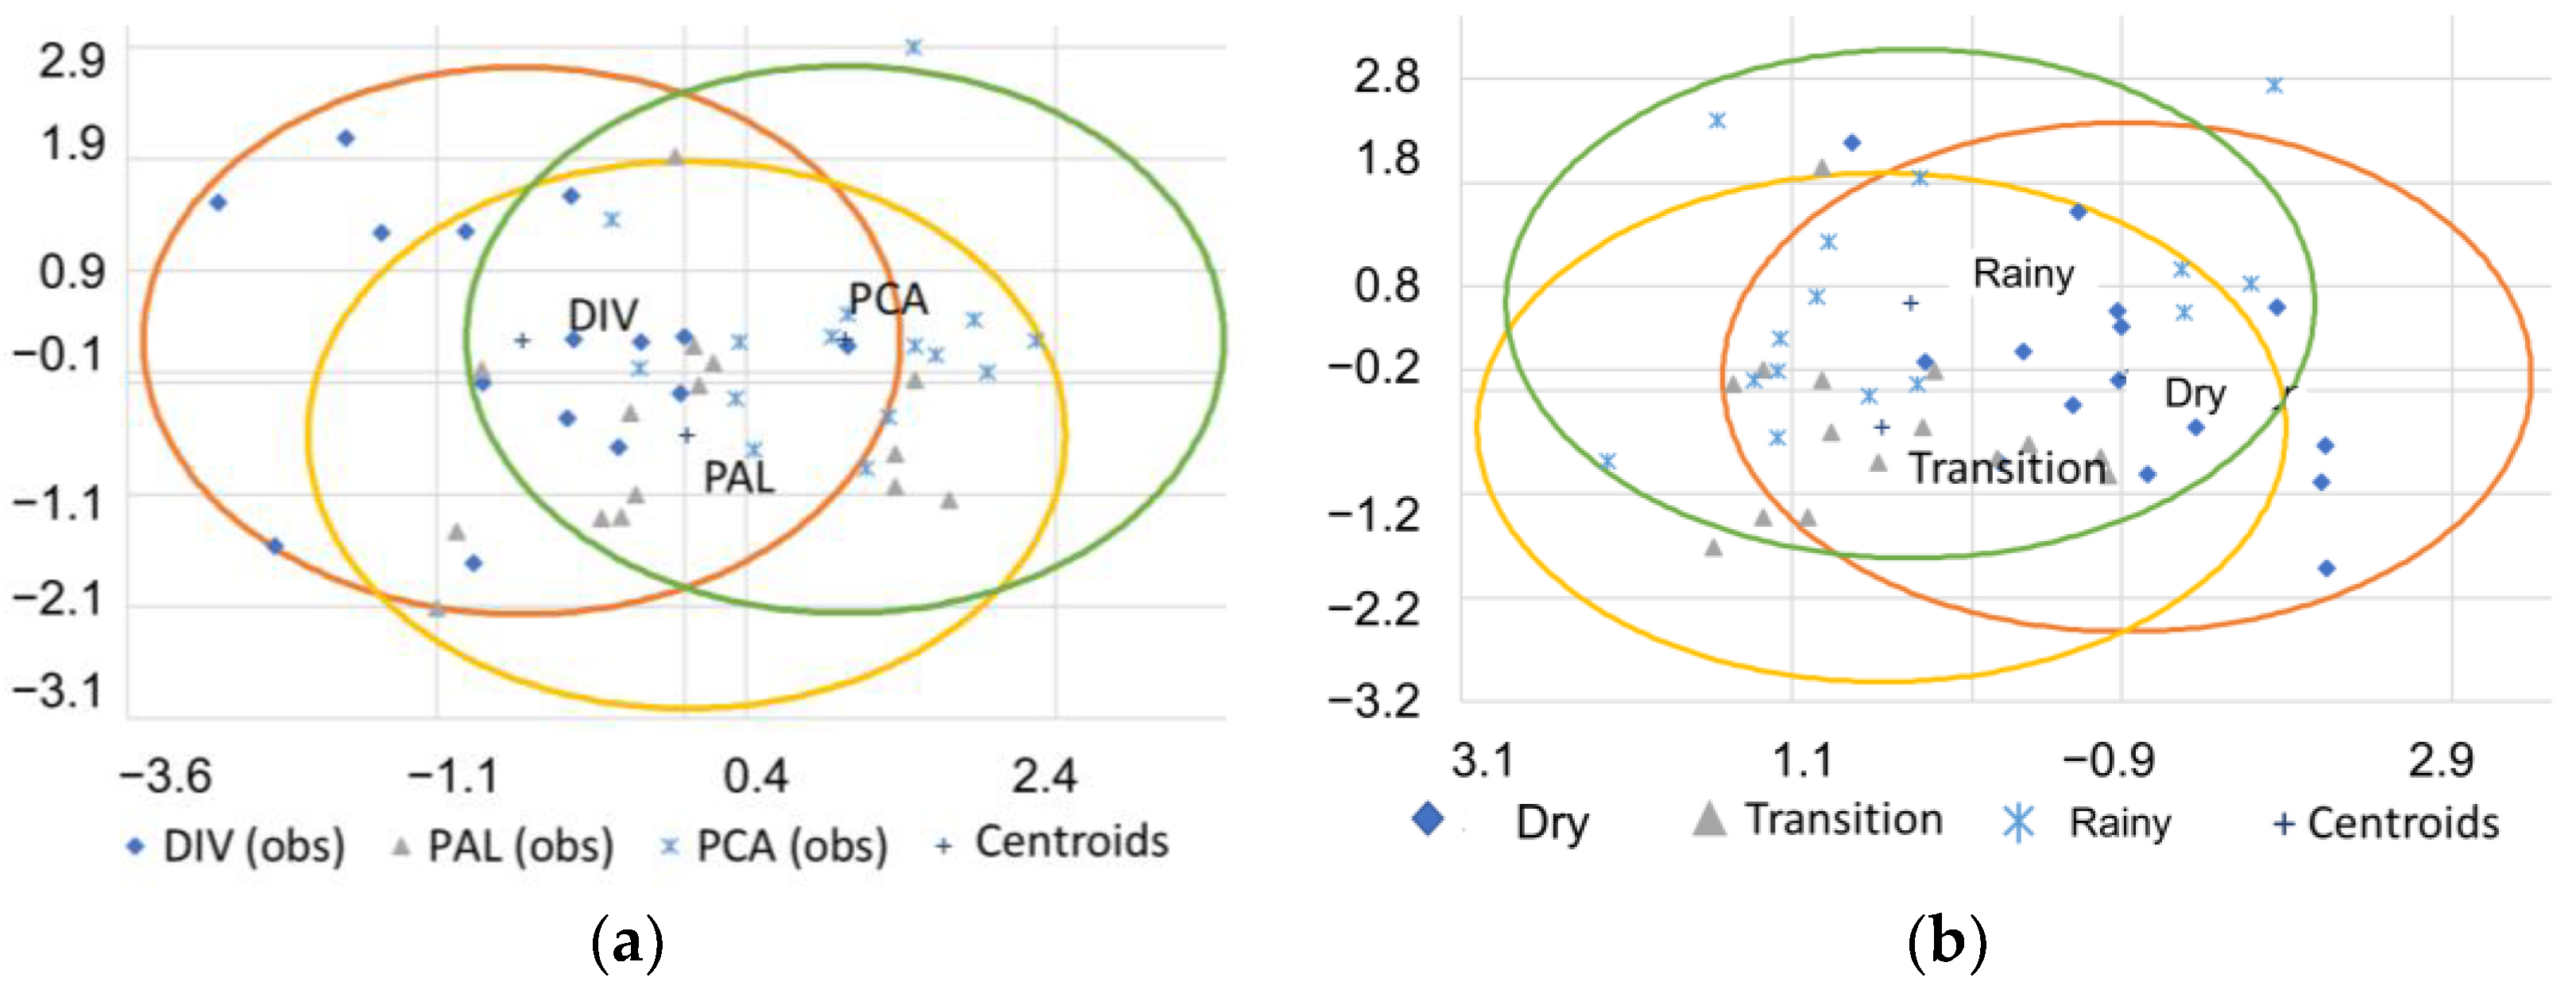
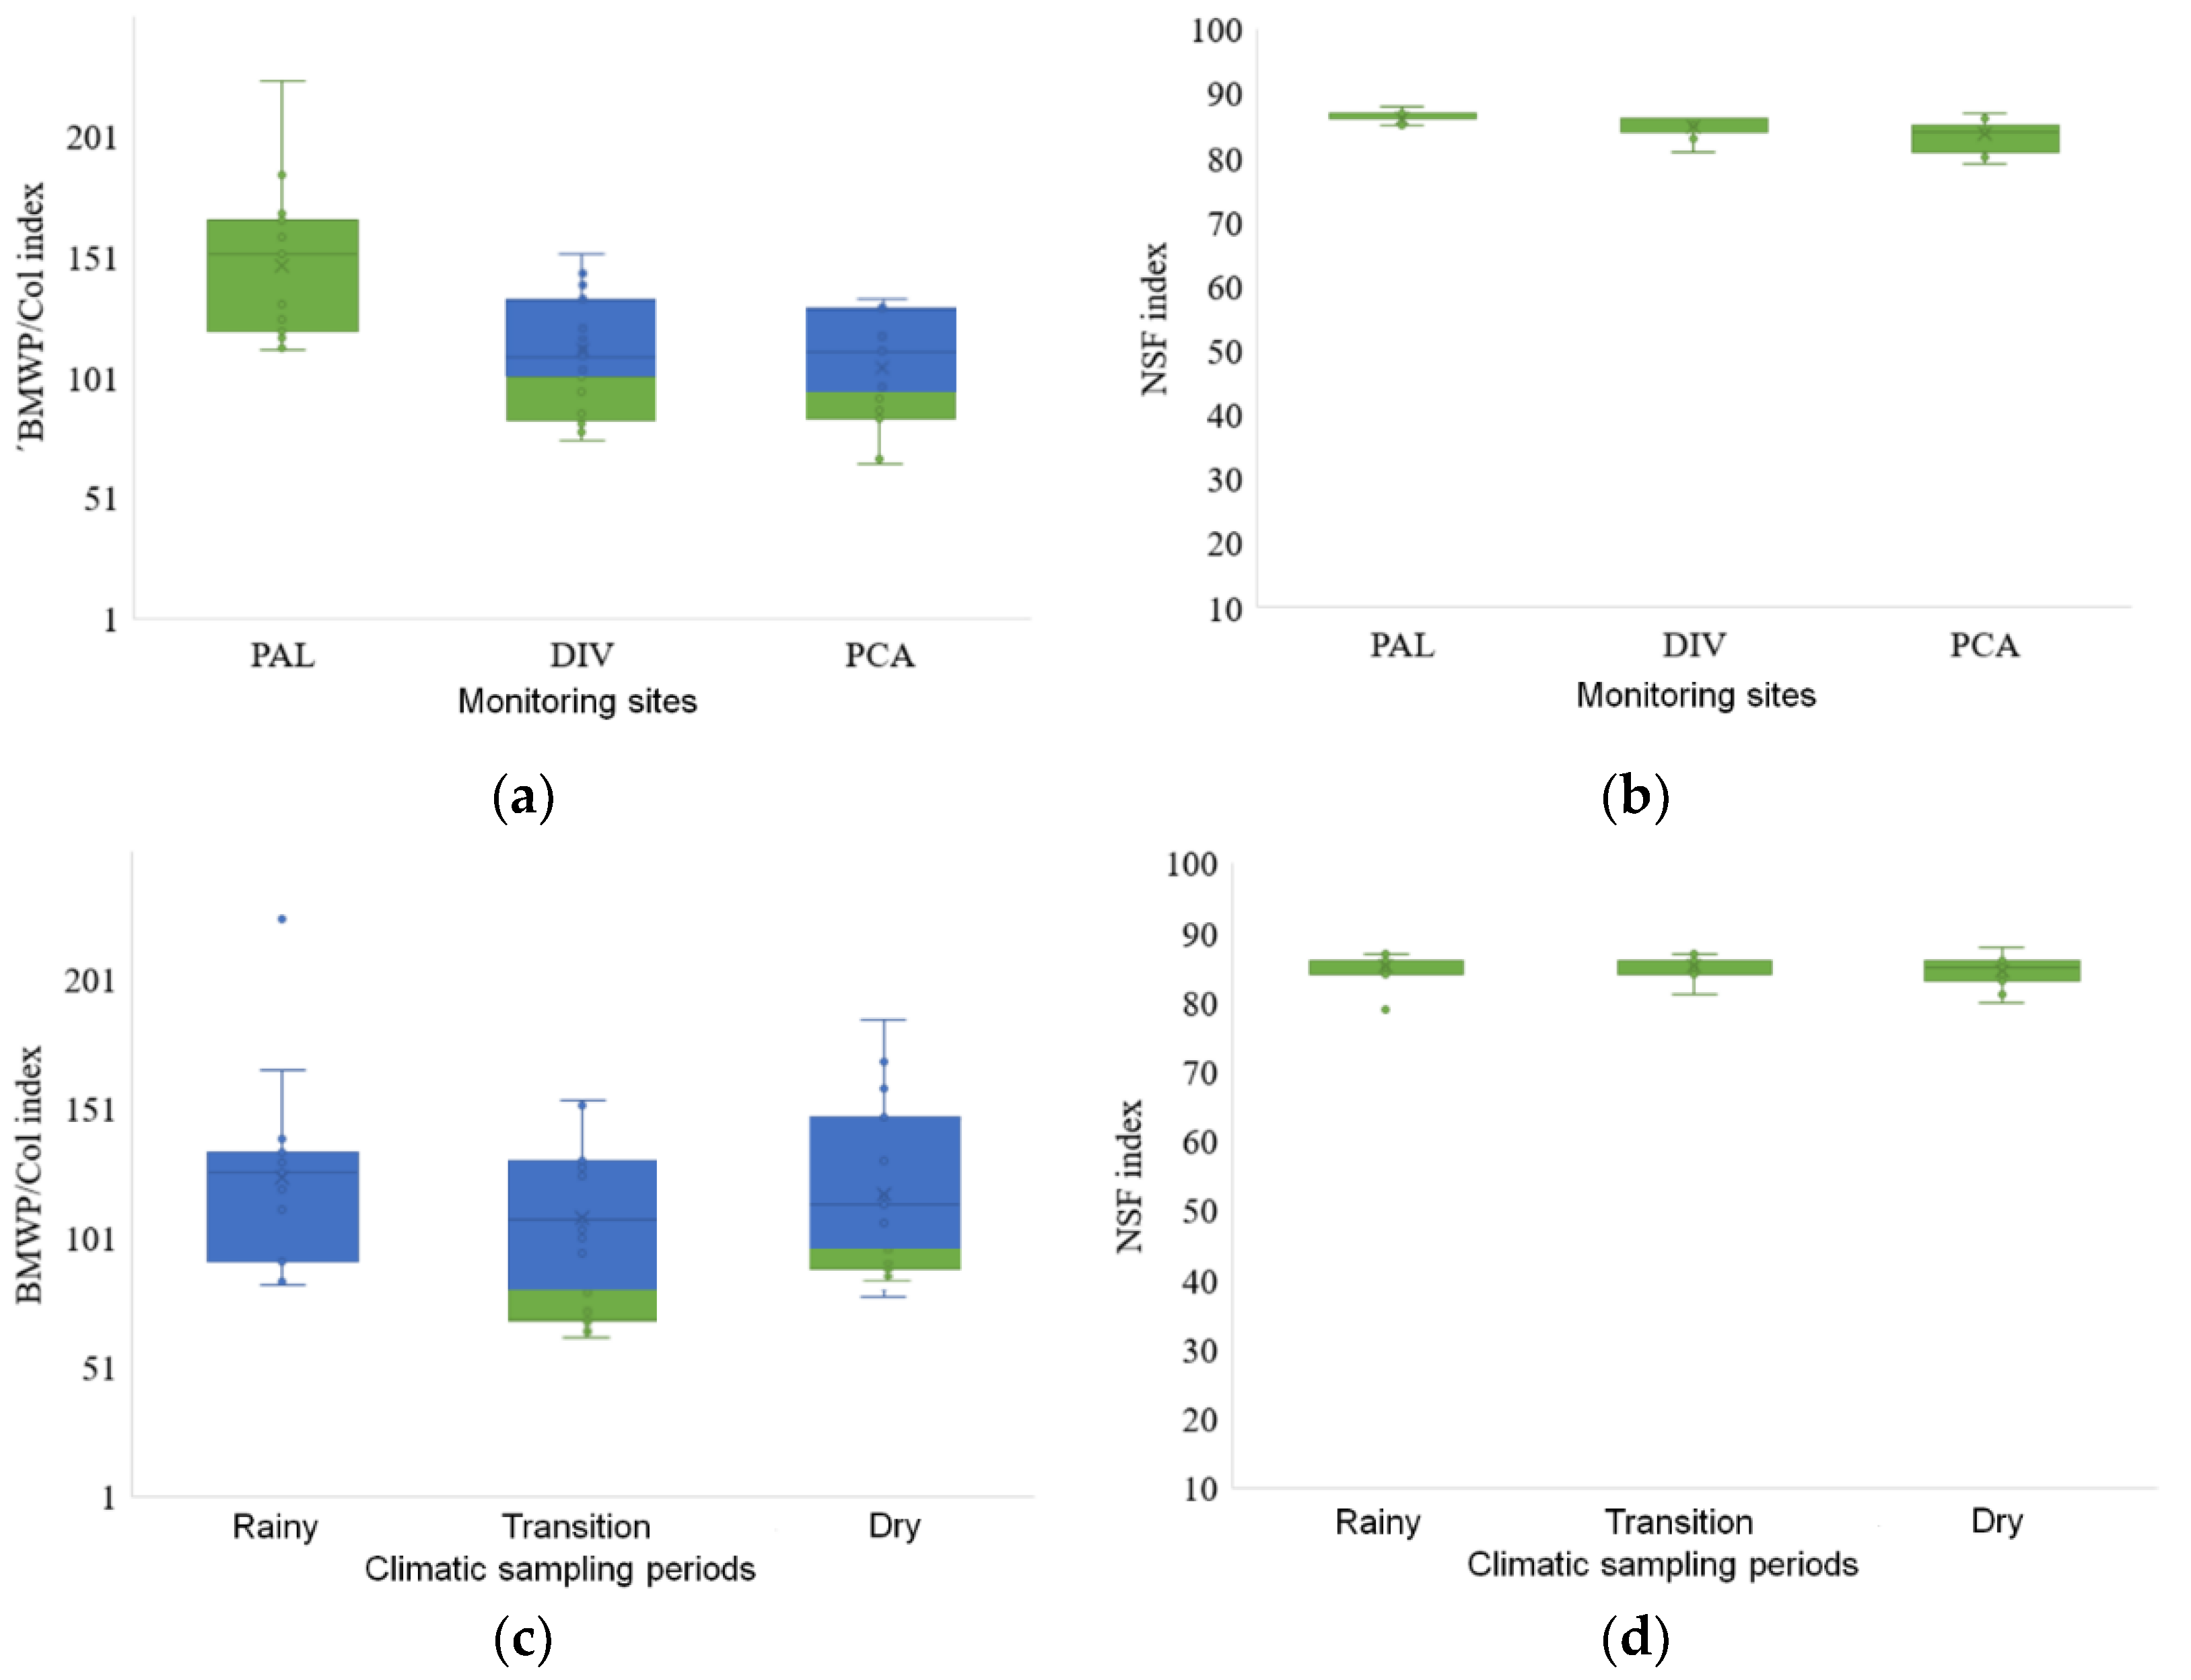
- Water quality indices
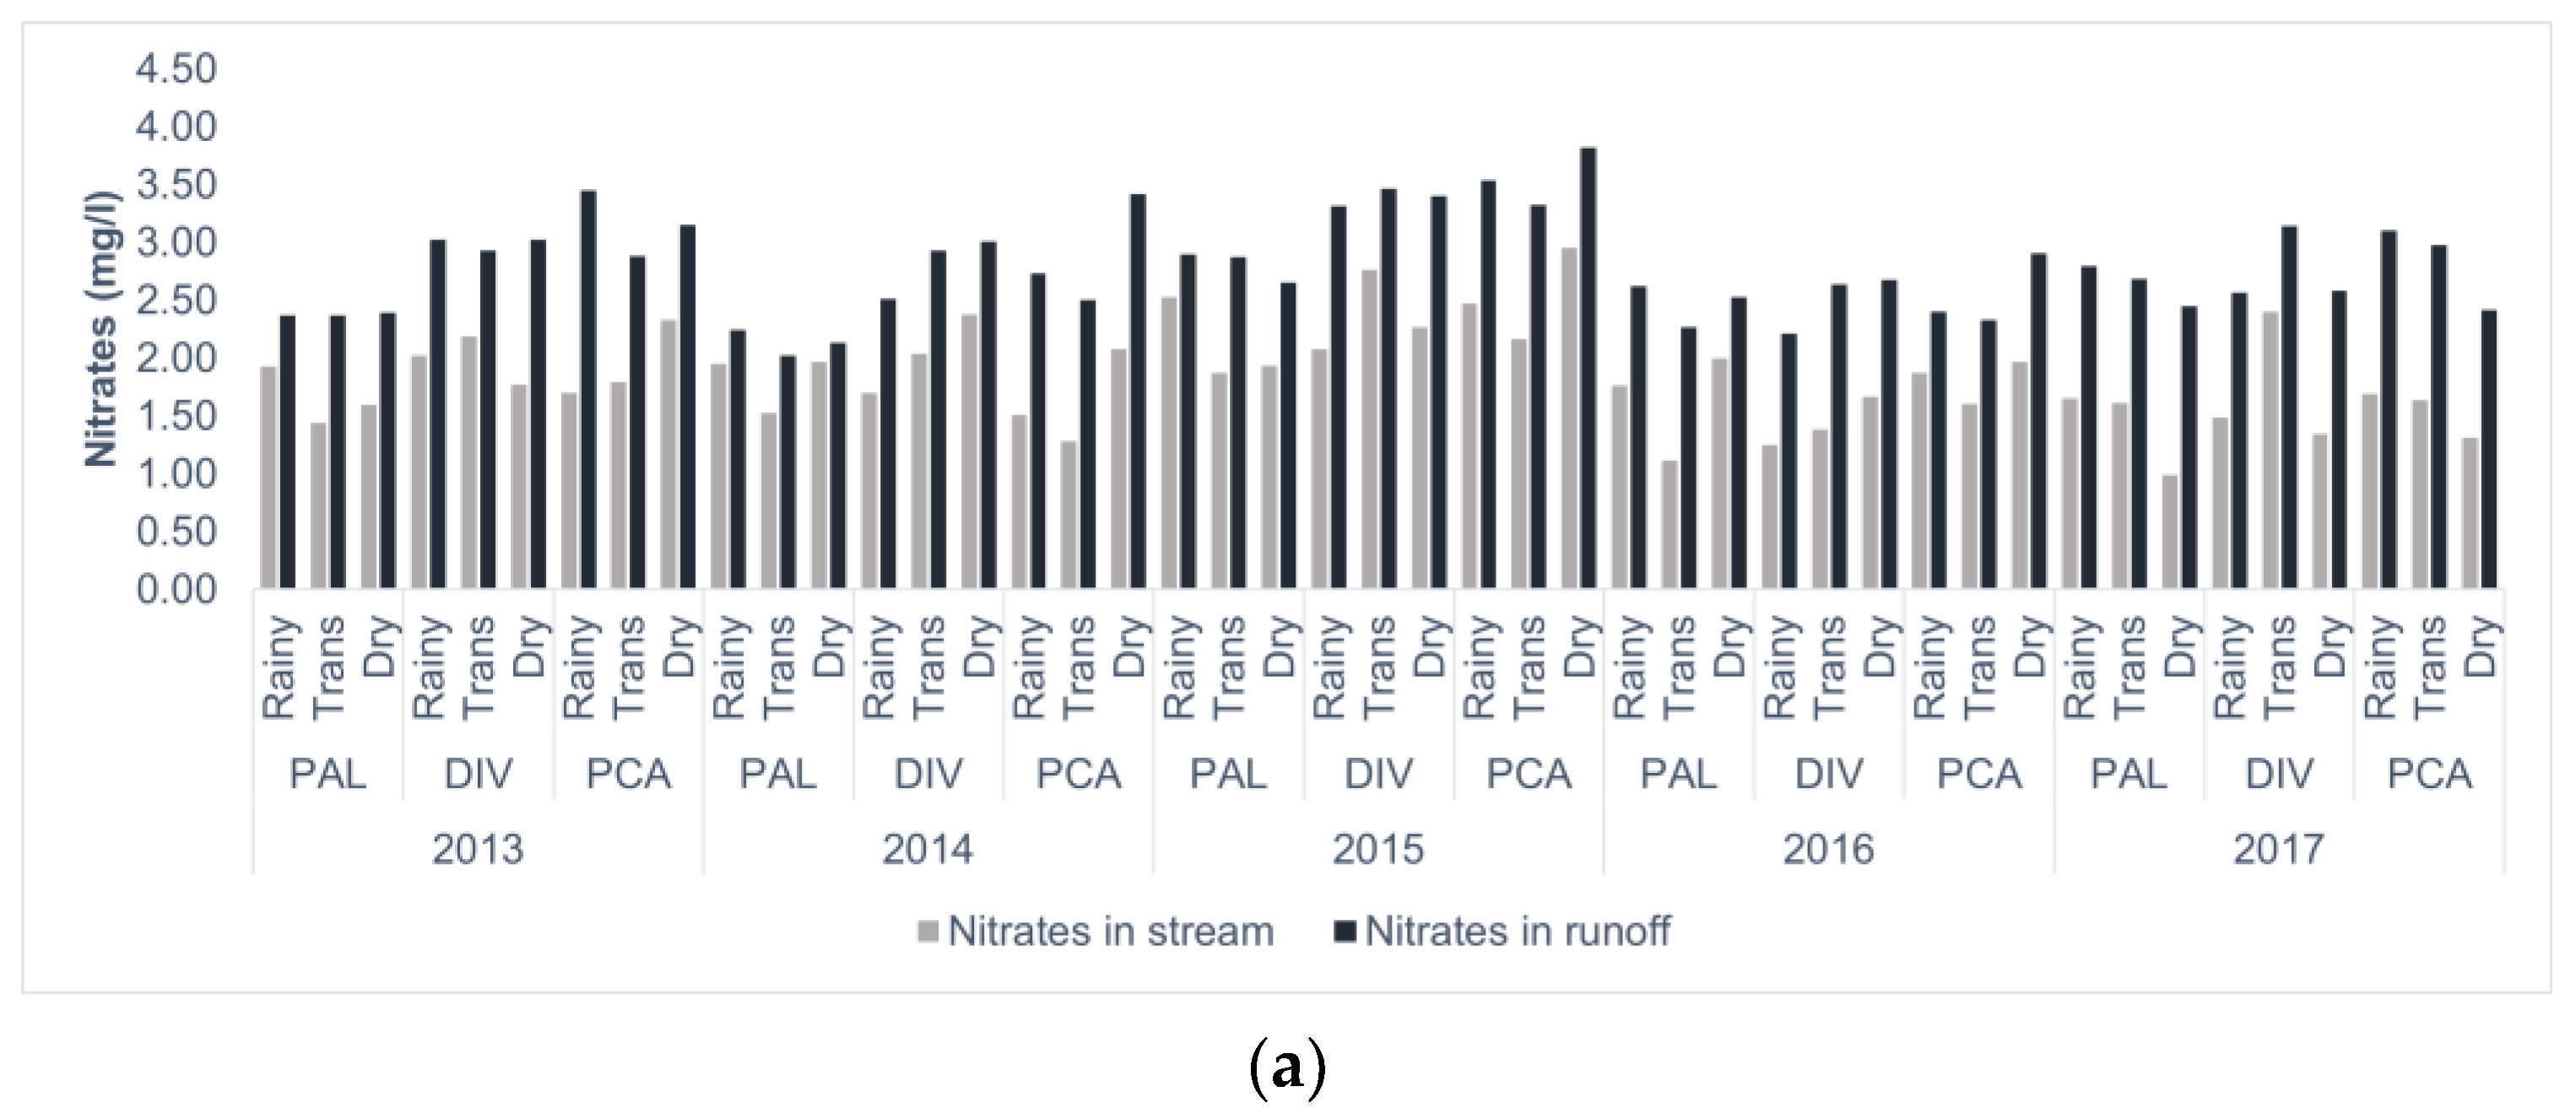
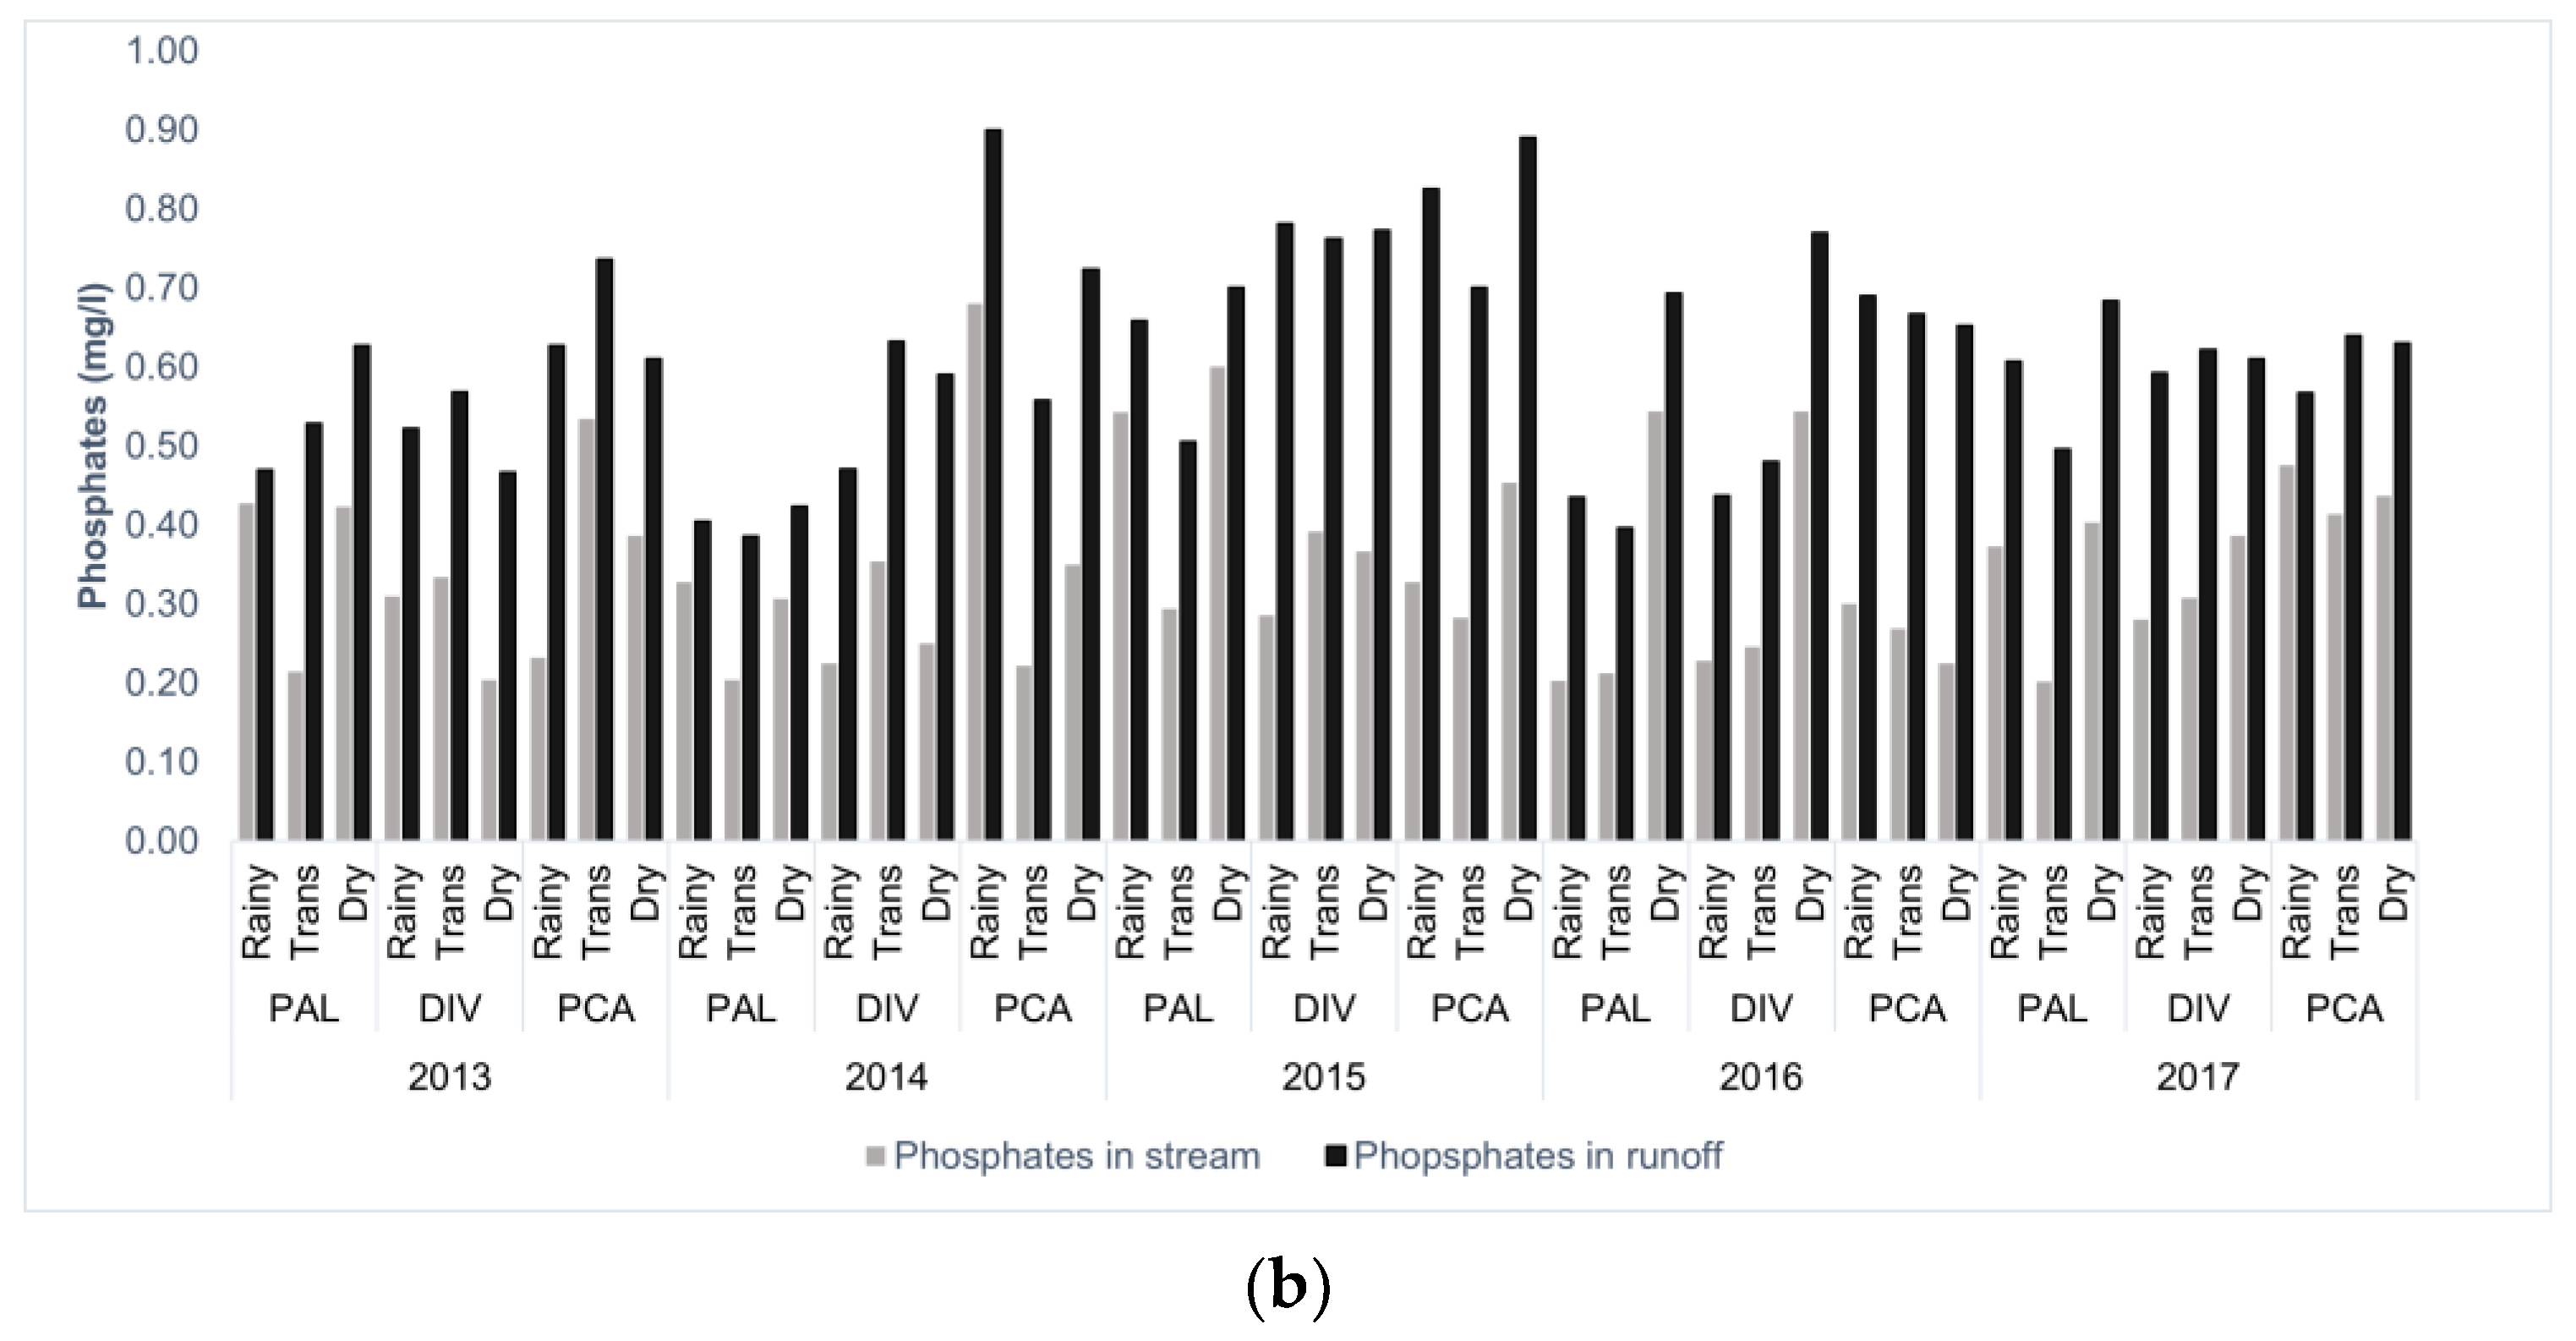
3.3.2. Surface Runoff Characterization
4. Discussion
5. Conclusions
Supplementary Materials
Author Contributions
Funding
Informed Consent Statement
Data Availability Statement
Conflicts of Interest
References
- Glavan, M.; Ceglar, A.; Pintar, M. Assessing the Impacts of Climate Change on Water Quantity and Quality Modelling in Small Slovenian Mediterranean Catchment—Lesson for Policy and Decision Makers. Hydrol. Process. 2015, 29, 3124–3144. [Google Scholar] [CrossRef]
- Nowak-Olejnik, A.; Schirpke, U.; Tappeiner, U. A Systematic Review on Subjective Well-Being Benefits Associated with Cultural Ecosystem Services. Ecosyst. Serv. 2022, 57, 101467. [Google Scholar] [CrossRef]
- Ma, S.; Li, Y.; Zhang, Y.; Wang, L.-J.; Jiang, J.; Zhang, J. Distinguishing the Relative Contributions of Climate and Land Use/Cover Changes to Ecosystem Services from a Geospatial Perspective. Ecol. Indic. 2022, 136, 108645. [Google Scholar] [CrossRef]
- Ulrich, W.; Batáry, P.; Baudry, J.; Beaumelle, L.; Bucher, R.; Čerevková, A.; de la Riva, E.G.; Felipe-Lucia, M.R.; Gallé, R.; Kesse-Guyot, E.; et al. From Biodiversity to Health: Quantifying the Impact of Diverse Ecosystems on Human Well-Being. People Nat. 2023, 5, 69–83. [Google Scholar] [CrossRef]
- Hernández Vidal, N.; Merlinsky, G.; Bolados, P. Defending the Commons: New Frontiers in Latin American Perspectives on Environmental Justice. Sociol. Inq. 2023, 93, 370–391. [Google Scholar] [CrossRef]
- Prasad, P.V.V.; Bhatnagar, N.; Bhandari, V.; Jacob, G.; Narayan, K.; Echeverría, R.; Beintema, N.; Farah Cox, P.; Compton, J. Patterns of Investment in Agricultural Research and Innovation for the Global South, with a Focus on Sustainable Agricultural Intensification. Front. Sustain. Food Syst. 2023, 7, 1108949. [Google Scholar] [CrossRef]
- Mikulewicz, N.J.W.C.; Michael, K.M. (Eds.) Climate Justice in the Majority World: Vulnerability, Resistance, and Diverse Knowledges; Routledge: London, UK, 2023; ISBN 978-1-00-321402-1. [Google Scholar]
- Pahl-Wostl, C. An Evolutionary Perspective on Water Governance: From Understanding to Transformation. Water Resour. Manag. 2017, 31, 2917–2932. [Google Scholar] [CrossRef]
- Pablo-Romero, M.P.; Sánchez-Braza, A.; Gil-Pérez, J. Is Deforestation Needed for Growth? Testing the EKC Hypothesis for Latin America. For. Policy Econ. 2023, 148, 102915. [Google Scholar] [CrossRef]
- Ministerio del Medio Ambiente. V Informe Nacional de Biodiversidad de Colombia ante el Convenio de Biodiversidad Biológica; Ministerio de Ambiente y Desarrollo Sostenible: Bogotá, Colombia, 2014; p. 80.
- Winton, R.S.; López-Casas, S.; Valencia-Rodríguez, D.; Bernal-Forero, C.; Delgado, J.; Wehrli, B.; Jiménez-Segura, L. Patterns and Drivers of Water Quality Changes Associated with Dams in the Tropical Andes. Hydrol. Earth Syst. Sci. 2023, 27, 1493–1505. [Google Scholar] [CrossRef]
- Arias Montevechio, E.; Crispin Cunya, M.; Fernández Jorquera, F.; Rendon, E.; Vásquez-Lavin, F.; Stehr, A.; Ponce Oliva, R.D. Traditional Crops and Climate Change Adaptation: Insights from the Andean Agricultural Sector. Clim. Dev. 2023, 15, 723–737. [Google Scholar] [CrossRef]
- Himanshu, S.K.; Ale, S.; Bordovsky, J.P.; Kim, J.; Samanta, S.; Omani, N.; Barnes, E.M. Assessing the Impacts of Irrigation Termination Periods on Cotton Productivity under Strategic Deficit Irrigation Regimes. Sci. Rep. 2021, 11, 20102. [Google Scholar] [CrossRef] [PubMed]
- Munoz, H.M.; Martens, L.; Löhr, K.; Bonatti, M.; Chara, J.; Perez, L.; Sieber, S.; Castro-Nunez, A. Integrating Climate Mitigation and Environmental Peacebuilding Objectives through Sustainable Land Use Systems: Theory of Change and Indicators. PLoS Clim. 2023, 2, e0000075. [Google Scholar] [CrossRef]
- Barrios Latorre, S.A.; Sadovska, V.; Chongtham, I.R. Perspectives on Agroecological Transition: The Case of Guachetá Municipality, Colombia. Agroecol. Sustain. Food Syst. 2023, 47, 382–412. [Google Scholar] [CrossRef]
- Ruiz, D.; Martínez, J.P.; Figueroa, A. Importancia del “efecto rebote” o paradoja de Jevons en el diseño de la política ambiental. Rev. Ing. Univ. De Medellín 2015, 14, 49–59. [Google Scholar] [CrossRef]
- Munar, A.M.; Mendez, N.; Narvaez, G.; Campo Zambrano, F.; Motta-Marques, D.; Lyra Fialho Brêda, J.P.; Santos Fleischmann, A.; Angarita, H. Modelling the Climate Change Impacts on River Discharge and Inundation Extent in the Magdalena River Basin—Colombia. Hydrol. Sci. J. 2023, 68, 1286–1300. [Google Scholar] [CrossRef]
- Gobierno de Colombia. Colombia—Monitoreo de territorios afectados por cultivos ilícitos 2021; Oficina de las Naciones Unidas contra la Droga y el Delito: Bogota, Colombia, 2022; p. 173. [Google Scholar]
- Suescún, D.; León, J.D.; Villegas, J.C.; Correa-Londoño, G.A. Nutrient Loss to Erosion Responds to Rain Characteristics under Transformed Landscapes in the Río Grande Basin, Colombian Andes. Ecohydrology 2023, 16, e2519. [Google Scholar] [CrossRef]
- LaRota-Aguilera, M.J.; Marull, J. Towards a Landscape-Metabolism Model for the Tropical Andes. Appl. Metrop. Reg. Cali (Colomb). Environ. Sci. Policy 2023, 140, 208–220. [Google Scholar] [CrossRef]
- Ariza-Buitrago, I.; Gómez-Betancur, L. Nature in Focus: The Invisibility and Re-Emergence of Rivers, Land and Animals in Colombia’s Transitional Justice System. Int. J. Transitional Justice 2023, 17, 71–88. [Google Scholar] [CrossRef]
- Orozco, M.C.; Ceron, L.E.; Martínez-Idrobo, J.P.; Ospina, R. Análisis de los patrones espaciales del paisaje en un corredor biológico del macizo colombiano cauca. Biotecnol. En. El Sect. Agropecu. Y Agroindustrial 2015, 13, 54–63. [Google Scholar] [CrossRef]
- Ruiz, D.M.; Martinez, J.P.; Figueroa, A. Agricultura sostenible en ecosistemas de alta montaña. Biotecnol. En. El Sect. Agropecu. Y Agroindustrial 2015, 13, 129–138. [Google Scholar] [CrossRef]
- Mejía, L.; Barrios, M. Identifying Watershed Predictors of Surface Water Quality through Iterative Input Selection. Int. J. Environ. Sci. Technol. 2023, 20, 7201–7216. [Google Scholar] [CrossRef]
- Marín-Pimentel, G.-E.; Rueda-Saa, G.; Menjivar-Flores, J.C. Evaluation of Physicochemical Properties in Agricultural Soils on the Flat and Piedmont Areas of Valle Del Cauca, Colombia with Emphasis on Degradation. Environ. Earth Sci. 2023, 82, 157. [Google Scholar] [CrossRef]
- Núñez, A.P.B.; Gutiérrez-Montes, I.; Hernández-Núñez, H.E.; Suárez, D.R.G.; García, G.A.G.; Suárez, J.C.; Casanoves, F.; Flora, C.; Sibelet, N. Diverse Farmer Livelihoods Increase Resilience to Climate Variability in Southern Colombia. Land Use Policy 2023, 131, 106731. [Google Scholar] [CrossRef]
- Azhoni, A.; Jude, S.; Holman, I. Adapting to Climate Change by Water Management Organisations: Enablers and Barriers. J. Hydrol. 2018, 559, 736–748. [Google Scholar] [CrossRef]
- Almansa-Manrique, É.F.; Velásquez-Penagos, J.G.; Rodríguez-Yzquierdo, G.A. Effect of the Use of Production Water of Petroleum Industry in Agricultural and Livestock Activities. Corpoica Cienc. Y Tecnol. Agropecu. 2018, 19, 403–420. [Google Scholar] [CrossRef]
- Hairani, A.; Noor, M. Water Management on Peatland for Food Crop and Horticulture Production: Research Review in Kalimantan. IOP Conf. Ser. Earth Environ. Sci. 2020, 499, 012006. [Google Scholar] [CrossRef]
- Lin Lawell, C.-Y.C.; Paudel, K.P.; Pandit, M. One Shape Does Not Fit All: A Nonparametric Instrumental Variable Approach to Estimating the Income-Pollution Relationship at the Global Level. Water Resour. Econ. 2018, 21, 3–16. [Google Scholar] [CrossRef]
- Berrios, F.; Campbell, D.E.; Ortiz, M. Emergy-Based Indicators for Evaluating Ecosystem Health: A Case Study of Three Benthic Ecosystem Networks Influenced by Coastal Upwelling in Northern Chile (SE Pacific Coast). Ecol. Indic. 2018, 95, 379–393. [Google Scholar] [CrossRef]
- Meza-Salazar, A.M.; Guevara, G.; Gomes-Dias, L.; Cultid-Medina, C.A. Density and Diversity of Macroinvertebrates in Colombian Andean Streams Impacted by Mining, Agriculture and Cattle Production. PeerJ 2020, 8, e9619. [Google Scholar] [CrossRef]
- Mohamamad, A.; Jalal, K.C.A. Macrobenthic Diversity and Community Composition in the Pahang Estuary, Malaysia. J. Coast. Res. 2018, 82, 206–211. [Google Scholar] [CrossRef]
- Mendieta-Mendoza, A.; Rentería-Villalobos, M.; Chávez-Flores, D.; Santellano-Estrada, E.; Pinedo-Álvarez, C.; Ramos-Sánchez, V.H. Reconnesaince of Chemically Vulnerable Areas of an Aquifer under Arid Conditions with Agricultural Uses. Agric. Water Manag. 2020, 233, 106100. [Google Scholar] [CrossRef]
- Torti, M.J.; Portela, S.I.; Andriulo, A.E. Phosphorus and Nitrogen Fractions during Base Flow Conditions of a Pampean Stream and Their Relationship with Land Use. Ecol. Austral 2020, 30, 331–343. [Google Scholar] [CrossRef]
- Peluso, J.; Aronzon, C.M.; Ríos de Molina, M.C.; Rojas, D.E.; Cristos, D.; Pérez Coll, C.S. Integrated Analysis of the Quality of Water Bodies from the Lower Paraná River Basin with Different Productive Uses by Physicochemical and Biological Indicators. Environ. Pollut. 2020, 263, 114434. [Google Scholar] [CrossRef] [PubMed]
- Aguirre, M.A.; Rojas, A.G.; Bermudez, O.B.; Trochez, F.V.B. Effects of human extractive activities and recreational services on water quality/efectos de actividades humanas extractivas y servicios recreativos sobre la calidad del agua. Rev. De. Gest. Soc. E Ambient. 2020, 14, 82–105. [Google Scholar] [CrossRef]
- Esse, C.; Santander-Massa, R.; Encina-Montoya, F.; De los Ríos, P.; Fonseca, D.; Saavedra, P. Multicriteria Spatial Analysis Applied to Identifying Ecosystem Services in Mixed-Use River Catchment Areas in South Central Chile. For. Ecosyst. 2019, 6, 25. [Google Scholar] [CrossRef]
- Matthews, R.B.; Gilbert, N.G.; Roach, A.; Polhill, J.G.; Gotts, N.M. Agent-Based Land-Use Models: A Review of Applications. Landsc. Ecol. 2007, 22, 1447–1459. [Google Scholar] [CrossRef]
- Zhang, J.; Qu, M.; Wang, C.; Zhao, J.; Cao, Y. Quantifying Landscape Pattern and Ecosystem Service Value Changes: A Case Study at the County Level in the Chinese Loess Plateau. Glob. Ecol. Conserv. 2020, 23, e01110. [Google Scholar] [CrossRef]
- Robinson, D.T.; Brown, D.G. Evaluating the Effects of Land-use Development Policies on Ex-urban Forest Cover: An Integrated Agent-based GIS Approach. Int. J. Geogr. Inf. Sci. 2009, 23, 1211–1232. [Google Scholar] [CrossRef]
- Musakwa, W. Identifying Land Suitable for Agricultural Land Reform Using GIS-MCDA in South Africa. Environ. Dev. Sustain. 2018, 20, 2281–2299. [Google Scholar] [CrossRef]
- Verburg, P.H.; van de Steeg, J.; Veldkamp, A.; Willemen, L. From Land Cover Change to Land Function Dynamics: A Major Challenge to Improve Land Characterization. J. Environ. Manag. 2009, 90, 1327–1335. [Google Scholar] [CrossRef]
- Polaine, X.K.; Dawson, R.; Walsh, C.L.; Amezaga, J.; Peña-Varón, M.; Lee, C.; Rao, S. Systems Thinking for Water Security. Civ. Eng. Environ. Syst. 2022, 39, 205–223. [Google Scholar] [CrossRef]
- Bodin, Ö.; Crona, B.I. The Role of Social Networks in Natural Resource Governance: What Relational Patterns Make a Difference? Glob. Environ. Chang. 2009, 19, 366–374. [Google Scholar] [CrossRef]
- Felipe-Lucia, M.R.; Guerrero, A.M.; Alexander, S.M.; Ashander, J.; Baggio, J.A.; Barnes, M.L.; Bodin, Ö.; Bonn, A.; Fortin, M.-J.; Friedman, R.S.; et al. Conceptualizing Ecosystem Services Using Social–Ecological Networks. Trends Ecol. Evol. 2022, 37, 211–222. [Google Scholar] [CrossRef] [PubMed]
- Li, M.; Cao, X.; Liu, D.; Fu, Q.; Li, T.; Shang, R. Sustainable Management of Agricultural Water and Land Resources under Changing Climate and Socio-Economic Conditions: A Multi-Dimensional Optimization Approach. Agric. Water Manag. 2022, 259, 107235. [Google Scholar] [CrossRef]
- Loboguerrero, A.M.; Boshell, F.; León, G.; Martinez-Baron, D.; Giraldo, D.; Recaman Mejía, L.; Díaz, E.; Cock, J. Bridging the Gap between Climate Science and Farmers in Colombia. Clim. Risk Manag. 2018, 22, 67–81. [Google Scholar] [CrossRef]
- Bovolo, F.; Bruzzone, L.; Solano-Correa, Y.T. Multitemporal Analysis of Remotely Sensed Image Data. In Comprehensive Remote Sensing; Liang, S., Ed.; Elsevier: Oxford, UK, 2018; pp. 156–185. ISBN 978-0-12-803221-3. [Google Scholar]
- Hobouchian, M.P.; Salio, P.; García Skabar, Y.; Vila, D.; Garreaud, R. Assessment of Satellite Precipitation Estimates over the Slopes of the Subtropical Andes. Atmos. Res. 2017, 190, 43–54. [Google Scholar] [CrossRef]
- Valencia, S.; Marín, D.E.; Gómez, D.; Hoyos, N.; Salazar, J.F.; Villegas, J.C. Spatio-Temporal Assessment of Gridded Precipitation Products across Topographic and Climatic Gradients in Colombia. Atmos. Res. 2023, 285, 106643. [Google Scholar] [CrossRef]
- Lafuente, W.; Carpio, A.J.; Alcácer, C.; Moreno, J.L. Spatio-Temporal Variability of Physicochemical Conditions in the Headwaters of Neotropical Streams. J. South Am. Earth Sci. 2023, 126, 104361. [Google Scholar] [CrossRef]
- Tangarife-Escobar, A.; Koeniger, P.; López-Moreno, J.I.; Botía, S.; Ceballos-Liévano, J.L. Spatiotemporal Variability of Stable Isotopes in Precipitation and Stream Water in a High Elevation Tropical Catchment in the Central Andes of Colombia. Hydrol. Process. 2023, 37, e14873. [Google Scholar] [CrossRef]
- Castaño Uribe, C.; Carrillo Carrillo, R. (Eds.) Sistema de Información Ambiental de Colombia -SIAC-: Primera Generación de Indicadores de la Línea Base de la Información Ambiental de Colombia; IDEAM: Bogotá, Colombia, 2002; Volume 2, ISBN 978-958-8067-08-7.
- Marull, J.; Delgadillo, O.; Cattaneo, C.; La Rota, M.J.; Krausmann, F. Socioecological Transition in the Cauca River Valley, Colombia (1943–2010): Towards an Energy–Landscape Integrated Analysis. Reg. Environ. Chang. 2018, 18, 1073–1087. [Google Scholar] [CrossRef]
- Lumia, G.; Praticò, S.; Di Fazio, S.; Cushman, S.; Modica, G. Combined Use of Urban Atlas and Corine Land Cover Datasets for the Implementation of an Ecological Network Using Graph Theory within a Multi-Species Approach. Ecol. Indic. 2023, 148, 110150. [Google Scholar] [CrossRef]
- Fagua, J.C.; Rodríguez-Buriticá, S.; Jantz, P. Advancing High-Resolution Land Cover Mapping in Colombia: The Importance of a Locally Appropriate Legend. Remote Sens. 2023, 15, 2522. [Google Scholar] [CrossRef]
- Pencue-Fierro, E.L.; Solano-Correa, Y.T.; Corrales-Muñoz, J.C.; Figueroa-Casas, A. A Semi-Supervised Hybrid Approach for Multitemporal Multi-Region Multisensor Landsat Data Classification. IEEE J. Sel. Top. Appl. Earth Obs. Remote Sens. 2016, 9, 5424–5435. [Google Scholar] [CrossRef]
- Arrechea-Castillo, D.A.; Solano-Correa, Y.T.; Muñoz-Ordóñez, J.F.; Pencue-Fierro, E.L.; Figueroa-Casas, A. Multiclass Land Use and Land Cover Classification of Andean Sub-Basins in Colombia with Sentinel-2 and Deep Learning. Remote Sens. 2023, 15, 2521. [Google Scholar] [CrossRef]
- Sarmiento López, A.H.; Etter Rothlisberger, A.A.; González Arenas, J.J.; Orrego Suaza, S.A. Análisis de Tendencias y Patrones Espaciales de Deforestación en Colombia; Nstituto de Hidrología, Meteorología y Estudios Ambientales-IDEAM: Bogotá, Colombia, 2011; ISBN 978-958-8067-48-3.
- Unescosost, T. AQUARISC—Vulnerabilidad y Riesgo En Sistemas de Agua Potable En El Cauca. Available online: https://www.unescosost.org/post/vulnerabilidad-y-riesgo-en-sistemas-de-agua-potable-en-el-cauca-aquarisc (accessed on 11 October 2023).
- AQUARISC, Proyecto de la Gobernación del Cauca Busca Generar Uso Adecuado y Conservación Del Agua. Available online: https://anterior.cauca.gov.co/noticias/aquarisc-proyecto-de-la-gobernacion-del-cauca-busca-generar-uso-adecuado-y-conservacion-del (accessed on 11 October 2023).
- Blanco, M.; Montes, F.; Borrero-Echeverry, F.; Solano-Blanco, A.L.; Gomez, C.; Zuluaga, P.; Rivera-Trujillo, H.F.; Rincon, D.F. A Participative System Methodology to Model Pest Dynamics in an Agricultural Setting. Kybernetes 2022, 52, 3550–3565. [Google Scholar] [CrossRef]
- Chignard, S.; Glatron, M. Data Collaborations at a Local Scale: Lessons Learnt in Rennes (2010–2021). Data Policy 2023, 5, e20. [Google Scholar] [CrossRef]
- Kumar, A.; Palmate, S.S.; Shukla, R. Water Quality Modelling, Monitoring, and Mitigation. Appl. Sci. 2022, 12, 11403. [Google Scholar] [CrossRef]
- Nagaraju, T.V.; Sunil, B.M.; Chaudhary, B.; Prasad, C.D.; Gobinath, R. Prediction of Ammonia Contaminants in the Aquaculture Ponds Using Soft Computing Coupled with Wavelet Analysis. Environ. Pollut. 2023, 331, 121924. [Google Scholar] [CrossRef]
- Nagaraju, T.V.; Malegole, S.B.; Chaudhary, B.; Ravindran, G. Assessment of Environmental Impact of Aquaculture Ponds in the Western Delta Region of Andhra Pradesh. Sustainability 2022, 14, 13035. [Google Scholar] [CrossRef]
- Fernández, N.; Ramírez, A.; Solano, F. Physico-chemical water quality indices—A comparative review. Bistua Rev. De La Fac. De Cienc. Basicas 2004, 2, 19–30. [Google Scholar]
- Roldán-Pérez, G. Bioindicación de la Calidad del Agua en Colombia: Propuesta Para el Uso del Método BMWP Col; Editorial Universidad de Antioquia: Medellín, Colombia, 2003. [Google Scholar]
- Lobato-Vargas, R. Escorrentía de Una Cuenca Mediante la Aplicación de un Simulador de Lluvia. Caso: Río Chanta, La Encañada—Cajamarca, 2015; National University of Cajamarca: Cajamarca, Peru, 2015. [Google Scholar]
- Cobo-Quintero, L.; Amézquita-Collazos, E. Diseño, construccion y evaluación de un minisimulador de lluvia para estudios de susceptibilidad a erosión en laderas. Rev. Suelos Ecuat. 1999, 29, 66–70. [Google Scholar]
- Otero, J.D.; Figueroa, A.; Muñoz, F.A.; Peña, M.R. Loss of Soil and Nutrients by Surface Runoff in Two Agro-Ecosystems within an Andean Paramo Area. Ecol. Eng. 2011, 37, 2035–2043. [Google Scholar] [CrossRef]
- Ruiz, D.M.; Idrobo, J.P.M.; Sarmiento, J.D.O.; Casas, A.F. Effects of productive activities on the water quality for human consumption in an Andean basin, a case study. Rev. Int. De. Contam. Ambient. 2017, 33, 361–375. [Google Scholar] [CrossRef]
- Greenberg, A.E.; Clesceri, L.S.; Trussell, R.R. Standard Methods for the Examination of Water and Wastewater, 23rd ed.; American Water Works Association (AWWA, WEF and APHA): Washington, DC, USA, 2017. [Google Scholar]
- Kruskal, W.H.; Wallis, W.A. Use of Ranks in One-Criterion Variance Analysis. J. Am. Stat. Assoc. 1952, 47, 583–621. [Google Scholar] [CrossRef]
- Spiegel, M.R.; Schiller, J. Theory and Problems of Probability and Statistics (Schaum’s Outline Series), 1st ed.; McGraw-Hill Education (India) Pvt Limited: New York, NY, USA, 2003; ISBN 978-0-07-058610-9. [Google Scholar]
- Bastidas, J.C.; Vélez, J.J.; Zambrano, J.; Londoño, A. Design of Water Quality Monitoring Networks with Two Information Scenarios in Tropical Andean Basins. Environ. Sci. Pollut. Res. 2017, 24, 20134–20148. [Google Scholar] [CrossRef]
- World Health Organization. Guidelines for Drinking-Water Quality [Electronic Resource]: Incorporating 1st and 2nd Addenda, Vol.1, Recommendations, 3rd ed.; World Health Organization: Geneva, Switzerland, 2008; ISBN 978-92-4-154761-1.
- Parlamento Europeo Directiva 2000/60/CE Del Parlamento Europeo y Del Consejo, de 23 de Octubre de 2000, Por La Que Se Establece Un Marco Comunitario de Actuación En El Ámbito de La Política de Aguas. Available online: https://www.boe.es/buscar/doc.php?id=DOUE-L-2000-82524 (accessed on 21 October 2021).
- Howland, F.; Le Coq, J.-F. Adaptation to Climate Change in Colombia: Concepts and Policies; CIAT: Cali, Colombia, 2018; p. 100. [Google Scholar]
- Harden, C.P.; Hartsig, J.; Farley, K.A.; Lee, J.; Bremer, L.L. Effects of Land-Use Change on Water in Andean Páramo Grassland Soils. Ann. Assoc. Am. Geogr. 2013, 103, 375–384. [Google Scholar] [CrossRef]
- Mulligan, M.; Rubiano, J.; Hyman, G.; White, D.; Garcia, J.; Saravia, M.; Gabriel Leon, J.; Selvaraj, J.J.; Guttierez, T.; Leonardo Saenz-Cruz, L. The Andes Basins: Biophysical and Developmental Diversity in a Climate of Change. Water Int. 2010, 35, 472–492. [Google Scholar] [CrossRef]


| Studied Year and Associated Historical Event | ||||||||||||
|---|---|---|---|---|---|---|---|---|---|---|---|---|
| MONTH | 1 | 2 | 3 | 4 | 5 | 6 | 7 | 8 | 9 | 10 | 11 | 12 |
| Weather Conditions | Semi-arid, wet, rainy, dry, windy, hail, others. | |||||||||||
| AGRICULTURAL ACTIVITIES | TASKS | |||||||||||
| 1. Dual purpose livestock | Preparation of the land, sowing grass, milk production, maintenance of beef cattle and paddocks, others. | |||||||||||
| 2. Artisanal fish farming (e.g., trout) | Harvest once weight reaches 250–300 g, commercialization in organic markets, pond maintenance, fish stocking, others. | |||||||||||
| 3. Horticultural crops (e.g., corn, beans, blackberries, peas) | Land preparation, planting, weeding, fertilizing, pest control, harvesting, seed saving, others. | |||||||||||
| 4. Dairy products | Permanent production and commercialization | |||||||||||
| 5. Minor species (e.g., hens, guinea pigs, chickens) | Shelter maintenance, purchasing young of breeding, feeding, monitoring health, commercialization, others. | |||||||||||
| Parameter | Minimum | Maximum | Mean | Typical Deviation | Standard Limits for Human Consumption * |
|---|---|---|---|---|---|
| Temperature (°C) | 15.130 | 18.820 | 16.620 | 0.873 | 25 |
| Conductivity () | 33.800 | 120.900 | 65.721 | 12.750 | 1 |
| TDS (mg/L) | 16.900 | 66.200 | 32.296 | 6.906 | ≤100 |
| O (mg/L) | 6.200 | 10.200 | 7.900 | 0.683 | >7 |
| %O | 95.000 | 107.567 | 100.644 | 1.969 | >70 |
| pH | 6.760 | 7.980 | 7.311 | 0.246 | 6.5–8.5 |
| Nitrates (mg/L) | 0.350 | 3.490 | 1.834 | 0.665 | 0.2 |
| Turbidity (NTU) | 0.200 | 10.000 | 2.389 | 1.374 | 5 |
| Phosphates (mg/L) | 0.060 | 0.990 | 0.338 | 0.173 | 0.5 |
Disclaimer/Publisher’s Note: The statements, opinions and data contained in all publications are solely those of the individual author(s) and contributor(s) and not of MDPI and/or the editor(s). MDPI and/or the editor(s) disclaim responsibility for any injury to people or property resulting from any ideas, methods, instructions or products referred to in the content. |
© 2023 by the authors. Licensee MDPI, Basel, Switzerland. This article is an open access article distributed under the terms and conditions of the Creative Commons Attribution (CC BY) license (https://creativecommons.org/licenses/by/4.0/).
Share and Cite
Ruiz-Ordóñez, D.M.; Solano-Correa, Y.T.; Maysels, R.; Figueroa-Casas, A. Land-Use Dynamics and Water Quality in Andean Basins. Sustainability 2023, 15, 15965. https://doi.org/10.3390/su152215965
Ruiz-Ordóñez DM, Solano-Correa YT, Maysels R, Figueroa-Casas A. Land-Use Dynamics and Water Quality in Andean Basins. Sustainability. 2023; 15(22):15965. https://doi.org/10.3390/su152215965
Chicago/Turabian StyleRuiz-Ordóñez, Diana Marcela, Yady Tatiana Solano-Correa, Rachael Maysels, and Apolinar Figueroa-Casas. 2023. "Land-Use Dynamics and Water Quality in Andean Basins" Sustainability 15, no. 22: 15965. https://doi.org/10.3390/su152215965
APA StyleRuiz-Ordóñez, D. M., Solano-Correa, Y. T., Maysels, R., & Figueroa-Casas, A. (2023). Land-Use Dynamics and Water Quality in Andean Basins. Sustainability, 15(22), 15965. https://doi.org/10.3390/su152215965