Article

The Impacts of Subjective Health and Life Expenses on Quality of Life for Korean Elderly People

1
Department of Tourism and Recreation, Kyonggi University, Suwon 443760, Republic of Korea
2
Department of Tourism Administration, Kangwon National University, Chuncheon 24341, Republic of Korea
*
Author to whom correspondence should be addressed.
Sustainability 2023, 15(22), 15868; https://doi.org/10.3390/su152215868
Submission received: 2 October 2023 / Revised: 8 November 2023 / Accepted: 10 November 2023 / Published: 12 November 2023

Abstract

:
The proportion of elderly individuals has been increasing in Korea. Under this condition, it is essential to understand the behavioral characteristics of elderly individuals to build adequate policies. The purpose of this research was to investigate the determinants of quality of life for Korean senior citizens, specifically, their subjective health and their regular medical, housing, and clothing expenditures. Data were collected from a Korean senior citizen research panel, and the study period was 2018–2020. Multiple linear panel regression analyses were conducted for the analysis of panel data, which includes ordinary least squares, random effects, and fixed effects. In the results, quality of life for older Korean adults was positively affected by subjective health and clothing expenditures. However, quality of life was negatively influenced by medical and housing spending. The results of this work could offer information for building policies for better senior welfare.

1. Introduction

In Korea, the proportion of elderly individuals has been steadily increasing over time. Specifically, the proportion of old Koreans in 2021 was 16.5 percent, and statistics forecast that the proportion will reach approximately 20 percent in 2025 [1]. This indicates that aging is an essential issue in Korean society, and an aging society is likely to confront various problems. Therefore, the Korean government will need to allocate more resources toward policies to support senior citizens. For more efficient budgeting, it is critical to understand the behavioral characteristics of elderly individuals. Thus, it is worthwhile to inspect some of the behavioral characteristics of elderly people for more adequate policy design.
Quality of life is the main attribute of this study. It is a common research subject because it is a representative indicator of individual life status [2,3]. That is, a high score for quality of life indicates a better status of living [4,5]. Moreover, many studies have chosen quality of life as the main attribute to inspect [2,4,5,6]. It can be inferred that such bountiful work indicates that quality of life is a valuable attribute to inspect. In general, numerous studies have employed quality of life as the dependent variable [7,8,9,10]. It can be inferred that quality of life is valuable to investigate as the dependent variable. With respect to such prior studies, this research investigates the determinants of quality of life.
As an antecedent to quality of life, this work selected subjective health because numerous studies have demonstrated that subjective health is a precondition for quality of life [11,12,13]. Scholars have also alluded that sound health conditions are a precondition for better living [14,15,16,17]. Regarding such an argument, it is imperative to confirm the argument empirically. Hence, subjective health becomes the first attribute to account for quality of life for Korean older adults in this research.
Consumption patterns are the other main element of this research. Researchers argue that people spend their money where they believe it will be valuable [18,19]. Additionally, individual consumption patterns enable researchers to determine what people prioritize in their daily lives [19,20]. This finding implies that consumption patterns might become an important clue for the investigation of behavioral characteristics. This study thus examines the spending pattern of Korean older adults. Next, this research selected three spending categories to study regarding their impacts on older adults’ quality of life: medical, housing, and clothing. First, previous research has claimed that elderly adults spend a greater proportion of their resources on health conditions because of the higher likelihood of illness and weaker physical condition in old age [21,22,23]. This suggests that medical expenditure could become the central element of the livelihood of elderly individuals. Next, scholars have also established that older people tend to spend more money and time at home [24,25,26]. In other words, houses could be more important areas in old age, and housing costs are likely to become a critical cost driver for the life of elderly people. Therefore, housing costs should be the main areas of spending. Plus, this study selected clothing expenditures because people cannot live without clothing, but what they spend varies depending on, among other things, what they can afford; relatively wealthy people are likely to allot more of their budgets to clothing. Such characteristics lead this research to inspect the effect of clothing expenses on quality of life.
Interestingly, even though spending patterns are useful information as part of determining individuals’ behavioral characteristics, insufficient previous studies have researched these patterns in elderly individuals. Moreover, scholars have also rarely explored the effect of medical, housing, and clothing expenses on quality of life for the elderly, even though it is indispensable for the livelihood of the older adults more. Such a gap in the literature prompted this work to investigate the effects of consumption patterns on their quality of life. Therefore, the aim of this work is to examine the determinants of the Korean elderly’s quality of life using four attributes: subjective health, medical expense, housing expense, and clothing expense. This might shed light on the literature by offering more information on quality of life among older adults given their rapidly increasing proportion of the population in Korea. Moreover, this work contributes to the sustainable sciences by presenting guidelines for good health and well-being for all ages, considering the documentation of the United Nations [27]. The results of this research could offer information for policy makers to build more appropriate policies for elderly individuals.

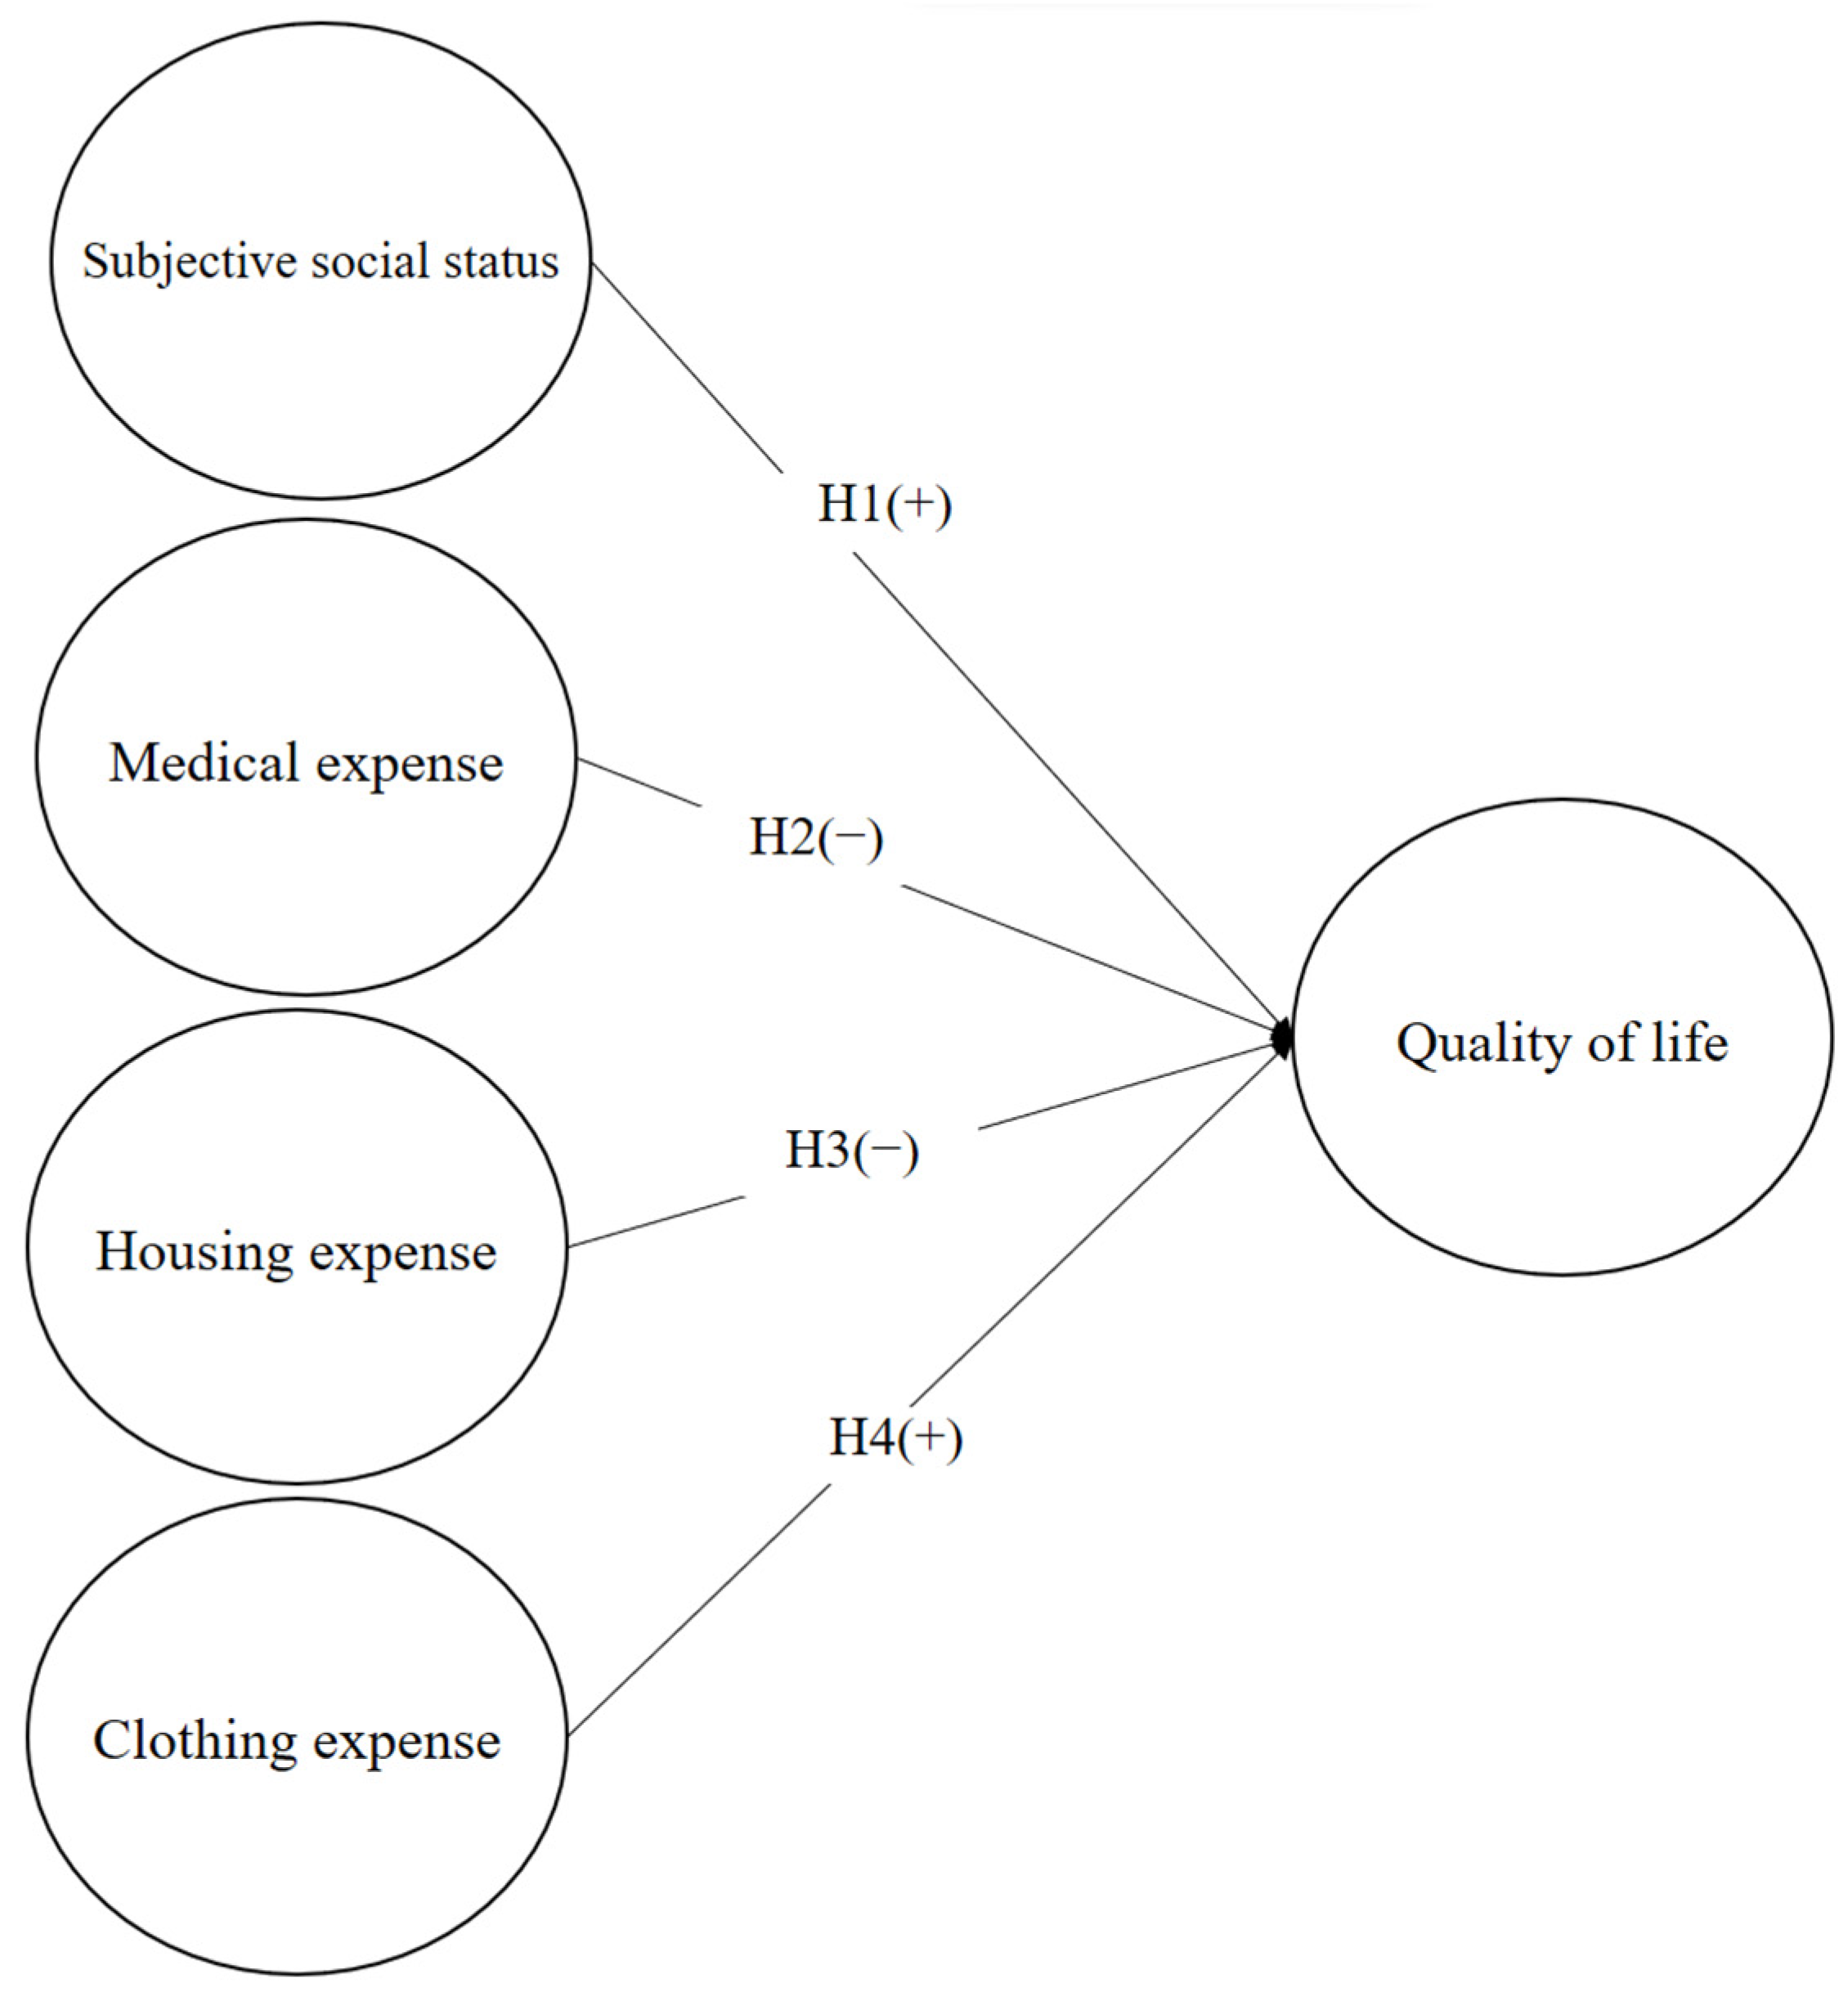
2. Review of the Literature and Hypothesis Development

2.1. Quality of Life

Quality of life is defined as an individual’s subjective appraisal of their own quality of life [3,5,28]. A high level of quality of life indicates a higher level of satisfaction with one’s life [2,4,29]. Quality of life has also been widely explored by numerous studies. For instance, Alsubaie et al. [30] explored the determinants of students’ quality of life. Algahtani et al. [31] inspected influential elements on quality of life for people in Saudi Arabia. The extant literature has also implemented meta-analyses to determine the characteristics of quality of life [6,32]. Moreover, quality of life has been commonly explored by focusing on older adults. In detail, Guida and Carpentieri [7] researched the determinants of quality of life by analyzing Italian elderly individuals. Saha et al. [10] similarly examined the antecedents of Indian elderly people’s quality of life. Ma et al. [8] also scrutinized the Chinese elderly, using quality of life as the dependent variable. Additionally, Sella et al. [33] attested to the effect of sleeping in elderly individuals on quality of life. Mu et al. [9] also tested the impact of housing conditions on the quality of life of senior citizens. All in all, it could be ensured that quality of life has been employed as an explained variable in the area of elderly research. Thus, it is ensured that many studies have scrutinized the antecedents of quality of life in various domains.

2.2. Subjective Health as the Determinant of Quality of Life

Subjective health is an individual’s evaluation of his or her own mental and physical health condition [12,34]. People cannot maintain their daily life routine without healthy minds and bodies [11,35]. This implies that health conditions are imperative for a better quality of life. In fact, a vast body of literature demonstrates the link between subjective health and quality of life. Specifically, Low et al. [12] inspected data from 20 countries, and the results revealed the positive impact of subjective health on quality of life. Bishwajit et al. [14] explored Chinese patients, and the findings indicate that quality of life is positively influenced by subjective health. Additionally, Shim et al. [17] examined people with disabilities, and the results revealed a positive relationship between subjective health and quality of life. A vast body of literature has addressed the positive impact of subjective health on quality of life in older adults. Specifically, Kwak and Kim [15] found a positive association between subjective health and quality of life for elderly Koreans. In a similar vein, Moon et al. [13] disclosed the positive effect of subjective health on quality of life for Korean older adults. Qazi et al. [16] additionally disclosed that the subjective health of older women exerted a positive effect on quality of life. It can be inferred that quality of life is positively influenced by subjective health. Given the review of the literature, this research thus proposes the following research hypothesis:
Hypothesis 1: 
Subjective health exerts positive effects on Korean elderly persons’ quality of life.

2.3. Medical, Housing, and Clothing Expenses as Determinants of Quality of Life

For living, people spend their money in various areas. The first area of this work is medical expenses. People spend their money on medical services either to prevent illness or treat their disease and reduce pain [22,23]. In old age, the proportion of medical expenses is likely to increase because the likelihood of illness grows higher over time [21,36]. In addition, prior studies contended that the purpose of medical expenses is to maintain the normal daily life of individuals [21]. Additionally, scholars have claimed that excessive medical expenditures cause elderly people to fall into financial distress because individual resources are constrained [12,37]. This suggests that more budgeting on medical expenses decreases an individual’s surplus funds for other areas; insufficient surplus funds are likely to cause a lower quality of life. Additionally, Berki [21] contended that older adults are more vulnerable to financial distress because their capability is limited more than that of younger adults. This indicates that medical expenses could become a large burden from the perspective of older adults. This study thus proposes the following research hypothesis:
Hypothesis 2: 
Medical expenses exert a negative effect on Korean elderly persons’ quality of life.
The second piece of this research is housing expenses, which are associated with housing, including taxes, utilities, insurance, rent, etc. [24,38]. In old age, people tend to spend more time in their houses because their physical energy is more limited than that of younger people [25,26,39]. Therefore, housing is likely to become an essential element for budget plans for elderly individuals. Prior studies contend that housing expenses are also likely to become expenditures for maintaining overall quality of life and protecting health conditions [23,24,25]. Thus, housing costs could be regarded as sunk costs for life, which could deter older people from decreasing surplus funds to other areas for living [24,25]. Hence, numerous studies have alluded that greater spending on housing expenses leads elderly people to possess lower amounts of assets for other parts of life [23,26,38]. This finding implies that a higher proportion of housing expenditure might be able to worsen the quality of life for older adults because housing expense could become the sunk cost in the case of older adults. Given the review of the literature, this study proposes the following research hypothesis:
Hypothesis 3: 
Housing expenses exert a negative effect on quality of life.
The next domain of this study is clothing expenses. People allocate their budget on clothes when they prepare for certain events and social gatherings [40,41,42]. This finding implies that the purpose of clothing expenses is likely to refresh the mental condition of elderly people because clothing expenses are associated with social desire [43,44]. Indeed, Park et al. [4] alleged that minimizing isolation plays an important role in improving life. In addition, individuals are refreshed by purchasing new clothes; the value of clothing is an instrument to ensure social status as a kind of luxury good [43,44,45]. While medical and housing expenses are a sort of fixed cost, clothing expenses can be regarded as variable costs that depend on the necessity of consumers. In addition, the decision making of clothing expenses is likely to be voluntary, whereas medical and housing expenses could become somewhat compulsory. Such characteristics of clothing expenses are likely to exert opposite effects. Given the review of the literature, this research proposes the following research hypothesis:
Hypothesis 4: 
Clothing expenses exert a positive effect on quality of life.

3. Method

3.1. Research Model and Data Collection

Figure 1 exhibits the study research model. Quality of life is the dependent variable of this work. There are four antecedents: subjective health and medical, housing, and clothing expenditures. This research model shows that quality of life is positively impacted by subjective health and clothing expenditures. In contrast, quality of life is negatively affected by medical and housing expenses.
This research used research panel data from a longitudinal Korean study of aging; the study periods were 2018 and 2020. Data from a Korean longitudinal study of aging have been widely used to investigate the behavioral characteristics of Korean senior citizens [35,46,47]. Data collection was performed anonymously to minimize the bias caused by social desirability. The term panel data refers to information collected in different periods from different survey participants [48,49]. Panel data are beneficial for scholars to understand behavioral characteristics over time [48,50]. Namely, this research could understand behavioral characteristics considering the time effect using panel data. For this study, the panel data were unbalanced between the two years (N2018 = 3607, N2020 = 3590). The unbalanced panel means that the survey participants are not perfectly matched during the study period [50]. The COVID-19 pandemic and restrictions prevented some people from taking part in the survey. The total number of observations for this research was 7197.

3.2. Description of Variables

Table 1 presents the variables and how each was measured; for instance, quality of life (QL), rated on a scale of 0–100 (0 = very poor, 100 = very good), and subjective health, measured on a five-point scale (1 = very poor, 5 = very good). Medical expenses are measured by monthly medical expenses over total monthly living expenses. Housing expenses are computed by monthly housing expenses over total monthly living expenses. Clothing expense is calculated by monthly clothing expense over total monthly living expense. Gender (GN) appeared as a binary variable (0 = Male, 1 = Female). Age (AG) was the physical age of survey respondents. The measurement of personal assets (PA) was the personal assets amount possessed by survey participants; its unit is 10,000 KRW. The final variable was COVID-19 (CO) as a dummy variable, where 0 = 2018 and 1 = 2020. QL is the dependent variable of this work. SH, ME, HE, and CE are independent variables. GN, AG, PA, and CO are control variables in this study. By considering four attributes, the likelihood of omitted variable bias can be used to understand the behavioral characteristics of older people [49].

3.3. Data Analysis

For this study, the following descriptive statistics were calculated: mean, standard deviation (SD), minimum, and maximum. Then, a correlation matrix analysis was performed to characterize the relationships between variables. This study used the STATA program for the data analysis. To test the research hypotheses, this study carried out econometric analysis including ordinary least squares (OLS) and fixed-effects (FE) and random-effects (RE) models [49,50]. Panel data analysis is essential for minimizing bias in estimations. Specifically, OLS minimizes errors in estimating coefficients, FE models minimize omitted variable bias by using dummy variables to control time effects [48,49], and RE models incorporate unobserved effects into models for estimation [48,50]. FE has two types: one-way (controlling one attribute) and two-way (controlling two attributes) because panel data are composed of both time periods and survey participants [49,50]. Even though a two-way fixed effects model allows researchers to reach a more robust estimation, the degree of freedom is sacrificed in the case of a two-way FE [48,50]. Contemplating the tradeoff between both FE methods, this research selected a one-way fixed effects model that controls only the year effect for parameter estimation because participants’ characteristics could be controlled by the four control variables. For all calculations, a p value of 0.05 was the threshold for significance. The consistency of significance and direction were appraised for testing the hypotheses. The following is the regression equation of this work:
QLit = β0 + β1SHit + β2MEit + β3HEit+ β4CEit + β5GNit + β6AGit + β7PAit + εit
where ε is the residual, i is the ith participant, and t is the tth year.

4. Results

4.1. Descriptive Statistics and Correlation Matrix

Table 2 presents the descriptive statistics. The number of observations is 7197. The mean value of QL is 61.72, and its standard deviation is 16.70. The mean value of SH is 2.90, with a standard deviation of 0.85. Table 2 presents the descriptive information of ME (Mean = 0.07, SD = 0.08), HE (Mean = 0.11, SD = 0.06), and CE (Mean = 0.03, SD = 0.03). The descriptive statistics show that the mean values of GN and CO are 0.35 and 0.49, respectively. The mean value of AG is 72.10, with 9.19 as the standard deviation. Table 2 depicts the information on PA (mean = 30,935.33, SD = 42,081.95).
Table 3 displays the correlation matrix, showing that QL correlates positively with SH (r = 0.244, p < 0.05), CE (r = 0.104, p < 0.05), GN (r = 0.047, p < 0.05), and PA (r = 0.221, p < 0.05); QL negatively correlates with ME (r = −0.133, p < 0.05), HE (r = −0.144, p < 0.05), and AG (r = −0.134, p < 0.05). SH was positively correlated with CE (r = 0.095, p < 0.05) and PA (r = 0.105, p < 0.05). However, SH was negatively correlated with ME (r = −0.210, p < 0.05) and HE (r = −0.108, p < 0.05). ME was positively correlated with HE (r = 0.092, p < 0.05) and AG (r = 0.166, p < 0.05), whereas it was negatively correlated with CE (r = −0.043, p < 0.05) and PA (r = −0.154, p < 0.05). HE was negatively correlated with CE (r = −0.056, p < 0.05) and PA (r = −0.154, p < 0.05). CE was positively correlated with PA (r = 0.080, p < 0.05).

4.2. Results of Hypothesis Testing Using Panel Regression

Table 4 shows the results of multiple regression analysis using QL as the explained attribute; all three models, OLS, RE, and FE, were statistically significant (p < 0.05). The findings include that QL was positively influenced by SH (β = 3.70, p < 0.05), CE (β = 30.21, p < 0.05), and PA (β = 7.11 × 10⁻⁵, p < 0.05). In contrast, ME (β = −14.50, p < 0.05) and HE (β = −21.26, p < 0.05) exerted negative effects on QL. The significance and direction appeared to be consistent in all three econometric models. Overall, the multiple regression analysis supports all four study hypotheses.

5. Discussion

This research examined the impact of subjective health as well as certain consumption patterns on quality of life among Korean senior citizen participants in a longitudinal panel data study from 2018 to 2020; subjective health positively affected quality of life. Indeed, Ehmann et al. [51] also showed that subjective health exerts a positive effect on quality of life by analyzing Germans living in rural areas. Previous research found the significant and positive impact of subjective health on quality of life by analyzing various survey participants: older women [16] and people with disability [17]. It implied that maintaining healthy mental and physical condition are imperative to make life better for many cases including older adults. The specific consumption pattern was the survey respondents’ expenditures on medical expenses, housing, and clothing expenses. Regarding the results, medical and housing expenditures were negatively associated with quality of life. These tend to be fixed costs, so spending on them will usually reduce resources for other areas. In contrast, the results showed a positive association between clothing expenditures and quality of life. This could be explained by the fact that clothing purchases are associated with special events or with improving people’s emotional states. Considering magnitude, the effect of clothing costs is the strongest compared to medical expenses and housing expenses. Additionally, housing expenses exerted a stronger impact on quality of life than medical expenses. This implies that medical service is regarded as a more indispensable element than housing and clothing expenses. Also, the results suggest that medical and housing expenses could be a sort of compulsory piece, while clothing expense could become a voluntary element.
Additionally, the results indicate higher quality of life among women than men and among younger senior citizens than among older citizens. Predictably, wealth also had a positive effect on quality of life among older adults in Korea. Based on the results, quality of life appeared to be better during the COVID-19 pandemic; to investigate the reason for this, an independent samples t-test was conducted (see Table 5). The mean value of QL in 2018 was 61.22, with 16.73 as the standard deviation, while the mean value of QL in 2020 was 62.23, with 16.65 as the standard deviation. This suggests that the mean quality of life for older adults was higher during the COVID-19 pandemic. This could be explained by the reduced number of participants (n2018 = 3607, n2020 = 3590). That is, survey participants with relatively poor quality of life might not have been available during the COVID-19 pandemic. Namely, survey participants with poor quality of life might have faced impediments in participating in the survey due to the COVID-19 pandemic. That is, participants with extremely lower values for quality of life could be missed during the COVID-19 pandemic.

6. Conclusions

This study makes some theoretical contributions. First, the study’s findings align with and supported prior study findings of the association between subjective health and quality of life, which could serve as external validation for this study [15,35,51]. That is, the results are aligned with other international older adults’ cases [12,16], suggesting that subjective health is also essential for the case of Korean. This study also clarifies the effects of medical, housing, and clothing costs on quality of life for elderly individuals. Because few previous studies have investigated such impacts, this study sheds light on the literature by streamlining the research gap. Specifically, medical and housing spending have negative effects on quality of life, but subjective health and clothing expenditures have positive effects. This is possibly explained by the fact that buying new clothes evokes pleasant emotions (such as those related to getting ready for a special event). Next, the United Nation [27] noted that one type of sustainable development of growth is to improve living conditions of all ages. Because older adults are relatively weak compared to younger adults, the results of this research might contribute to the literature by offering guidelines for a better life for elderly individuals.
This work also has practical implications for building policy. First, the Korean government should allocate more of the national budget for minimizing out-of-pocket medical costs for the rapidly aging population, for instance, by expanding medical insurance coverage for elderly individuals. Moreover, government policy might be able to contemplate discounting the health insurance fee for the elderly because such a discount might reduce the magnitude of degrading quality of life for Korean elderly. Next, government policy might need to focus more on housing as well, offering either affordable housing or subsidies to offset aged adults’ housing costs. Addressing these two areas could increase older adults’ available resources, which should contribute to improving their quality of life. In addition, policy makers might be able to dedicate their budget to clothing expenses for senior citizens. By purchasing new clothes, elderly individuals could gain more energy for better living conditions, such as social activities, which in turn results in a better quality of life for elderly individuals. Moreover, the government might be able to allot their budget on improving subjective health for elderly individuals. Because subjective health is related to both mental and physical conditions at the same time, government budgets need to be cautiously allocated for better health conditions of senior citizens. This could include various activities that enhance mental health conditions. The areas might include leisure, recreation, and cultural activities as well as the prevention of older adults’ isolation. In addition, the results show that personal assets are imperative for a better livelihood of elderly individuals. Government policy might need to concentrate more on how individuals prepare well for their old age in terms of finances. When the government provides subsidies for the poor elderly, they need to build criteria very carefully, otherwise government resources could be misallocated. Next, government policy might need to focus more on vulnerable older people in the case of the tough external conditions of epidemic and political instability. Because the likelihood of undesirable events is higher for the weaker elderly, the government budget needs to be allocated, in part, to the detection and support of more vulnerable older adults.
This study has limitations. First, the dependent variable of this research was limited to quality of life. Future researchers might explore other various attributes of life for elderly individuals and their behavioral characteristics using various dependent variables. Possible variables might include happiness, depression, subjective well-being, etc. Additionally, the sample of this research was limited to Korean senior citizens, and these results are not necessarily generalizable. Future researchers could investigate elderly citizens from different countries and cultures for comparison because different cultural backgrounds might be able to play an important role for varied outcomes. Next, this research was limited to examining only the main effect to account for quality of life. To make future research more worthy, scholars might be able to contemplate the moderating variables for the relationship between quality of life and cost-related attributes.

Author Contributions

Methodology, J.M.; writing—original draft, W.S.L. All authors have read and agreed to the published version of the manuscript.

Funding

This work was supported by the Kyonggi University Research Grant 2023.

Institutional Review Board Statement

Not applicable.

Informed Consent Statement

Not applicable.

Data Availability Statement

Data are contained within the article.

Conflicts of Interest

The authors declare no conflict of interest.

References

  1. Statistics Korea. Korean Elderly Statistics in 2021. 2022. Available online: https://kostat.go.kr/portal/korea/kor_nw/1/1/index.board?bmode=read&aSeq=403253 (accessed on 15 June 2023).
  2. Ferreira, L.N.; Pereira, L.N.; da Fé Brás, M.; Ilchuk, K. Quality of life under the COVID-19 quarantine. Qual. Life Res. 2021, 30, 1389–1405. [Google Scholar] [PubMed]
  3. Hargreaves, S.M.; Raposo, A.; Saraiva, A.; Zandonadi, R. Vegetarian diet: An overview through the perspective of quality of life domains. Int. J. Environ. Res. Public Health 2021, 18, 4067. [Google Scholar] [CrossRef] [PubMed]
  4. Park, K.; Kim, A.; Yang, M.; Lim, S.; Park, J. Impact of the COVID-19 pandemic on the lifestyle, mental health, and quality of life of adults in South Korea. PLoS ONE 2021, 16, e0247970. [Google Scholar] [CrossRef] [PubMed]
  5. Shek, D.T. COVID-19 and quality of life: Twelve reflections. Appl. Res. Qual. Life 2021, 16, 1–11. [Google Scholar] [CrossRef]
  6. Sella, E.; Miola, L.; Toffalini, E.; Borella, E. The relationship between sleep quality and quality of life in aging: A systematic review and meta-analysis. Health Psychol. Rev. 2023, 17, 169–191. [Google Scholar] [CrossRef] [PubMed]
  7. Guida, C.; Carpentieri, G. Quality of life in the urban environment and primary health services for the elderly during the COVID-19 pandemic: An application to the city of Milan (Italy). Cities 2021, 110, 103038. [Google Scholar]
  8. Ma, H.; Wang, M.; Yang, B. Research on urban community elderly care facility based on quality of life by SEM: Cases study of three types of communities in Shenzhen, China. Sustainability 2022, 14, 9661. [Google Scholar]
  9. Mu, J.; Zhang, S.; Kang, J. Estimation of the quality of life in housing for the elderly based on a structural equation model. J. Hous. Built Environ. 2022, 37, 1255–1281. [Google Scholar] [CrossRef]
  10. Saha, S.; Basu, S.; Pandit, D. A framework for identifying perceived Quality of Life indicators for the elderly in the neighbourhood context: A case study of Kolkata, India. Qual. Quan. 2022, 57, 2705–2737. [Google Scholar] [CrossRef]
  11. Anxo, D.; Ericson, T.; Miao, C. Impact of late and prolonged working life on subjective health: The Swedish experience. Eur. J. Health Econ. 2019, 20, 389–405. [Google Scholar] [CrossRef]
  12. Low, G.; Molzahn, A.; Schopflocher, D. Attitudes to aging mediate the relationship between older peoples’ subjective health and quality of life in 20 countries. Health Qual. Life Outcomes 2013, 11, 146. [Google Scholar] [CrossRef] [PubMed]
  13. Moon, J.; Lee, W.S.; Shim, J. Effect of Travel Expenditure on Life Satisfaction for Middle-Aged and Older Adults in Korea: Moderating Effect of COVID-19 Pandemic. Int. J. Environ. Res. Public Health 2022, 19, 13523. [Google Scholar] [CrossRef] [PubMed]
  14. Bishwajit, G.; Tang, S.; Yaya, S.; He, Z.; Feng, Z. Lifestyle behaviors, subjective health, and quality of life among Chinese men living with type 2 diabetes. Am. J. Men Health 2017, 11, 357–364. [Google Scholar] [CrossRef]
  15. Kwak, Y.; Kim, Y. Quality of life and subjective health status according to handgrip strength in the elderly: A cross-sectional study. Aging Ment. Health 2019, 23, 107–112. [Google Scholar] [CrossRef] [PubMed]
  16. Qazi, S.L.; Koivumaa-Honkanen, H.; Rikkonen, T.; Sund, R.; Kröger, H.; Isanejad, M.; Sirola, J. Physical capacity, subjective health, and life satisfaction in older women: A 10-year follow-up study. BMC Geriatr. 2021, 21, 658. [Google Scholar] [CrossRef]
  17. Shim, H.; Lee, W.S.; Moon, J. The Relationships between food, recreation expense, subjective health, and life satisfaction: Case of Korean people with disability. Sustainability 2023, 15, 9099. [Google Scholar] [CrossRef]
  18. Bénabou, R.; Tirole, J. Mindful economics: The production, consumption, and value of beliefs. J. Econ. Pers. 2016, 30, 141–164. [Google Scholar] [CrossRef]
  19. Jung, H.J.; Kim, H.; Oh, K. Green leather for ethical consumers in China and Korea: Facilitating ethical consumption with value–belief–attitude logic. J. Bus. Ethics 2016, 135, 483–502. [Google Scholar] [CrossRef]
  20. Stål, H.I.; Jansson, J. Sustainable consumption and value propositions: Exploring product–service system practices among Swedish fashion firms. Sustain. Dev. 2017, 25, 546–558. [Google Scholar] [CrossRef]
  21. Berki, S.E. A look at catastrophic medical expenses and the poor. Health Aff. 1986, 5, 138–145. [Google Scholar] [CrossRef]
  22. De Nardi, M.; French, E.; Jones, J.B. Why do the elderly save? The role of medical expenses. J. Pol. Econ. 2010, 118, 39–75. [Google Scholar] [CrossRef]
  23. Yaghoobzadeh, A.; Gorgulu, O.; Yee, B.; Wibisono, A.; Pahlevan Sharif, S.; Sharif Nia, H.; Allen, K. A model of aging perception in Iranian elders with effects of hope, life satisfaction, and socioeconomic status: A path analysis. J. Am. Psychiatr. Nurses Assoc. 2018, 24, 522–530. [Google Scholar] [CrossRef] [PubMed]
  24. Struyk, R.J. The housing expense burden of households headed by the elderly. Gerontologist 1977, 17, 447–452. [Google Scholar] [CrossRef]
  25. Chiuri, M.C.; Jappelli, T. Do the elderly reduce housing equity? An international comparison. J. Pop. Econ. 2010, 23, 643–663. [Google Scholar] [CrossRef]
  26. Haffner, M.; Heylen, K. User costs and housing expenses. Towards a more comprehensive approach to affordability. Hou. Stu. 2011, 26, 593–614. [Google Scholar] [CrossRef]
  27. United Nations. The 17 Goals. 2023. Available online: https://sdgs.un.org/goals (accessed on 21 July 2023).
  28. Testa, M.A.; Nackley, J.F. Methods for quality-of-life studies. Ann. Rev. Public Health 1994, 15, 535–559. [Google Scholar] [CrossRef]
  29. Cella, D.F. Quality of life: The concept. J. Palliat. Care 1992, 8, 8–13. [Google Scholar] [CrossRef]
  30. Alsubaie, M.M.; Stain, H.J.; Webster, L.; Wadman, R. The role of sources of social support on depression and quality of life for university students. Int. J. Adol. Yout. 2019, 24, 484–496. [Google Scholar] [CrossRef]
  31. Algahtani, F.; Hassan, S.; Alsaif, B.; Zrieq, R. Assessment of the quality of life during COVID-19 pandemic: A cross-sectional survey from the Kingdom of Saudi Arabia. Int. J. Environ. Res. Public Health 2021, 18, 847. [Google Scholar] [CrossRef]
  32. Beaudart, C.; Demonceau, C.; Reginster, J.; Locquet, M.; Cesari, M.; Cruz Jentoft, A.; Bruyère, O. Sarcopenia and health-related quality of life: A systematic review and meta-analysis. J. Cachexia Sarcopenia Muscle 2023, 14, 1228–1243. [Google Scholar] [CrossRef]
  33. Sella, E.; Cellini, N.; Borella, E. How elderly people’s quality of life relates to their sleep quality and sleep-related beliefs. Behav. Sleep Med. 2022, 20, 112–124. [Google Scholar] [CrossRef] [PubMed]
  34. Paakkari, O.; Torppa, M.; Villberg, J.; Kannas, L.; Paakkari, L. Subjective health literacy among school-aged children. Health Edu. 2018, 118, 182–195. [Google Scholar] [CrossRef]
  35. Moon, J.; Lee, W.S.; Shim, J. Exploring Korean middle-and old-aged citizens’ subjective health and quality of life. Behav. Sci. 2022, 12, 219. [Google Scholar] [CrossRef] [PubMed]
  36. Browne, M.J.; Doerpinghaus, H.I. Information asymmetries and adverse selection in the market for individual medical expense insurance. J. Risk Ins. 1993, 60, 300–312. [Google Scholar] [CrossRef]
  37. Himmelstein, D.U.; Lawless, R.M.; Thorne, D.; Foohey, P.; Woolhandler, S. Medical bankruptcy: Still common despite the Affordable Care Act. Am. J. Public Health 2019, 109, 431–433. [Google Scholar] [CrossRef]
  38. Christensen, D.L.; Carp, F.M.; Cranz, G.L.; Wiley, J.A. Objective housing indicators as predictors of the subjective evaluations of elderly residents. J. Environ. Psychol. 1992, 12, 225–236. [Google Scholar] [CrossRef]
  39. Heylen, K.; Haffner, M. The effect of housing expenses and subsidies on the income distribution in Flanders and the Netherlands. Hous. Stud. 2012, 27, 1142–1161. [Google Scholar] [CrossRef]
  40. Johnson, D.; Readding, L.; Ryan, C. Analysing the role of support wear, clothing and accessories in maintaining ostomates’ quality of life. Gast. Nurs. 2015, 13, 23–35. [Google Scholar] [CrossRef]
  41. Millan, E.; Mittal, B. Consumer preference for status symbolism of clothing: The case of the Czech Republic. Psychol. Mark. 2017, 34, 309–322. [Google Scholar] [CrossRef]
  42. Sjöberg, F.; Orwelius, L.; Berg, S. Health-related quality of life after critical care—The emperor’s new clothes. Crit. Care 2020, 24, 1–3. [Google Scholar] [CrossRef]
  43. Klepp, I.G.; Storm-Mathisen, A. Reading fashion as age: Teenage girls’ and grown women’s accounts of clothing as body and social status. Fash. Theory 2005, 9, 323–342. [Google Scholar] [CrossRef]
  44. Batten, A.J. Clothing and adornment. Biblic. Theol. Bull. 2010, 40, 148–159. [Google Scholar] [CrossRef]
  45. Nilssen, R.; Bick, G.; Abratt, R. Comparing the relative importance of sustainability as a consumer purchase criterion of food and clothing in the retail sector. J. BraMgt. 2019, 26, 71–83. [Google Scholar] [CrossRef]
  46. Shin, M. Depressive symptoms with cognitive dysfunction increase the risk of cognitive impairment: Analysis of the Korean Longitudinal Study of Aging (KLoSA), 2006–2018. Int. Psychol. 2021, 33, 791–801. [Google Scholar] [CrossRef] [PubMed]
  47. Lee, Y.; Yeung, W.J. Cohort matters: The relationships between living arrangements and psychological health from the Korean Longitudinal Study of Aging (KLoSA). J. Affect. Disord. 2022, 299, 652–657. [Google Scholar] [CrossRef]
  48. Gujarati, D.; Porter, D. Basic Econometrics; McGraw-Hill: New York, NY, USA, 2009. [Google Scholar]
  49. Wooldridge, J. Introductory Econometrics: A Modern Approach; South-Western College Publishing: Cincinnati, OH, USA, 2009. [Google Scholar]
  50. Baltagi, B. Econometric Analysis of Panel Data; John Wiley & Sons: New York, NY, USA, 2008; Volume 1. [Google Scholar]
  51. Ehmann, A.; Groene, O.; Rieger, M.; Siegel, A. The relationship between health literacy, quality of life, and subjective health: Results of a cross-sectional study in a rural region in Germany. Int. J. Environ. Res. Public Health 2020, 17, 1683. [Google Scholar] [CrossRef] [PubMed]
Figure 1. Research model.
Sustainability 15 15868 g001
Table 1. Depiction of measurement.
VariableMeasurement
Quality of life (QL)Response to assess their life ranging from 0 to 100
Subjective health (SH)1 = very poor, 5 = very good
Medical expense (ME)Monthly medical expense/Total monthly living expense
Housing expense (HE)Monthly housing expense/Total monthly living expense
Clothing expense (CE)Monthly clothing expense/Total monthly living expense
Gender (GN)(0 = Male, 1 = Female)
Age (AG)Physical age of survey participants
Personal assets (PA)Personal assets (Unit: 10,000 KRW)
COVID-19 (CO)0 = 2018, 1 = 2020
Table 2. Descriptive statistics (n = 7197).
VariableMeanSDMinimumMaximum
QL61.7216.700100
SH2.900.8515
ME0.070.0801
HE0.110.0600.62
CE0.030.0300.42
GN0.350.4701
AG72.109.1957102
PA30,935.3342,081.950818,000
CO0.490.5001
Note: SD denotes standard deviation, QL: quality of life, SH: subjective health, ME: medical expense, HE: housing expense, CE: clothing expense, GN: gender, AG: age, PA: personal assets (Unit: 10,000 KRW), and CO: COVID-19.
Table 3. Correlation matrix.
Variable1234567
1. QL1
2. SH0.244 *1
3. ME−0.133 *−0.210 *1
4. HE−0.144 *−0.108 *0.092 *1
5. CE0.104 *0.095 *−0.042 *−0.056 *1
6. GN0.047 *0.104 *−0.026 *−0.043 *−0.0071
7. AG−0.134 *0.397 *0.166 *0.176 *−0.113 *−0.030 *1
8. PA0.221 *0.105 *−0.038 *−0.154 *0.080 *0.048 *−0.085 *
Note: * p < 0.05, QL: quality of life, SH: subjective health, ME: medical expense, HE: housing expense, CE: clothing expense, GN: gender, AG: age, and PA: personal assets (Unit: 10,000 KRW).
Table 4. Results of hypothesis testing.
VariableModel 1Model 2Model 3
OLSREFE
β (t−stat)β (Wald)β (t−stat)
Intercept52.14 (25.86) *52.14 (25.86) *52.16 (25.88) *
SH3.70 (15.22) *3.70 (15.22) *3.69 (15.22) *
ME−14.50 (−6.36) *−14.50 (−6.36) *−14.34 (−6.29) *
HE−21.26 (−7.36) *−21.26 (−7.36) *−21.17 (−7.33) *
CE30.21 (5.49) *30.21 (5.49) *30.35 (5.51) *
GN0.45 (1.17)0.45 (1.17)0.29 (0.74)
AG−0.16 (−0.75)−0.16 (−0.75)−0.02 (−1.00)
PA7.11 × 10−5 (15.82) *7.11 × 10−5 (15.82) *7.08 × 10−5 (15.74) *
CO0.87 (2.31) *
F value133.40 *117.46 *
Wald χ2933.78 *
R20.11470.11560.1152
Note: QL is dependent variable, OLS denotes ordinary least square, RE is random effect, FE is fixed effect, * p < 0.05, QL: quality of life, SH: subjective health, ME: medical expense, HE: housing expense, CE: clothing expense, GN: gender, AG: age, and PA: personal assets (Unit: 10,000 KRW), and CO: COVID-19.
Table 5. Results of the independent-samples t test.
Mean of 2018 (SD)
(n = 3607)
Mean of 2020 (SD)
(n = 3590)
t Value
QL61.22 (16.73)62.23 (16.65)2.57 *
Note: * p < 0.05, QL stands for quality of life.
Disclaimer/Publisher’s Note: The statements, opinions and data contained in all publications are solely those of the individual author(s) and contributor(s) and not of MDPI and/or the editor(s). MDPI and/or the editor(s) disclaim responsibility for any injury to people or property resulting from any ideas, methods, instructions or products referred to in the content.

