
Optimizing an Urban Green Space Ecological Network by Coupling Structural and Functional Connectivity: A Case for Biodiversity Conservation Planning


Abstract
:1. Introduction
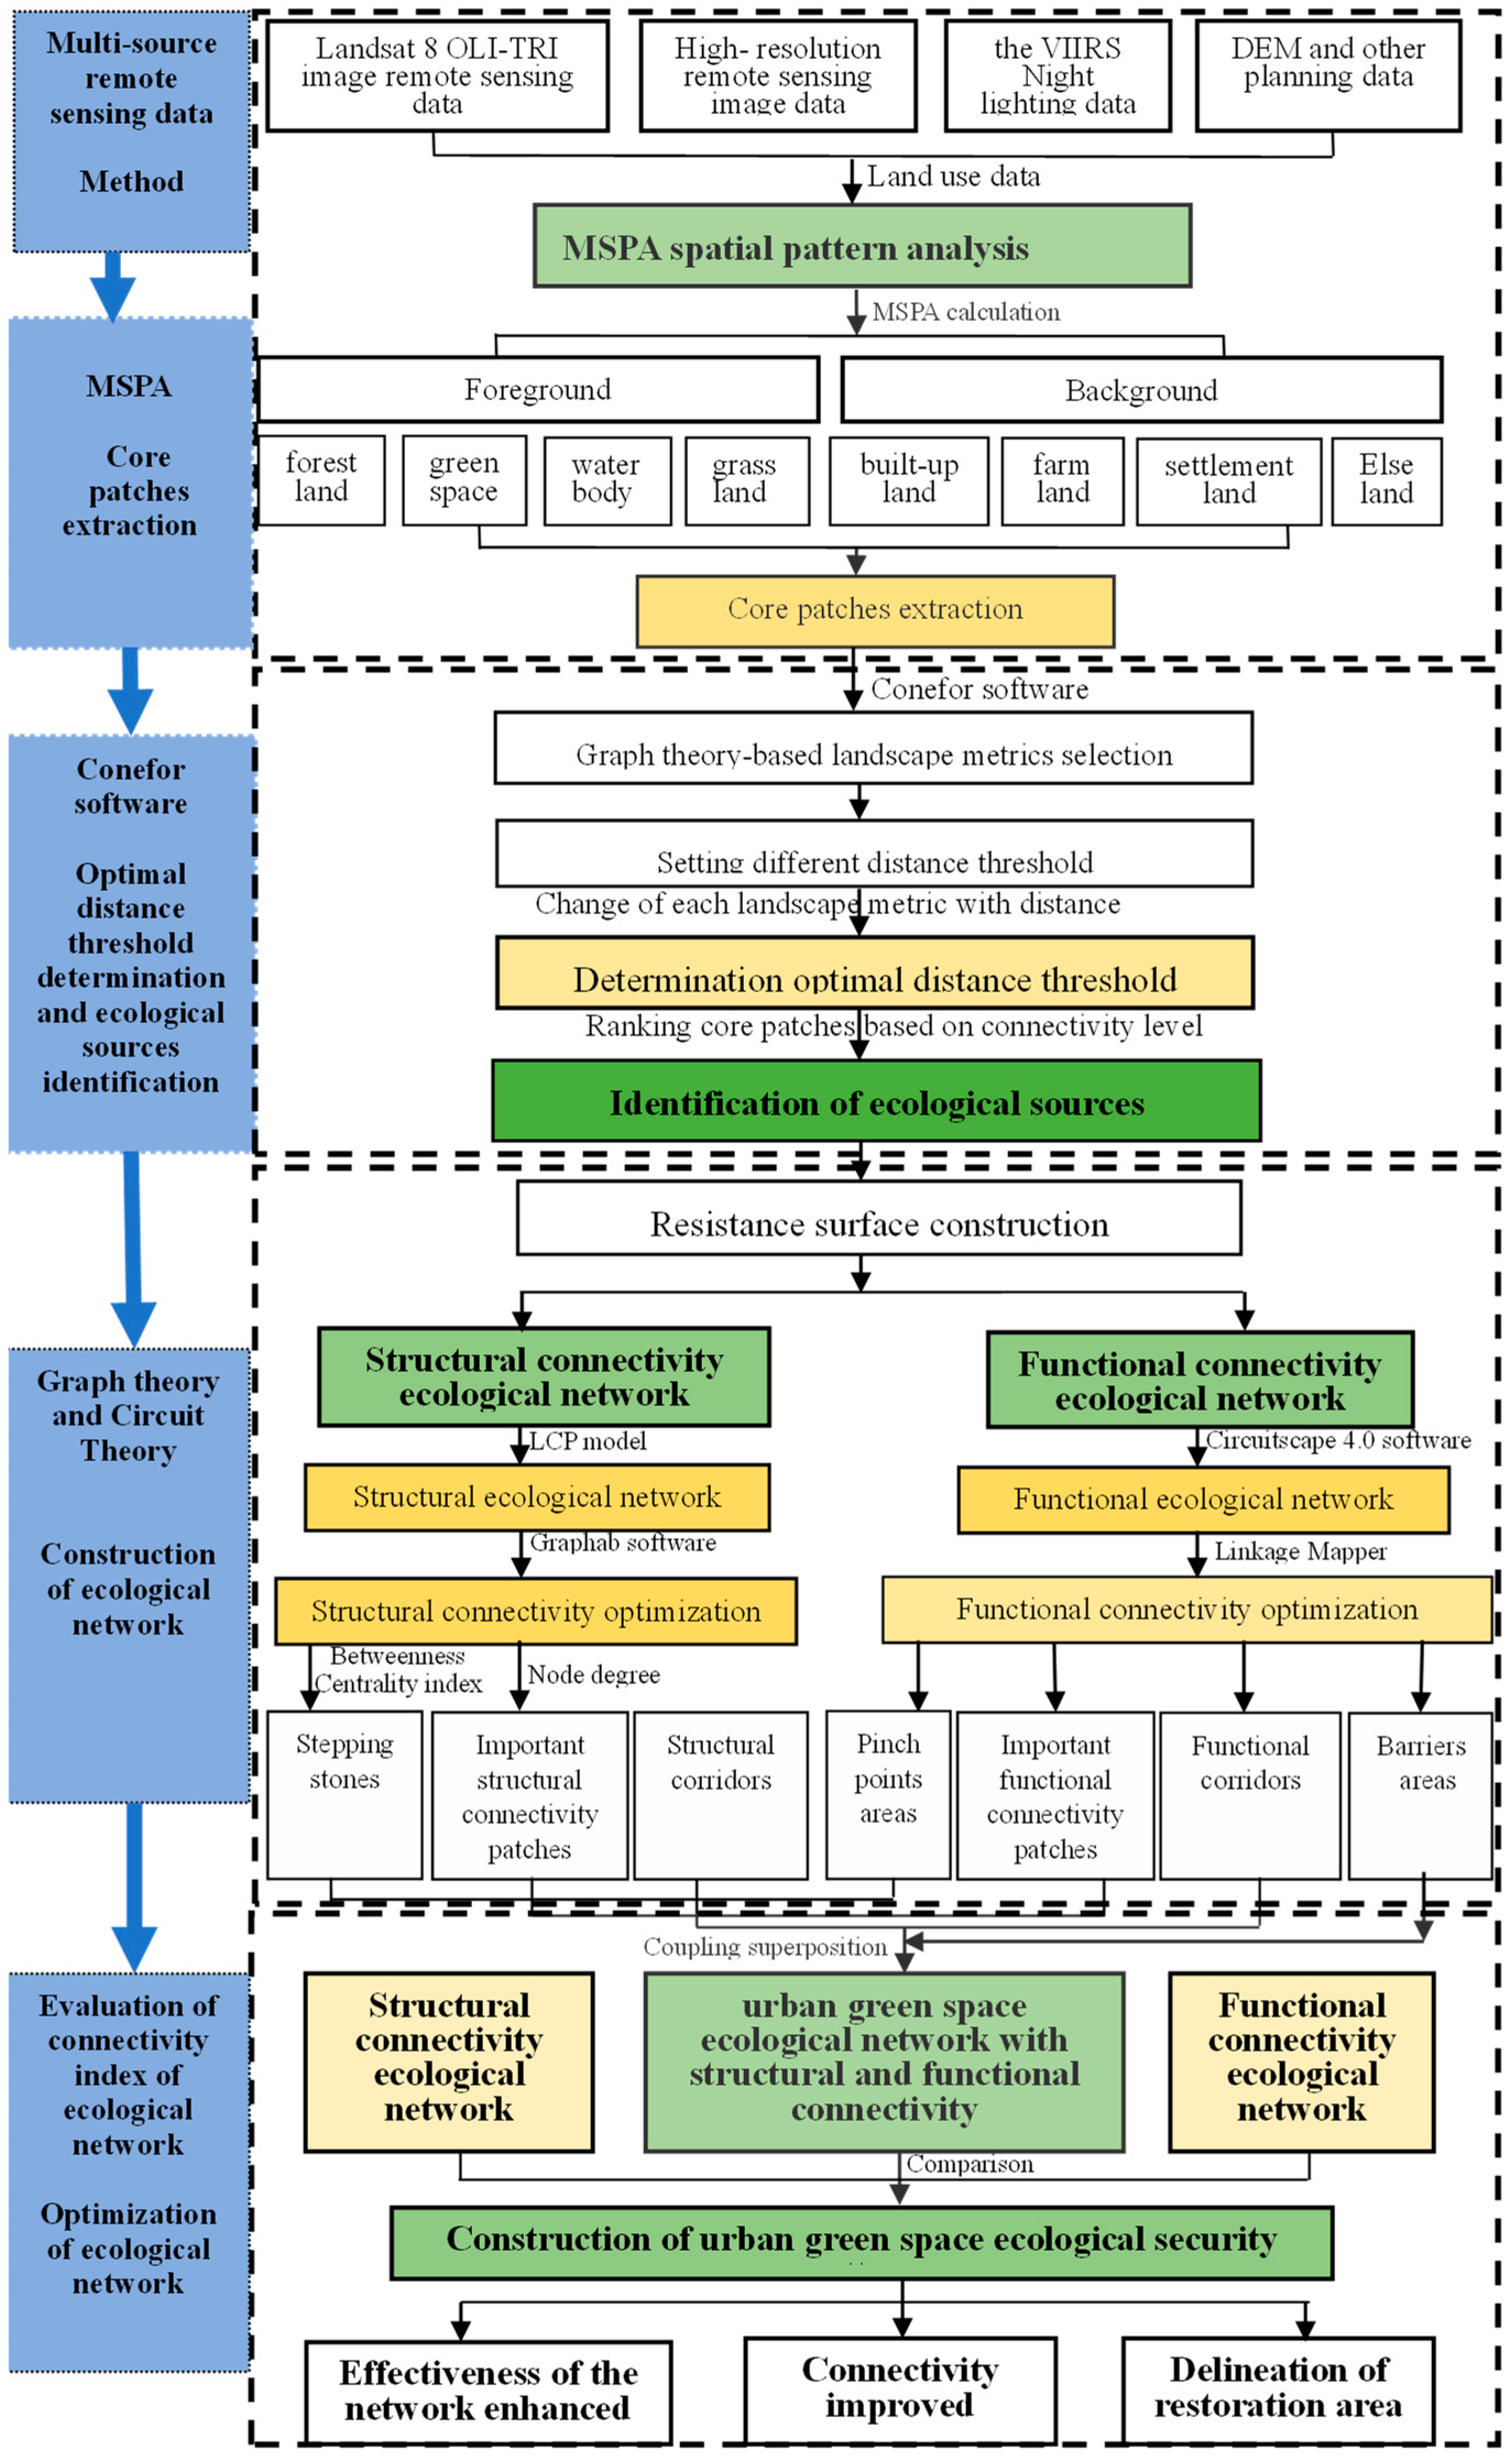
2. Data and Methods
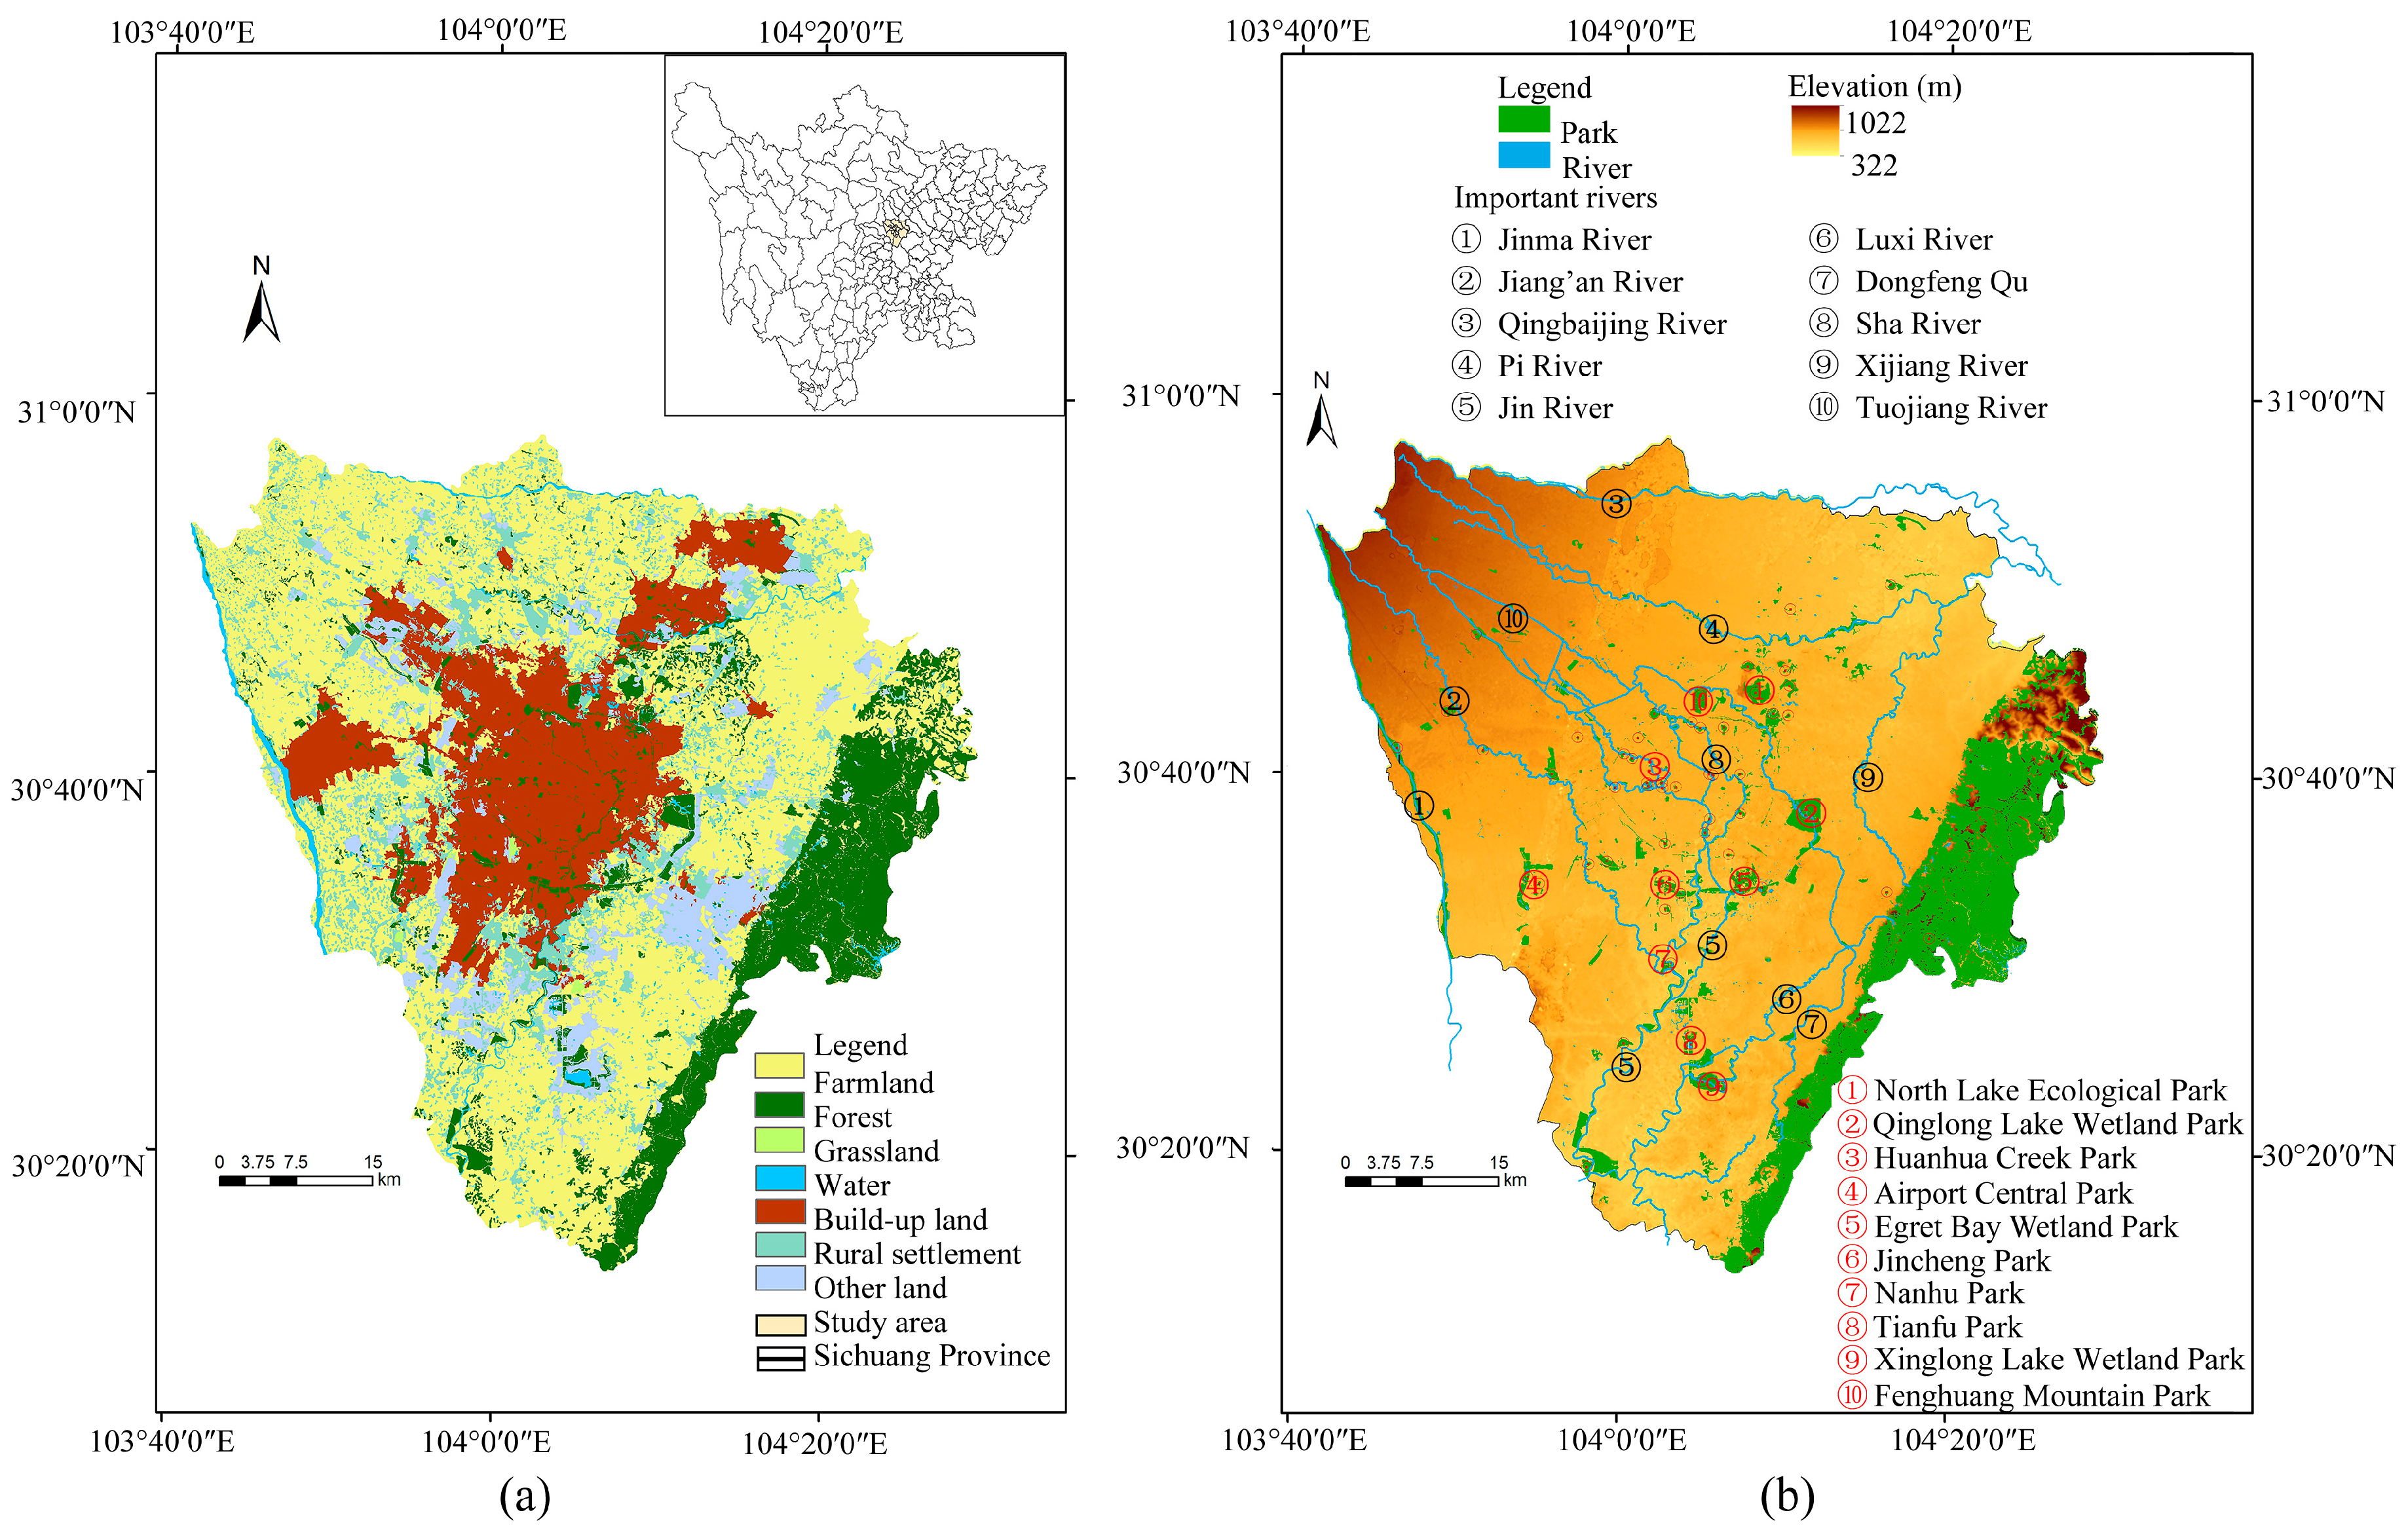
2.1. Study Area
2.2. Data Sources and Preprocessing
2.3. Multi-Objective Spatial Analysis Methods
2.3.1. Extraction and Analysis of Core Ecological Patches Using MSPA
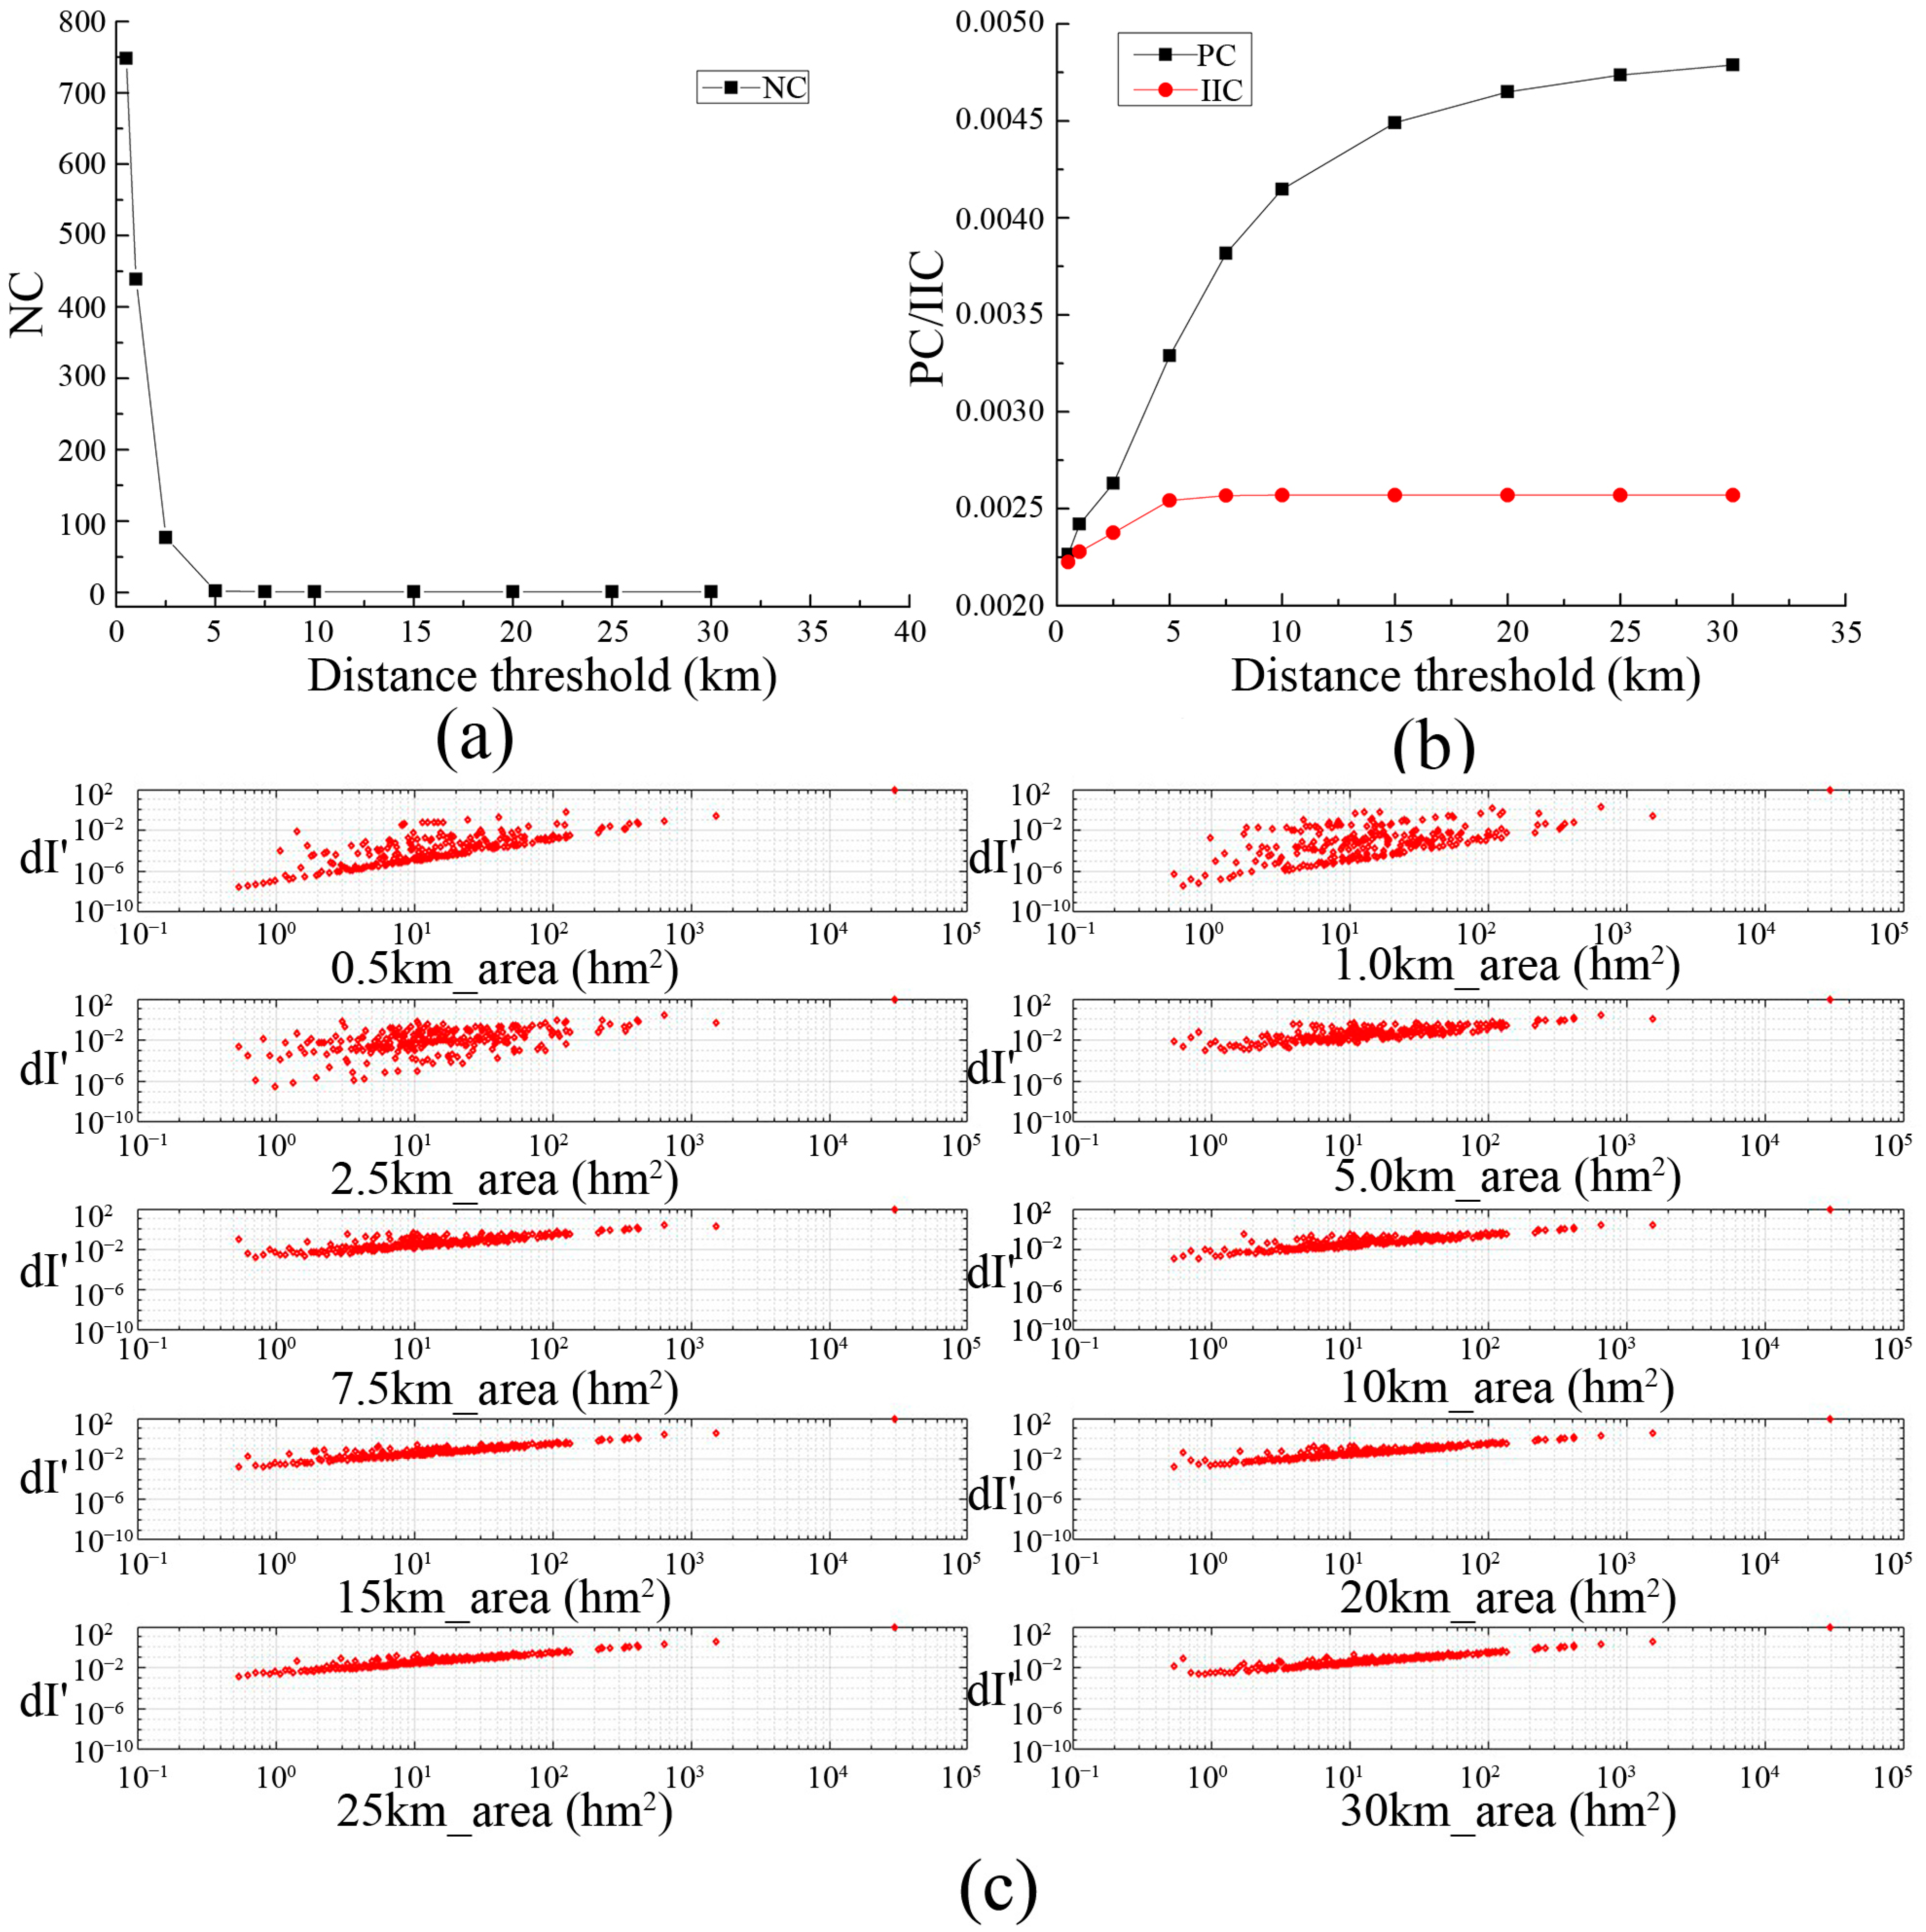
2.3.2. Determining the Distance Threshold and Importance of Source Patches using Graph Theory Based-Landscape Metrics
2.3.3. Green Space Structural Connectivity Analysis Using LCP and Graph Theory
2.3.4. Constructing and Optimizing Green Space Ecological Network with Functional Connectivity Using Circuit Theory
2.3.5. Coupling Effect Analysis of Structure and Function Connectivity and Optimization of Green Space Ecological Network
3. Results
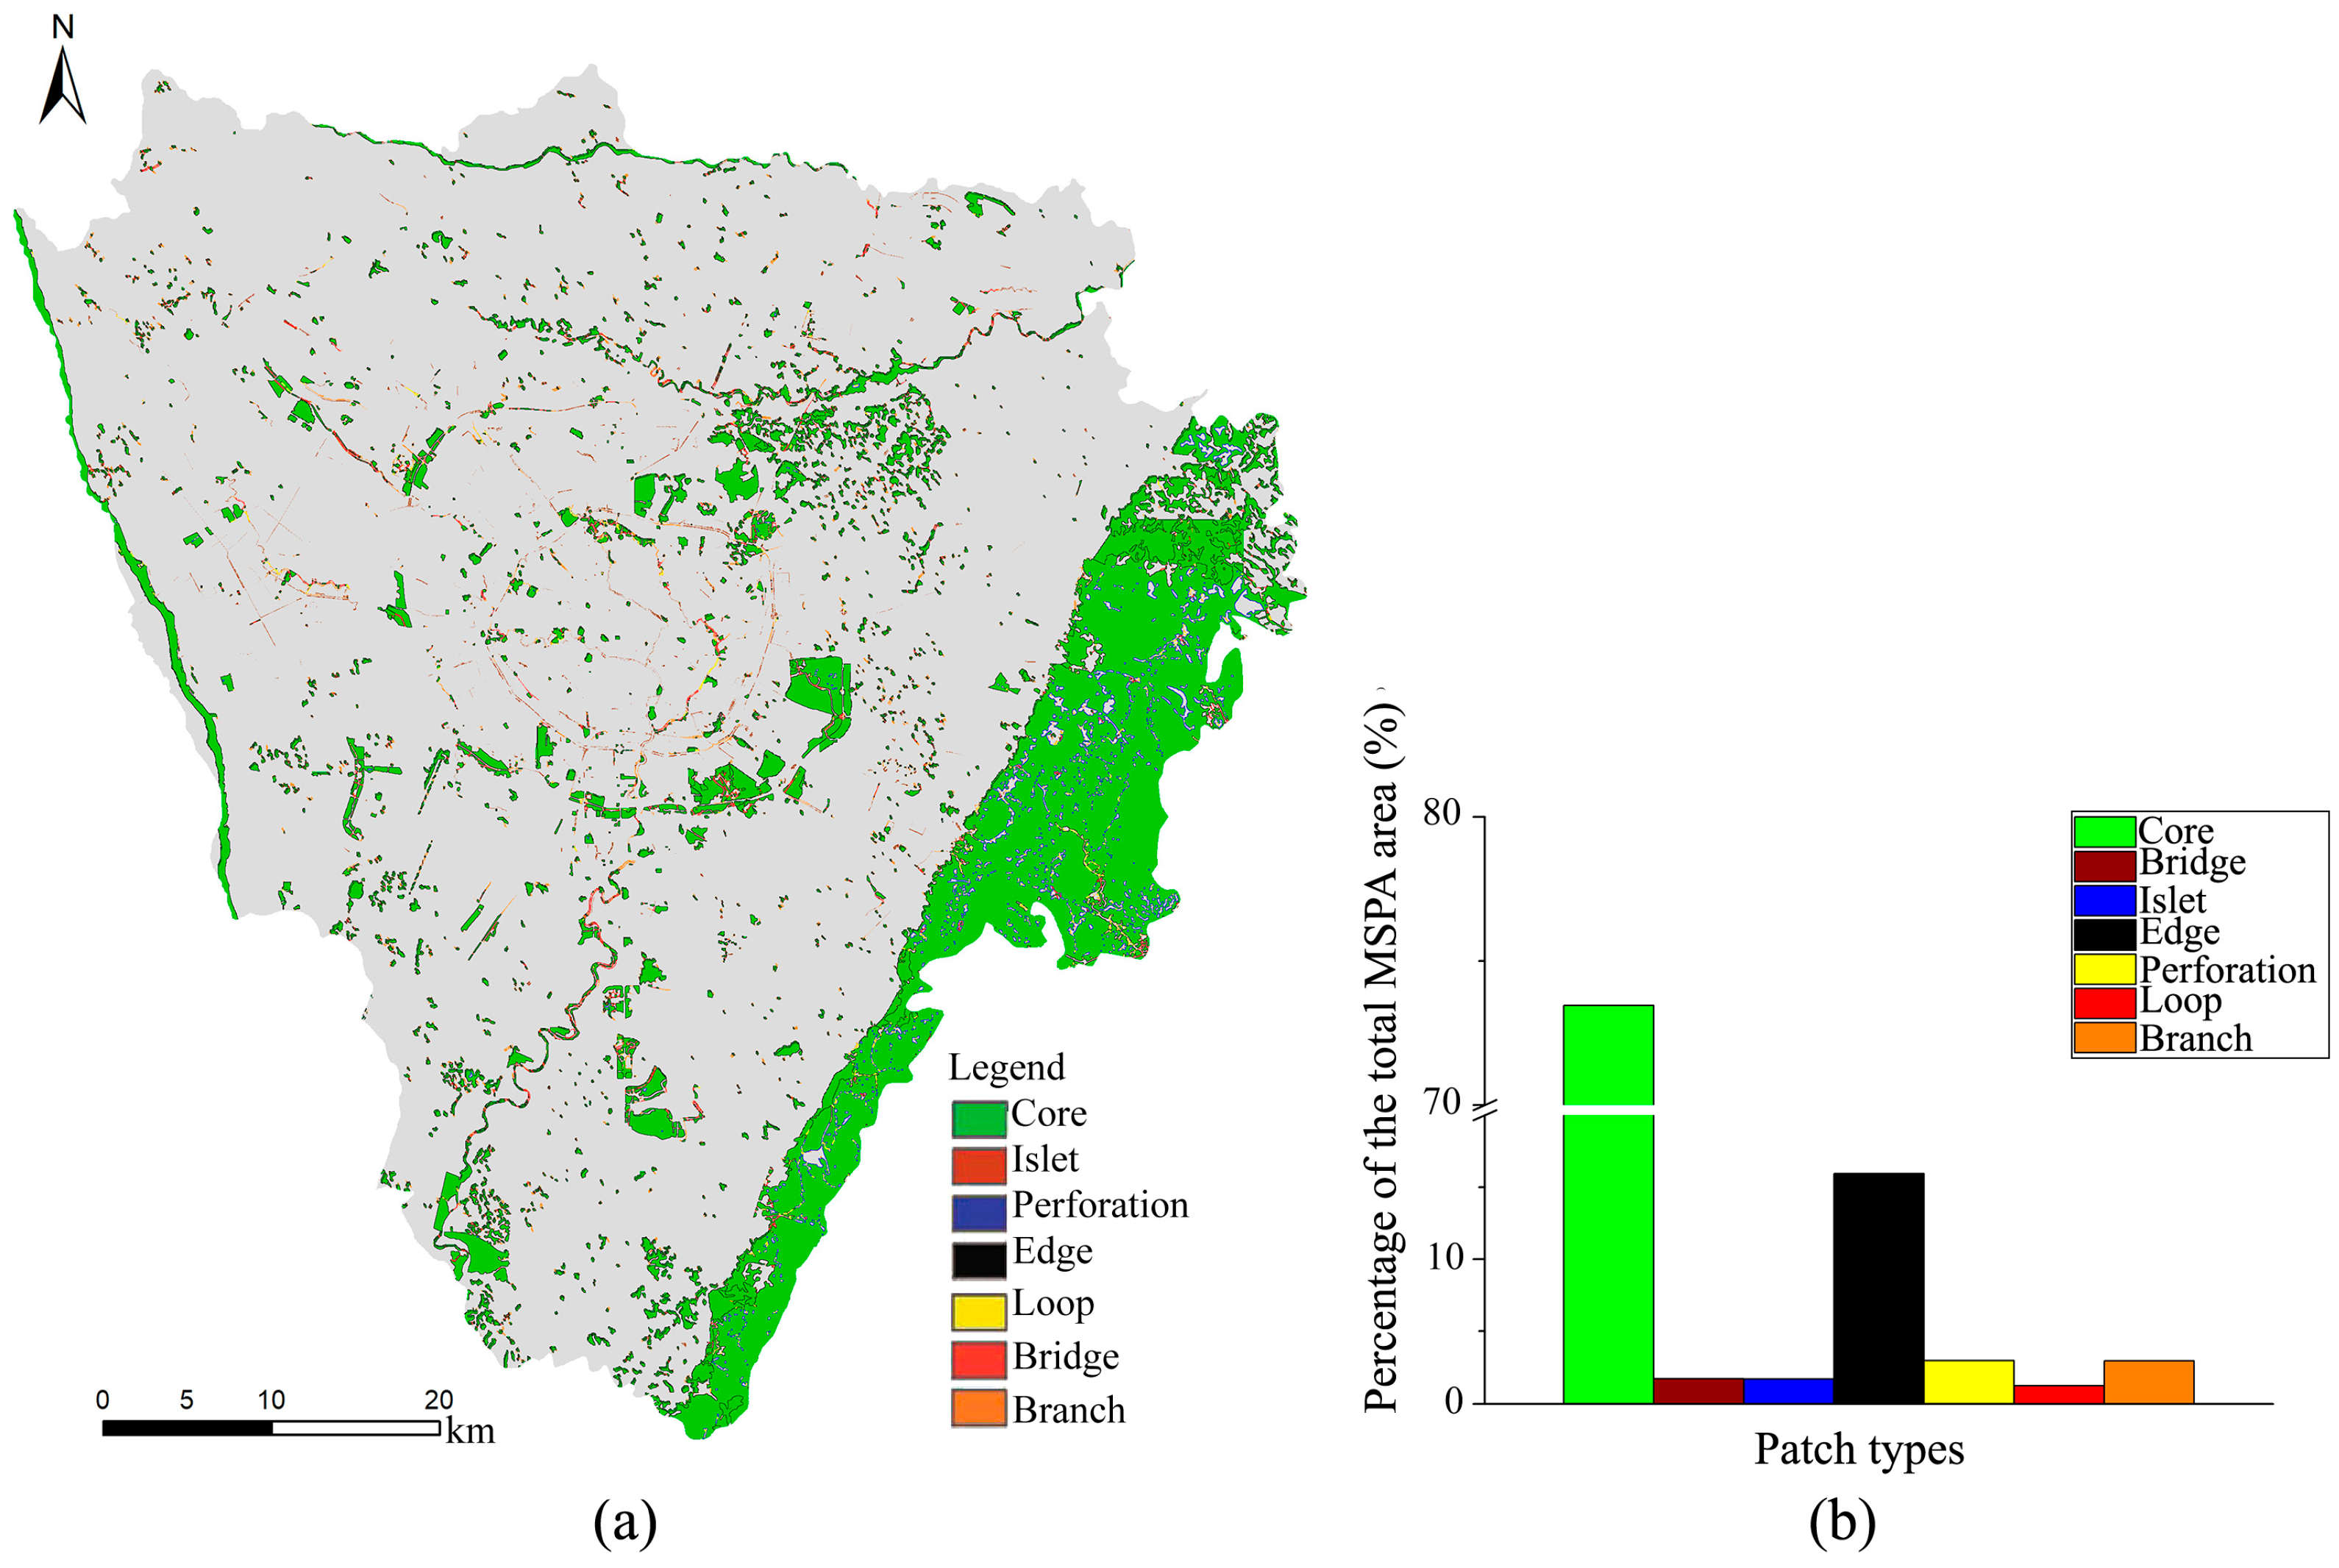
3.1. Extraction of Core Ecological Patches
3.2. The Determination of Optimal Distance and Classification of the Importance of Ecological Sources
3.3. Constructing and Optimization of Green Space Ecological Network with Structural Connectivity
3.3.1. Construction of Green Space Ecological Network Using LCP
3.3.2. Evaluation of Green Space Structural Connectivity and Optimization of Ecological Network
3.4. Construction and Optimization of Green Space Network with Functional Connectivity
3.4.1. Construction of Green Space Network Using Circuit Theory
3.4.2. Optimizing Green Space Functional Connectivity
3.5. Coupling Effect of Green Space Ecological Network with Structural and Functional Connectivity
3.6. Optimization Strategy for Urban Green Space Ecological Security Pattern
4. Discussion
4.1. Advantage of Construction of Compound Green Space Ecological Network Coupling MSPA, Graph Theory, and Circuit Theory
4.2. The Difference and Relation with Urban Network Theory Model
4.3. Coordinating Urban Development and Ecological Protection
4.4. Challenges in the Process of Urban Green Space Ecological Network Construction
5. Conclusions
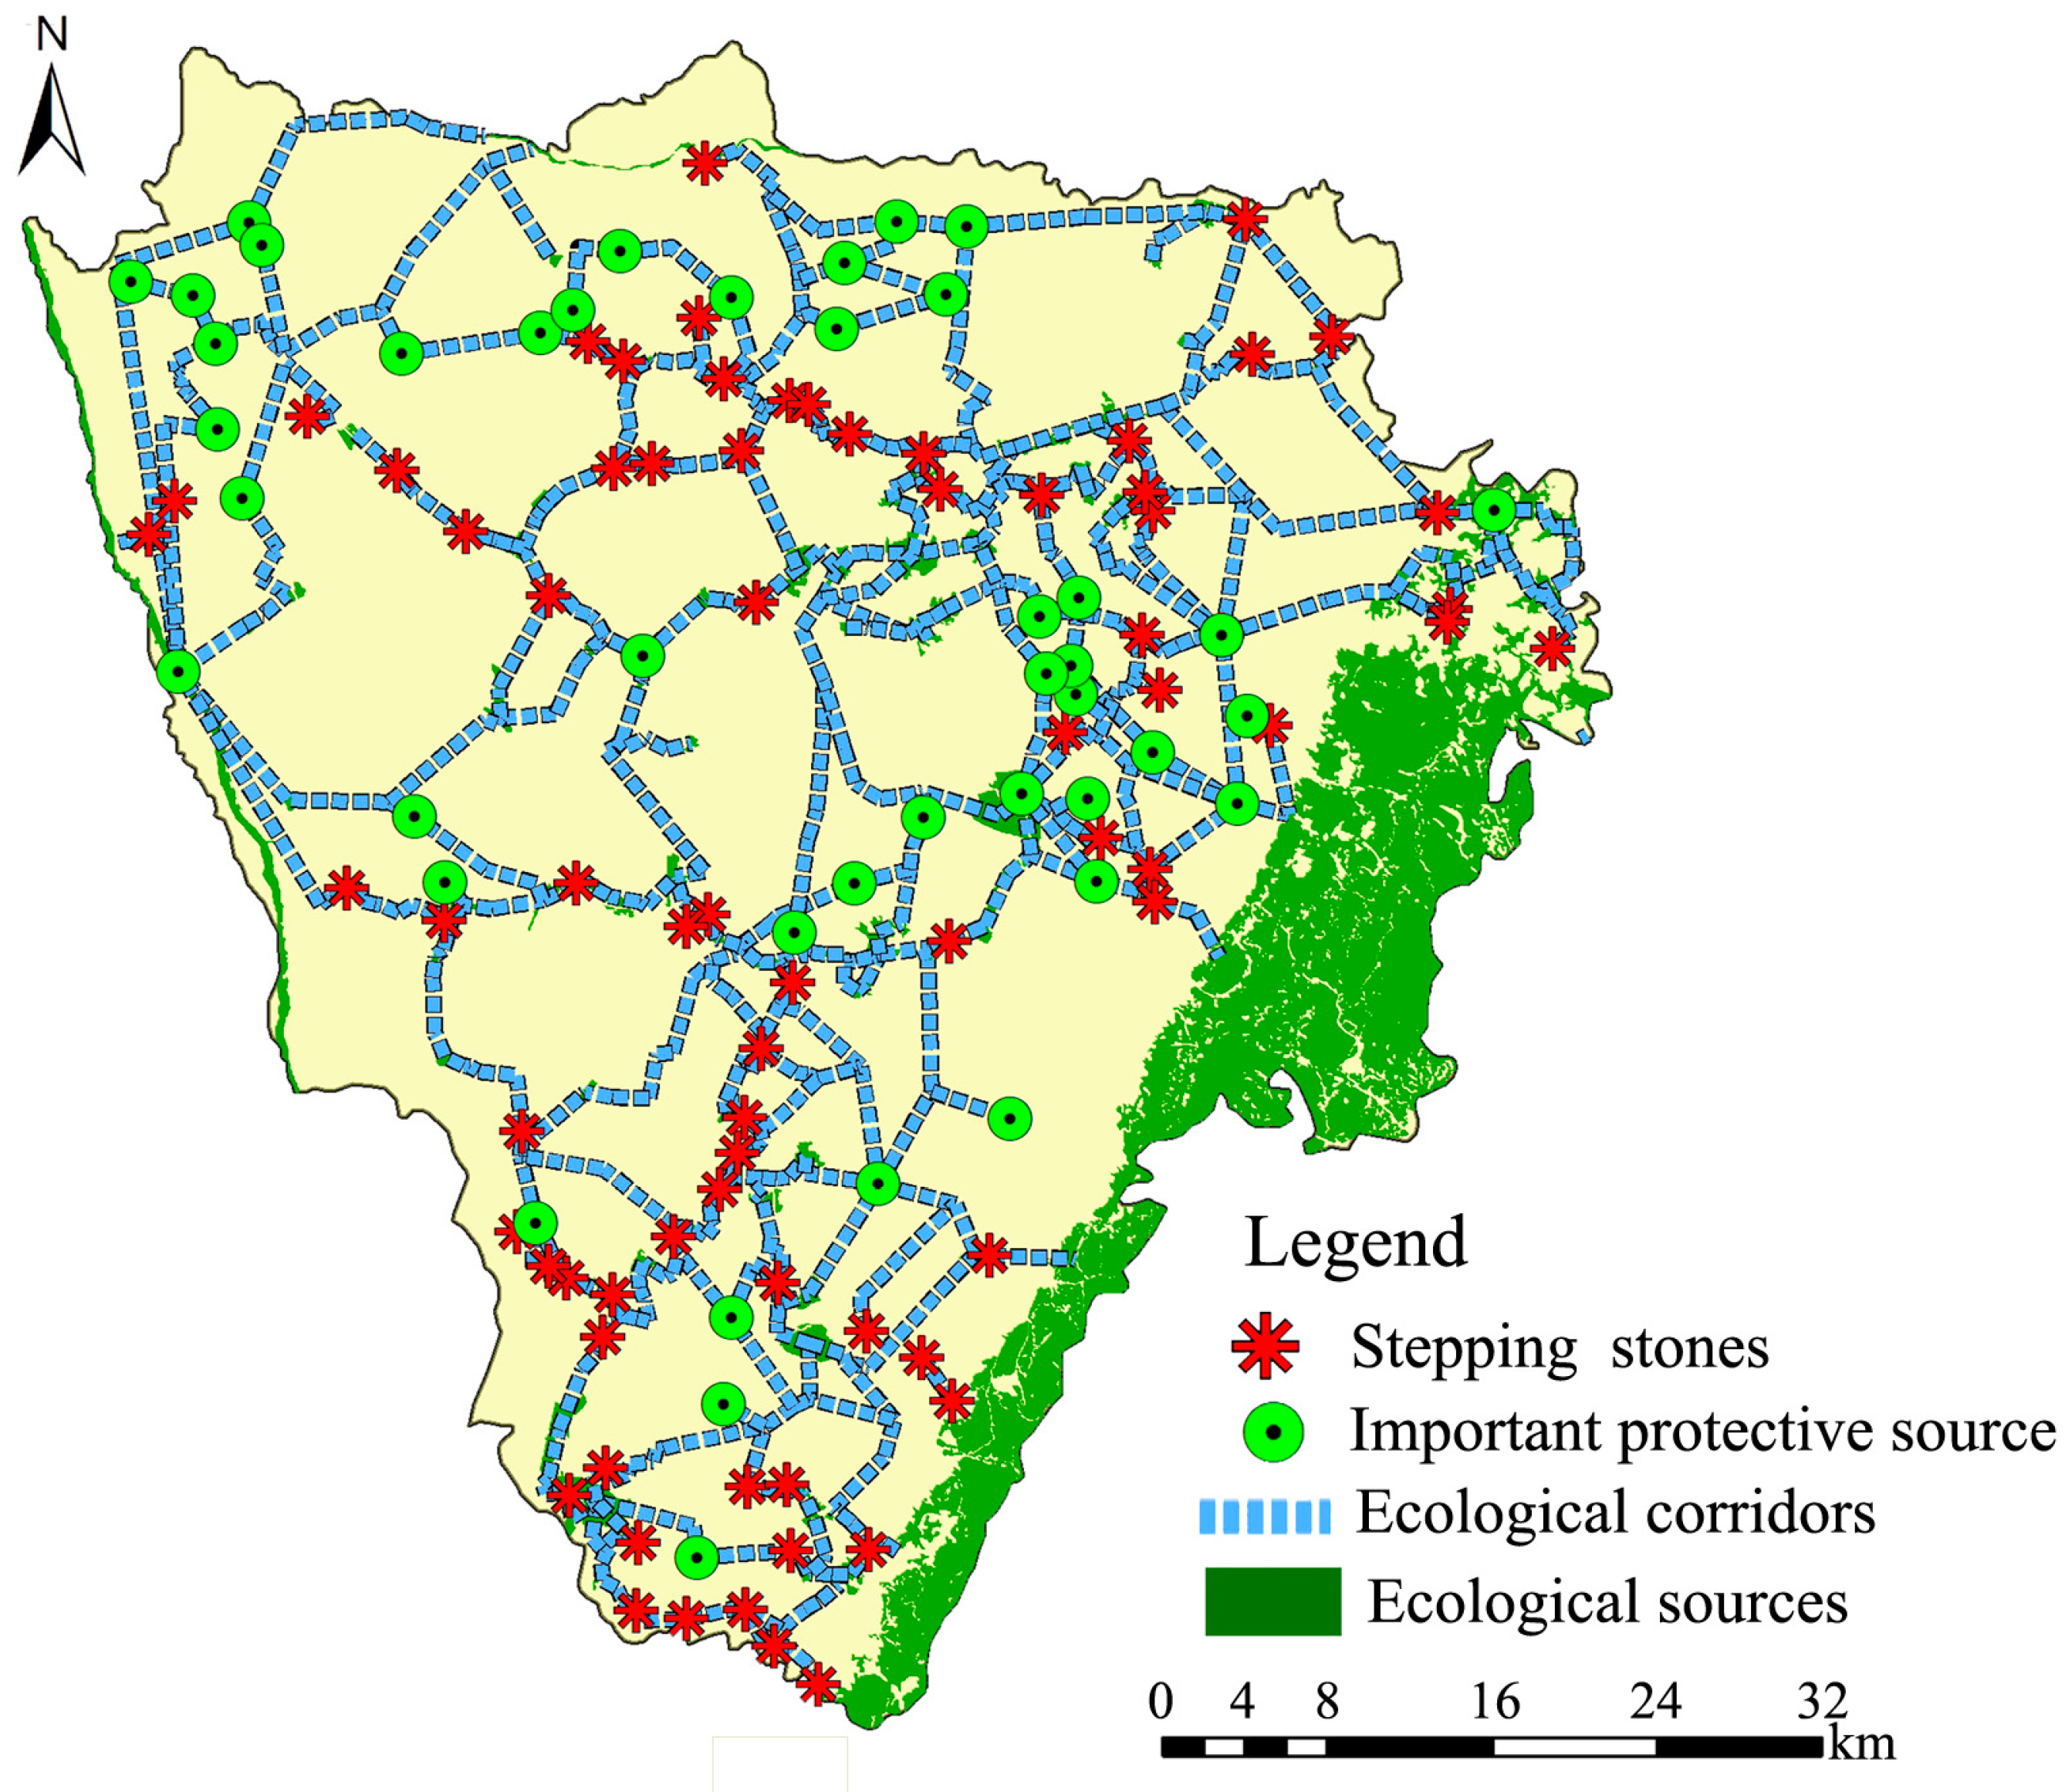
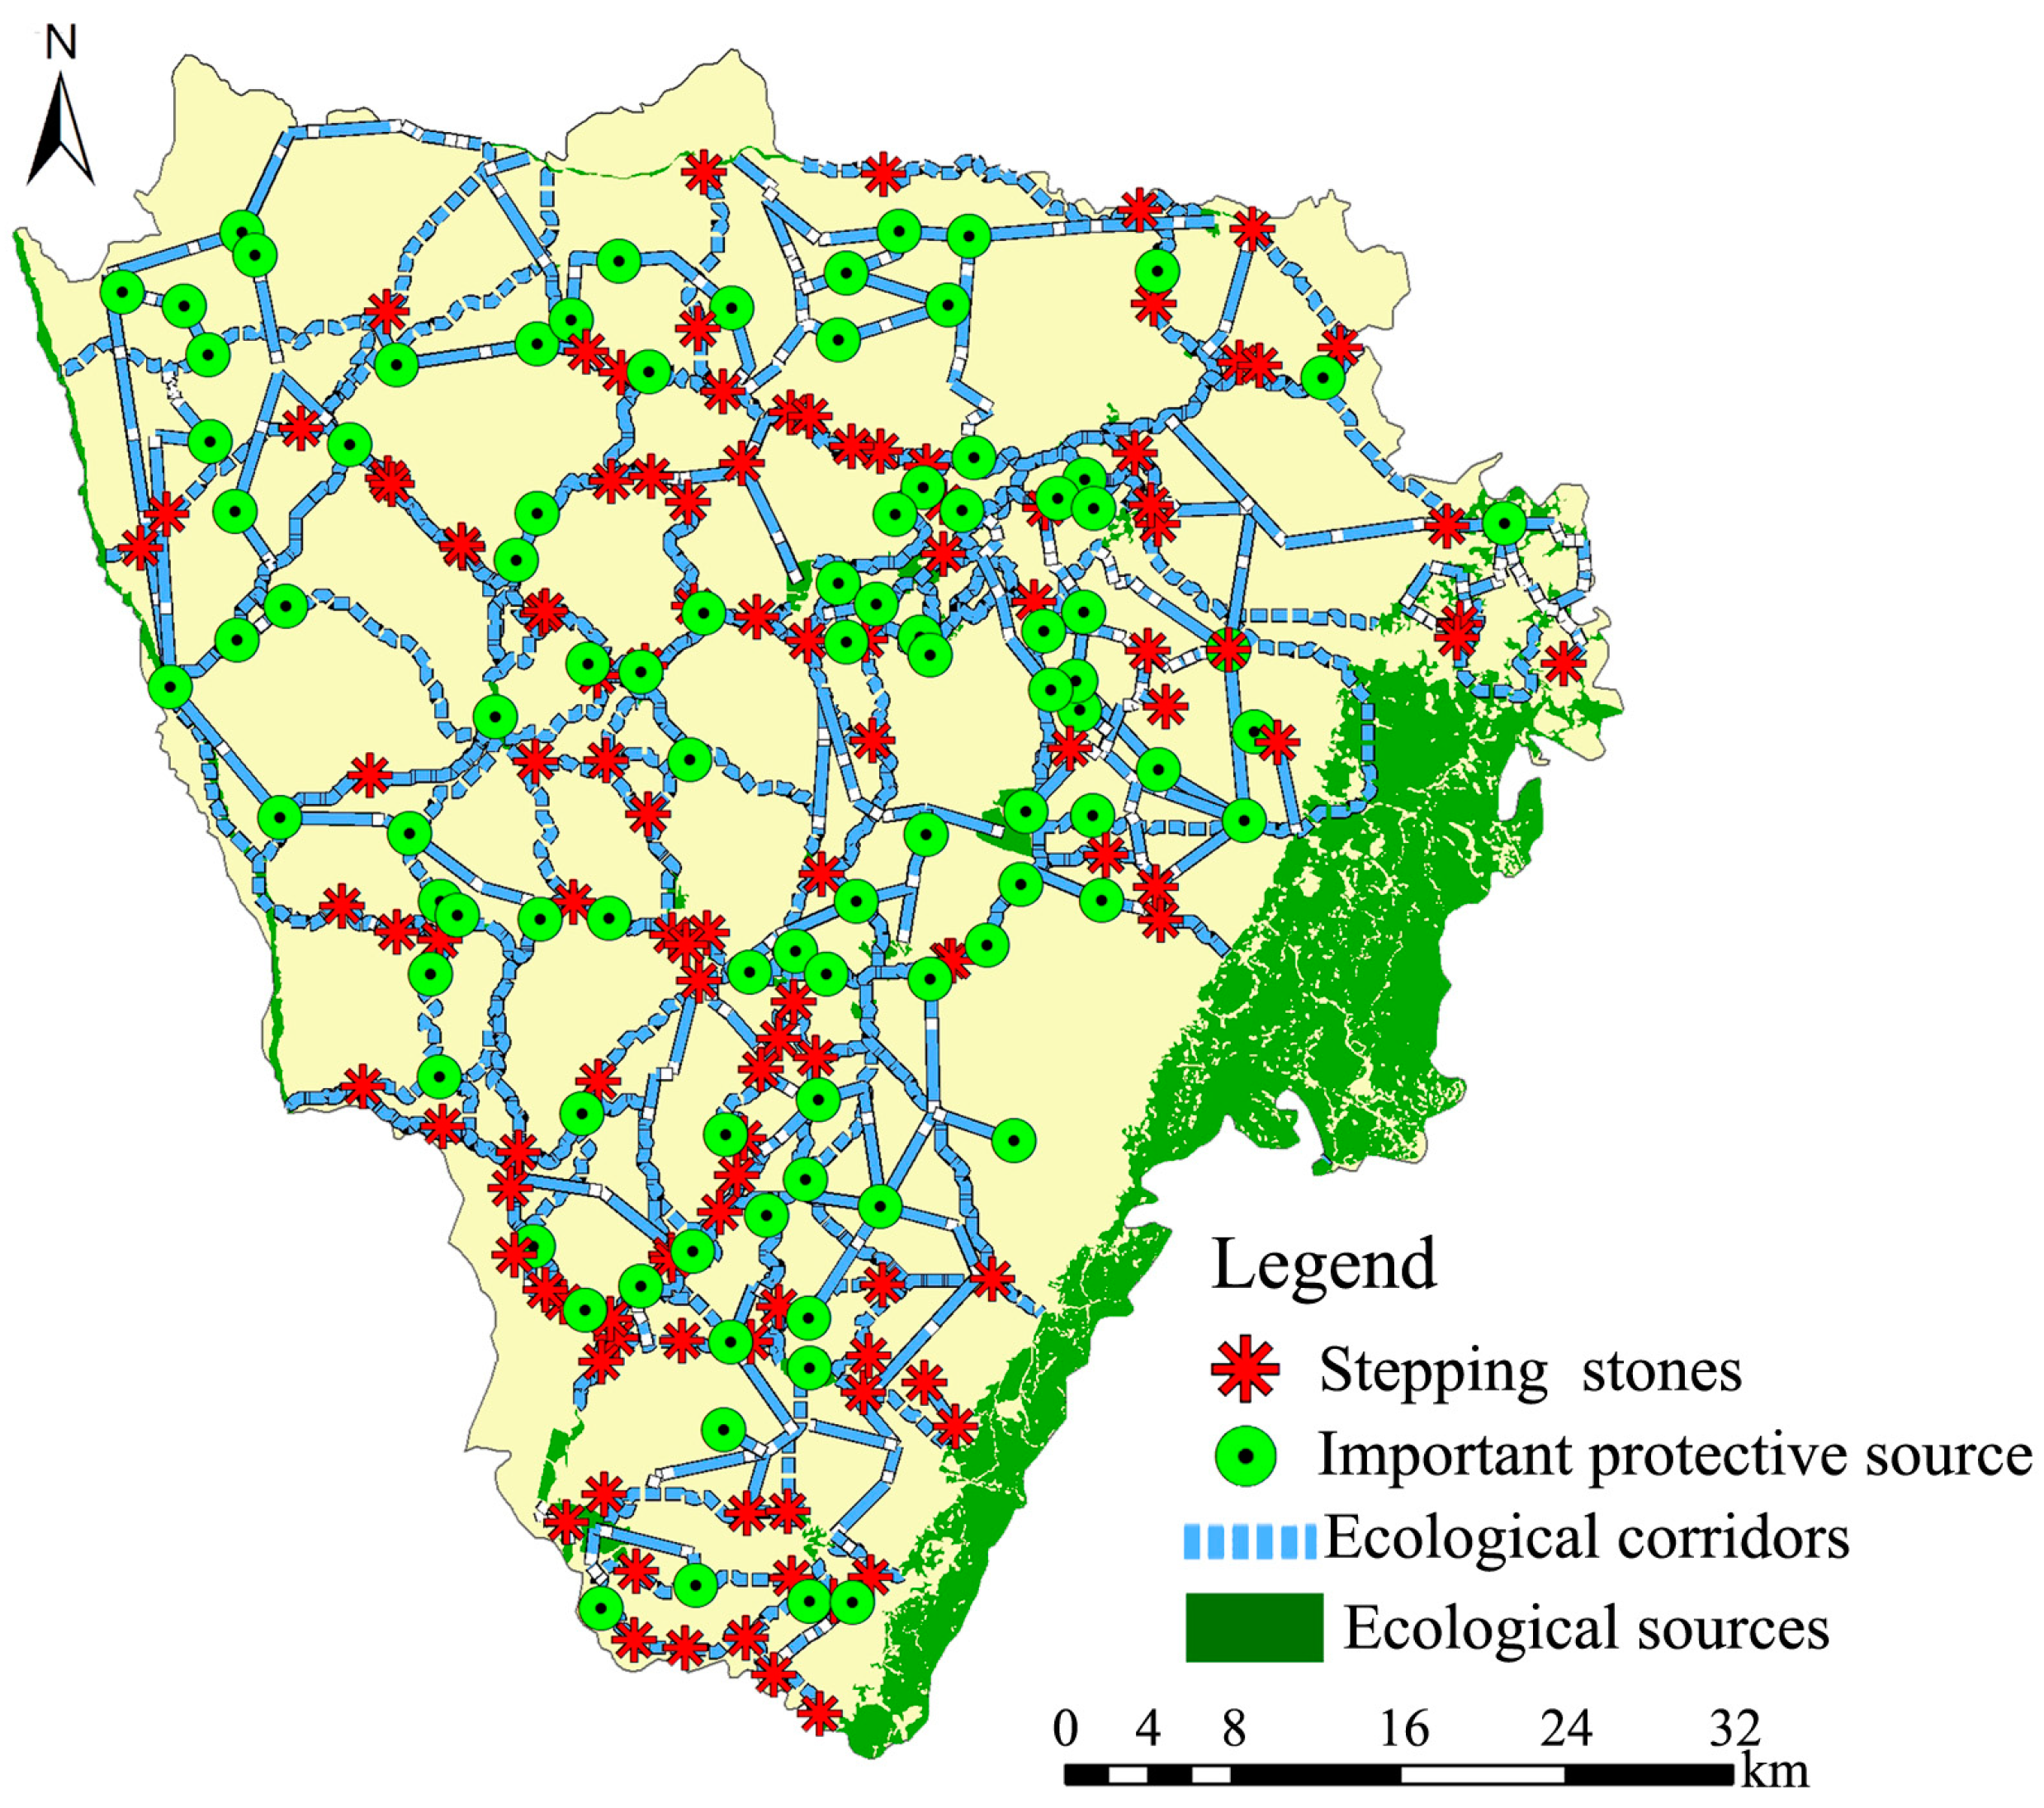
- On the basis of setting the optimal distance threshold of 5 km, the ecological sources, ecological corridors, stepping stones, and the whole green space ecological network of the study area were identified. The optimal green space ecological network with structural connectivity was composed of 74 stepping stone patches, 43 protective sources, 75 ecological sources, and 315 ecological corridors. The connectivity of green space structures gradually decreased from west to east and from periphery to center. There was potential for development in areas such as the Longquan Mountains and the Jinjiang ecological belt, which could form the focus of ecological network optimization in the study area. The number of green patches in the central and southern areas was large and scattered, the number of important corridors in the east and south was the largest, and the number of important corridors in the west was the lowest.
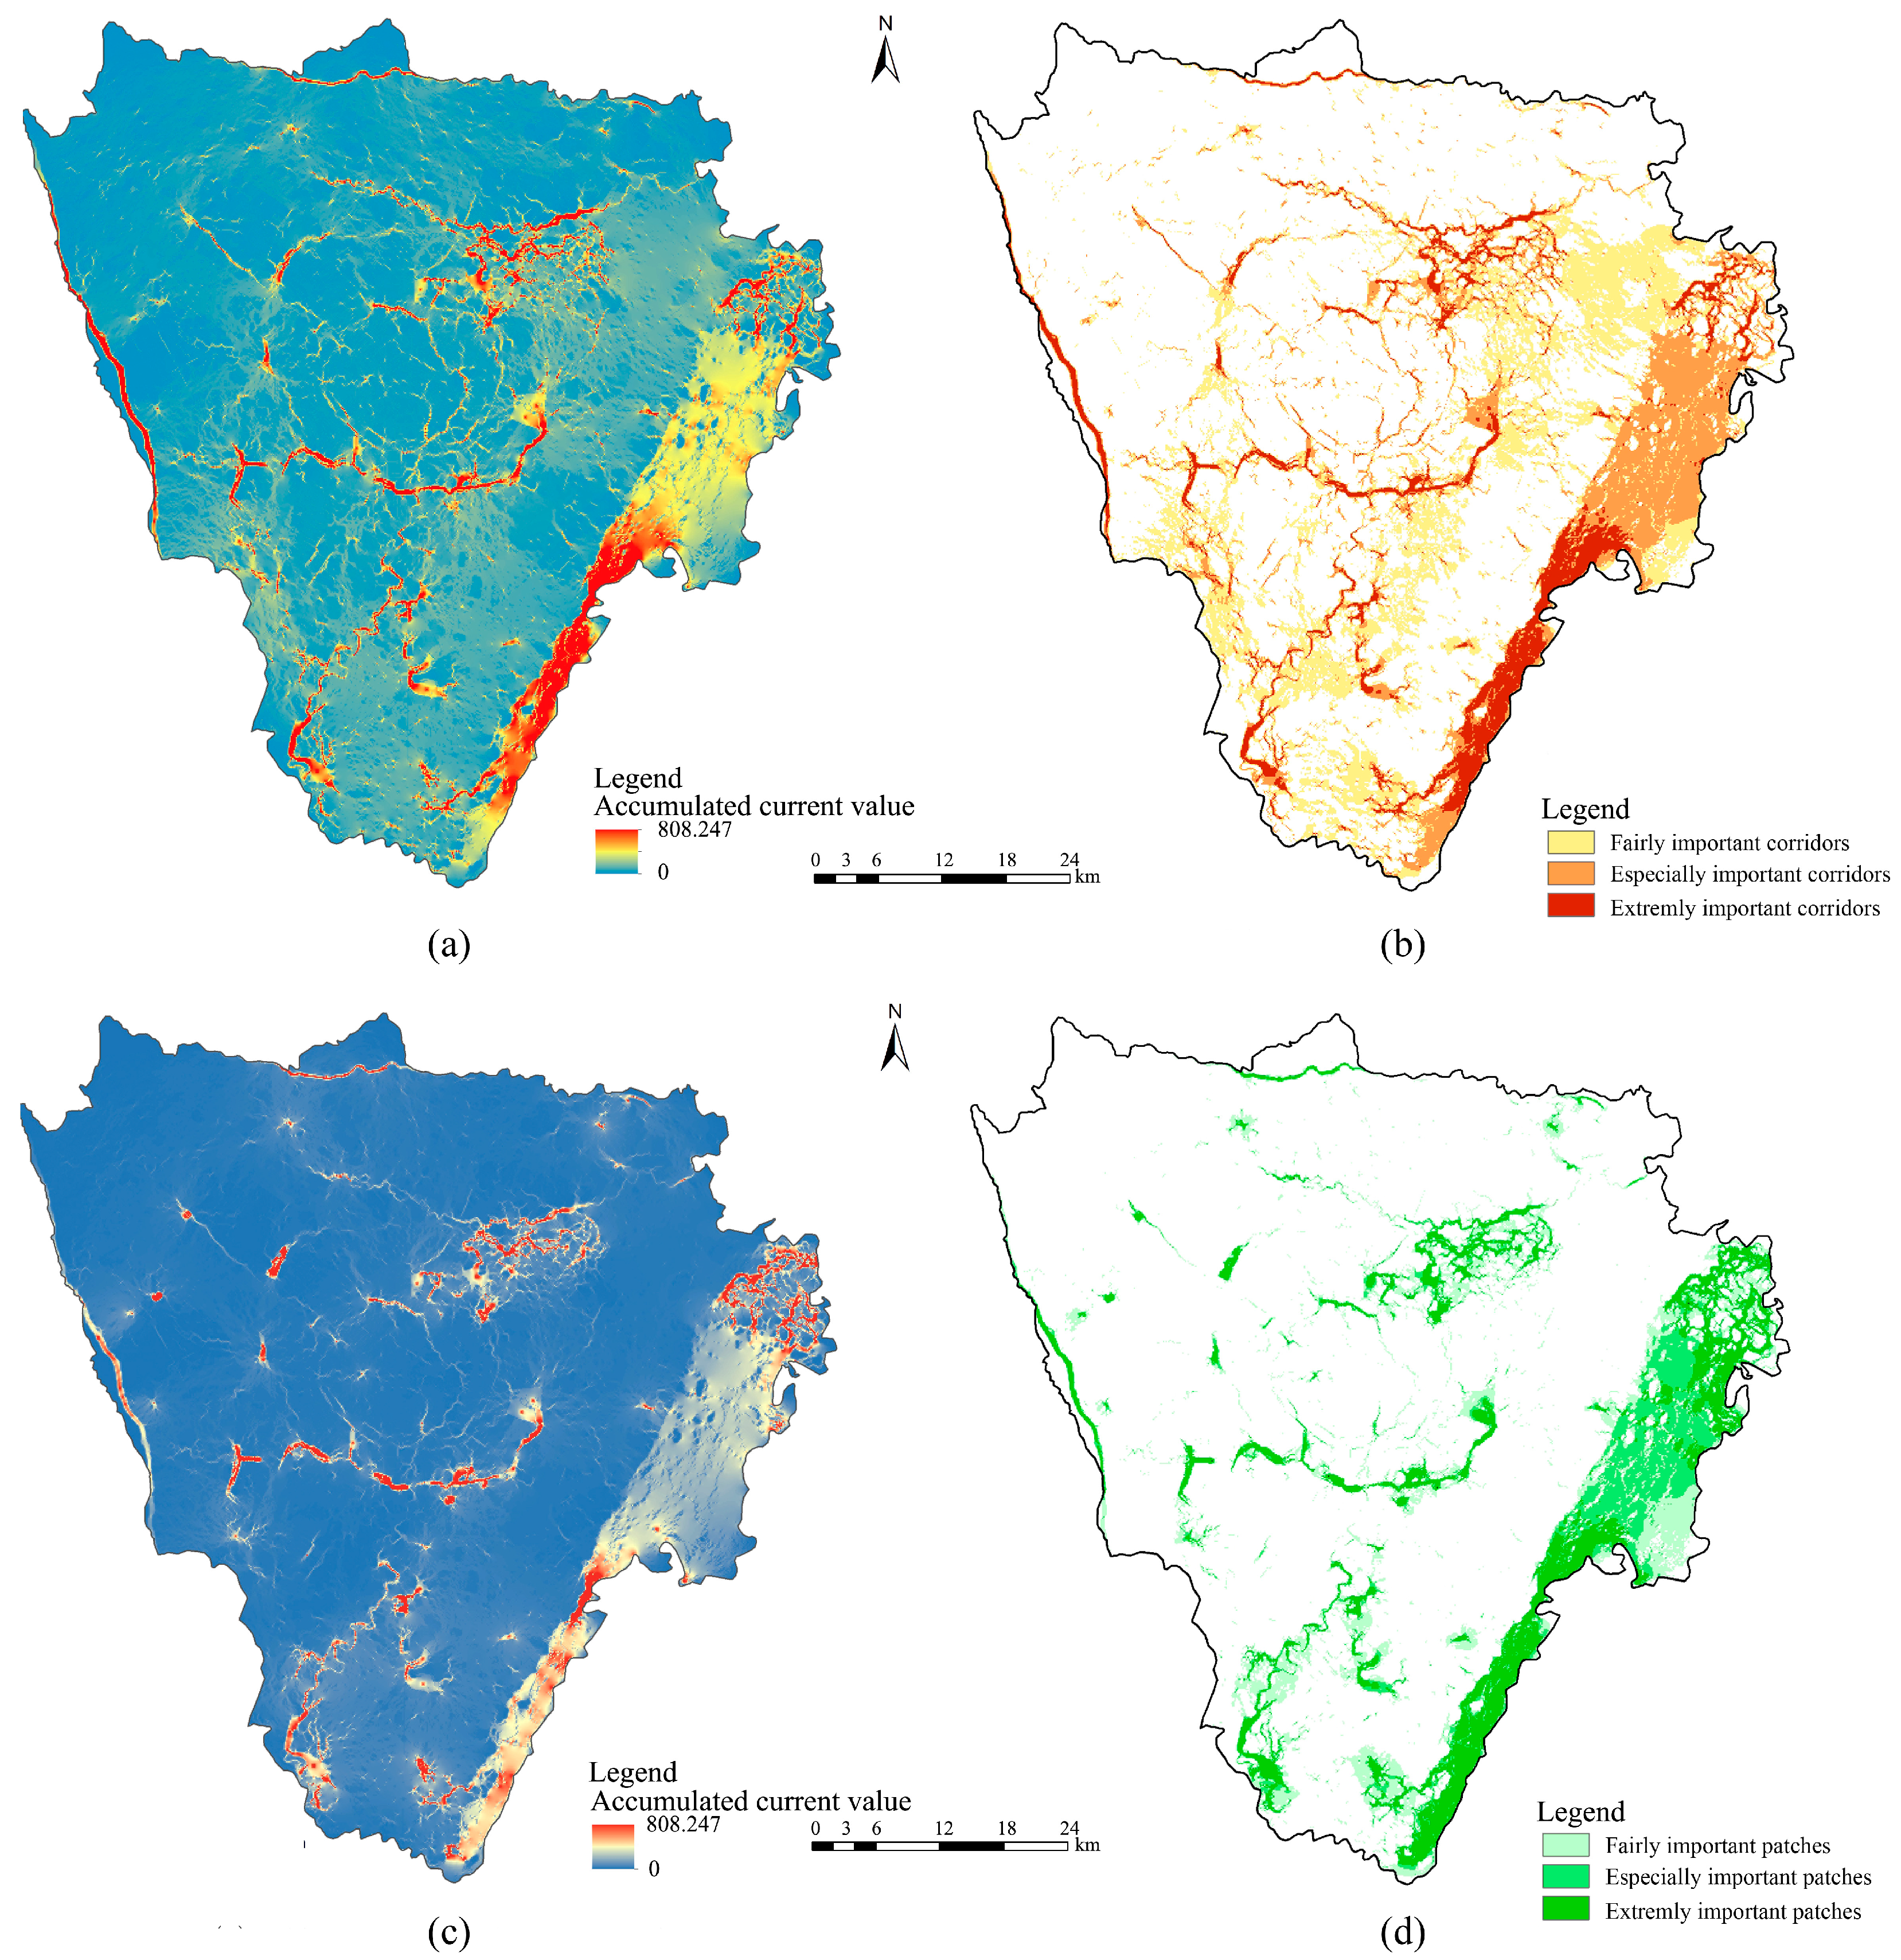
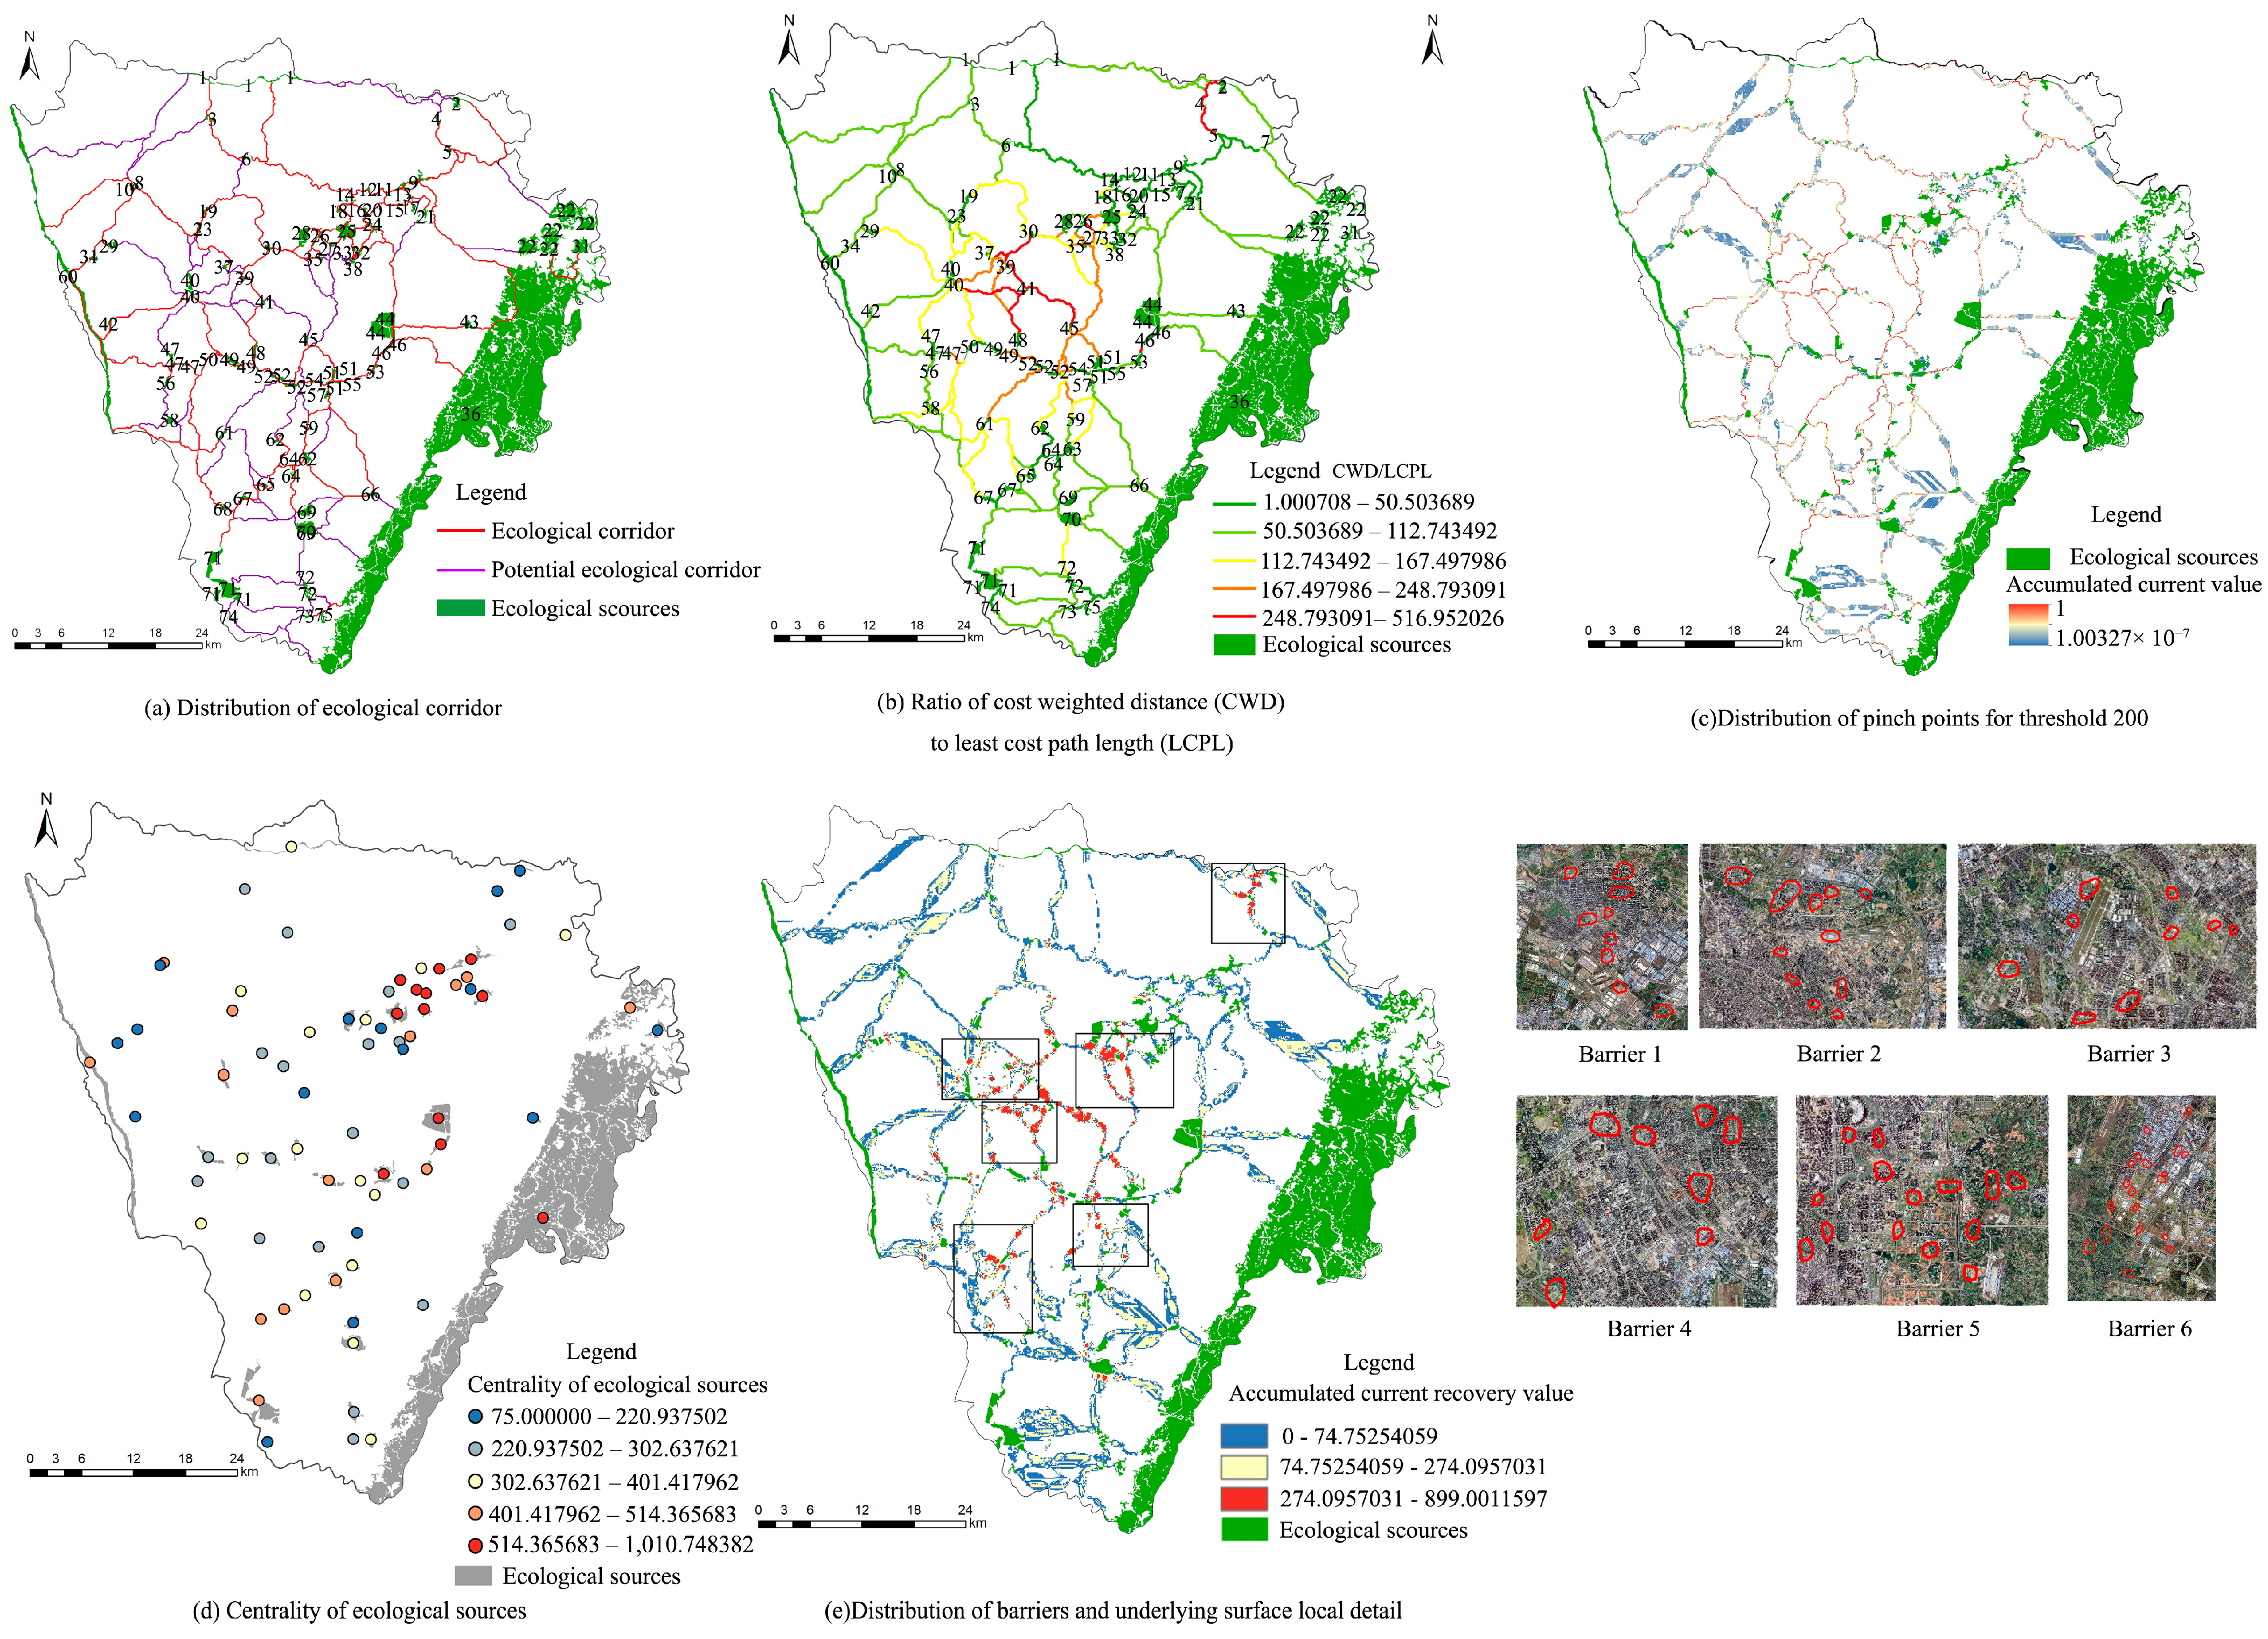
- In the optimal green space ecological network with functional connectivity, there were 40 pinch points, 48 protective sources, and 176 important ecological corridors in the study area, involving forest land, grassland, etc. There were obvious regional differences in functional connectivity corridors. In particular, there were relatively few functional connectivity corridors between Longquan Mountain and the central urban area, and more barriers overlapped with different types of urban construction land. According to the resistance value of barrier points, it was divided into high-level restoration areas covering 27.93 km2, medium-level restoration areas covering 166.94 km2, and low-level restoration areas covering 240.92 km2. The division of the restoration area is important for the sequential construction of Chengdu’s central urban area.
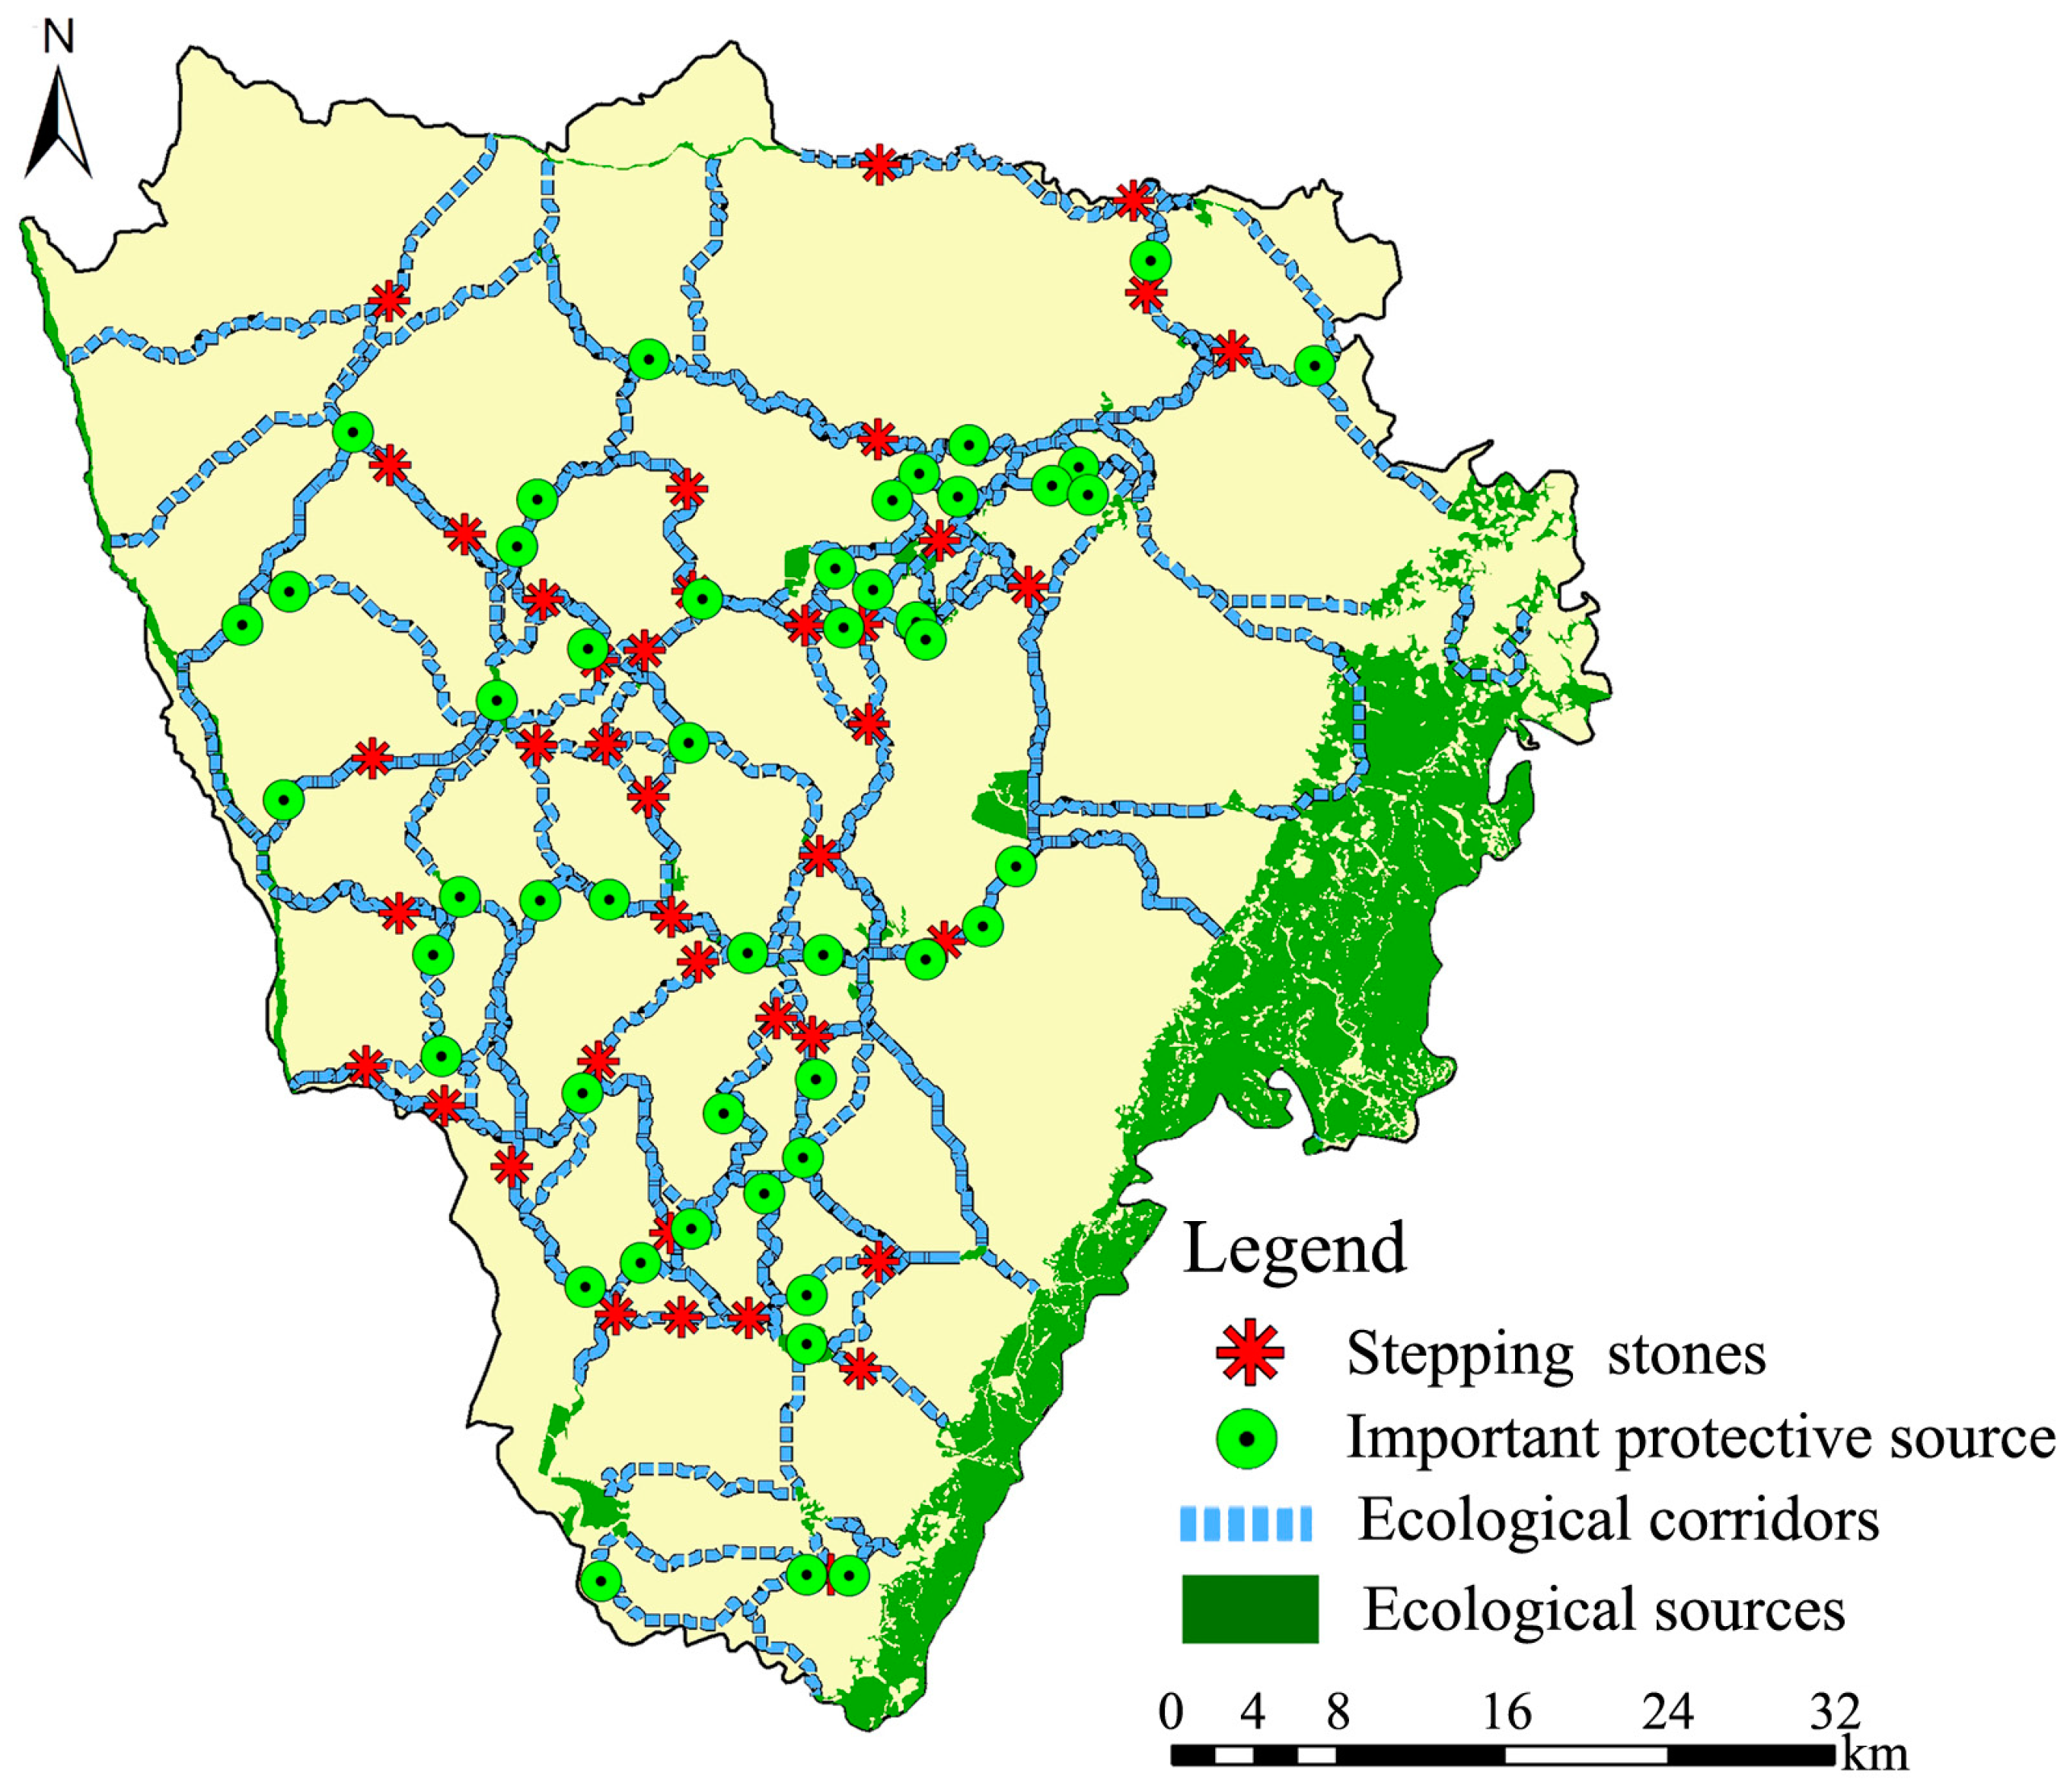
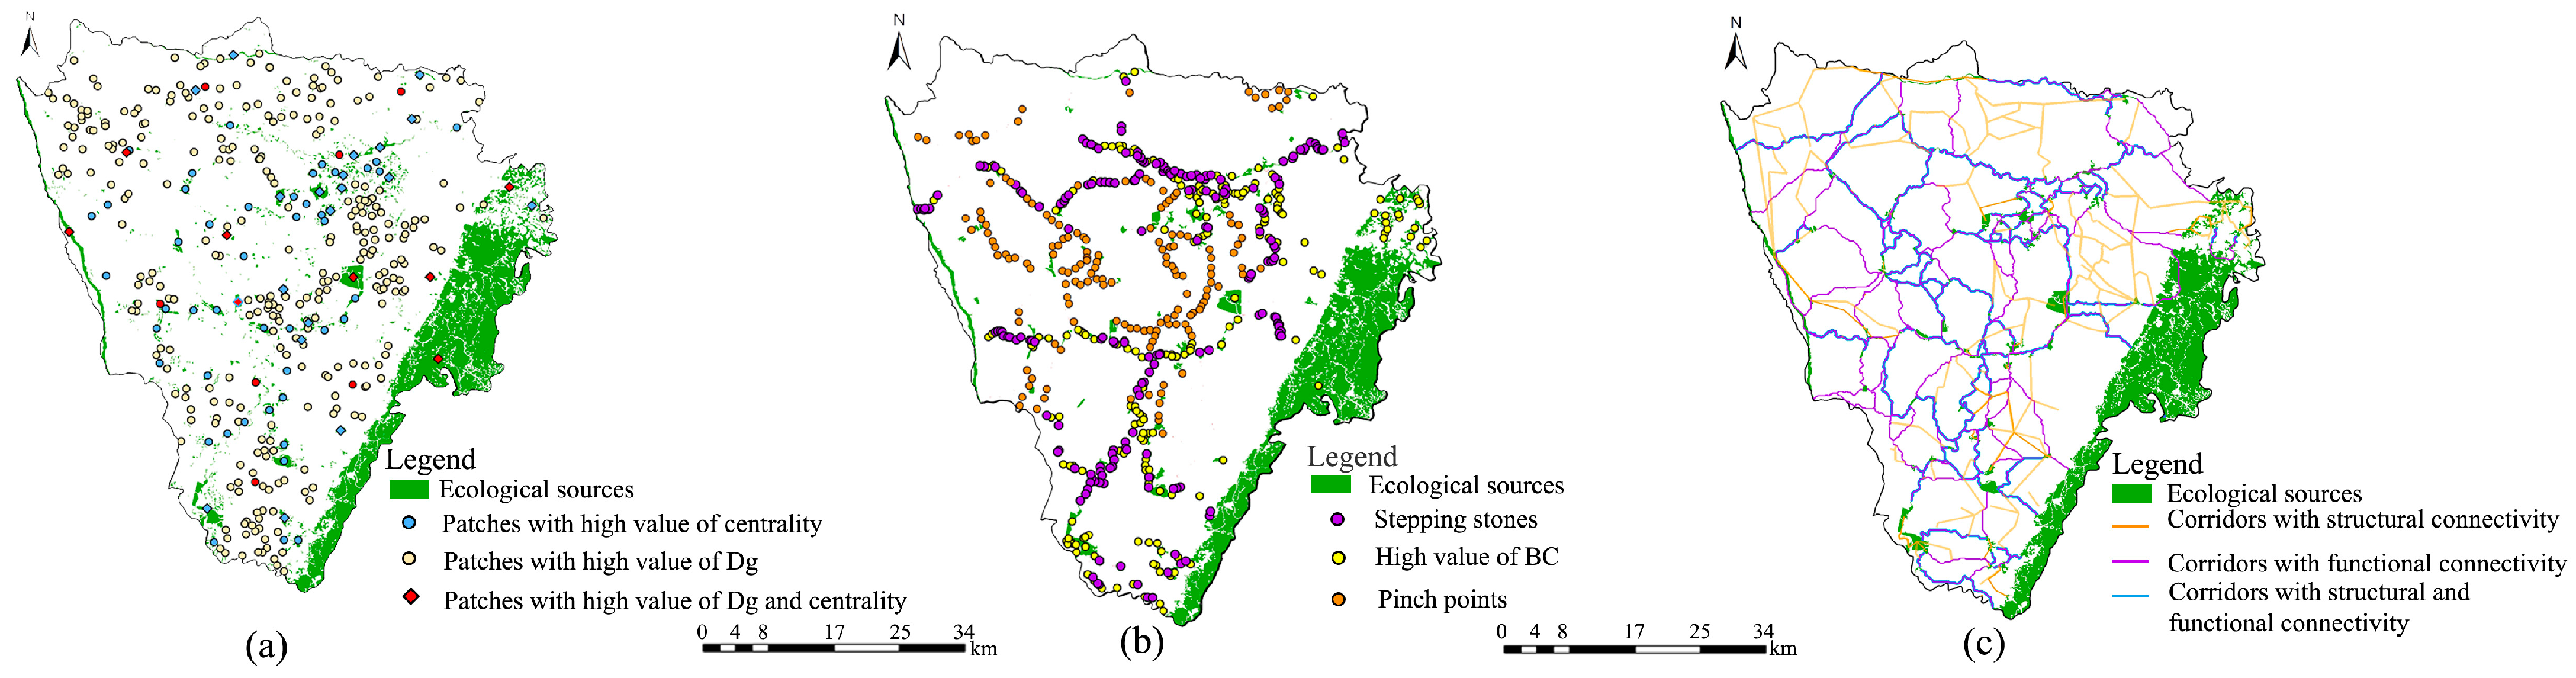
- Through the analysis of the coupling effect of landscape structural and functional connectivity, the ecological network of composite green space was composed of 114 stepping stone patches, 91 important protection patches, and 446 ecological corridors. Longquan Mountain, Qinglong Lake Wetland Park, Jinma River, Pihe River, and other patches play an important role both in structural and functional connectivity. There were many overlapped stepping stones and corridors in the central area of the city. By comparing the connectivity of the three different types of optimized green space ecological networks, the α index, β index, γ index, and Cγ index of ecological networks with coupling structural and functional connectivity were 0.61, 2.21, 0.74, and 0.82, respectively, and its connectivity was the best by comparing to the other ecological network.
- A ring network optimization security pattern of one center, two belts, multiple points, multiple corridors, and multiple zones connected in series was proposed, which provides spatial guidance for urban ecological protection planning. It was suggested to build a multi-level forest and multi-type composite forest ecosystem in Longquan Mountain, strengthen the conservation of vegetation resources and biodiversity, and develop eco-fruit agriculture and eco-tourism. Increasing the protection radiation range of ecological sources can improve its anti-interference ability to the external environment. A buffer zone can be set around key strategic points to alleviate the interference of human activities on strategic points in the process of urban development. It is important to strictly control the development mode and construction intensity of ecological corridors with synergistic effects and set up diversified corridor protection modes. In the process of ecological restoration, based on the current situation of urban land use and the development and construction planning of Chengdu, the feasibility of ecological restoration area construction should be reasonably assessed, and corresponding supplementary and coordinated policies should be made. The use of cultivated land in different regions should be properly handled, the protection of cultivated land should be given priority, and the integrity and diversity of ecological sources should be maintained.
Author Contributions
Funding
Institutional Review Board Statement
Informed Consent Statement
Data Availability Statement
Acknowledgments
Conflicts of Interest
References
- Ouyang, X.; Wei, X.; Wei, G.; Wang, K. The expansion efficiency of urban land in China’s urban agglomerations and its impact on ecosystem services. Habitat Int. 2023, 141, 102944. [Google Scholar] [CrossRef]
- Zhou, Y. Developing urban greenspace ecological network in Chengdu City center based on multiple objectives. J. Zhejiang AF Univ. 2019, 36, 359–365. [Google Scholar] [CrossRef]
- Yao, J.; Liu, M.; Chen, N.N.; Chen, W.; Miao, C.P.; Wang, X.B.; He, X.Y. The spatial variation of air purification benefit provided by street tree assemblages in Shenyang, China. Urban Ecosyst. 2022, 25, 725–732. [Google Scholar] [CrossRef]
- Liu, Y.; Huang, T.T.; Zheng, X. A method of linking functional and structural connectivity analysis in urban green infrastructure network construction. Urban Ecosyst. 2022, 25, 909–925. [Google Scholar] [CrossRef]
- Merriam, G. Connectivity: A fundamental ecological characteristic of landscape pattern, methodology in landscape ecological research and planning. In Proceedings of the lst Seminar, International Association of Landscape Ecology, Roskilde, Denmark, 15–19 October 1984; Brandt, J., Agger, P., Eds.; Roskilde University Centre: Roskilde, Denmark, 1984. [Google Scholar]
- Vogt, P.; Riitters, K.H.; Estreguil, C.; Kozak, J.; Wade, T.G.; Wickham, J.D. Mapping spatial patterns with morphological image processing. Landsc. Ecol. 2007, 22, 171–177. [Google Scholar] [CrossRef]
- Soille, P.; Vogt, P. Morphological segmentation of binary patterns. Pattern Recognit. Lett. 2009, 30, 456–459. [Google Scholar] [CrossRef]
- Saura, S.; Rubio, L. A common currency for the different ways in which patches and links can contribute to habitat availability and connectivity in the landscape. Ecography 2010, 33, 523–537. [Google Scholar] [CrossRef]
- Ning, Q.; Zhu, Z.M.; Qin, M.L.; Shi, Q.Q.; Song, W.Z. Research on the optimization of territorial space ecological network of Nanning City based on MSPA and circuit theory. J. Guangxi Univ. 2021, 46, 306–318. [Google Scholar] [CrossRef]
- Wang, B.Y.; Liu, Z.C. Functional connectivity analyses and construction strategies of the structure of green space network in Haidian district of Beijing. Landsc. Archit. Front. 2019, 7, 34–51. [Google Scholar] [CrossRef]
- Mu, B.; Li, H.W.; Mayer, A.L.; He, R.Z.; Tian, G.H. Dynamic changes of green-space connectivity based on remote sensing and graph theory: A case study in Zhengzhou, China. Acta Ecol. Sin. 2017, 37, 4883–4895. [Google Scholar] [CrossRef]
- Pascual-Hortal, L.; Saura, S. Comparison and development of new graph-based landscape connectivity indices: Towards the priorization of habitat patches and corridors for conservation. Landsc. Ecol. 2006, 21, 959–967. [Google Scholar] [CrossRef]
- Rayfield, B.; Fortin, M.J.; Fall, A. Connectivity for conservation: A framework to classify network measures. Ecology 2011, 92, 847–858. [Google Scholar] [CrossRef]
- Bunn, A.G.; Urban, D.L.; Keitt, T.H. Landscape connectivity: A conservation application of graph theory. J. Environ. Manag. 2000, 59, 265–278. [Google Scholar] [CrossRef]
- Heckmann, T.; Schwanghart, W.; Phillips, J.D. Graph theory-recent developments of its application in geomorphology. Geomorphology 2015, 243, 130–146. [Google Scholar] [CrossRef]
- Minor, E.S.; Urban, D.L. Graph theory as a proxy for spatially explicit population models in conservation planning. Ecol. Appl. 2007, 17, 1771–1782. [Google Scholar] [CrossRef]
- Foltête, J.C.; Girardet, X.; Clauzel, C. A methodological framework for the use of landscape graphs in land-use planning. Landsc. Urban Plan. 2014, 124, 140–150. [Google Scholar] [CrossRef]
- Yin, H.W.; Kong, F.H. (Eds.) Lab Manual for Spatial Analysis in Urban and Regional Planning; Southeast University Press: Nanjing, China, 2018. [Google Scholar]
- Koen, E.L.; Bowman, J.; Sadowski, C.; Walpole, A.A. Landscape connectivity for wildlife: Development and validation of multispecies linkage maps. Mol. Ecol. Resour. 2014, 5, 626–633. [Google Scholar] [CrossRef]
- Correa Ayram, C.A.; Mendoza, M.E.; Etter, A.; Salicrup, D.R.P. Habitat connectivity in biodiversity conservation: A review of recent studies and applications. Prog. Phys. Geogr. 2016, 40, 7–37. [Google Scholar] [CrossRef]
- Cimon-Morin, J.; Poulin, M. Setting conservation priorities in cities: Approaches, targets and planning units adapted to wetland biodiversity and ecosystem services. Landsc. Ecol. 2018, 33, 1975–1995. [Google Scholar] [CrossRef]
- Huang, J.M.; Hu, Y.C.; Zheng, F.Y. Research on recognition and protection of ecological security patterns based on circuit theory: A case study of Jinan City. Environ. Sci. Pollut. Res. 2020, 27, 12414–12427. [Google Scholar] [CrossRef]
- An, Y.; Liu, S.; Sun, Y.; Shi, F.N.; Beazley, R. Construction and optimization of an ecological network based on morphological spatial pattern analysis and circuit theory. Landsc. Ecol. 2021, 36, 2059–2076. [Google Scholar] [CrossRef]
- Mcrae, B.H. Isolation by resistance. Evolution 2006, 60, 1551–1561. [Google Scholar] [CrossRef]
- Mcrae, B.H.; Dickson, B.G.; Keitt, T.H.; Shah, V.B. Using circuit theory to model connectivity in ecology, evolution, and conservation. Ecology 2008, 89, 2712–2724. [Google Scholar] [CrossRef] [PubMed]
- Yin, Y.; Liu, S.; Sun, Y.; Zhao, S.; An, Y.; Dong, S.; Coxixo, A. Identifying multispecies dispersal corridor priorities based on circuit theory: A case study in Xishuangbanna, Southwest China. J. Geogr. Sci. 2019, 29, 1228–1245. [Google Scholar] [CrossRef]
- Saura, S.; Pascual-Hortal, L. A new habitat availability index to integrate connectivity in landscape conservation planning: Comparison with existing indices and application to a case study. Landsc. Urban Plan. 2007, 83, 91–103. [Google Scholar] [CrossRef]
- Poor, E.E.; Loucks, C.; Jakes, A.; Urban, D.L. Comparing habitat suitability and connectivity modeling methods for conserving pronghorn migrations. PLoS ONE 2012, 7, e49390. [Google Scholar] [CrossRef] [PubMed]
- Liu, J.; Yin, H.W.; Kong, F.H.; Li, M.H. Structure optimization of circuit theory-based green infrastructure in Nanjing, China. Acta Ecol. Sin. 2018, 38, 4363–4372. [Google Scholar] [CrossRef]
- Li, T.; Gong, Y.B.; Ge, J.Z.; Qi, Z.X.; Xie, S.B. Construction of urban landscape ecological security pattern based on circuit theory: A case study of Hengyang City, Hunan Province, China. Chin. J. Appl. Ecol. 2021, 32, 2555–2564. [Google Scholar] [CrossRef]
- Wu, Y.R.; Wu, J.J.; Bi, X.L.; Li, Y.Z.; Xiao, L.X. Application of the least cost distance model and the circuit theory model in the evaluation of wetland landscape connectivity in the Yellow River Delta. Acta Ecol. Sin. 2022, 42, 1315–1326. [Google Scholar] [CrossRef]
- Bishop-Taylor, R.; Tulbure, M.G.; Broich, M. Surface water network structure, landscape resistance to movement and flooding vital for maintaining ecological connectivity across Australia’s largest river basin. Landsc. Ecol. 2015, 30, 2045–2065. [Google Scholar] [CrossRef]
- Dickson, B.G.; Albano, C.M.; McRae, B.H.; Anderson, J.J.; Theobald, D.M.; Zachmann, L.J.; Sisk, T.D.; Dombeck, M.P. Informing Strategic Efforts to Expand and Connect Protected Areas Using a Model of Ecological Flow, with Application to the Western United States. Conserv. Lett. 2017, 10, 564–571. [Google Scholar] [CrossRef]
- Koen, E.L.; Bowman, J.; Walpole, A.A. The effect of cost surface parameterization on landscape resistance estimates. Mol. Ecol. Resour. 2012, 12, 686–696. [Google Scholar] [CrossRef]
- McRae, B.H.; Hall, S.A.; Beier, P.; Theobald, D.M. Where to restore ecological connectivity? Detecting barriers and quantifying restoration benefits. PLoS ONE 2012, 7, e52604. [Google Scholar] [CrossRef] [PubMed]
- Xiao, Y.; Sun, H. If a City is not a Tree: A comparative study on urban complexity theories between Alexander’s and Salingaros’ studies. Architect 2013, 6, 76–83. [Google Scholar]
- Alexander, C.; Yan, X.Y. A City is not a Tree. Architect 1985, 6, 206–224. [Google Scholar]
- Batty, M.P. Fractal Cites: A Geometry of Form and Function; Academic Press: London, UK, 1994. [Google Scholar]
- Hillier, B. Space Is the Machine: A Configurational Theory of Architecture; Cambridge University Press: London, UK, 1999. [Google Scholar]
- Chen, Y.G. Self-organization and self-organizing cites. Urban Urban Plan. 2003, 10, 17–22. [Google Scholar]
- Salingaros, N.A. Theory of the Urban Web. J. Urban Des. 1998, 3, 53–71. [Google Scholar] [CrossRef]
- Wang, M.Z. The Study of Urban Green Space Ecological Network Based on Connectivity. Master’s thesis Thesis, Beijing Forestry University, Beijing, China, 2010. [Google Scholar]
- Ouyang, X.; Xu, J.; Li, J.; Wei, X.; Li, Y. Land space optimization of urban-agriculture-ecological functions in the Changsha-Zhuzhou-Xiangtan Urban Agglomeration, China. Land Use Policy 2022, 117, 106112. [Google Scholar] [CrossRef]


| Graph Metrics | Meaning | Scale | Formula |
|---|---|---|---|
| Integral Index of Connectivity (IIC) | 0 ≤ IIC ≤ 1. The higher the IIC value, the higher the connectivity. | Global level, Delta | |
| Node degree (Dg) | The larger the value, the more important the spatial connectivity. | Local level | |
| Betweenness Centrality index (BC) | BC ≥ 0. BC indicates the importance of a landscape patch as a stepping stone in most of the shortest paths. | Local level | |
| Probability of Connectivity (PC) | 0 ≤ PC ≤ 1. The higher the PC value, the higher the landscape connectivity. | Global level, Delta | |
| Number of Components (NC) | NC ≥ 1. The larger the number, the lower the global spatial connectivity. | Global level | |
| Fractions of delta connectivity index (dI) | Rate of variation between connectivity index value of I (PC or IIC) and connectivity index value of Iremove corresponding to the removal of the patch i. | Delta |
| Land Type | Grading Index | Resistance |
|---|---|---|
| Water body (area S) | S ≤ 10 hm2 | 7 |
| 10 hm2 < S ≤ 100 hm2 | 20 | |
| S > 100 hm2 | 600 | |
| Built-up land | P * < 1 | 700 |
| 1 ≤ P < 2 | 800 | |
| 2 ≤ P < 3 | 900 | |
| P ≥ 3 | 1000 | |
| Road land | Railway | 700 |
| Fast way | 600 | |
| Primary way | 500 | |
| Secondary way | 400 | |
| Branch way | 300 | |
| Other road | 550 | |
| Farm land | Paddy field | 120 |
| Dry field | 150 | |
| Green space (area S) | S ≤ 5 hm2 | 5 |
| 5 hm2 < S ≤ 10 hm2 | 3 | |
| S > 10 hm2 | 1 |
| Index | Ecological Network with Structural Connectivity | Ecological Network with Functional Connectivity | Ecological Network Coupling with Structural and Functional Connectivity |
|---|---|---|---|
| α index | 0.33 | 0.25 | 0.46 |
| Β index | 1.64 | 1.49 | 1.91 |
| γ index | 0.57 | 0.51 | 0.64 |
| Cγ index | 0.56 | 0.88 | 0.82 |
Disclaimer/Publisher’s Note: The statements, opinions and data contained in all publications are solely those of the individual author(s) and contributor(s) and not of MDPI and/or the editor(s). MDPI and/or the editor(s) disclaim responsibility for any injury to people or property resulting from any ideas, methods, instructions or products referred to in the content. |
© 2023 by the authors. Licensee MDPI, Basel, Switzerland. This article is an open access article distributed under the terms and conditions of the Creative Commons Attribution (CC BY) license (https://creativecommons.org/licenses/by/4.0/).
Share and Cite
Zhou, Y.; Yao, J.; Chen, M.; Tang, M. Optimizing an Urban Green Space Ecological Network by Coupling Structural and Functional Connectivity: A Case for Biodiversity Conservation Planning. Sustainability 2023, 15, 15818. https://doi.org/10.3390/su152215818
Zhou Y, Yao J, Chen M, Tang M. Optimizing an Urban Green Space Ecological Network by Coupling Structural and Functional Connectivity: A Case for Biodiversity Conservation Planning. Sustainability. 2023; 15(22):15818. https://doi.org/10.3390/su152215818
Chicago/Turabian StyleZhou, Yuan, Jing Yao, Mingkun Chen, and Mi Tang. 2023. "Optimizing an Urban Green Space Ecological Network by Coupling Structural and Functional Connectivity: A Case for Biodiversity Conservation Planning" Sustainability 15, no. 22: 15818. https://doi.org/10.3390/su152215818
APA StyleZhou, Y., Yao, J., Chen, M., & Tang, M. (2023). Optimizing an Urban Green Space Ecological Network by Coupling Structural and Functional Connectivity: A Case for Biodiversity Conservation Planning. Sustainability, 15(22), 15818. https://doi.org/10.3390/su152215818