1. Introduction
Agriculture plays a fundamental role in the national economy and is crucial for ensuring stability and sustainable social development [
1,
2,
3]. However, since the implementation of reform and opening-up policies, the uneven distribution of socio-economic development and the process of urbanization have had a significant impact on the spatial arrangement of agricultural activities in China [
4,
5], These challenges have been further exacerbated by the limited availability of arable land, the expansion of urban construction, and the need for ecological land preservation [
6,
7]. In order to promote the establishment of a spatial development pattern that integrates population, economy, resources, and the environment, and to expedite the transition to an economic development model that ensures long-term stability and rapid growth, the State Council issued the national main function zone plan at the end of 2010 [
8,
9]. The significance of agricultural development has gained prominence, notably underscored in the No. 1 Central Document. Despite witnessing a substantial surge in agricultural output due to the implementation of this plan, agricultural progress is experiencing an array of constraints and challenges, including agricultural pollution, limited awareness of innovative agricultural practices, and suboptimal agricultural productivity [
10,
11,
12]. Consequently, the pursuit of food security and expeditious economic advancement demands a dual focus: not only enhancing agricultural productivity but also placing equal emphasis on the caliber of agricultural development. This emerging imperative has led to a growing demand for a scientific quantification of the efficacy and extent of agricultural development within the framework of the plan, thereby catalyzing scholarly inquiries into this domain.
Against the backdrop of the diversification of agricultural development goals, some scholars have been optimizing the dimensions for evaluating the level of agricultural development. These dimensions have expanded from traditional agricultural production efficiency levels to include agricultural industry system construction, agricultural support and protection levels, agricultural green development levels, and agricultural modernization development levels [
5,
13,
14]. For instance, Cui [
15] evaluated the level of high-quality agricultural development in the Yangtze River Economic Belt by establishing a five-dimensional indicator system, encompassing innovation, coordination, green, openness, and sharing. Similarly, Hou and Wang [
16] comprehensively assessed the level of agricultural green development in the three provinces of Northeast using four dimensions: agricultural development, ecological resource protection, environmental friendliness, and industrial extension and integration. Additionally, Zhang [
17] constructed a six-dimensional indicator system to evaluate the level of agricultural modernization in Shandong Province. This system included dimensions such as the agricultural production system, operating system, industrial system, output efficiency, rural social development, and sustainable agricultural development. Building upon the objectives of green agricultural production and national agricultural census data, Liu [
5] developed an evaluation indicator system covering five dimensions, namely supply capacity, resource use, environmental quality, ecosystem maintenance, and farmers’ livelihoods. These previous studies are of great significance in enhancing our understanding of China’s agricultural development level. However, the limitations of the evaluation indicator systems used in most studies, including poor data availability, inconsistent standards, subjective weighting, and insufficient validation of evaluation indicators, have restricted the applicability of existing agricultural assessments to specific regions, making it challenging to conduct nationwide evaluations.
In terms of evaluation methodology, many studies have focused on comparing the differences in agricultural development levels across provinces or prefecture-level cities using statistical data from multiple years. Various evaluation methods such as the comprehensive index evaluation method, the analytic hierarchy process (AHP), principal component analysis (PCA), TOPSIS model, and the BP neural network have been widely adopted [
18,
19,
20]. Among them, the comprehensive index evaluation method is currently the most widely used and recognized evaluation method for agricultural development levels due to its comprehensiveness, completeness, and ease of implementation [
21]. It can provide a holistic understanding of the level of agricultural development at the national, provincial, or county scale. Thus, the comprehensive index evaluation method is extensively employed to assess the status of urban development, the spatiotemporal evolution of urban–agricultural–ecological space, agricultural development, and agricultural modernization levels [
22,
23,
24,
25,
26,
27].
Conducting a comprehensive study of the spatiotemporal heterogeneity of a certain development trend is conducive to discovering the problems and shortcomings in the development process of specific research objects, and it is of great significance for promoting its coordinated and rapid development. For example, studying the spatiotemporal patterns of bus passengers can not only reveal the spatiotemporal changes of passenger mobility, but also provide basic information for the design of transportation facilities and the formulation of policies [
28]. The Main Functional Area Plan (MFAP) clearly states that the core of county-level agricultural development should primarily focus on the concentrated distribution of agricultural products, rural population, agricultural production, and rural living space [
29]. Furthermore, regular evaluation of comprehensive agricultural development levels in functional areas serves as the fundamental basis for guiding, motivating, constraining, and regulating the construction and functional positioning adjustment of agricultural production areas [
29,
30]. Counties serve as the smallest unit for implementing the main functional area strategy system, and the quantitative evaluation of the agricultural development level at the county scale is conducive to grasping the operational status of the main functional area and truly providing practical guidance for the operation and adjustment of the main functional area. Unfortunately, since the implementation of the MFAP, systematic and quantitative evaluation of county-level agricultural development across China has not been conducted. Currently, there is a lack of comprehensive nationwide assessments of the ADL based on index evaluation methods. Although county-level agricultural development level assessment in specific provinces has a relatively systematic framework, it is challenging to expand a single case study to the whole country due to the universality of the indicator system and the limitations of data availability.
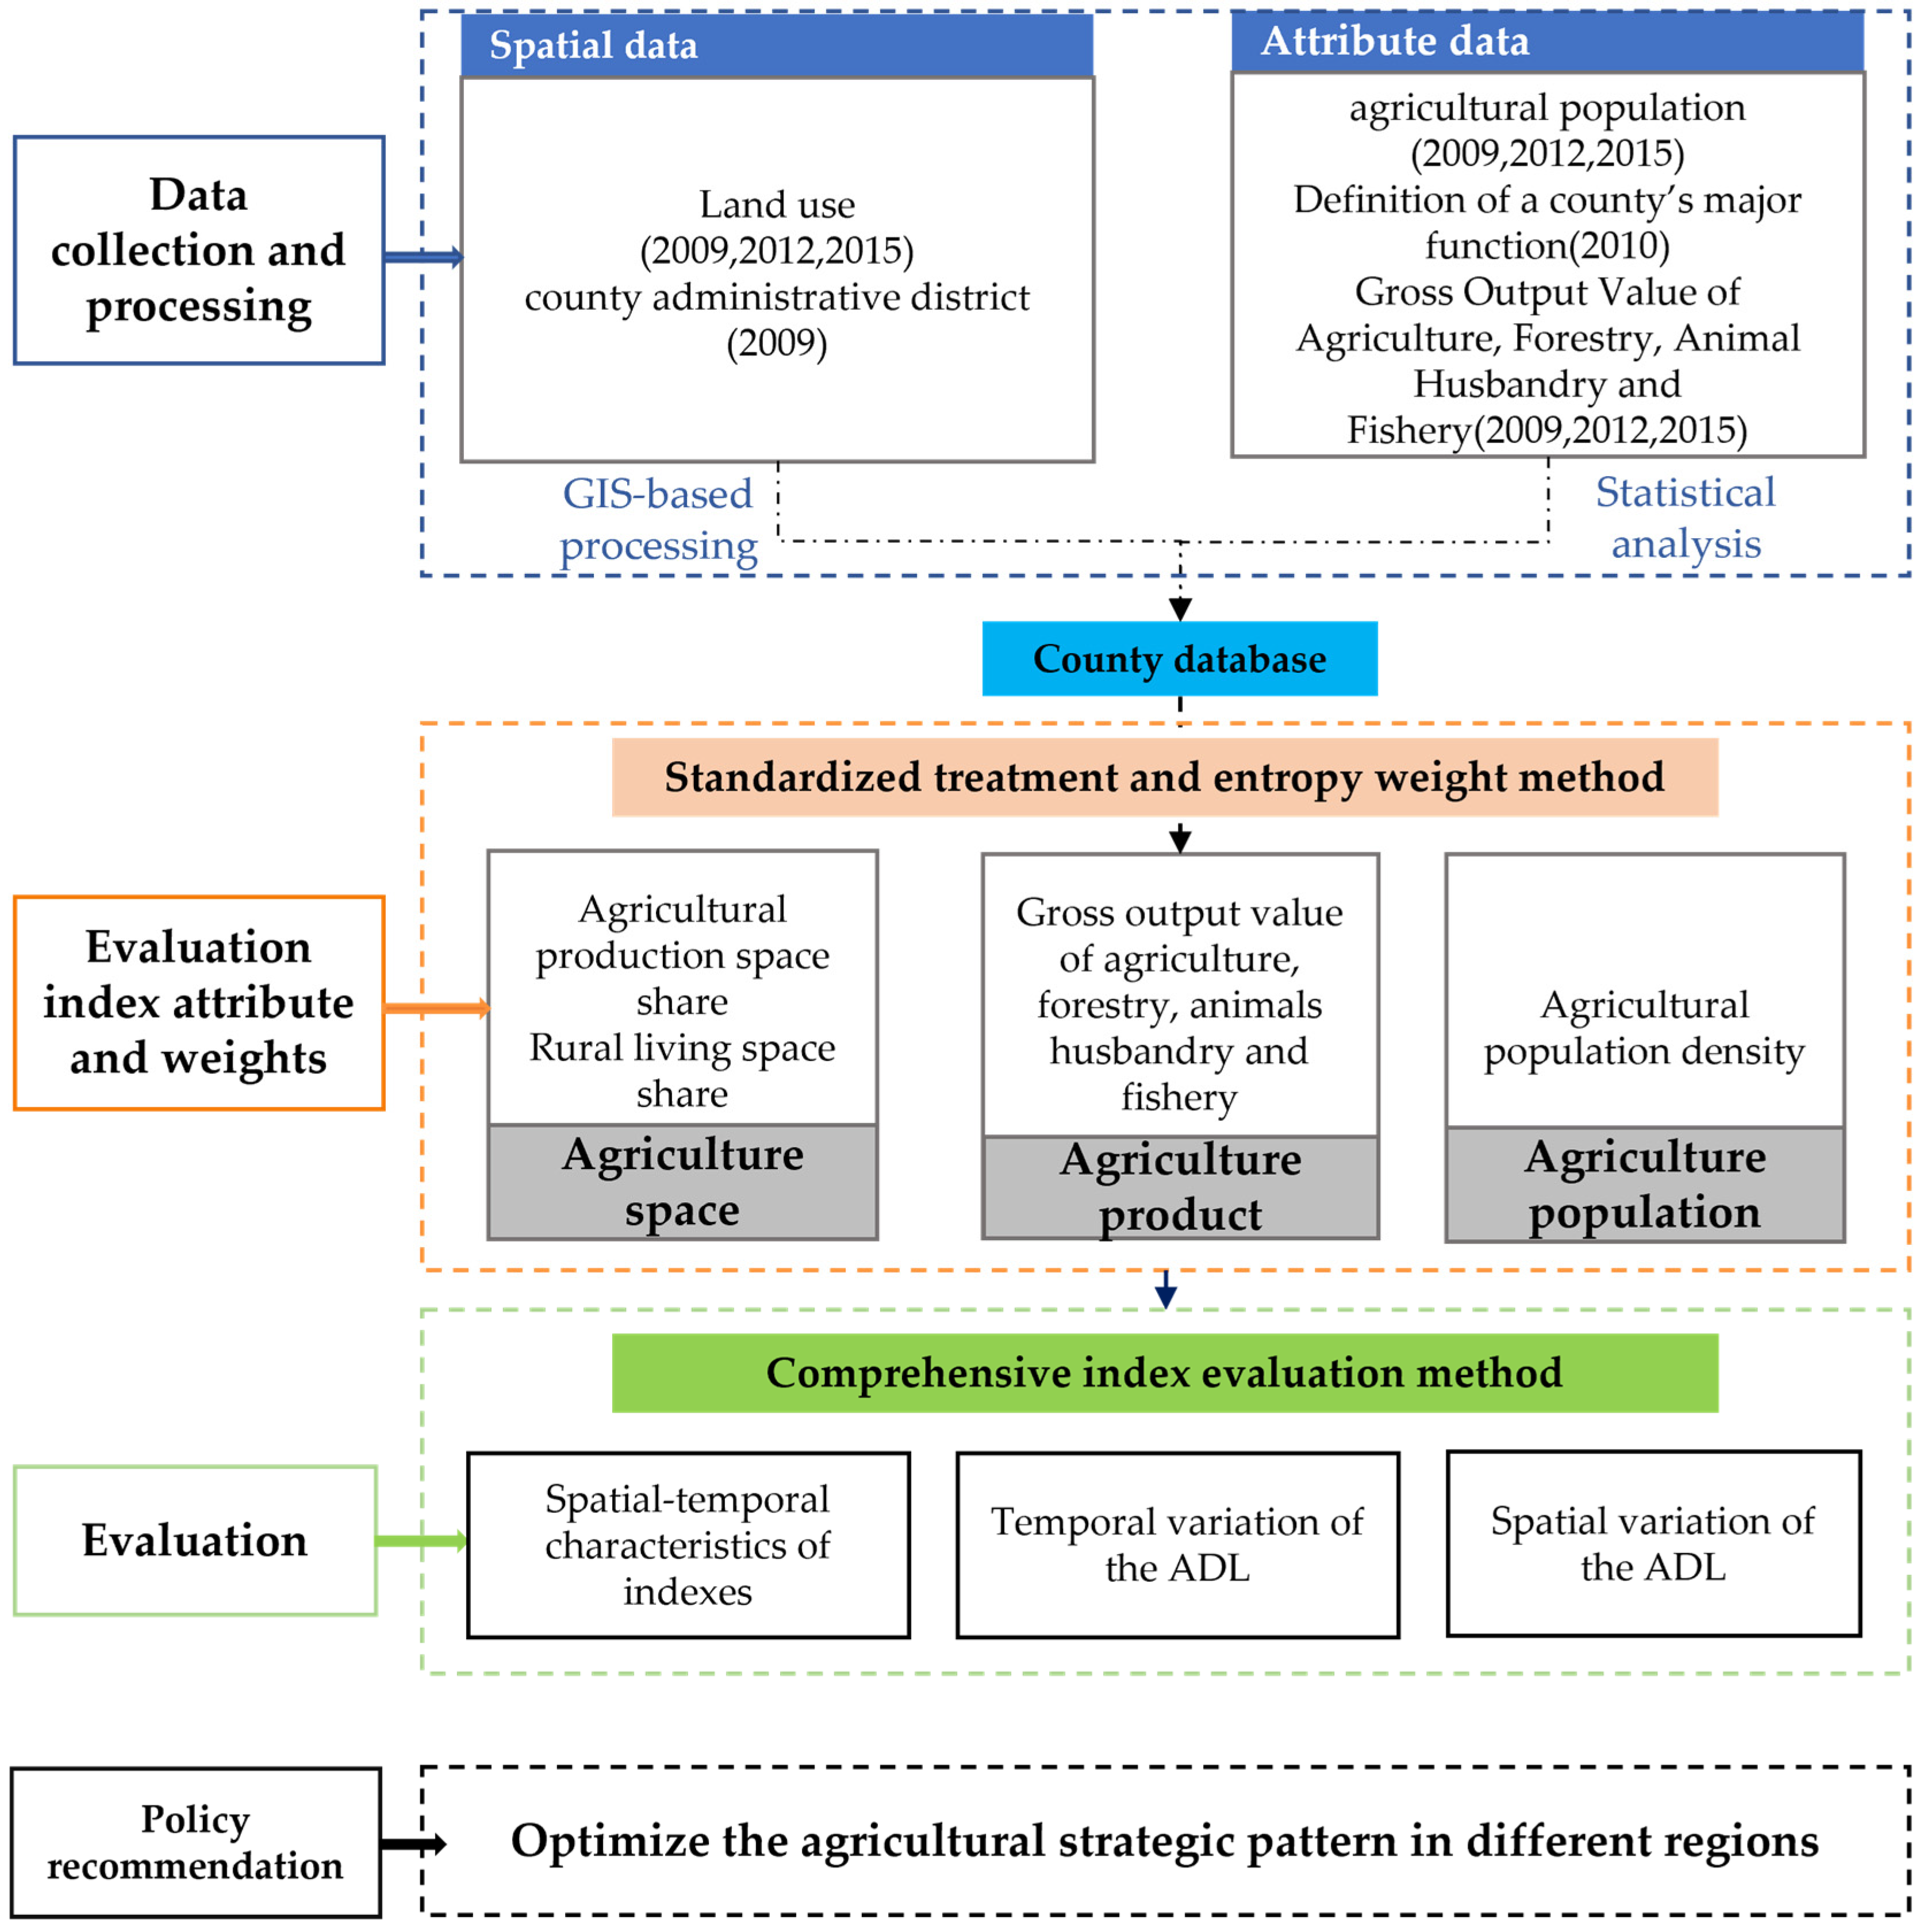
Therefore, the purpose of this study is to develop an indicator system suitable for assessing agricultural development levels within counties across the country based on the planning needs of major agricultural production areas, and to quantitatively assess the spatiotemporal changes in China’s agricultural development level before and after the implementation of MFAP (2010). We selected 2009 as the time point before the implementation of MFAP and 2012 and 2015 as the time points after the implementation as the study time frame, using the entropy weight method and comprehensive indicator evaluation method to estimate the evolution of agricultural development levels during this period and adequately reveal regional disparities in agricultural development and directly inform decision making in MFAP and sustainable development in developing countries. The specific objectives were: (1) to establish a clear and concise quantitative assessment index system with actionable data for evaluating the ADL at the county level; (2) to assess the spatial and temporal changes in the ADL from 2009 to 2015 in China; (3) to compare the multi-scale regional disparities in the ADL from 2009 to 2015; and (4) to propose policy recommendations for further agricultural development and spatial management.
3. Results
3.1. Spatial–Temporal Characteristics of Third-Level Indexes
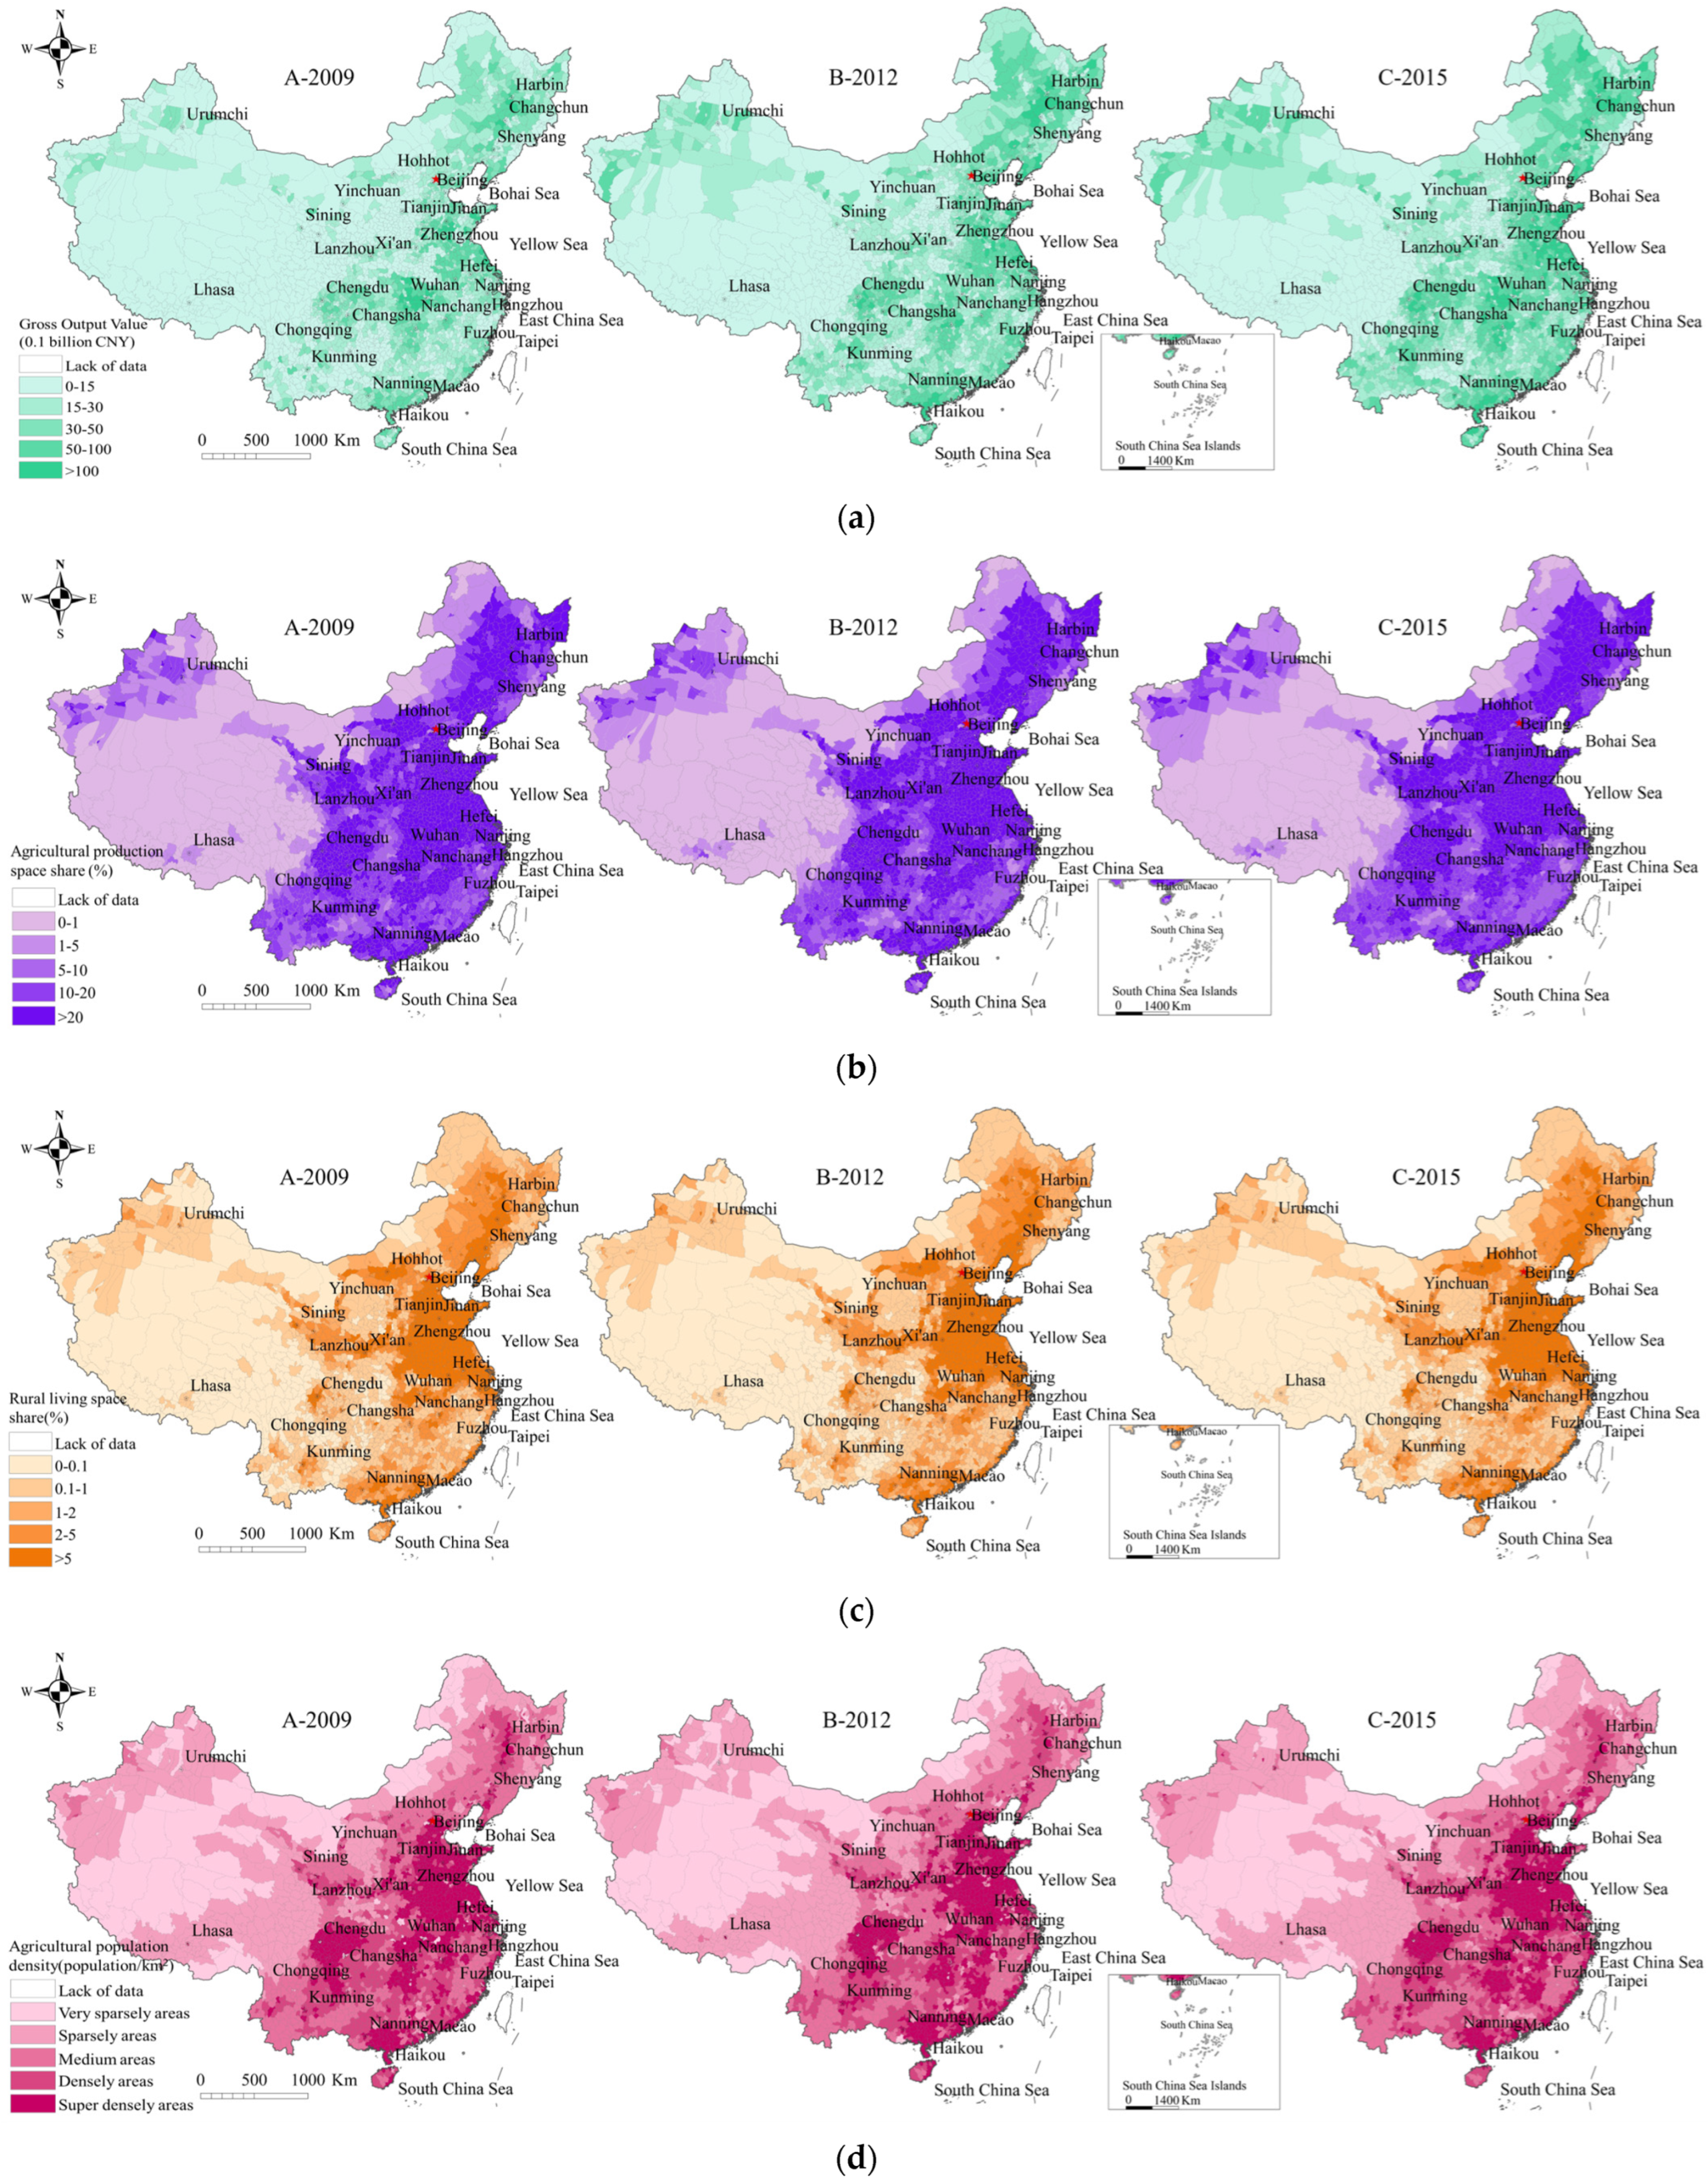
The third-level indexes, which directly contribute to the calculation of the agricultural development level of each district and county, have a significant impact on the final evaluation results of the agricultural development level. From 2009 to 2015, the spatiotemporal changes in four tertiary indicators (total output value of agriculture, forestry, animal husbandry and fisheries; agricultural production space; rural living area; and agricultural population density) are depicted in
Figure 3.
Spatially, counties with a total output value of agriculture, forestry, animal husbandry, and fisheries exceeding CNY 5 billion were mainly concentrated in the central and eastern regions. From 2009 to 2015, the number of counties with a total output value exceeding CNY 5 billion increased from 8.59% to 17.43%. In 2015, there was a significant decrease in the number of counties with a total output value of less than CNY 1.5 billion, with a decrease rate of 21.19% (
Figure 3a). Counties with an agricultural production area of more than 10% were mainly distributed in the central, eastern, and northeastern regions. In 2015, the number of counties with more than 10% of the regional agricultural production area remained at 2303, accounting for 80.79% of the total number of counties in the country, an increase of 0.4% from 2294 in 2009 (
Figure 3b). Both the total output value of agriculture, forestry, animal husbandry, fisheries, and the proportion of agricultural production space played a positive role in reflecting the level of agricultural development. Meanwhile, counties with a relatively sparse rural living area (less than 0.1%) and agricultural population density (sparser areas) were scattered in the northern and western regions. In comparison to 2009, the overall trend of sparse-density rural living space (less than 0.1%) and agricultural population areas in 2015 was relatively stable, with only 1.58% and 1.96% decreases, respectively. The counties with high-density rural living space and agricultural population were mainly distributed in the main producing areas of the Yangtze River Basin and the Huang-Huai-Hai Plain in the eastern and central regions (
Figure 3c,d).
3.2. Temporal Variation of the ADL
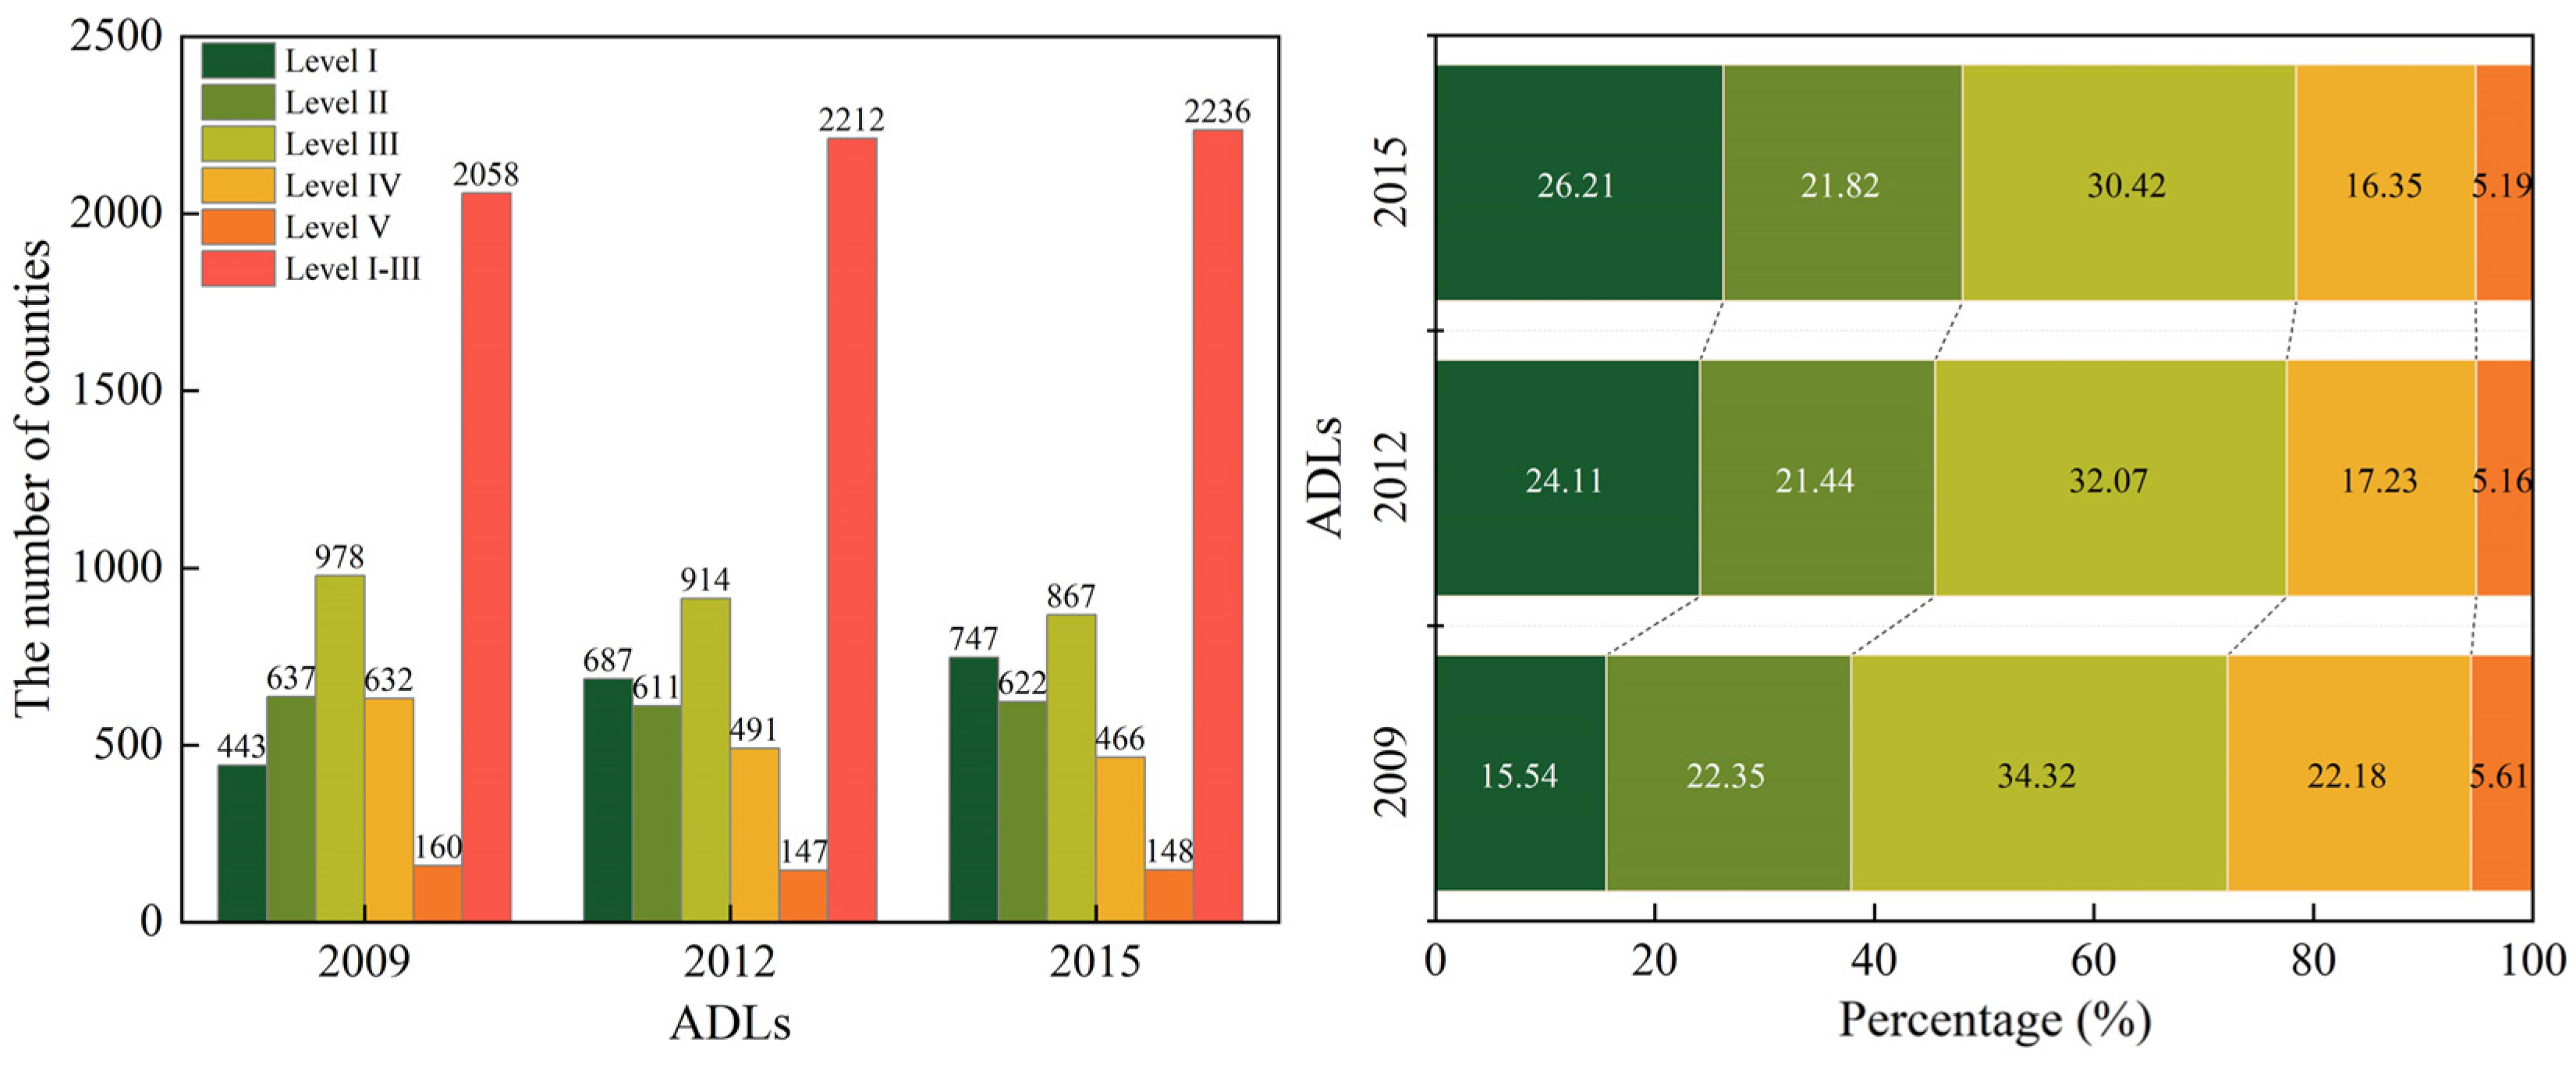
3.2.1. ADL at the National Level
Based on the results of the three levels of indicators, attributes, and weights, we calculated the ADL of China by using the comprehensive evaluation method between 2009 and 2015, and the results are shown in
Figure 4. In general, the agricultural development level of China’s counties increased significantly from 2009 to 2012 and steadily from 2012 to 2015. In 2009, the number of counties with a higher agricultural development level was 2058, accounting for 72.21% of the total number of counties nationwide. In 2015, the number of counties with levels I-III rose to 2236, accounting for 78.46% of the total number of counties nationwide, an increase of 6.25% compared to 2009. Conversely, the number of counties with low agricultural development levels showed a significant decrease followed by a slow decrease; in particular, the number of counties with level IV decreased by 166 from 2009 to 2015, a decrease of 5.83% compared to 2009 (
Table S2). The results during the study period indicate that the implementation of the plan has positively contributed to the agricultural development of most counties in China.
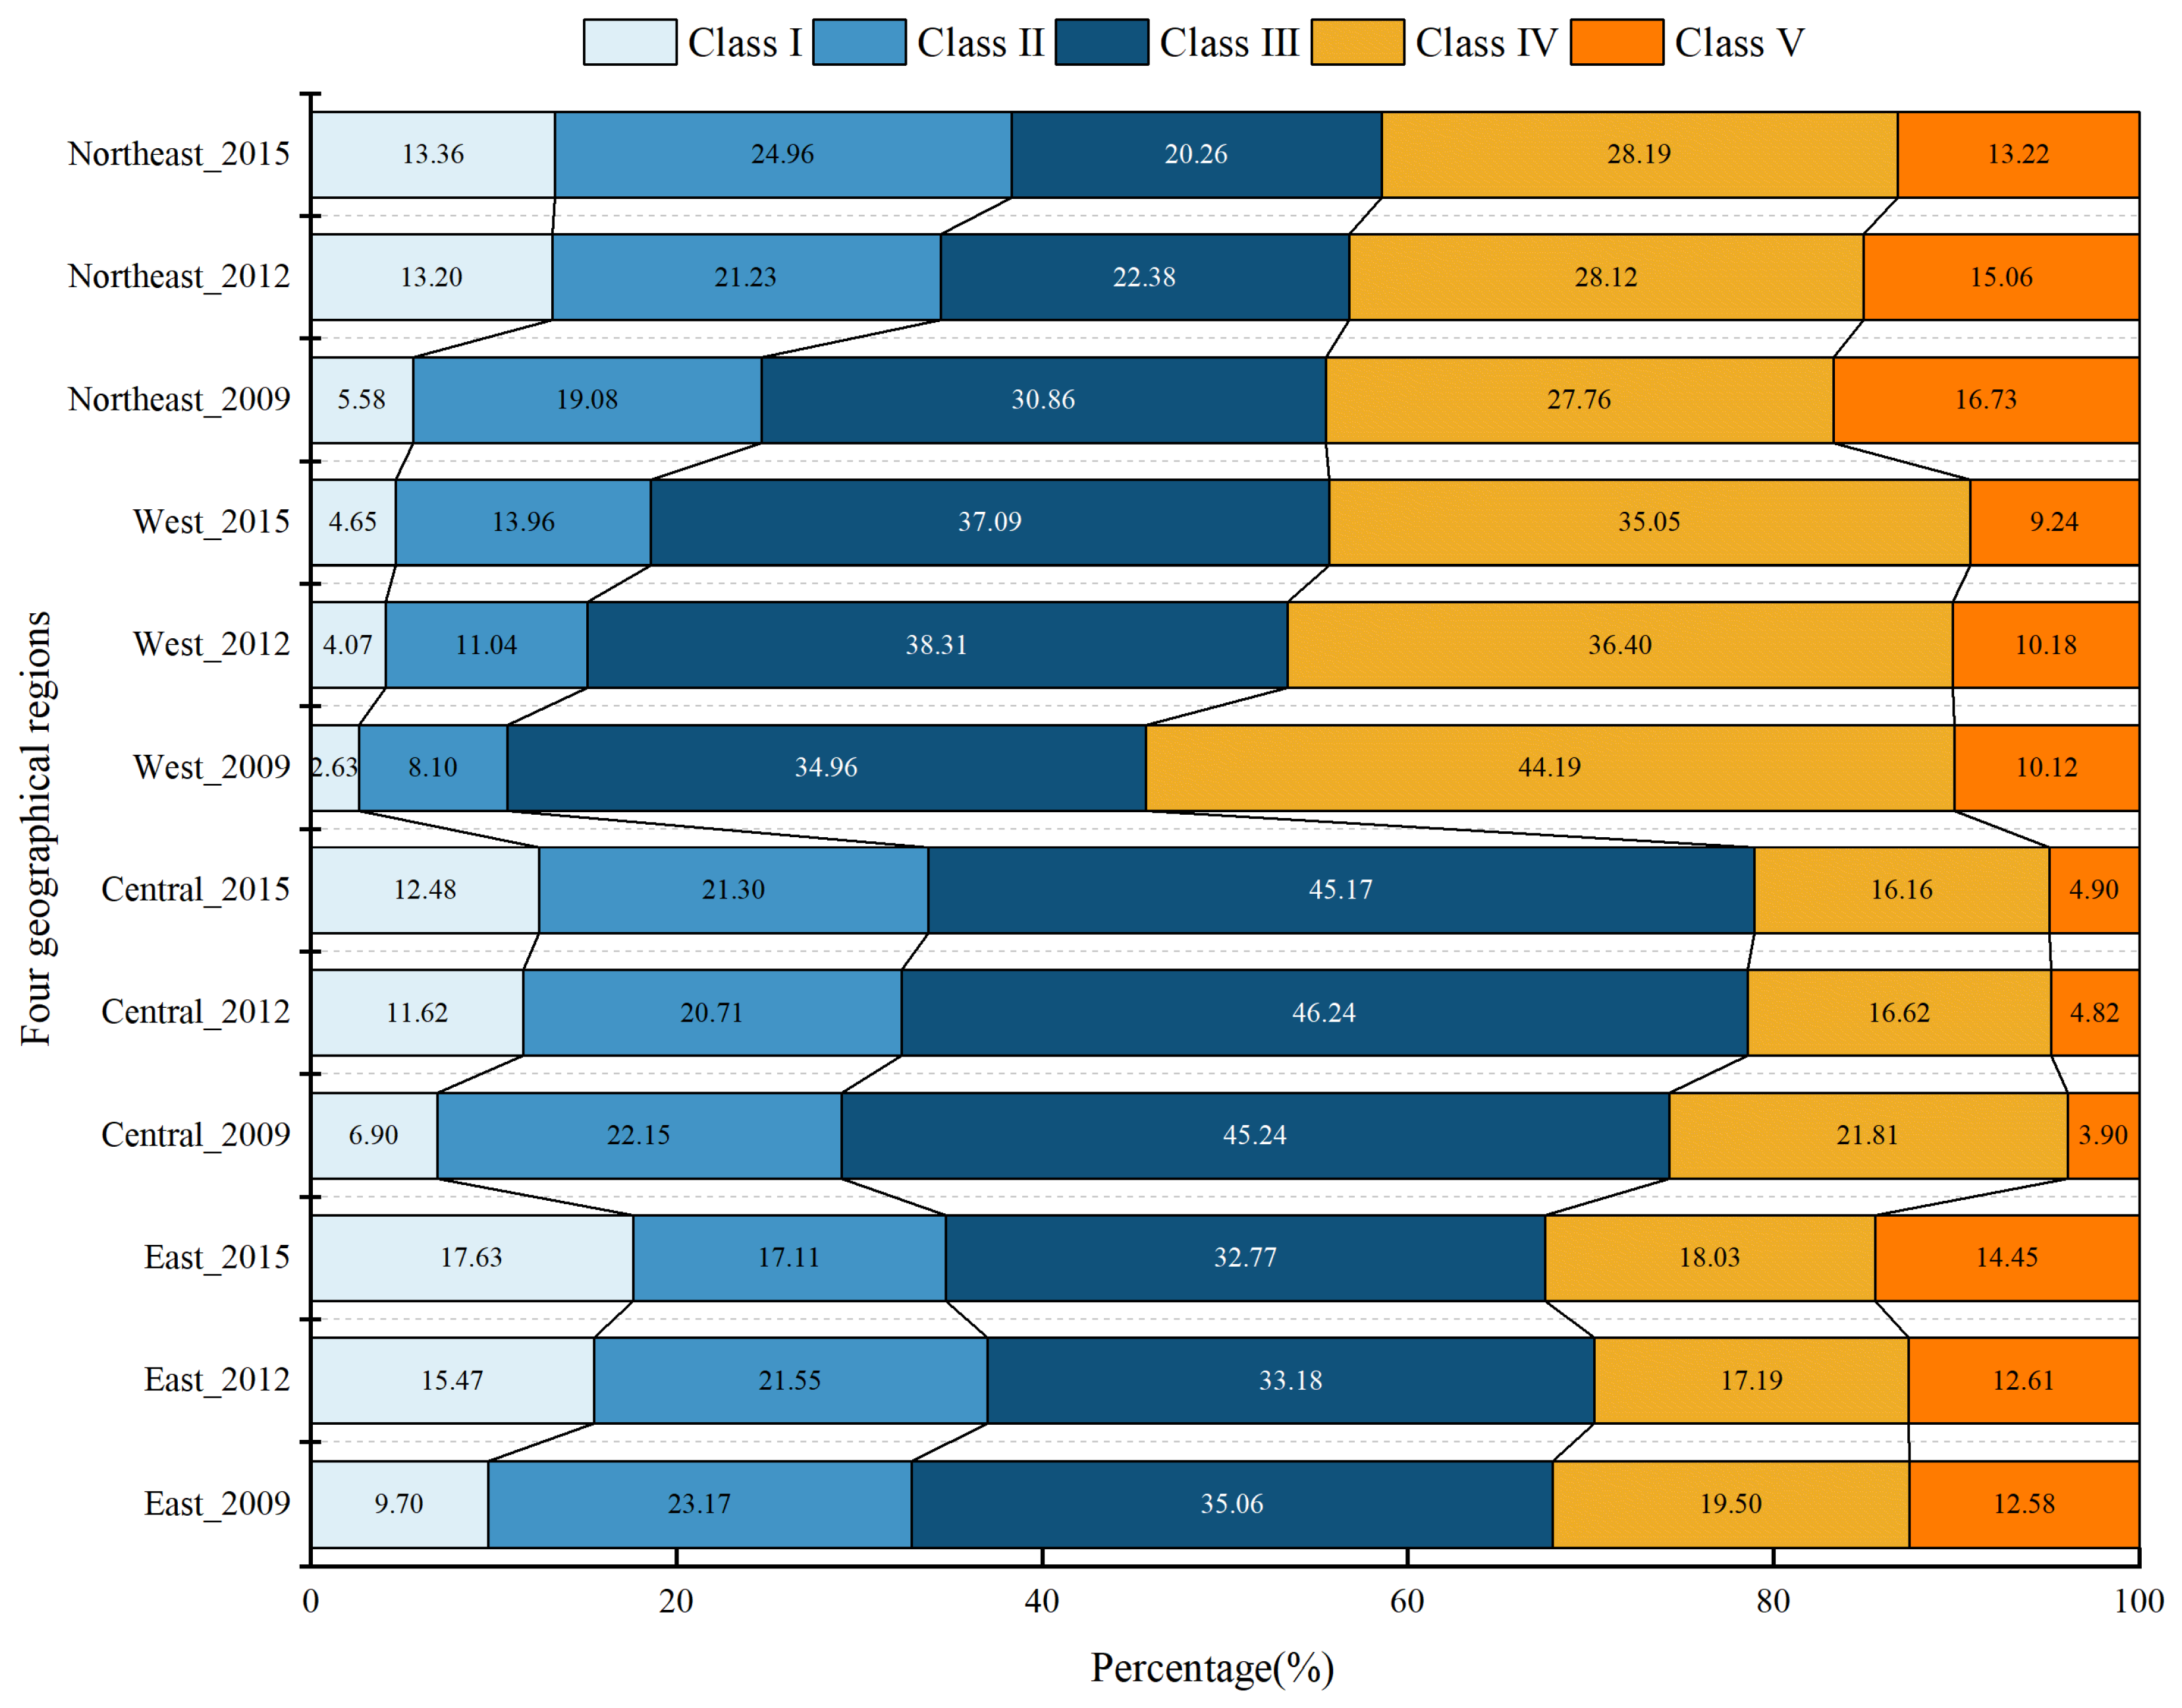
3.2.2. ADL at the Regional Level
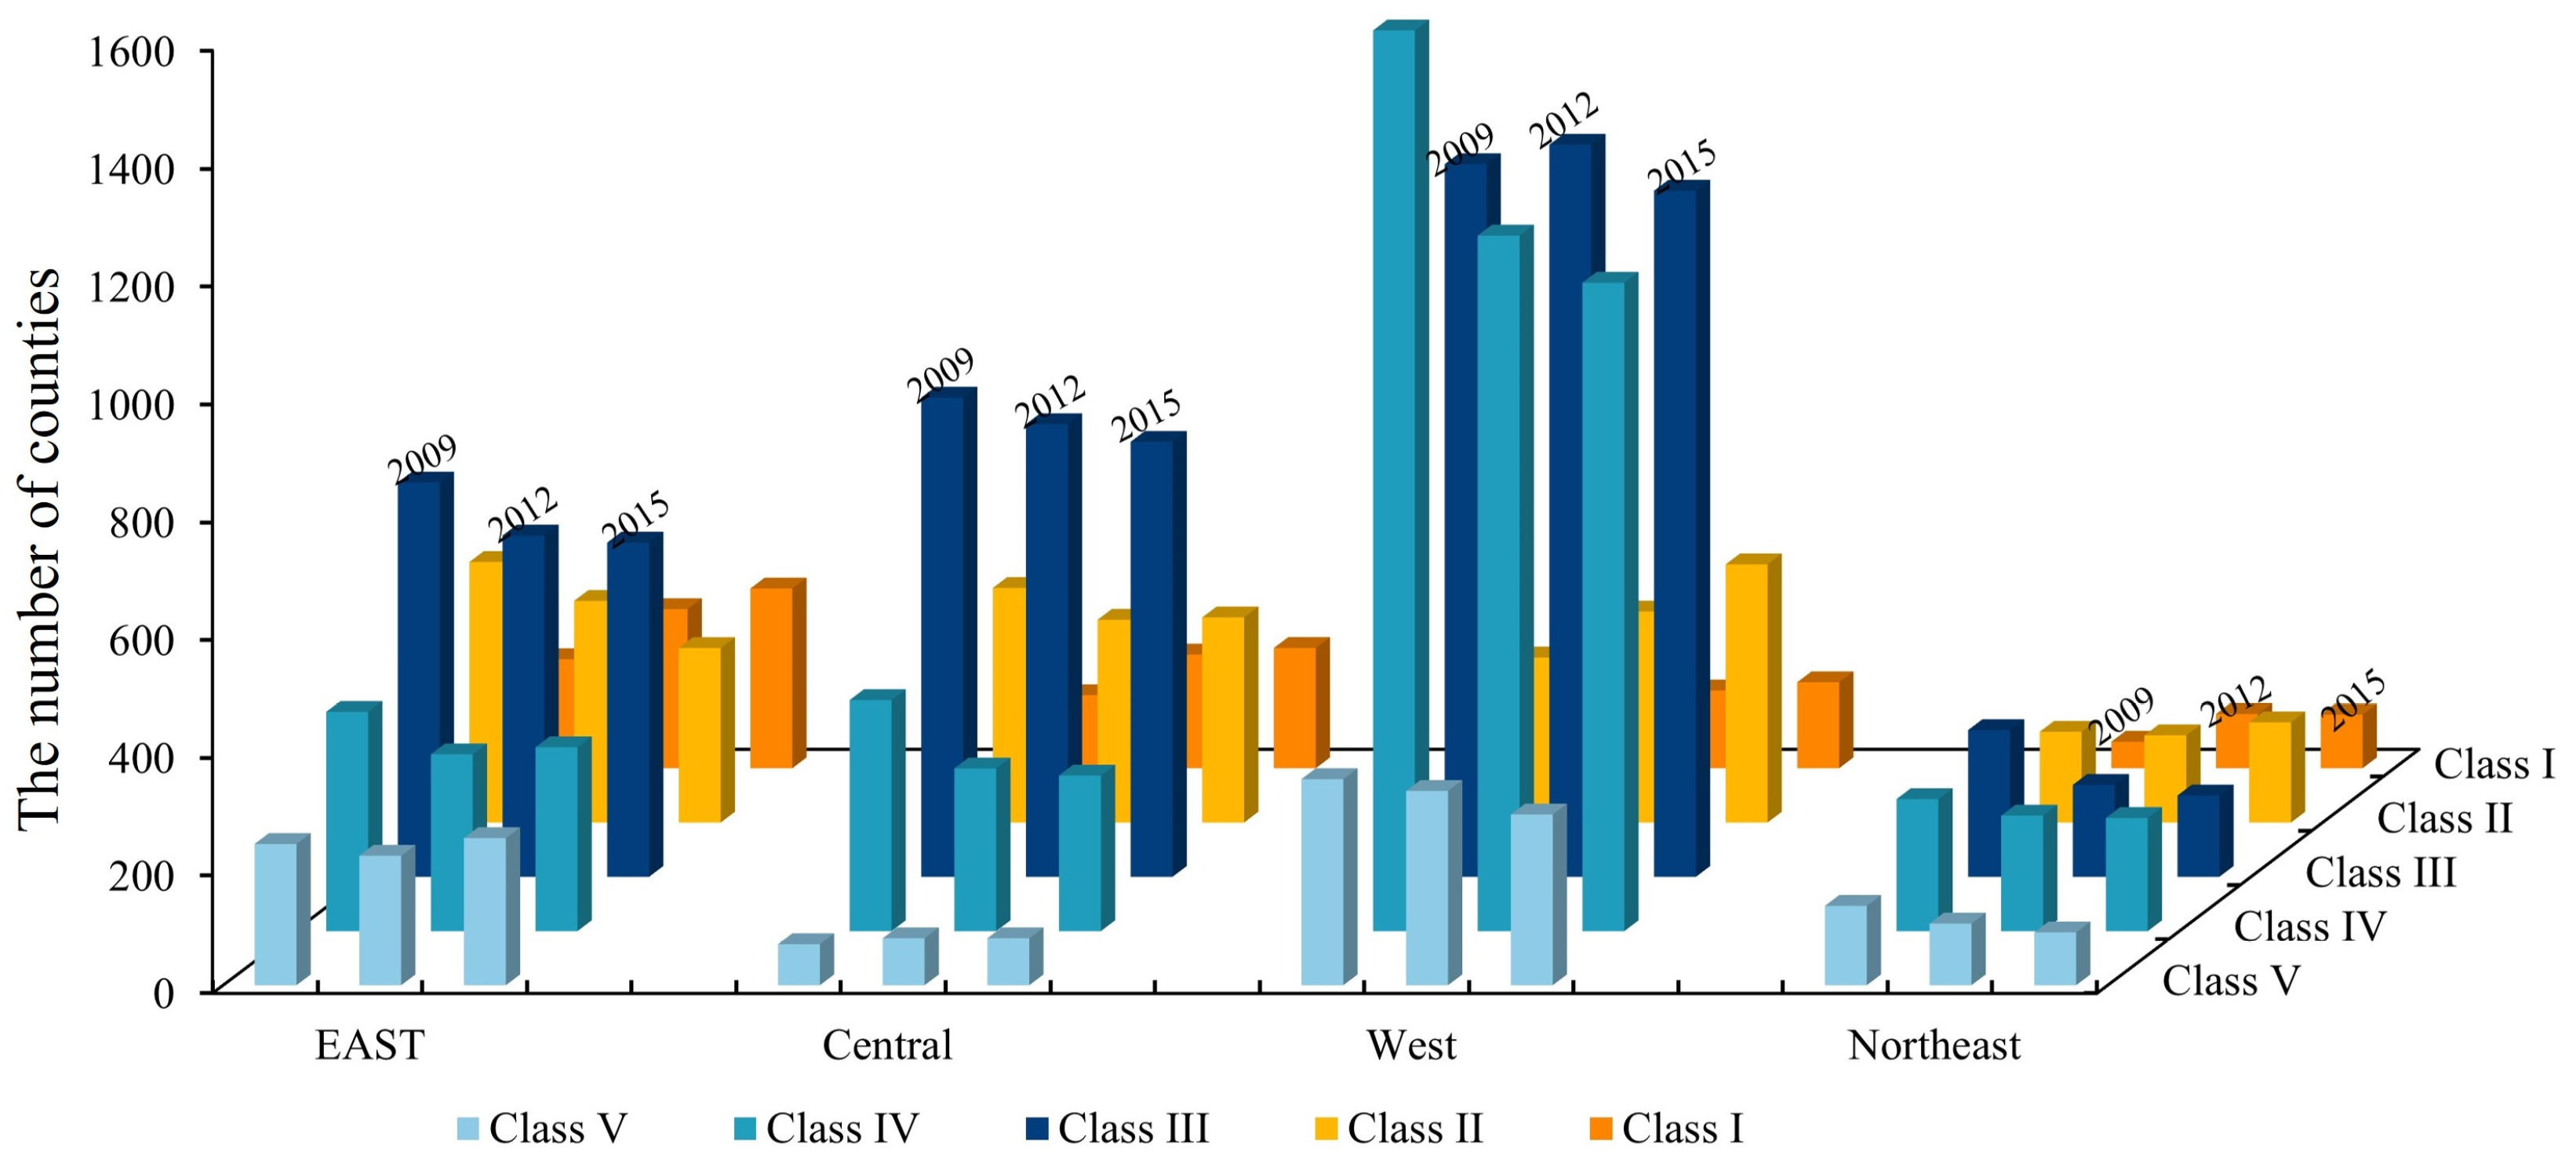
Agricultural development levels exhibited a positive trend in the western, central, and northeastern regions of China spanning from 2009 to 2015 according to
Figure 5 and
Figure 6. However, progress in the eastern region remained stagnant.
In the eastern region, the number of counties with a high level of agricultural development was 1296 in 2009, accounting for 67.92% of the total number of counties in the eastern region. In 2012, 70.2% of counties showed a high level of agricultural development, which might be attributed to the conversion of 127.81 × 10
4 hectares of ecological land into urban and agricultural land in eastern China between 2009 and 2012 [
41], while the number of counties with a high level of agricultural development decreased by 57 in 2015. In the western region, the number of counties in the I-III category increased from 1580 in 2012 to 1748 in 2015, accounting for 55.7% of the total number of counties in the western region. In the central region, the proportion of counties with a high level of agricultural development was 78.95% in 2015, an increase of 4.66% compared to 2009. In the northeast region, the percentage of counties with a high level of agricultural development increased from 55.51% in 2009 to 58.59% (
Table S3). During the study period, the overall level of agricultural development in the four regions was in the order of central > east > northeast > west. This result aligned with a comprehensive evaluation of the level of agricultural modernization development in 31 provinces of China from 2001 to 2012, conducted using the entropy weight TOPSIS method [
42].
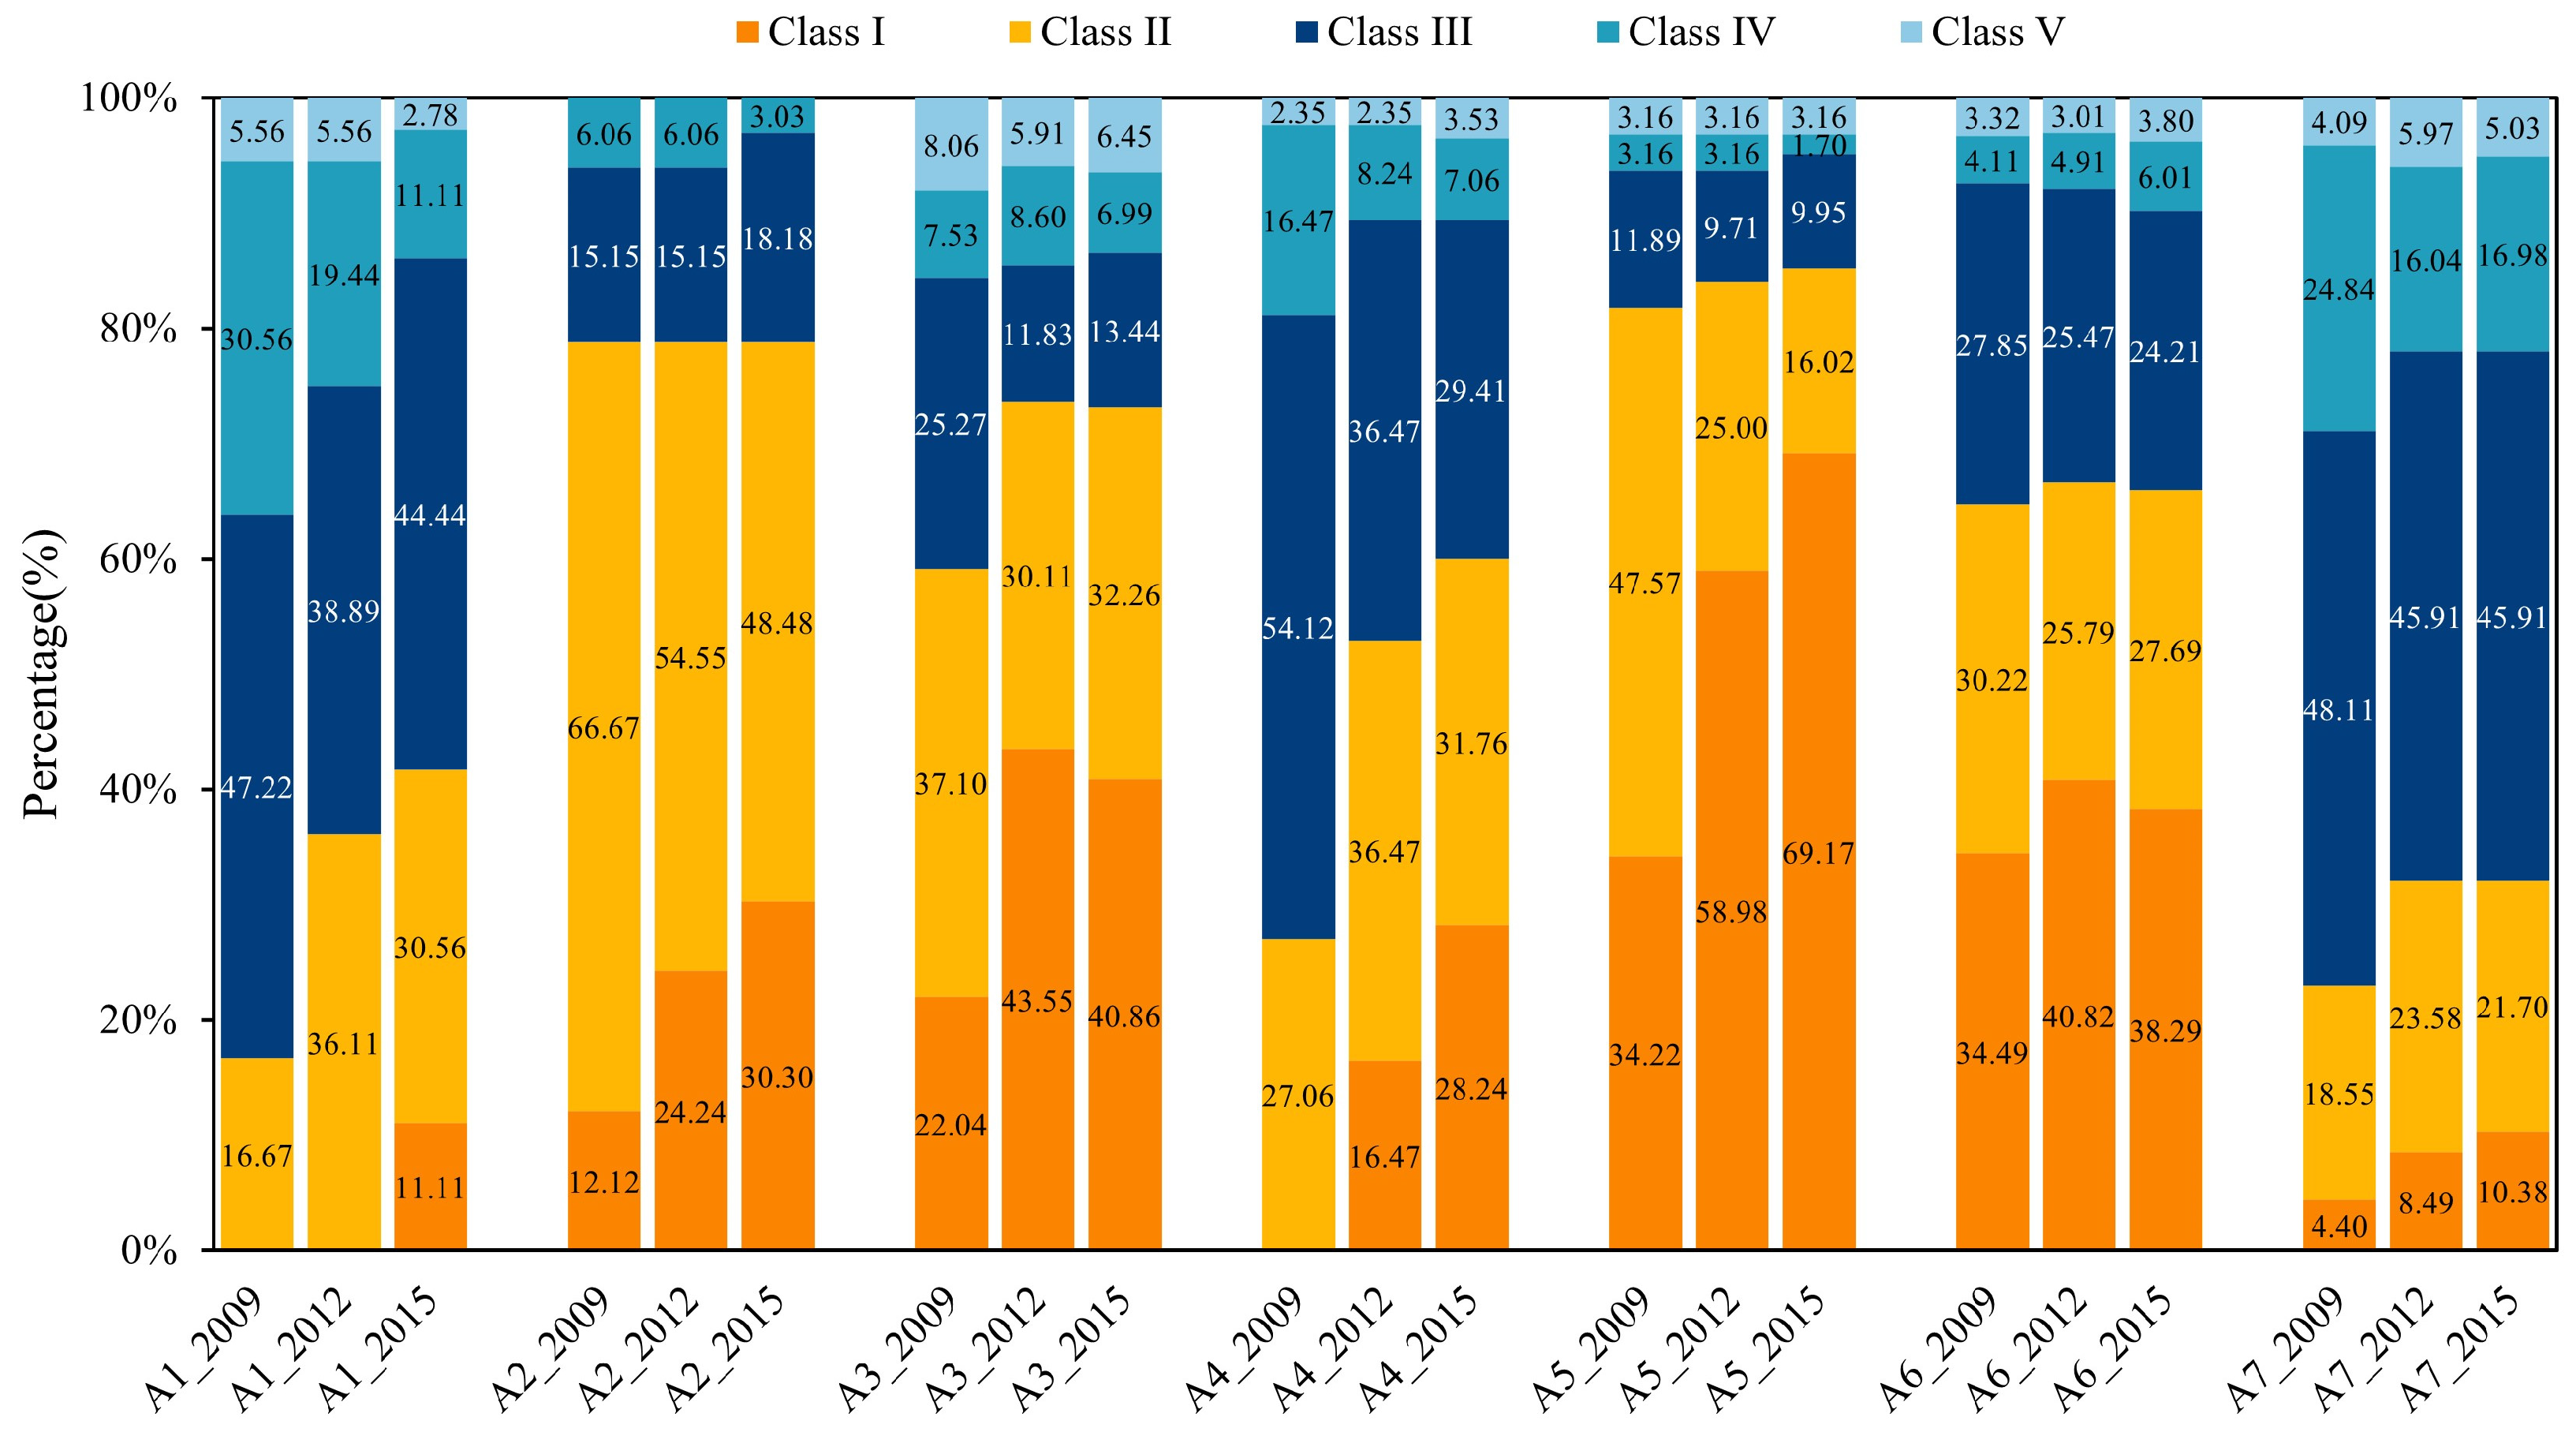
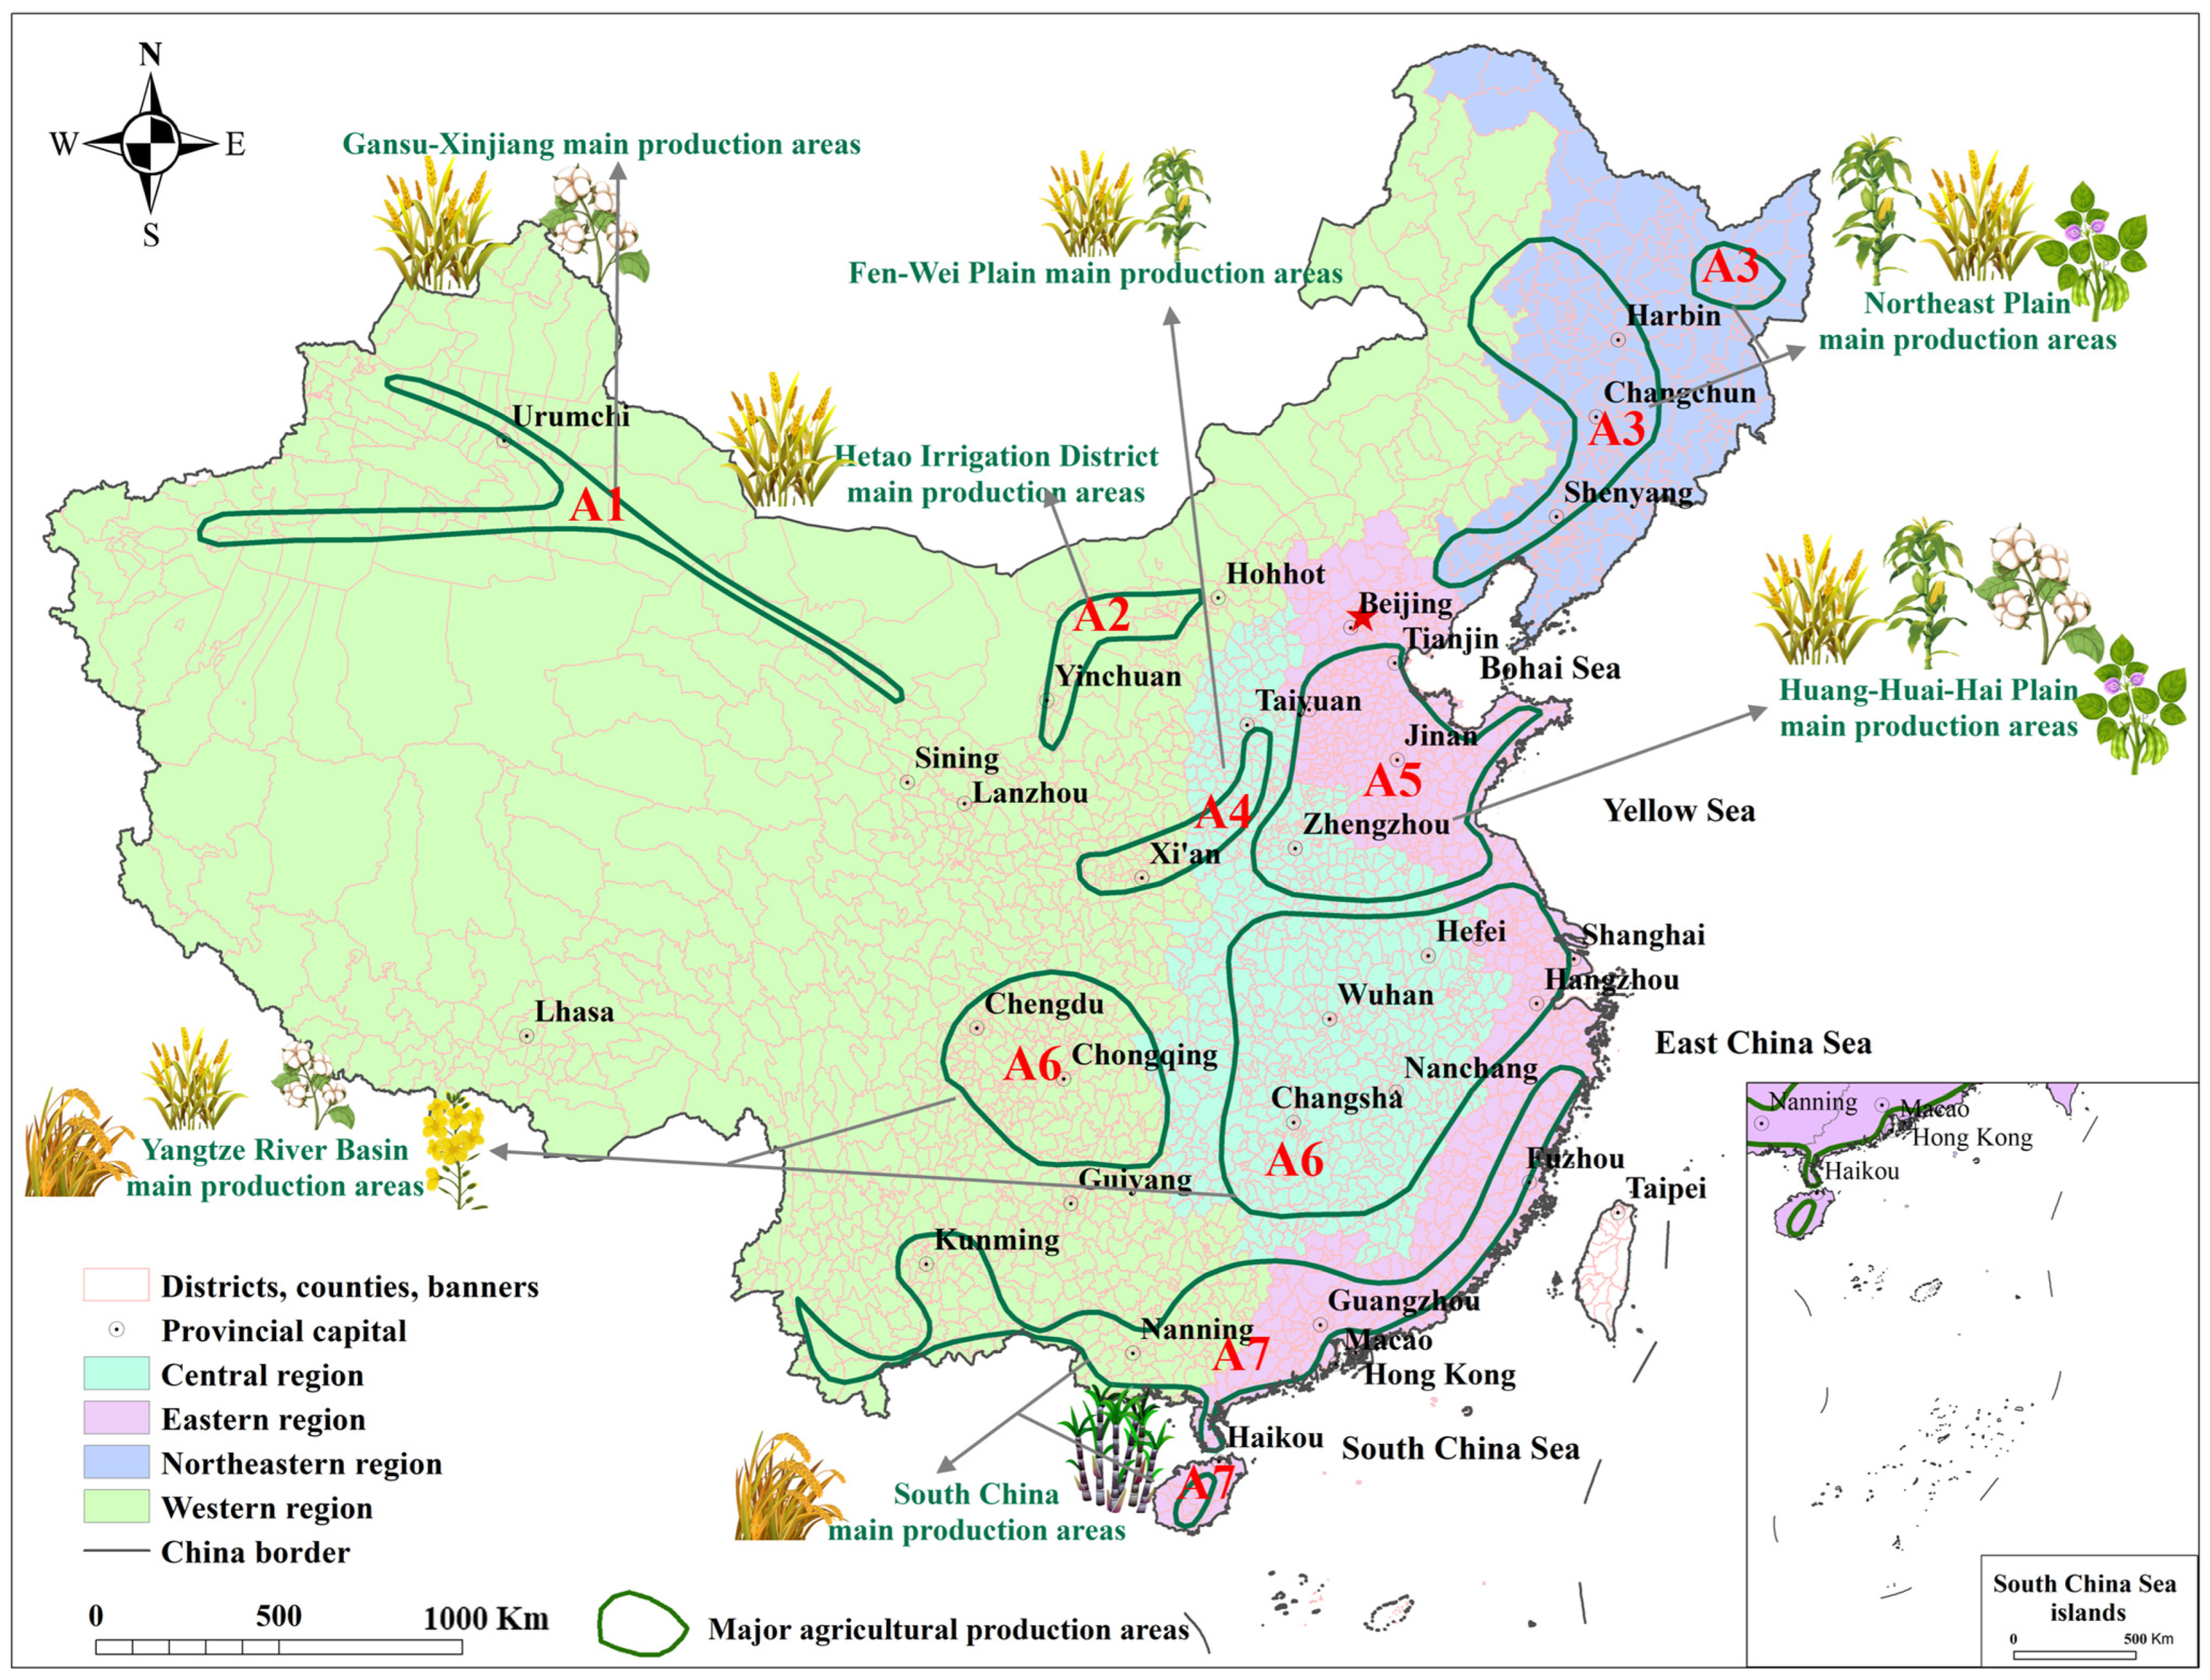
3.2.3. ADL in the Major Agricultural Production Areas
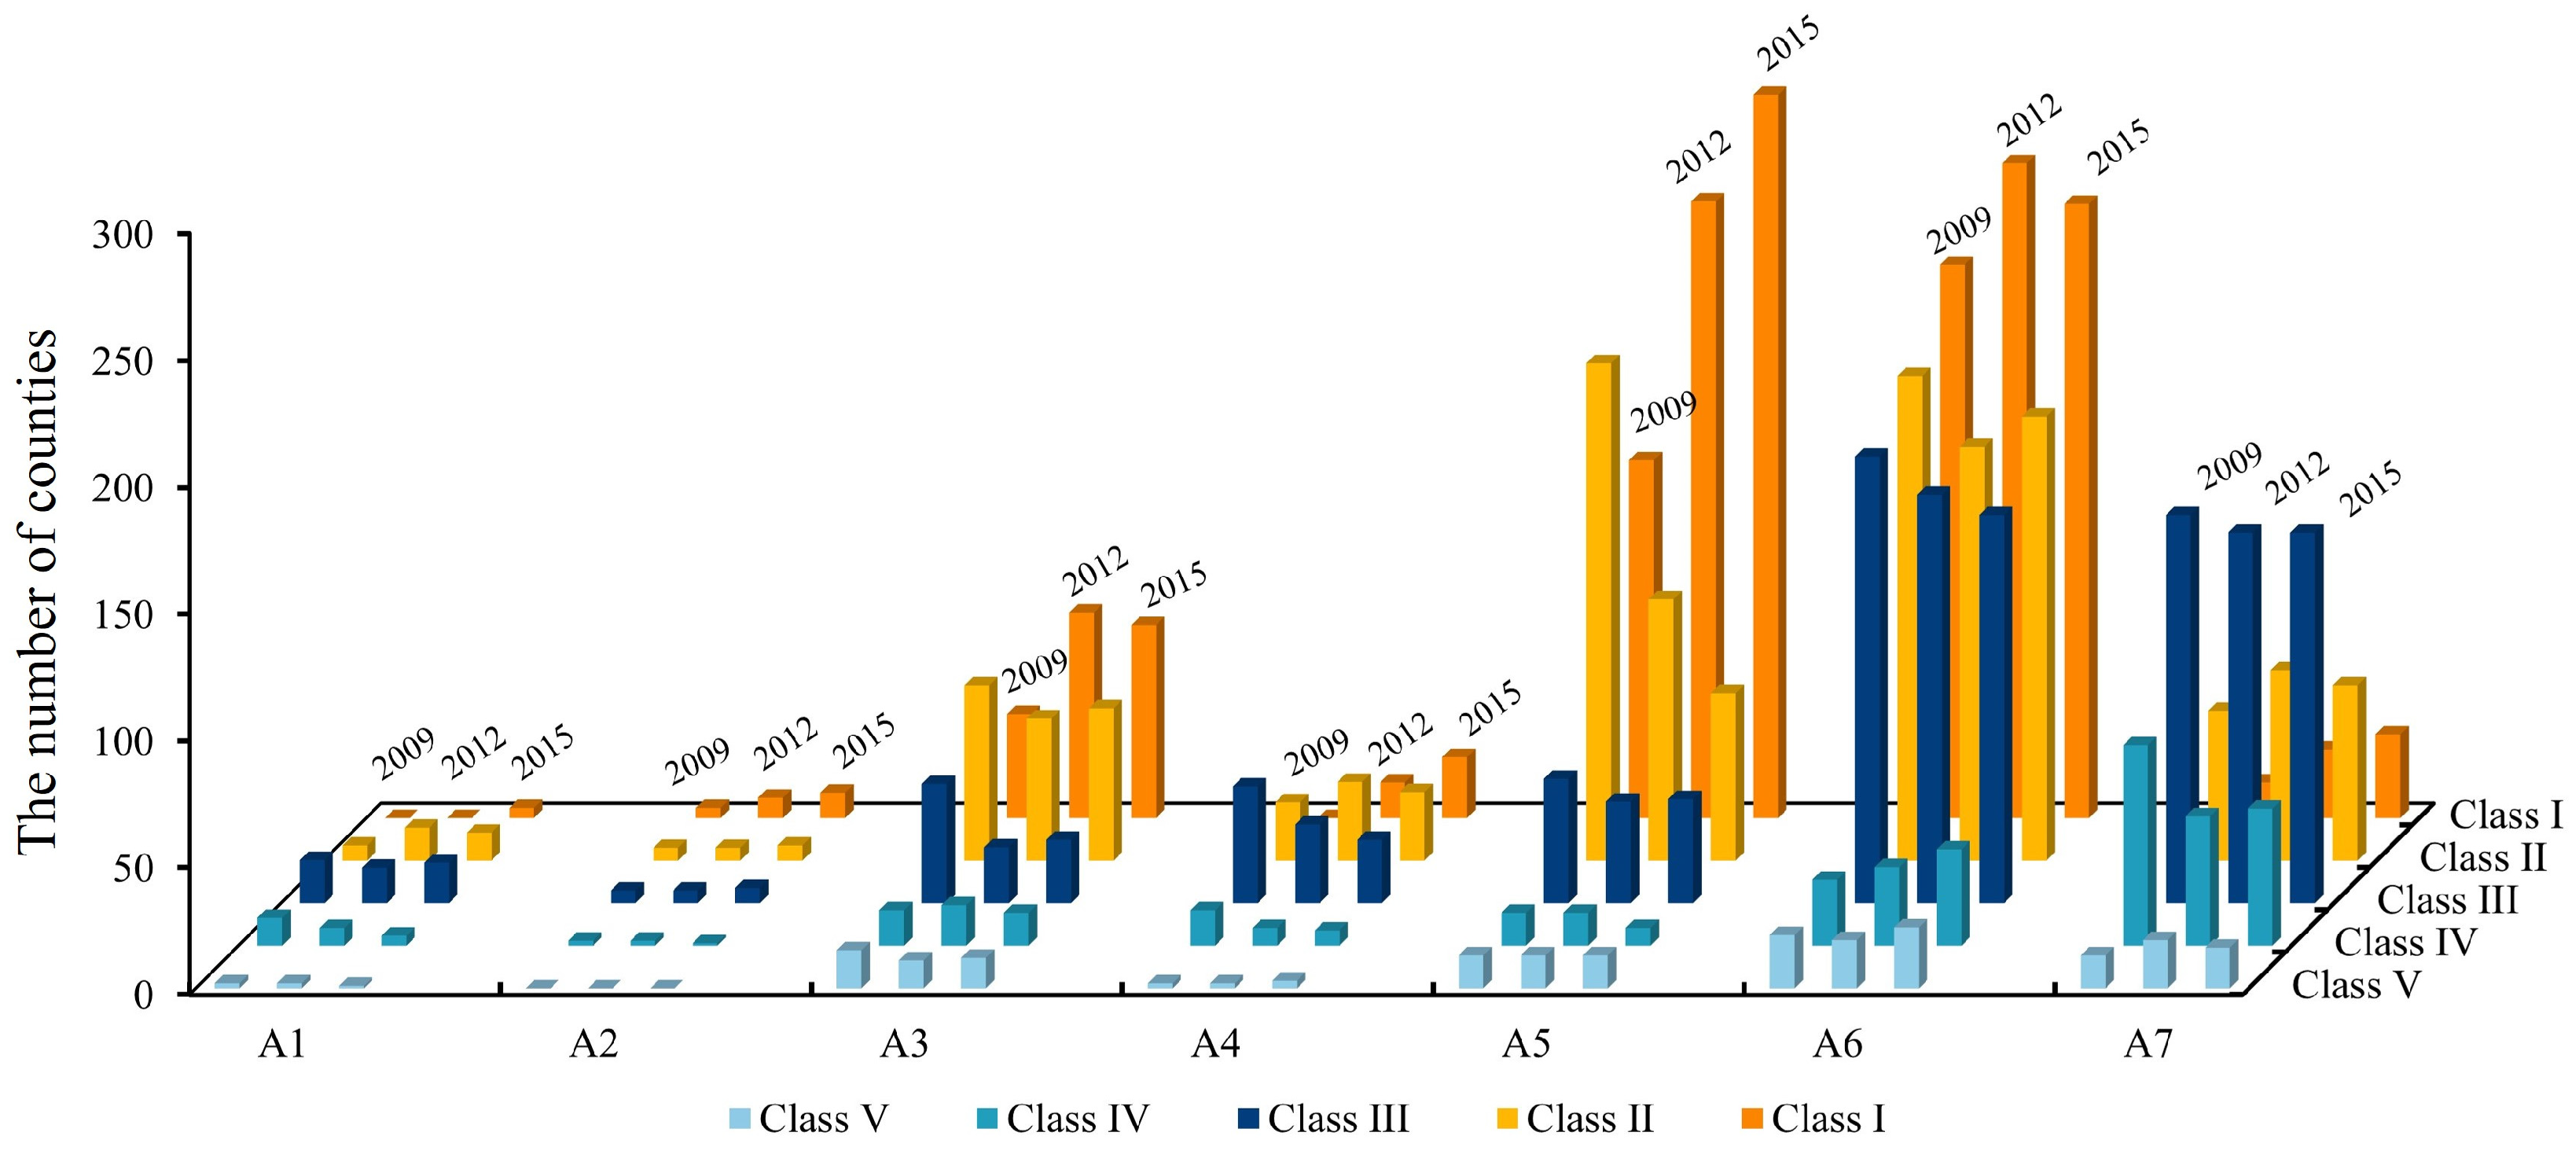
Figure 7 and
Figure 8 illustrate the changes in ADL in the major agricultural production areas from 2009 to 2015. Overall, the agricultural development in these key regions has maintained a consistently high level with minimal variation. The major agricultural production areas are focused on preserving arable land and pasture, improving the supply of agricultural products as a priority, and limiting strict large-scale and high-intensity industrialized urbanization development [
43,
44]. During the period from 2009 to 2015, there was a clear dominance of counties belonging to Classes I~III in terms of their ADL compared to those in Classes IV~V. In particular, the agricultural development level in A5 and A6 regions surpasses that of other major agricultural regions. In 2015, the proportions of Classes I~III in the agricultural development level of A1, A2, A3, A4, A5, A6, and A7 were 86.11%, 96.97%, 86.56%, 89.41%, 95.15%, 90.19%, and 77.99%, respectively. Comparing these figures to those of 2009, we observe that all regions, except for A6, demonstrated an increase in their agricultural development levels. The increments for Class I to Class III, in sequential order, were 22.22%, 3.03%, 2.15%, 8.23%, 1.46%, and 6.92%, respectively (
Table S4).
Counties categorized under Class I in agricultural development were predominantly concentrated in regions A5, A6, and A3. Regions A3, A5, A6, and A7 had a significant presence of Class II counties. Counties with class III were predominantly concentrated in regions A6 and A7. Conversely, counties characterized as Class IV were primarily distributed in region A7, while Class V counties were relatively scarce across all seven regions. These findings highlight the importance of recognizing spatial nuances and localized dynamics when formulating agricultural policies and strategies. Tailored approaches that focus on the unique characteristics and needs of each region can effectively promote sustainable agricultural development and enhance productivity across China’s diverse agricultural landscapes. The implementation of the MFAP has played a positive role in supporting the development of the main agricultural production areas, which are the main areas for ensuring the safety of national agricultural products.
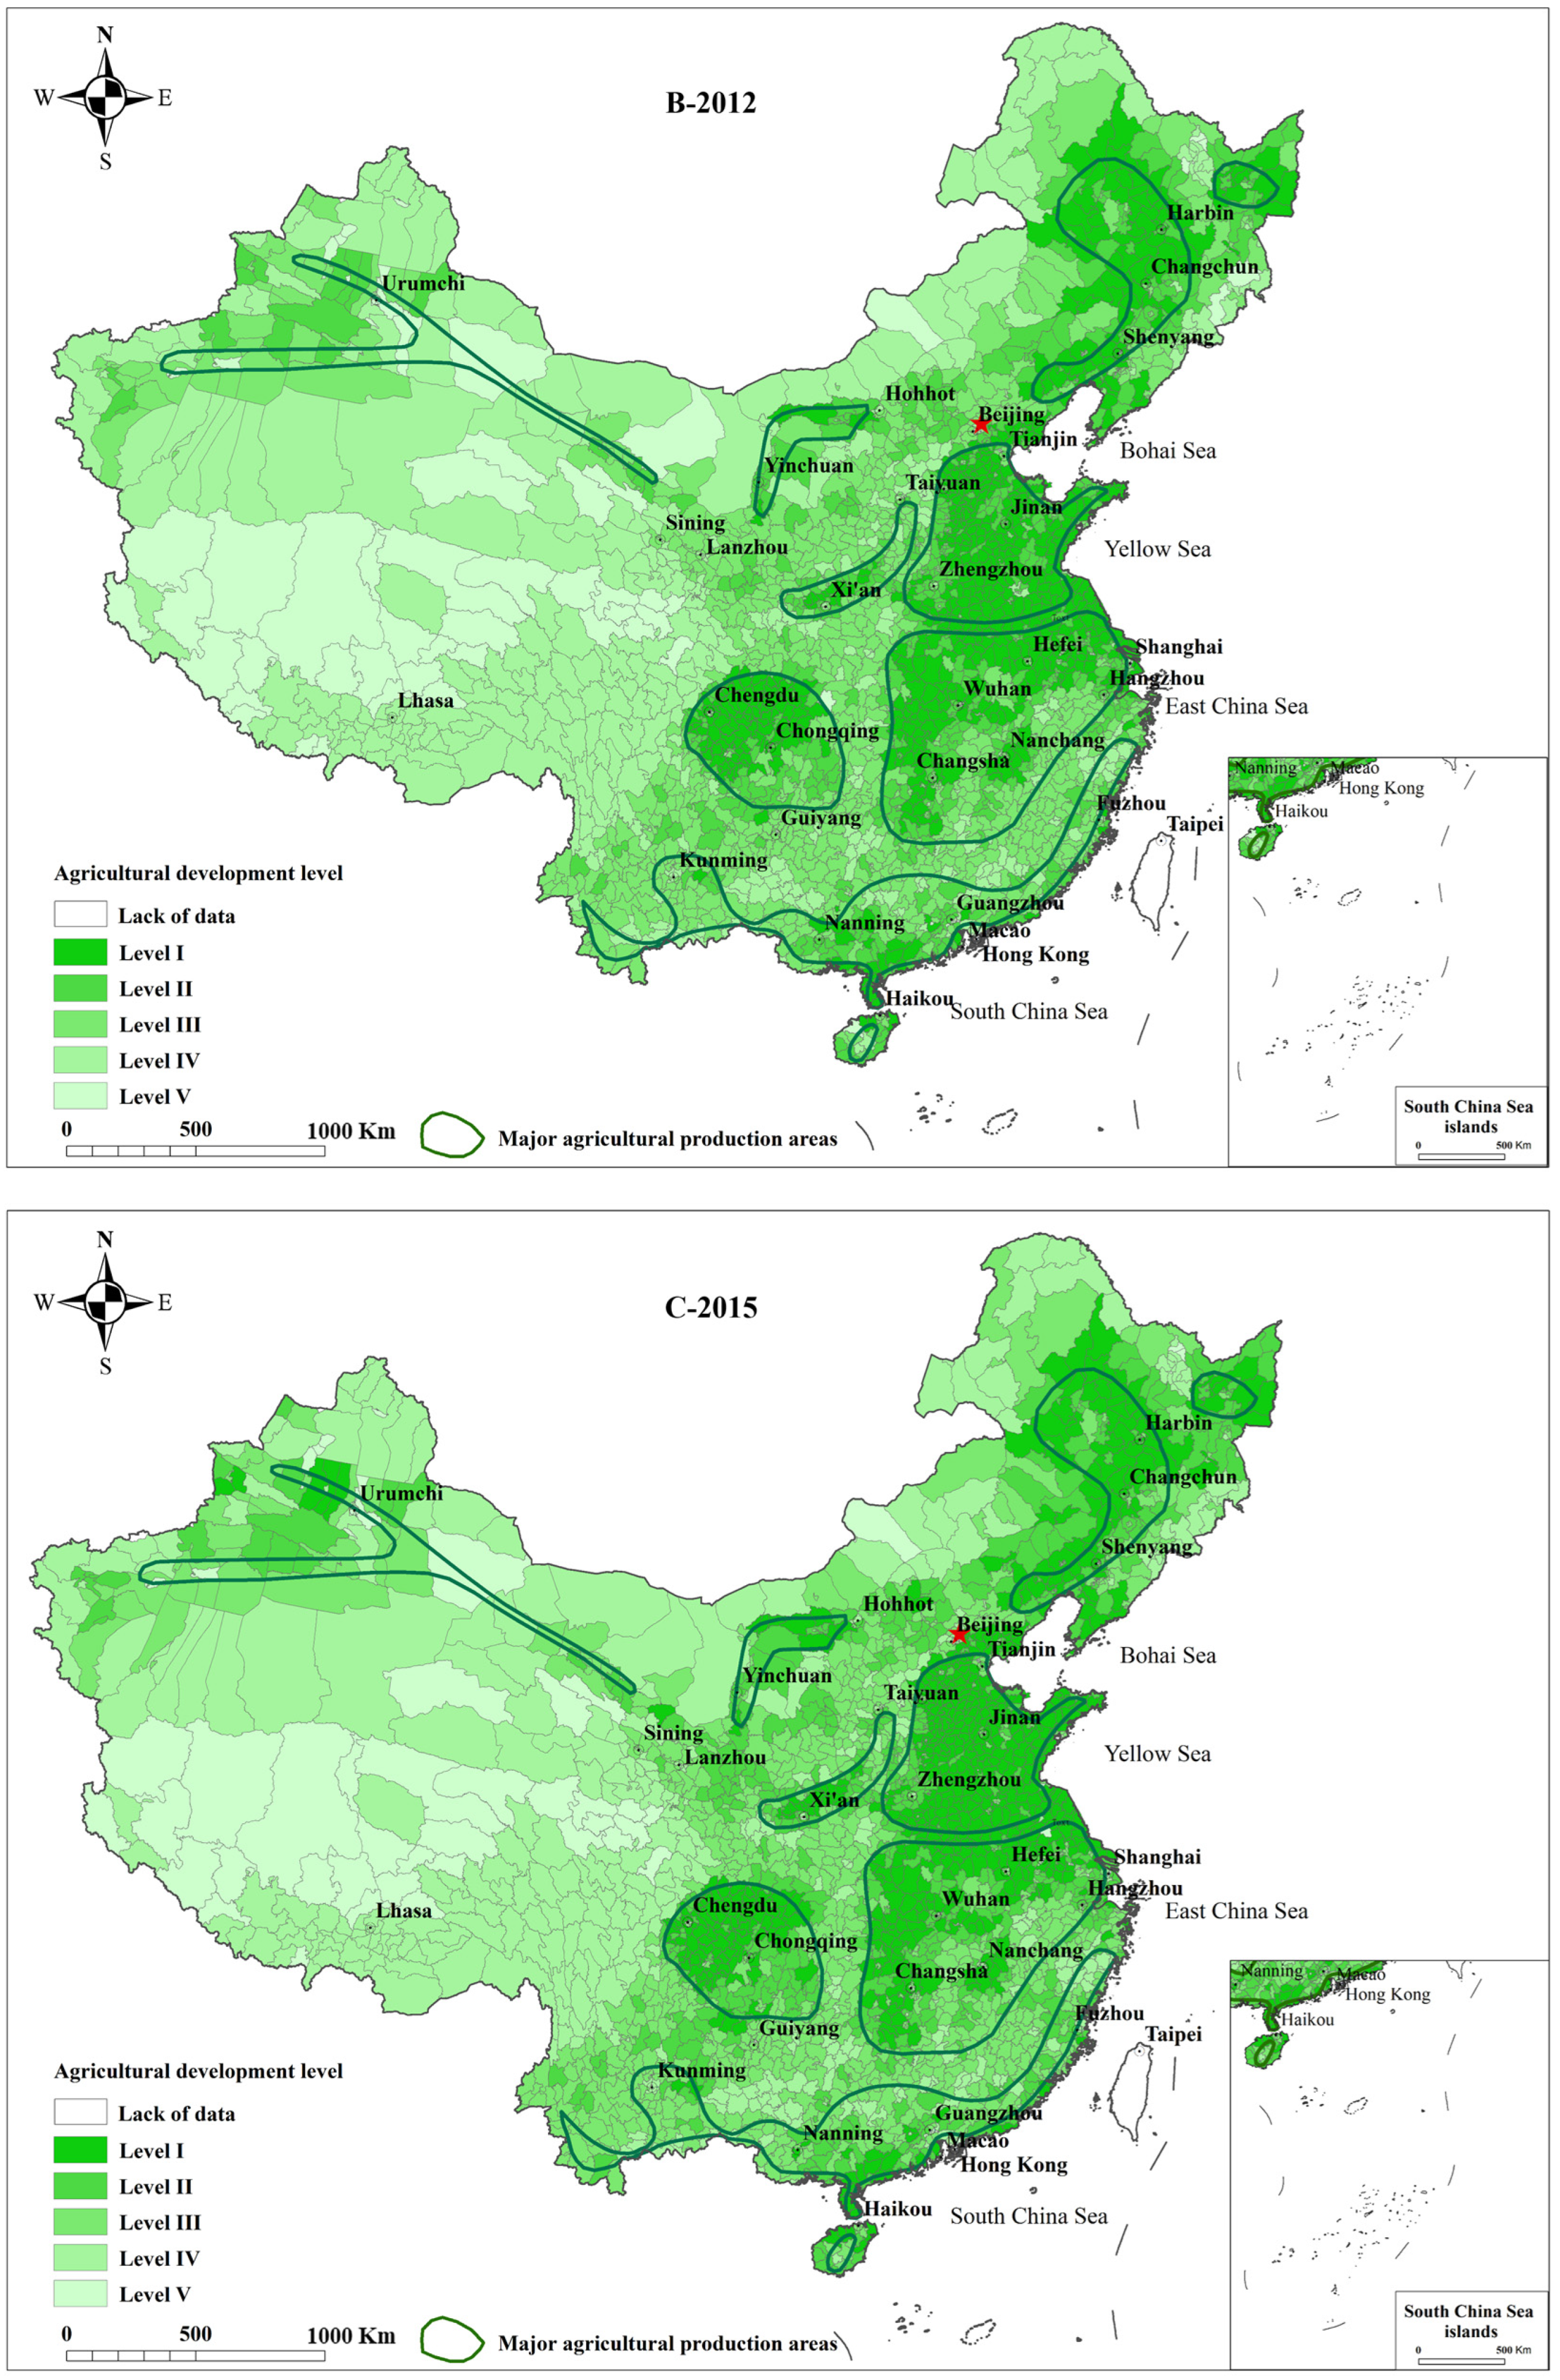
3.3. Spatial Variation of ADL at the National Level
The spatial changes in agricultural development level across 2850 counties in 31 provinces of China from 2009 to 2015 are depicted in
Figure 9. On the whole, during the study period, the level of agricultural development showed an upward trend, and the regional agricultural development level revealed spatial differences of high in the east and low in the west, high in the north and low in the south, which was divided into high-level areas with the Huang-Huai-Hai Plain and the middle and lower reaches of the Yangtze River Plain as the core, and low-level areas with the southwest mountainous areas as the core; the agricultural development level in the main agricultural production areas was significantly higher than that in other regions. Counties in the western regions, such as Guangxi, Xinjiang, and Chongqing, witnessed a significant increase in ADL by two or more levels. Conversely, some counties in the cities of Huai’an and Lianyungang in Jiangsu Province experienced significant declines in agricultural development levels. The above result was consistent with the evaluation results of 31 provinces from 2000 to 2016 by using the entropy weight method from the three dimensions of input, output, and production service [
45].
In the main agricultural production area of Gansu-Xinjiang, counties with higher ADL were mainly concentrated in Changji Hui Autonomous Prefecture, Ili Kazakh Autonomous Prefecture and Wuwei. Significant improvements in agricultural development were observed in Jinta County, Yumen City, Gaotai County, Weili County and Gaochang District from 2009 to 2015. In the main agricultural production area of the Hetao Irrigation District, counties with higher ADL were distributed around the capital cities of Yinchuan and Hohhot. The spatial distribution was relatively concentrated. The agricultural development level of Jinfeng District and Xingqing District, which are under the jurisdiction of Yinchuan city, decreased by one level from 2012 to 2015. In the main agricultural production area of Northeast Plain, Harbin, and Changchun, Shenyang and its nearby counties had a high level of agricultural development, while counties in subordinate parts of Baishan, Tonghua, Yanbian Korean, Dalian, and Yichun had a relatively low level of agricultural development, with the level of agricultural development remaining unchanged at IV to V between 2009 and 2015. In the Fen-Wei Plain, the significant increase in ADL from 2009 to 2015 was mainly distributed in some counties under Baoding, Zhangjiakou, Shijiazhuang, Ankang and Yan’an, Linfen, and Taiyuan. The level of agricultural development in counties near the urban areas of Xi’an, Datong, and Handan was lower, and ADL was significantly higher in Hebei than in Shanxi and Shaanxi. In the main agricultural production area of Huang-HuaiHai Plain, counties with a high overall level of agricultural development were mainly located in the northern part of Anhui Province, the eastern part of Henan Province, the northern part of Hebei Province, the northern part of Jiangsu Province, and Shandong Province, covering a total of five provinces. Since the implementation of the plan, there has been a significant transformation of counties with a relatively high level of agricultural development (level III) to a higher level (level I~II), resulting in an overall high level of agricultural development. In the main agricultural production area of the Yangtze River basin, counties near the provincial capitals of Hefei, Wuhan, Changsha, Chengdu, Chongqing, and Nanchang have relatively higher levels of agricultural development, while counties with a medium level of agricultural development were mainly concentrated in Zhejiang Province. From 2009 to 2015, the number of counties with a medium level of agricultural development decreased in Anhui, Hubei, Hunan, Sichuan, and Zhejiang provinces, indicating a shift towards higher levels of development. In the main production area of South China, the overall level of agricultural development was at a medium-to-high level, lower than in the other six regions. From 2009 to 2015, there was a noticeable transformation of counties with low levels of agricultural development towards medium and high levels. Overall, the level of agricultural development in the Huang-HuaiHai Plain, the Yangtze River Basin, and the Northeast Plain was significantly higher than that of other main production areas.
4. Discussion and Policy Recommendation
4.1. Assessment of the Agricultural Development Level
National strategies such as MFAP indicate a transformation in China’s spatial governance towards functional control and enhancement [
46]. The level of agricultural development serves as an indicator of a region’s capacity to improve agricultural product supply and ensure national or regional food security. In this study, the constructed indicator system for agricultural development assessment meets the diverse requirements of county-level spatial units, offering ample data accessibility and the ability to characterize policy demands. The spatiotemporal evaluation of agricultural development at the county level provides crucial insights into China’s spatial governance.
Overall, main functional area planning (MFAP) has had a positive impact on China’s agricultural development. There were various degrees of development in the national agricultural economic output and agricultural production space between 2009 and 2015. Concurrently, rural living space and agricultural population declined to varying degrees. The number of counties in the country with a high degree of agricultural development expanded dramatically, with a growth rate of 6.25%. These enhanced agricultural development counties are primarily concentrated in the eastern and central regions. Counties within the “Seven regions & Twenty-three belts” spatial agricultural framework have greater ADL than other regions, indicating that China has made beginning efforts in constructing a discernable pattern of concentrated agricultural growth. However, regional disparities at different scales cannot be overlooked.
In terms of the spatial pattern, the disparity in China’s agricultural development level is more prominent in the east–west direction than in the north–south direction. In 2015, among the seven primary agricultural production regions designated by MFAP, the proportions of ADL classes I to III, in descending order, were A2, A5, A6, A4, A3, A1, and A7. Between 2009 and 2015, the associated increments followed the order A7, A2, A4, A3, A1, A6, and A5. Classes I to III are primarily located in the relatively developed main production regions of A3, A5, and A6. In 2015, these three regions contributed 40.86%, 69.17%, and 38.29% to the total number of the counties with ADL class I in their respective areas. Northeast Plain (A3), Huang-Huai-Hai Plain (A5), and Yangtze River Middle and Lower Reaches Plain (A6) benefit from ample agricultural production factors such as precipitation and sunshine, possess favorable natural environmental conditions, high levels of agricultural modernization and mechanization, large-scale agricultural production, and efficient resource utilization in the agricultural production process. Counties with ADL classes IV to V are predominantly clustered in the northwestern provinces like Shaanxi, Gansu, and Ningxia, as well as in the southern provinces, including Guangxi, Yunnan, and Guizhou. They exhibit a spatial distribution characterized by “patches” and “stripes”. These areas face relatively unfavorable locational conditions, experience significant outmigration of labor leading to labor shortages, and exhibit lower economic output in the agricultural production process. Consequently, both urban and surrounding rural areas in these regions demonstrate lower agricultural production efficiency, with positive correlations among the various efficiency values.
Quantitatively evaluating the outcomes of MAFP implementation is indispensable for gauging its effectiveness and pinpointing implementation challenges. The results serve as a fundamental underpinning for subsequent policy revision and improvement [
47,
48]. Agriculture constitutes the bedrock of national economic development, assuming an important role in propelling national progress and supplying the populace with life’s essentials [
3,
49,
50]. Confronted with an increasingly complex development environment and international environment, it becomes imperative to expedite the consolidation of the three agricultural foundations and the transformation of agriculture. Highly developed agriculture refers not only entails economic benefits but also entails a commitment to the quality of its contribution in terms of ecological preservation and the elevation of the living standards of farmers [
51,
52,
53]. Therefore, in the process of agricultural modernization, it is imperative for decision makers to have a thorough understanding of the specific characteristics of agricultural production in different regions. For regions endowed with a competitive advantage edge in agricultural development, preferential policies should be implemented to ensure the prioritization of their agricultural production. Concurrently, in defining agricultural production zones within a regional context, decision makers should integrate key factors for improving the efficiency of agricultural production with the realities of the present and the demands of the times. This necessitates a comprehensive analysis of the contemporary development characteristics within a given region and the potential for natural, social, and economic factors to facilitate adaptation. The focus should be recalibrating the key drivers of agricultural production efficiency within the region, with the aim of improving both the quality and efficiency of agricultural production, thereby promoting agricultural modernization.
4.2. Policy Recommendation
Accelerating the pace of agricultural development serves as the bedrock and catalyst for making the leap from a large agricultural country to a strong agricultural country. The extent of agricultural development directly affects the effectiveness of China’s agricultural modernization. According to the research results of this paper, the following suggestions are made:
(1) For the main agricultural production areas with a higher level of agricultural development index (I~II), the enhancement of the comprehensive capacity of agricultural development should be further taken as the primary task, and the development direction of districts and counties should be industrial development or ecological protection according to geographical characteristics and resource and environmental conditions, and ecological protection should be strengthened while maintaining agricultural development.
(2) For the main agricultural production areas with a medium-level agricultural development index (III), it is necessary to pay sufficient attention to them and actively create conditions to guide them towards a higher level and prevent them from being transformed into a low level. Furthermore, the government should scrutinize the alignment of the socio-economic development within the main functional areas with the plan’s guiding prerequisites. It is imperative to ensure the sound construction of the supporting policy system the establishment sound of legal frameworks, regulatory mechanisms, institutional structures, and performance evaluation systems to ensure the robust development of the main agricultural production areas.
(3) For the main agricultural production areas with a low level of comprehensive agricultural development, such as Honghe County, Luchun County, and Jiangcheng County in Yunnan Province, it is recommended that local governments conduct targeted field research. Drawing on a full understanding of the resource and environmental carrying capacity, existing development intensity and development potential of the respective districts and counties, then adjust the original functional positioning and formulate new development directions and development policies, thereby forming a spatial development pattern in which population, economy, resources, and environment can be coordinated.
(4) For those counties where the level of agricultural development has declined, systematic analyses of the causes underlying the decline are paramount, followed by precision-targeted countermeasures. Prioritization should be given to augmenting agricultural research and bolstering infrastructure development to enhance the comprehensive production capacity of agriculture. Additionally, the government should improve the farmland protection systems to curb the decline in farmland areas. Finally, the implementation of the national population policy should be improved to facilitate the transfer of the agricultural population.
(5) For those counties where agricultural development has increased while the ecological function index has significantly decreased, it is imperative for the government to strictly control the overcrowding of agricultural production land by the expansion of cities and development zones. Proactive measures should be taken to encourage population relocation while gradually increase the degree of investment in ecological environmental protection, so as to ensure the preservation of the ecological environment while agriculture develops.
4.3. Limitations and Future Research Directions
In general, the execution of MFAP has successfully achieved its goals in enhancing agricultural development in China. Nevertheless, the existing disparities in agricultural development levels among regions require ongoing attention and resolution. Efforts to enhance the precision of MFAP management measures should persist to bring about a fundamental enhancement in China’s sustainable agricultural development. The limitations of this study mainly lie in data collection. Due to challenges in acquiring and processing county-level data and the time lag in the publication of statistical yearbooks, the time frame has not yet covered the most recent years. Additionally, agricultural development is influenced by factors such as pesticide and fertilizer usage, the management of agricultural non-point source pollution, and water resource availability. Yet, due to the lack of nationwide assessment data, it is relatively challenging to fully incorporate these factors into the quantifiable processes at the county level. To more accurately reflect the dynamic changes in agricultural development level, we recommend the development of effective data mining methods in future research and the establishment of corresponding assessment and early warning platforms for the regular evaluation of agricultural development.
5. Conclusions
Based on a comprehensive understanding of MFAP, in this study, an agricultural development level evaluation index system that includes three dimensions, agricultural products, agricultural space, and agricultural population, was proposed, and we applied this system to evaluate the ADL of 2850 counties across China from 2009 to 2015 at the county level. In the end, targeted policies were provided for pathway optimization and upgrading the level of agricultural development of regions. This study can provide valuable insights into the current state of county-level agricultural development in China and offers useful guidance for policy making and planning strategies aimed at promoting sustainable agricultural modernization the country. The main conclusions of this study can be summarized as follows:
(1) There were significant spatial heterogeneities in the overall level of agricultural development across the country. In terms of spatial orientation, counties with higher agricultural development level revealed that the central region surpassed the eastern, northeastern, and western regions, and the counties with higher agricultural development levels in the central region were mainly located in the main agricultural production areas of the Yangtze River basin, such as Anhui, Jiangsu, Hubei, Hunan, and Sichuan provinces.
(2) China has witnessed a gradual increase in the level of agricultural development over time, exemplified by the rise in the number of counties with the agricultural development levels between level 1 and level 3 increasing from 2058 in 2009 to 2236 in 2015, accounting for 78.46% of the total number of counties, an increase of 6.25% compared to 2009. Notably, the seven main agricultural production regions have shown significantly higher ADL than in others. This indicates more stable and consistent progress in agriculture, which aligns with the goals and the requirements of the Plan for major agricultural production areas.
(3) The objective of improving China’s agricultural development has been achieved since the implementation of MFAP. However, regional differences in the level of agricultural development still need to be addressed. Promoting and improving MFAP management measures is the only way to achieve sustainable agricultural development in China. It should be noted that the data acquisition is still not complete in this study, because it is difficult to obtain data reflecting environmental, ecological, and resource indicators at the county level. In addition, due to the lag in the publication of statistical yearbooks, the monitoring and statistics of agricultural production data should be strengthened in future research, and an effective data mining method should be developed to reflect the dynamic changes in the level of agricultural development. For the regular assessment of agricultural development, it is suggested that an information platform that combines databases and evaluation methodologies be developed.


 ,
, 


