

A Computer Vision-Based Algorithm for Detecting Vehicle Yielding to Pedestrians


Abstract
:1. Introduction
- We propose an automatic auditing method to check if vehicles yield to pedestrians at zebra crossings based on deep learning, which replaces the existing manual auditing method;
- We enhance the conventional tracking algorithm through the utilization of feature maps, enabling more accurate and efficient tracking of pedestrians and vehicles in varied environmental conditions;
- We formulate a novel warning-point prediction algorithm, specifically designed to accurately assess whether vehicles yield to pedestrians, reducing the probability of inaccurately attributing a vehicle’s violation to another and ensuring reliable and fair violation assessments;
- We meticulously conducted extensive experiments, using datasets such as MOT16, our privately compiled street scene video dataset, and a virtual simulation scene dataset amalgamated with SUMO, to validate the efficacy and reliability of our proposed methodologies. Our experiments demonstrated that our method significantly outperforms existing solutions in operational efficiency, showcasing a speed of 21 Hz compared to Deep SORT’s 11 Hz, while maintaining a balanced accuracy, manifesting a MOTA of 55.3 and MOTP of 70.3;
- The results of our comprehensive evaluations underline the substantial reduction in ID switches and false matches, elucidating our algorithm’s superiority in accuracy and reliability, particularly in dynamic and interacting urban settings, and reinforcing its potential in fostering sustainable traffic management solutions and enhancing urban sustainability.
2. Related Works
2.1. Behavior Detection
2.2. Object Detection and Tracking
3. Behavior Detection Algorithm
3.1. Algorithm Overview
- The trained target object-detecting network is used to recognize the target elements of the collected video frames to obtain the target element set;
- Tracking the motion trajectory of the elements in the target element set using an IOU tracking algorithm based on feature maps;
- Based on the identified first crossing line and the track of the tracked object, the violation detection algorithm based on timing is used to detect whether there is a violation of vehicles failure to yield in the current video frame.
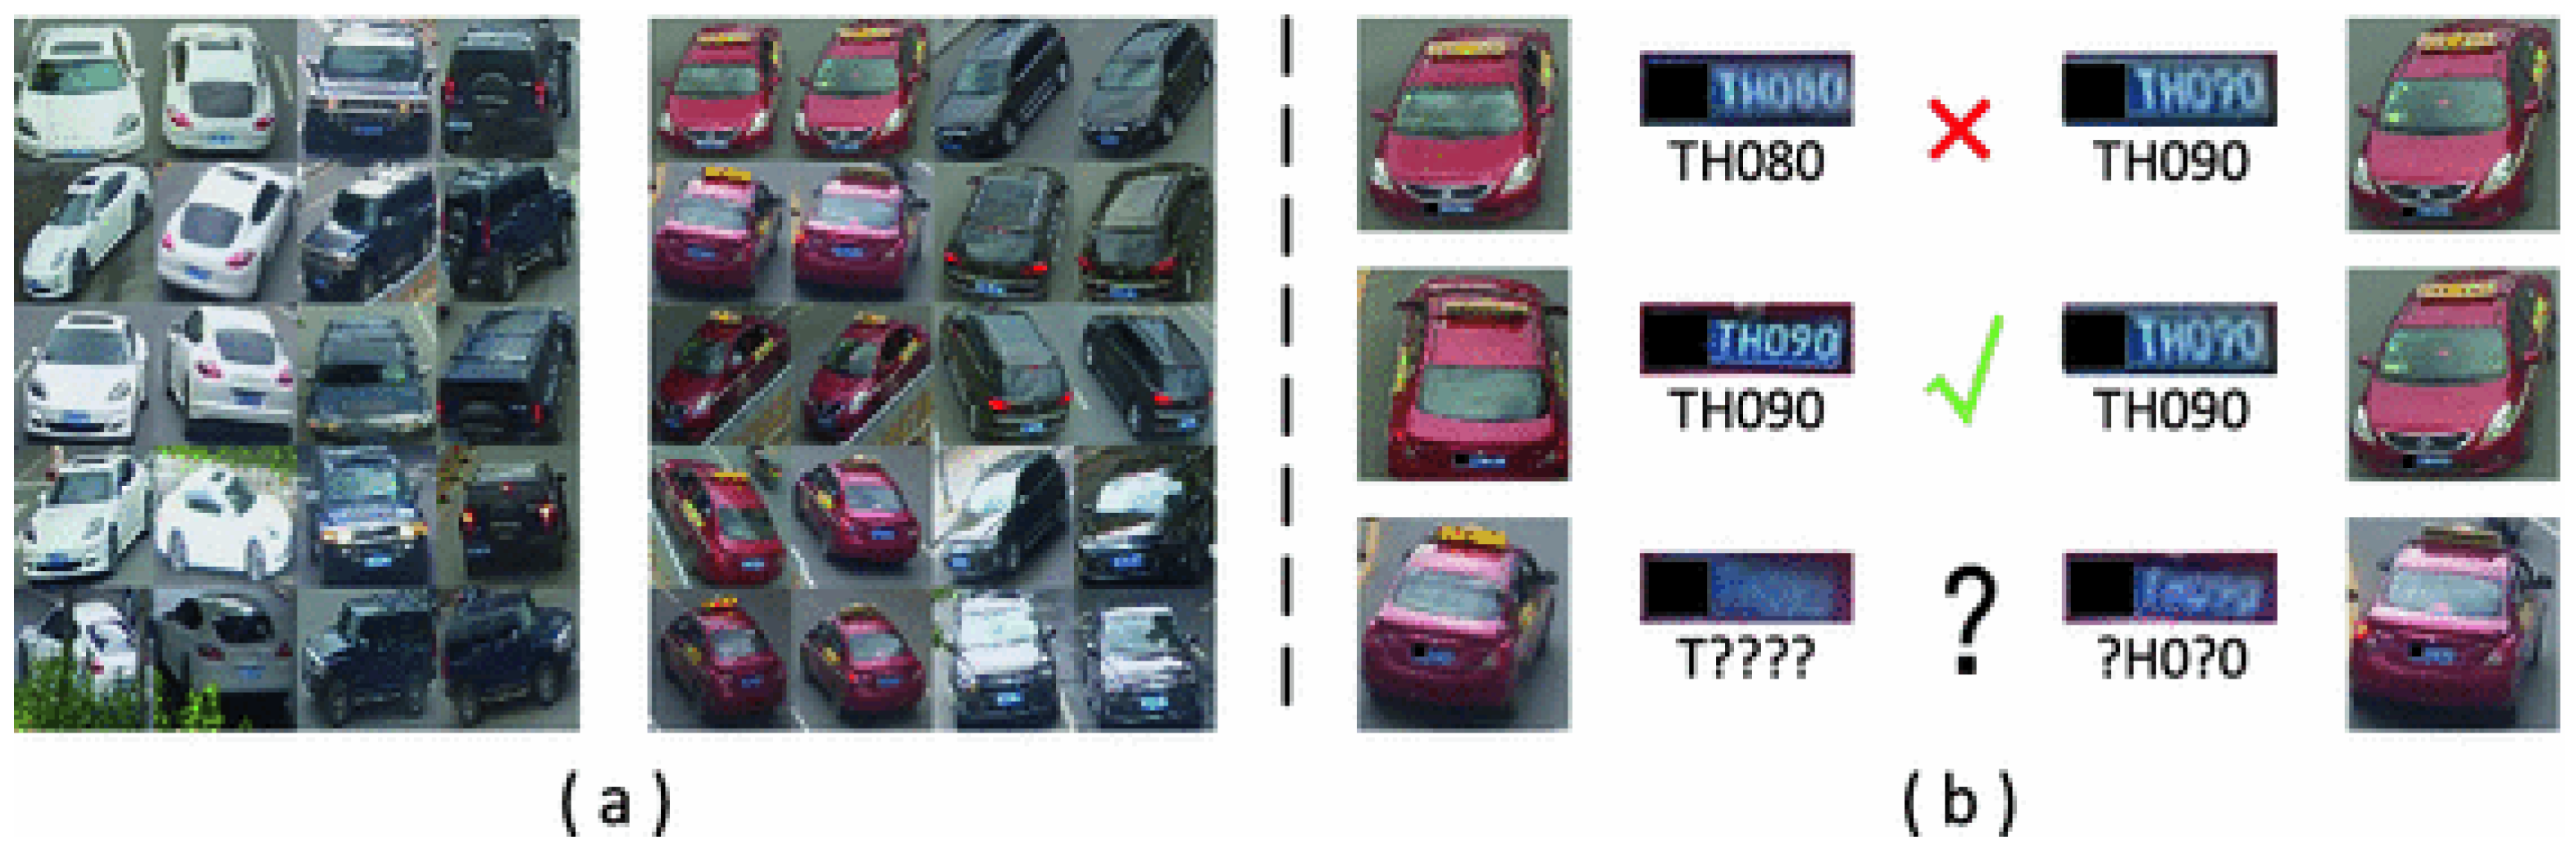
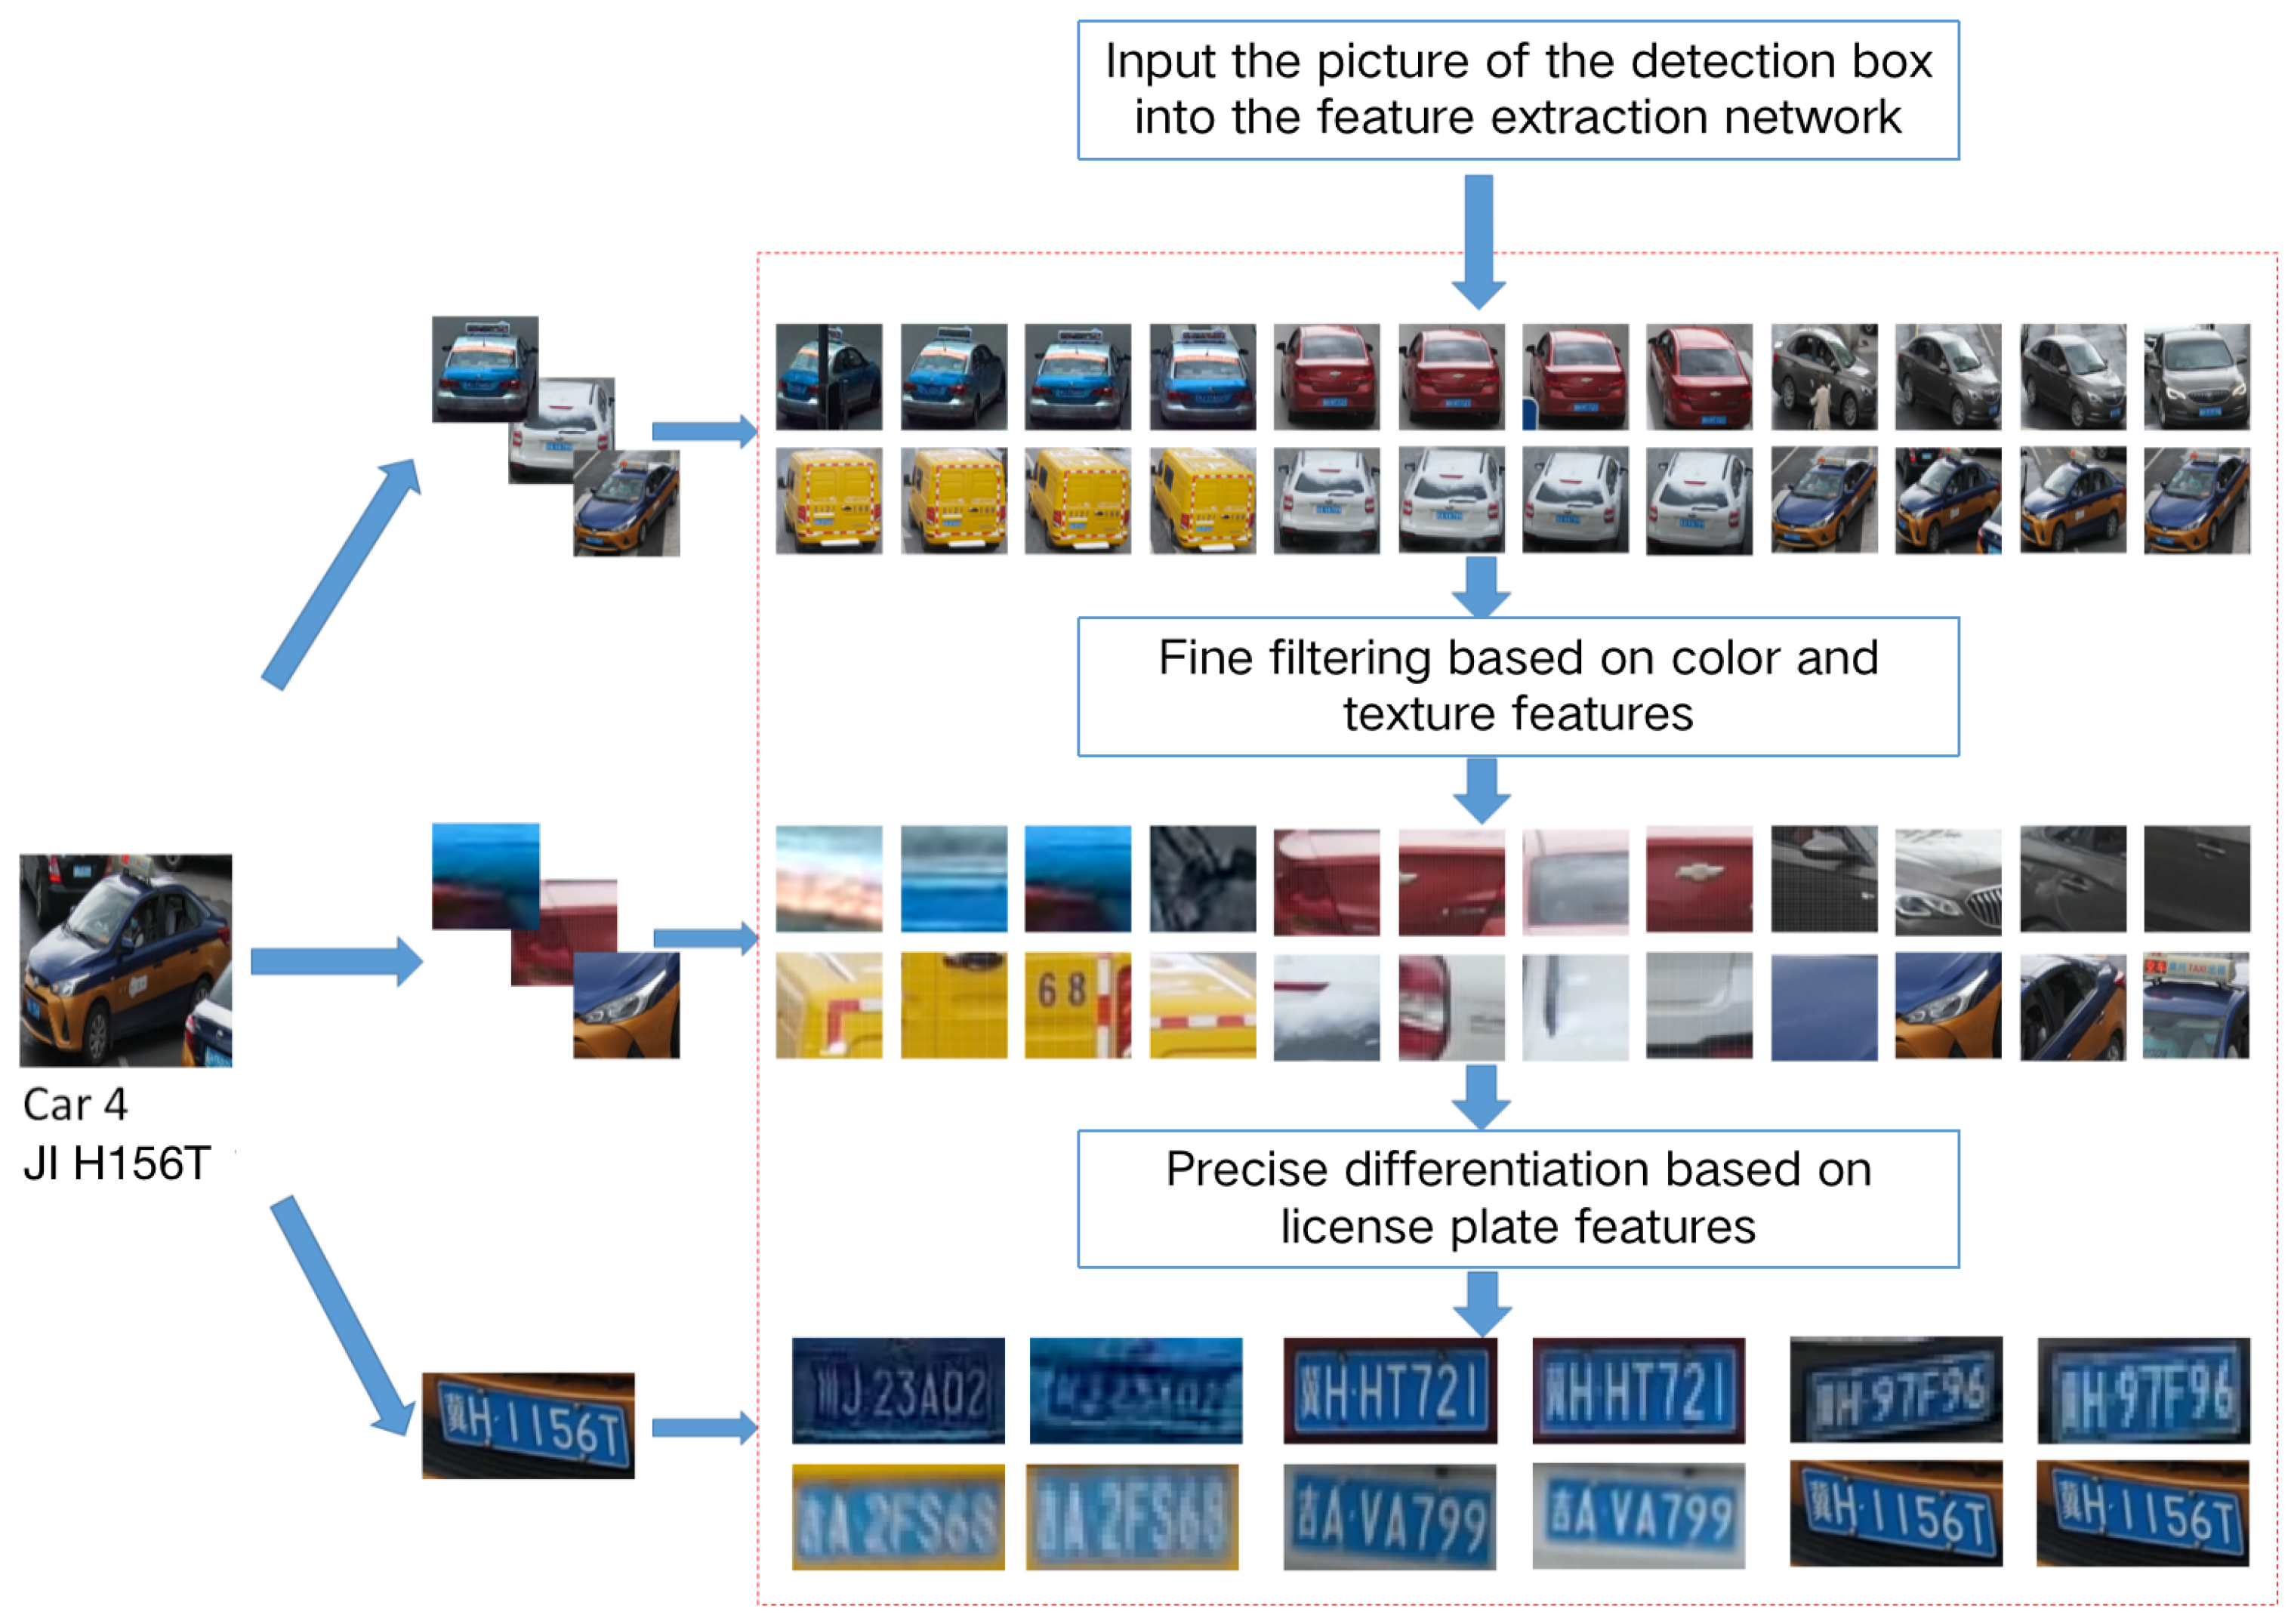
3.2. Object Tracking Based on Feature Map
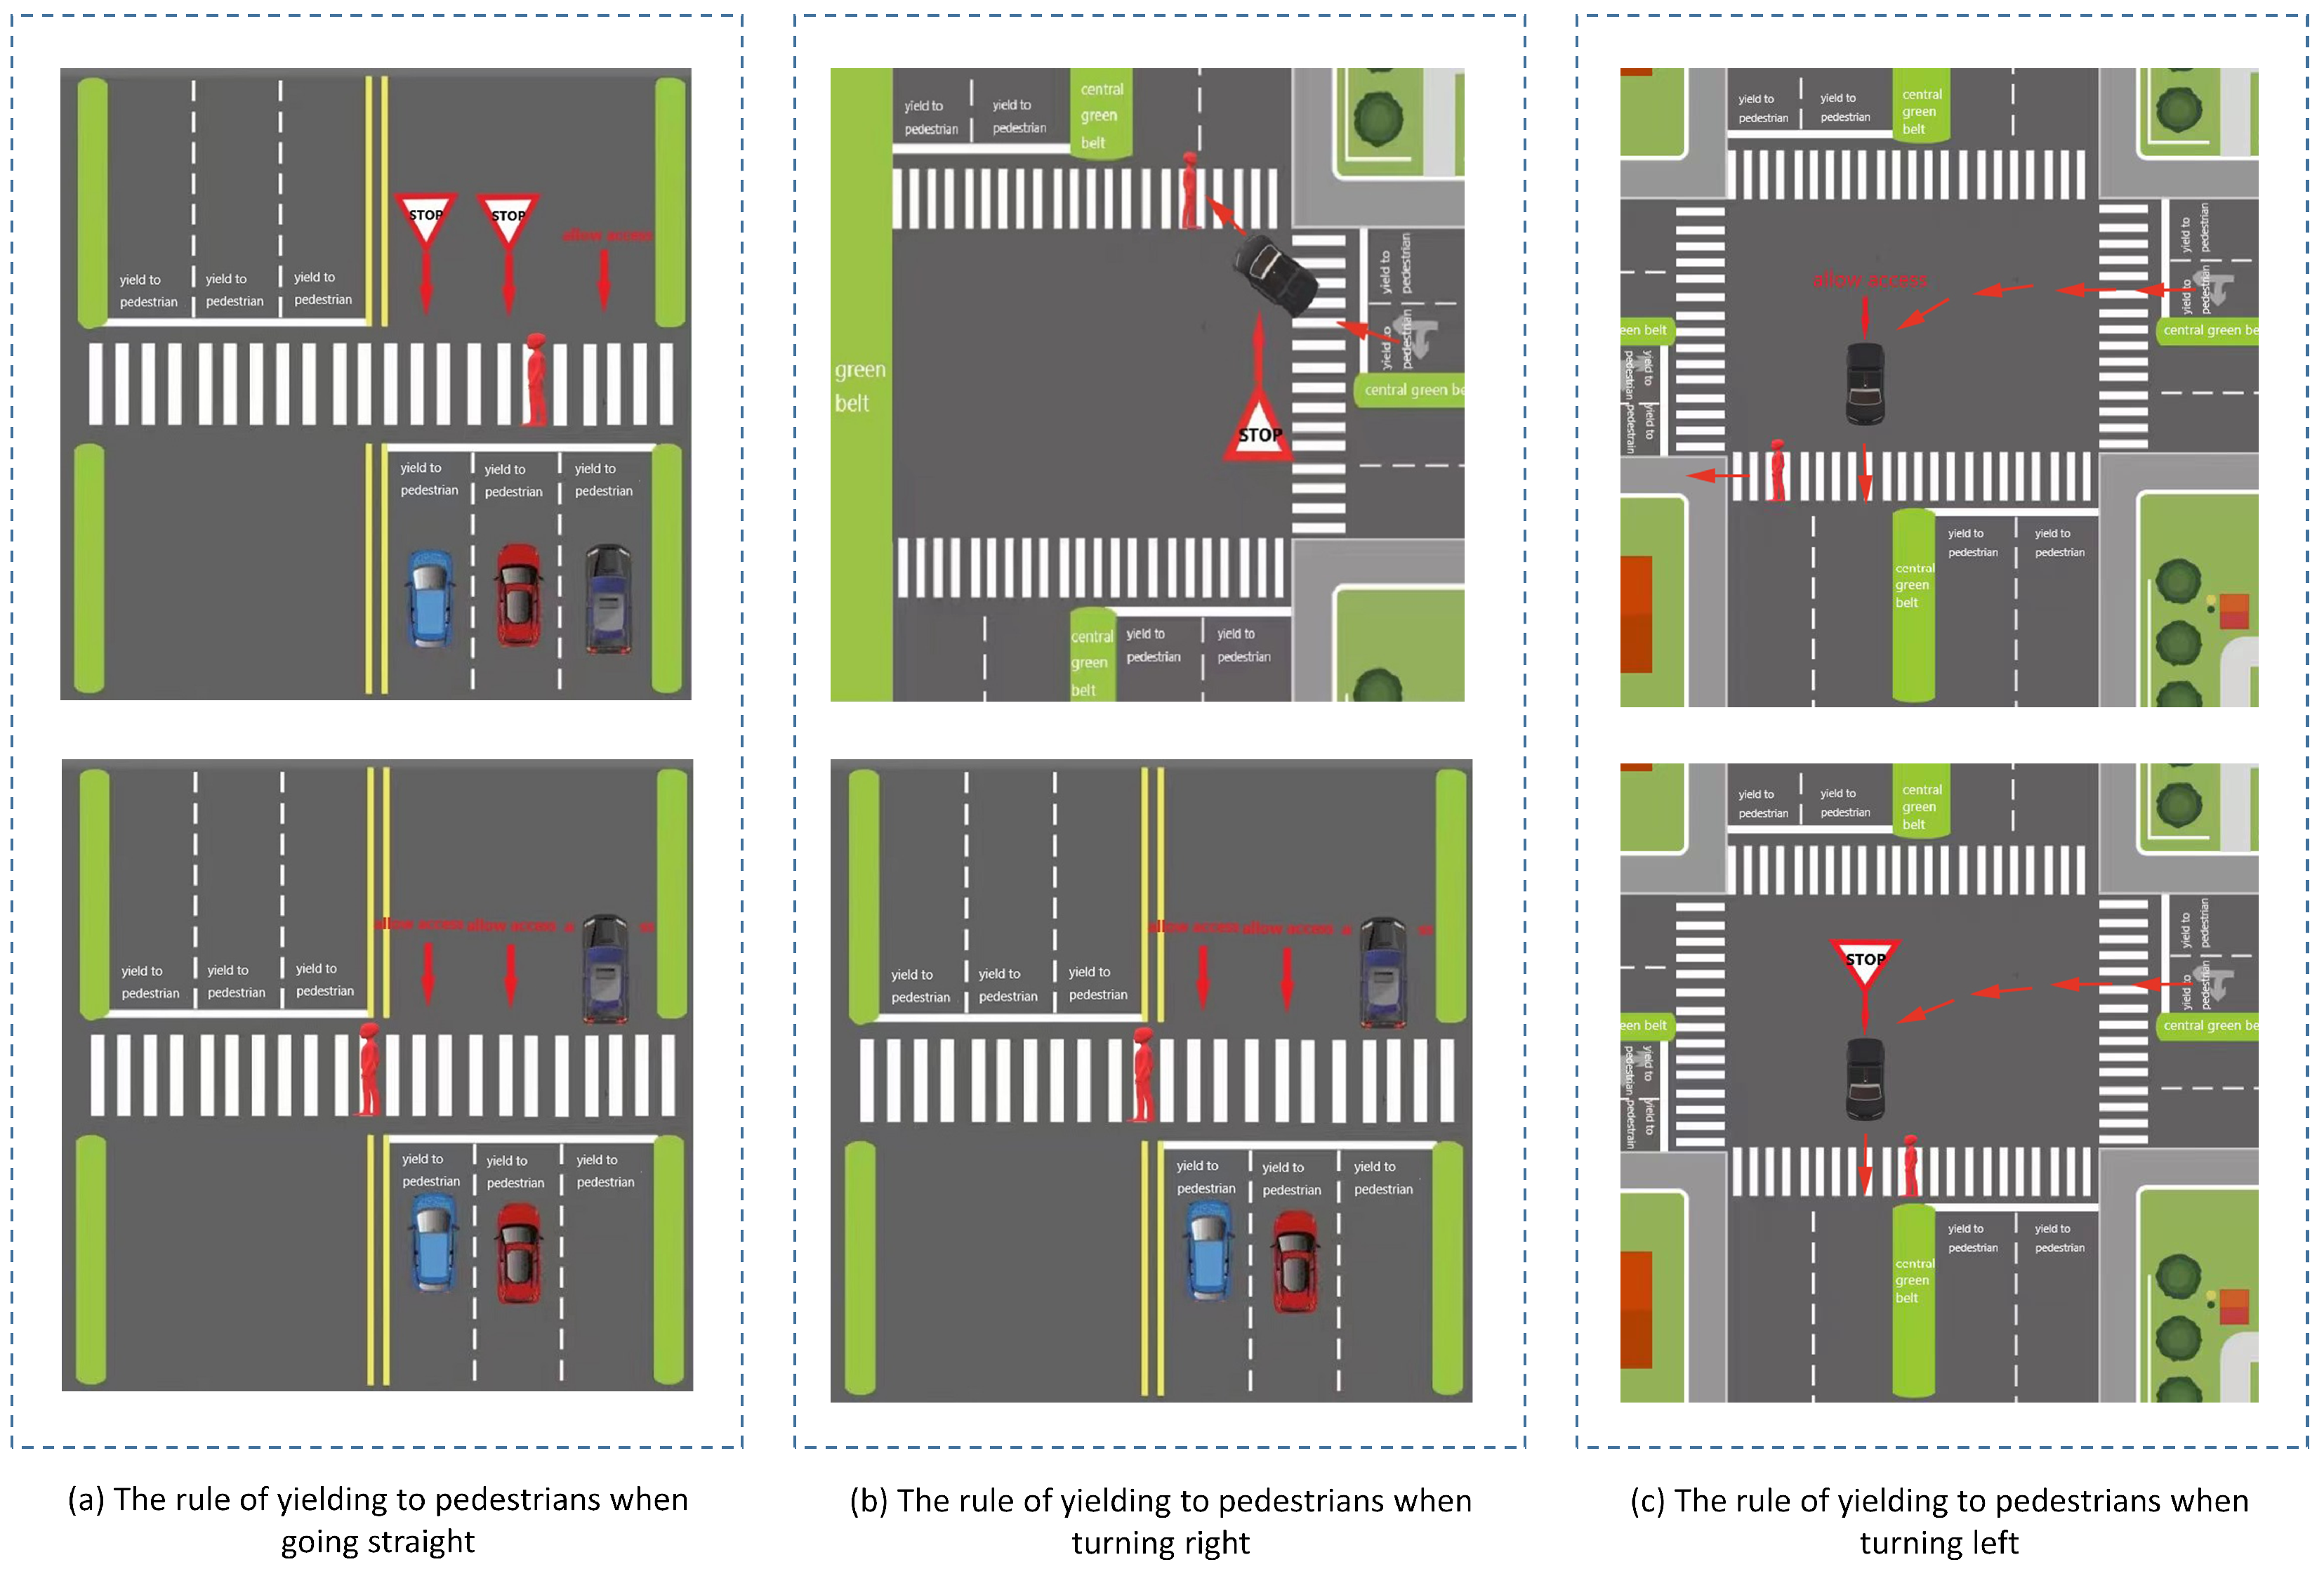
3.3. Detection of Vehicle Yielding to Pedestrian Based on Warning Points
- Excessive deceleration wastes time and traffic resources, so it is crucial to find the maximum speed at which the motor vehicle can slow down while ensuring pedestrians’ safety;
- If pedestrians have no tendency to pass the intersection, how to judge whether the motor vehicle should slow down and give way at this time;
- How to quantitatively judge the conflict between the motor vehicle route and the pedestrian route, that is, the motor vehicle does not yield to pedestrians.
4. Performance Evaluation
4.1. Simulation Settings
4.2. Experiment of Target Tracking Algorithm Based on Feature Graph and Plate ID
- MOTP: Precision of multi-target tracking. The average error between the estimated position and the real position in all frame matching pairs. This index reflects the ability of the tracker to estimate the precise position of the target, and is independent of the ability to identify target configuration, track tracking stability, etc. The calculation formula is as follows: Formula (10). The accuracy reflected in the determination of target location is used to measure the accuracy of target location determination, where represents the number of matches between the real position and hypothesis of the target in frame t. represents the distance between the real target position of frame t and its paired hypothetical position, that is, the matching error. The meaning of determines whether the MOTP index is larger or smaller.
- MOTA(↑): Accuracy of multi-target tracking. MOTA explains all object configuration errors, false positives, misses, and mismatches caused by the tracker in all frames.
- FAF(↓): Number of false alarms per frame.
- MT(↑): The number of main tracking tracks. At least 80 % of the target’s lifecycle has the same label.
- ML(↓): The number of tracks lost in most cases. The target is not tracked within at least 20 % of its life cycle.
- FP(↓): the number of error detections.
- FN(↓): the number of missed inspections.
- ID Switch(↓): the number of times the ID switches to a different object previously tracked.
- FM(↓): the number of times the tracking track is interrupted.note: “↑” means the larger the value, the better the result; “↓” means the smaller the value, the better the result.
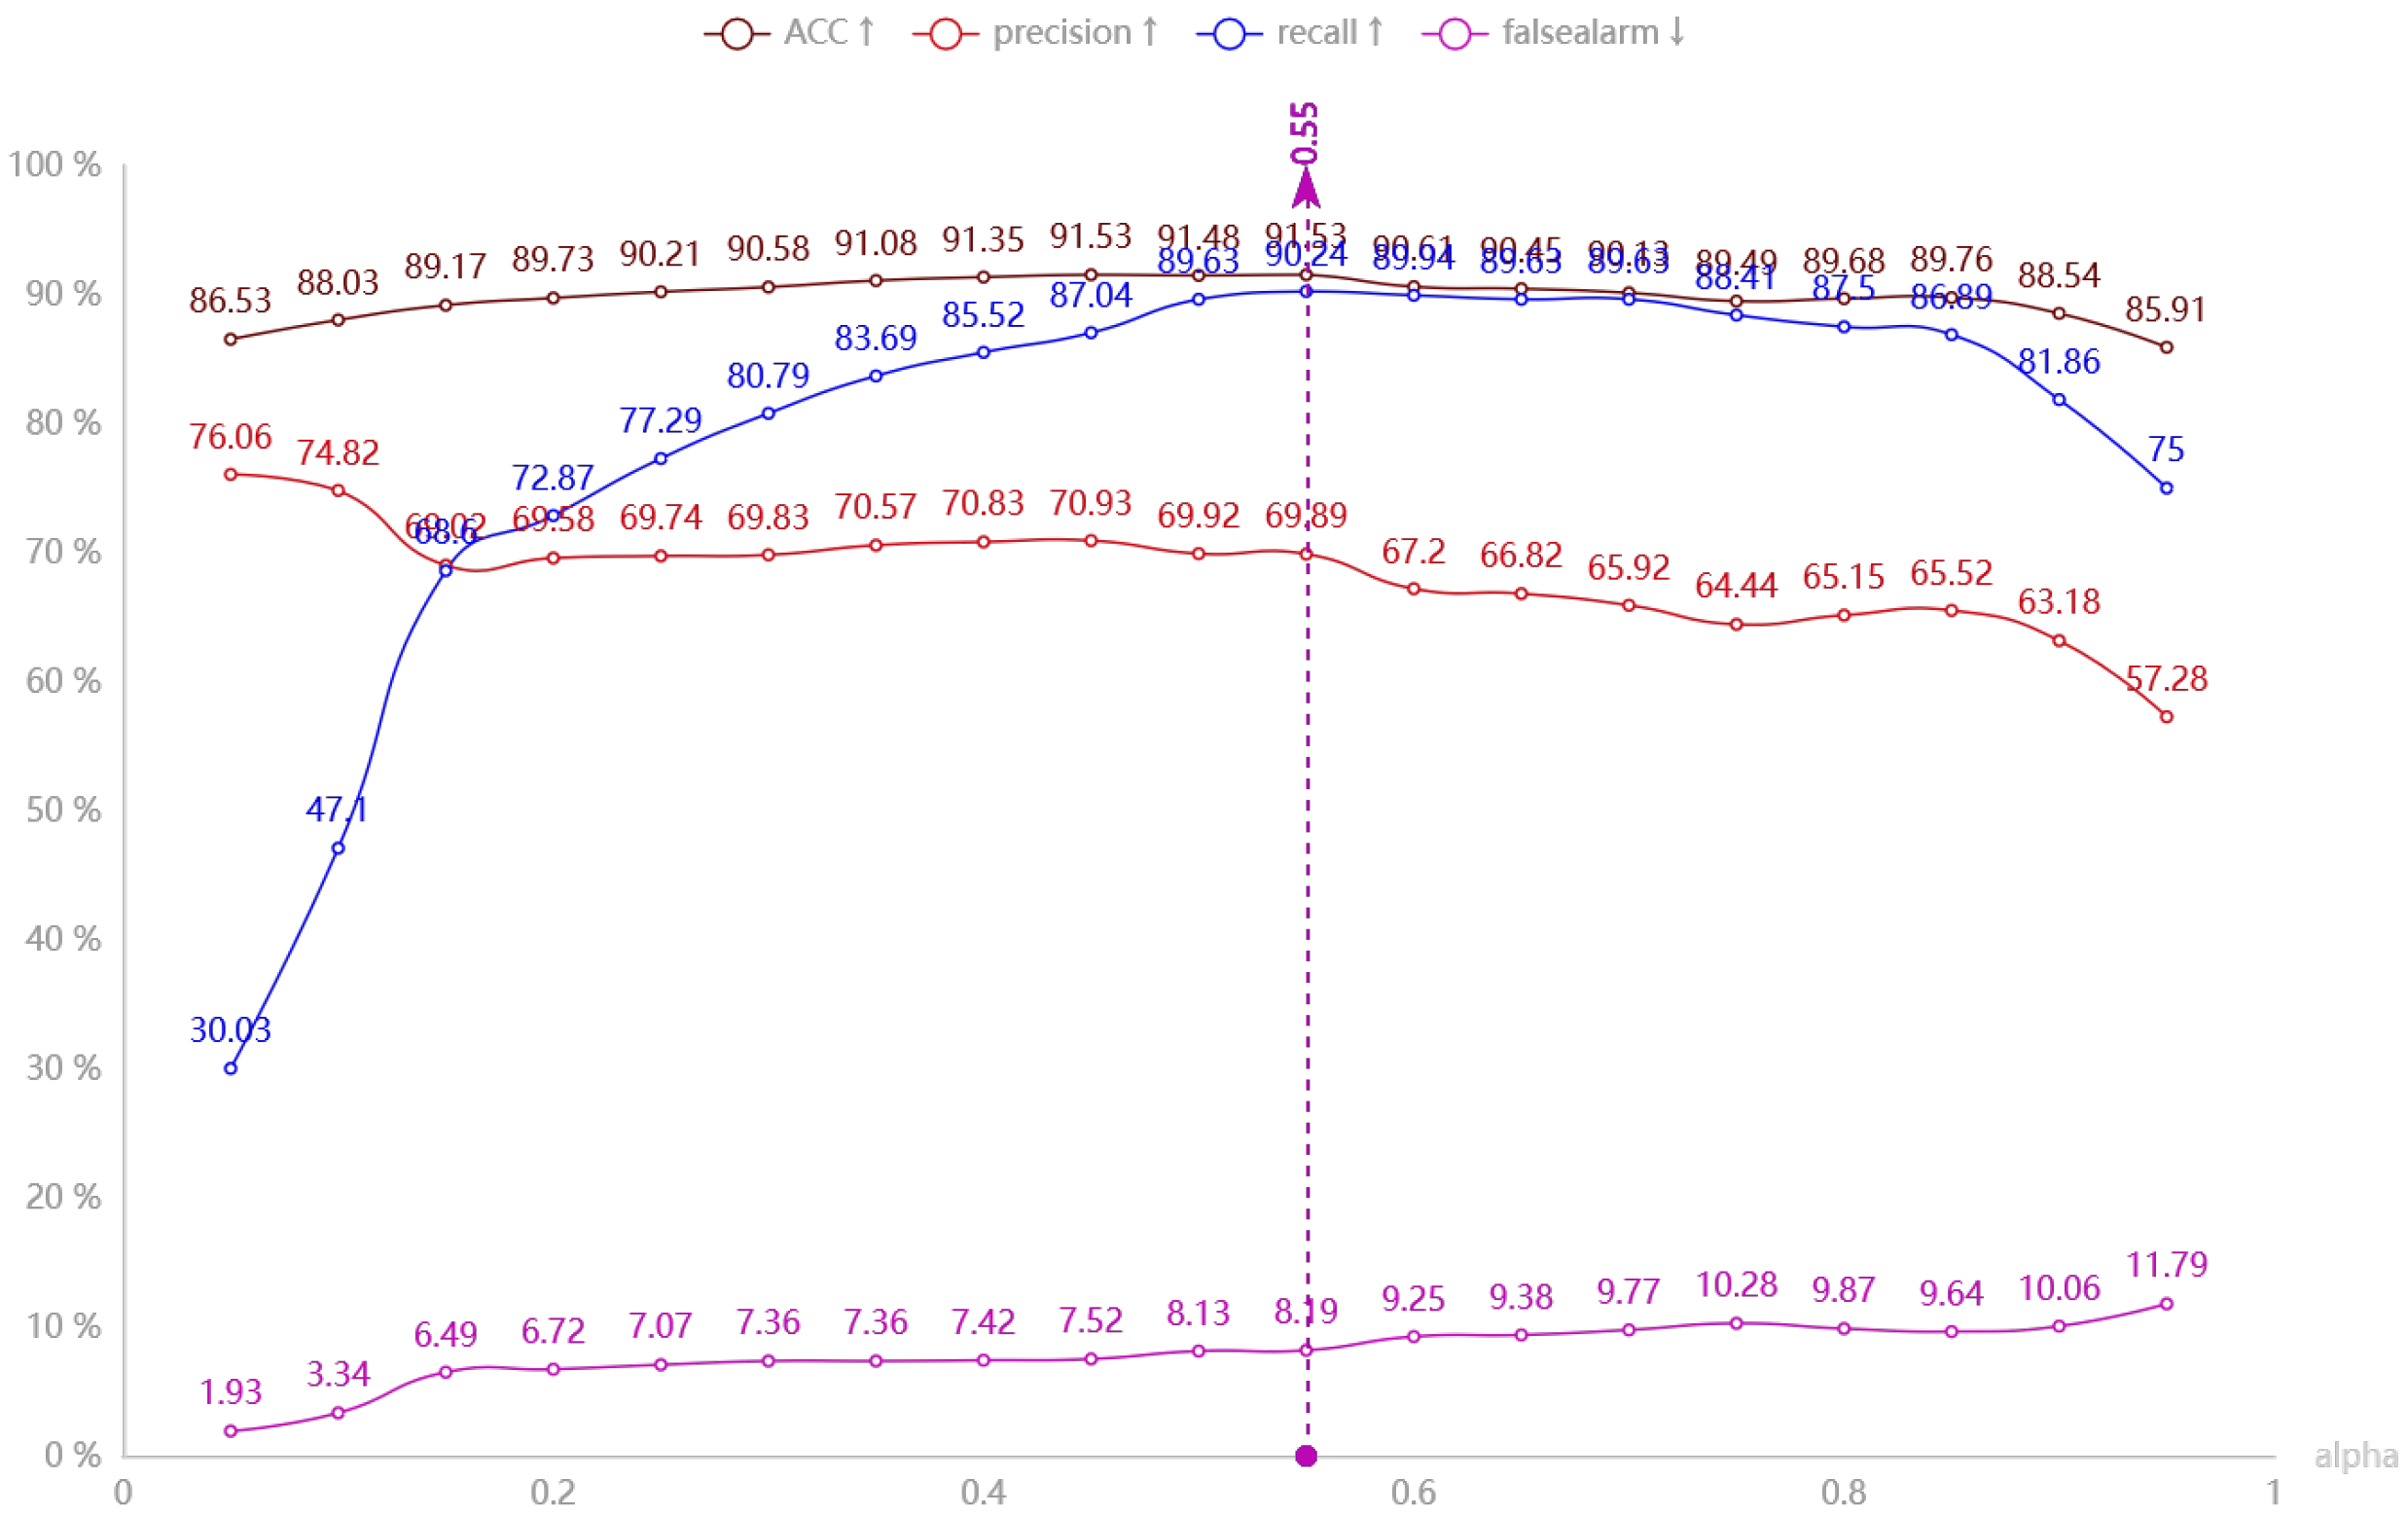
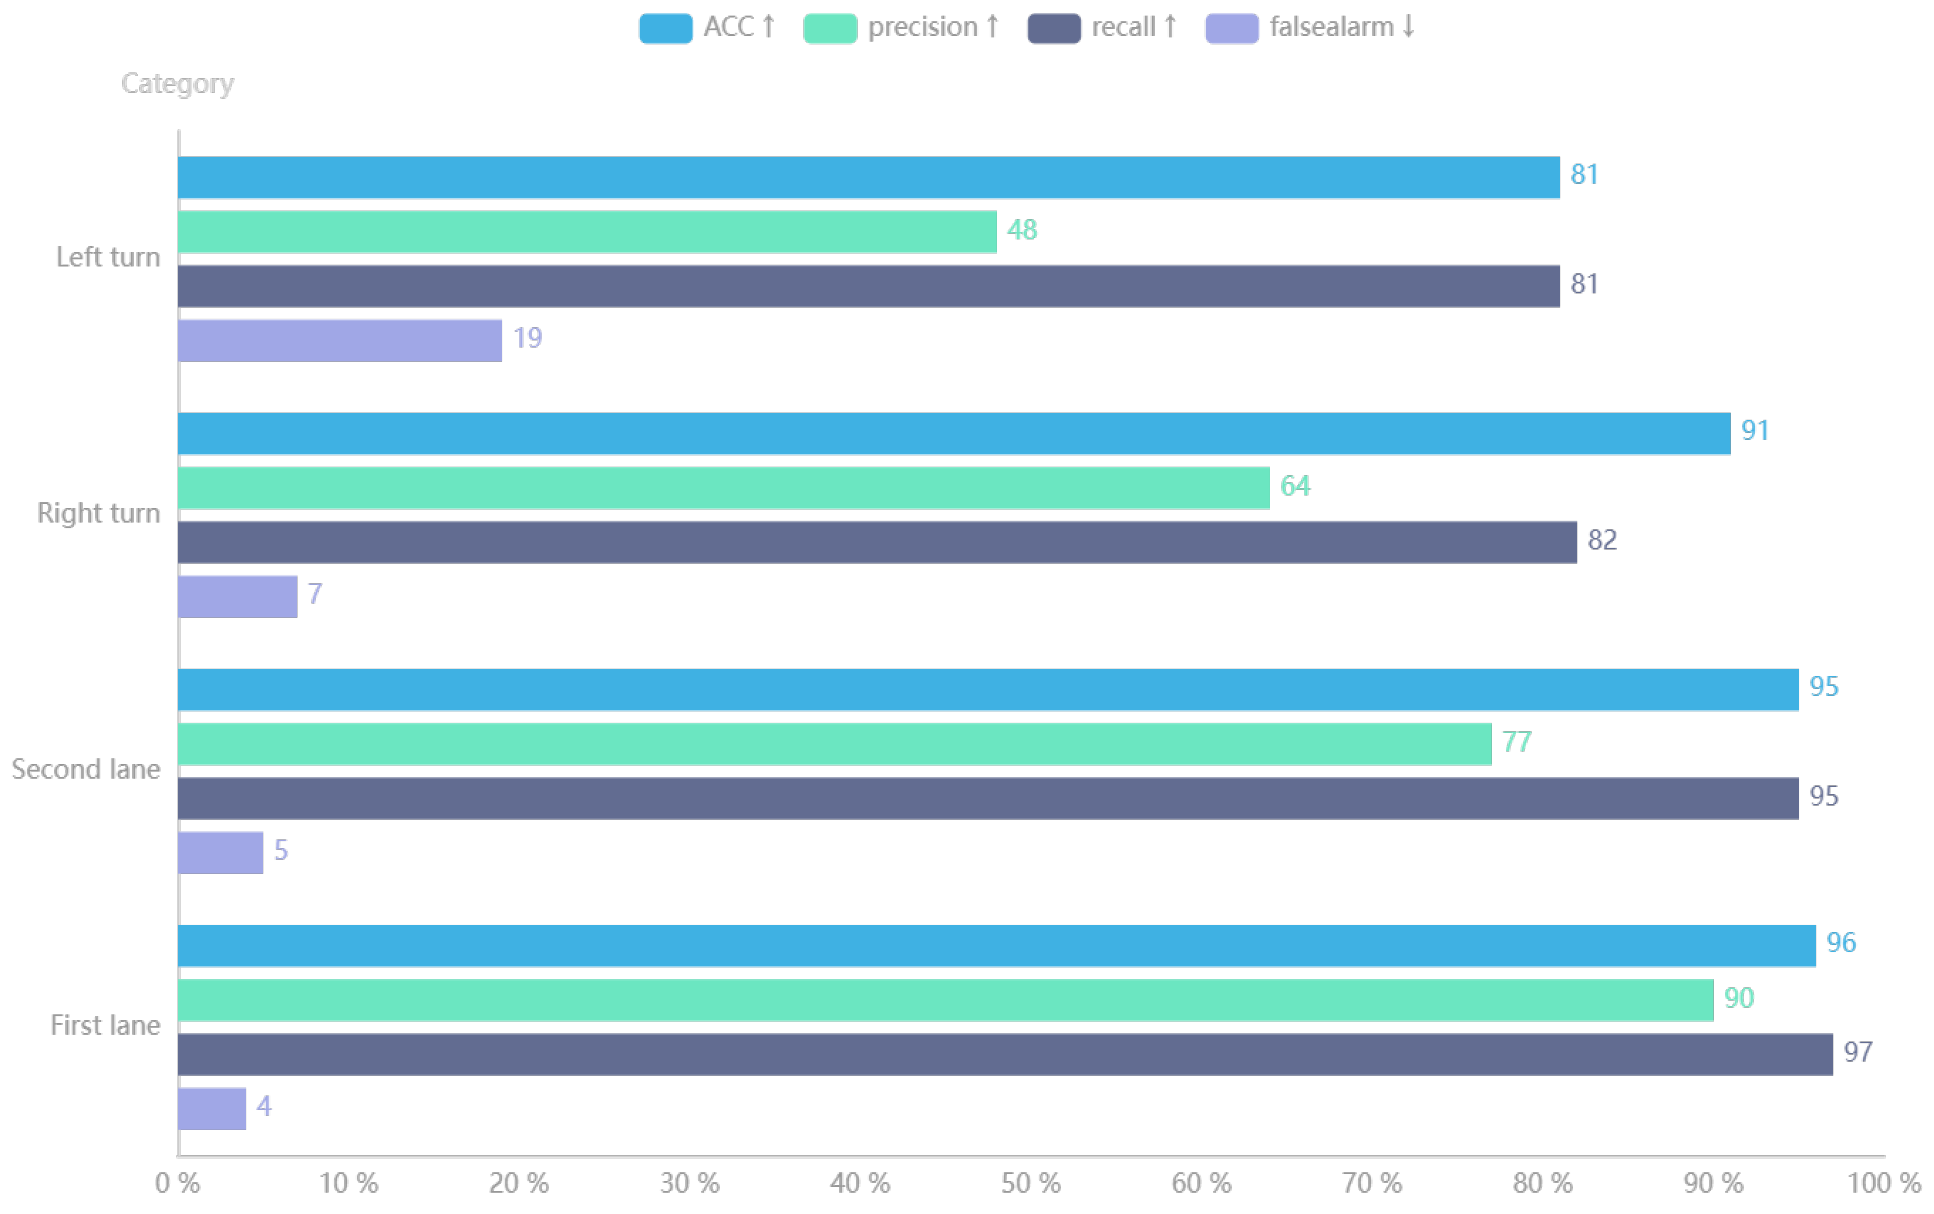
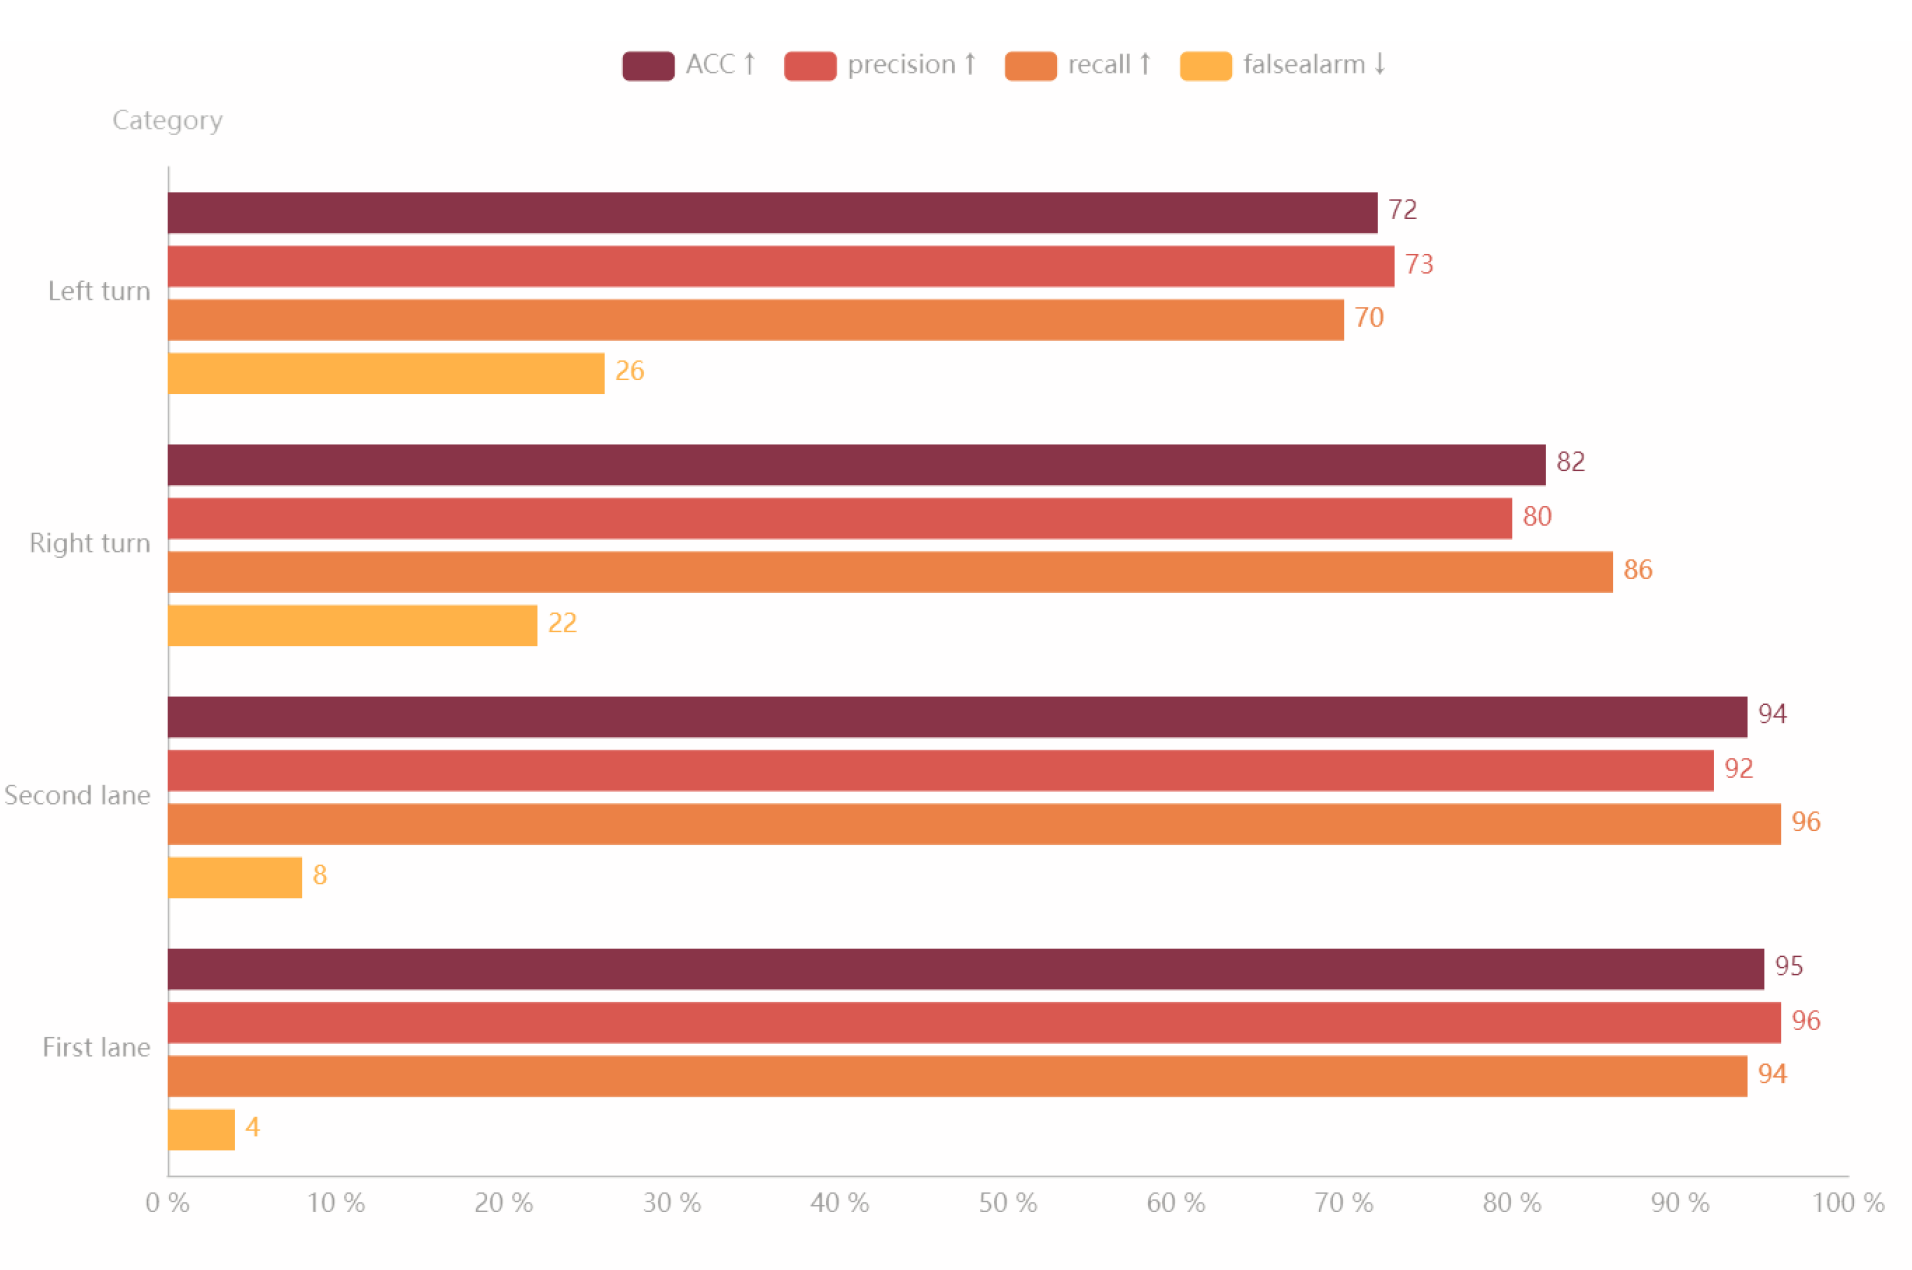
4.3. Experiment on Detection Algorithm of Vehicles’ Offensive Pedestrians Based on Warning Points
- Accuracy(↑): reflect the ability of the model to judge the overall sample correctly;
- Precision(↑): reflect the precision that the model can correctly predict the positive samples;
- Recall(↑): reflect the integrity that the classifier can correctly predict the positive samples
- False alarm(↓): reflect the purity that the model can correctly predict the positive samples.
5. Conclusions and Future Works
Author Contributions
Funding
Institutional Review Board Statement
Informed Consent Statement
Data Availability Statement
Conflicts of Interest
Abbreviations
| MOTA | Multiple Object Tracking Accuracy |
| MOTP | Multiple Object Tracking Precision |
| ROI | Region of Interest |
| MOT | Multiple Object Tracking |
| CARLA | Car Learning to Act |
| FPS | Frames Per Second |
| UAV | Unmanned Aerial Vehicle |
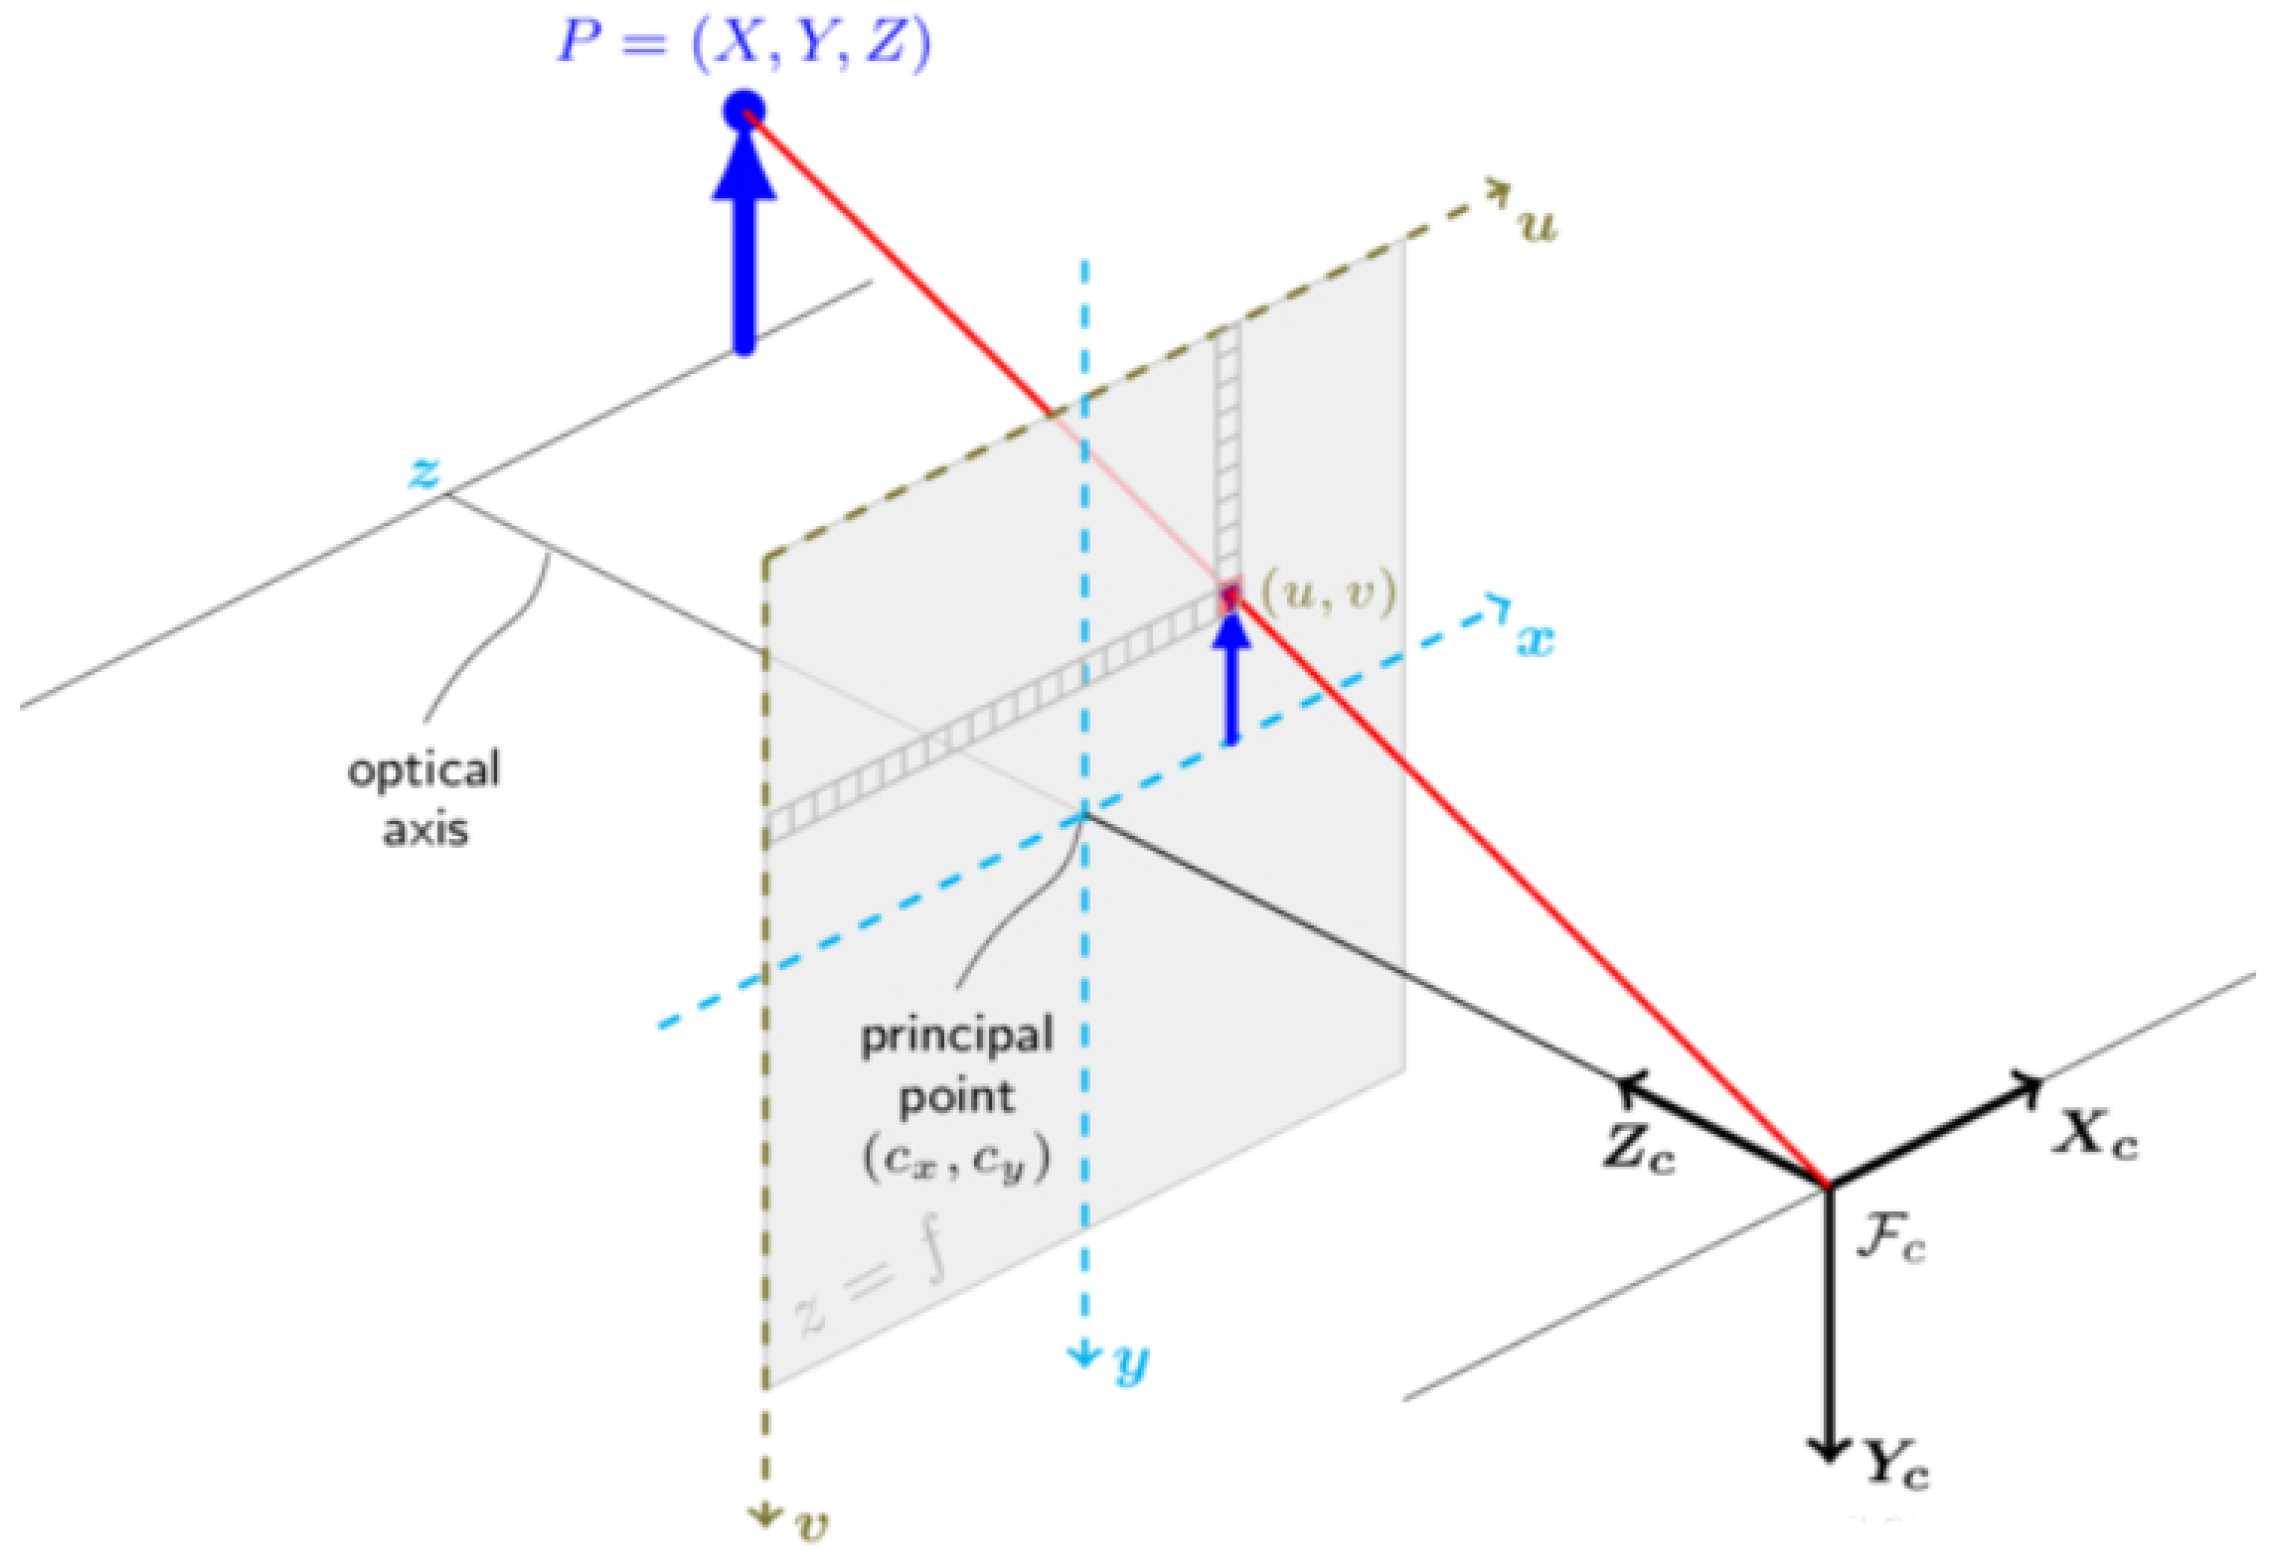
| PNP | Perspective-n-Point |
| IoU | Intersection over Union |
| ACC | Accuracy |
| TP | True Positive |
| TN | True Negative |
| FP | False Positive |
| FN | False Negative |
| V2X | Vehicle to Everything |
References
- World Health Organization (WHO). Road Traffic Injuries. 2021. Available online: https://www.who.int/news-room/fact-sheets/detail/road-traffic-injuries (accessed on 16 September 2023).
- Iftikhar, S.; Asim, M.; Zhang, Z.; Muthanna, A.; Chen, J.; El-Affendi, M.; Sedik, A.; Abd El-Latif, A.A. Target detection and recognition for traffic congestion in smart cities using deep learning-enabled uavs: A review and analysis. Appl. Sci. 2023, 13, 3995. [Google Scholar] [CrossRef]
- Akhtar, M.J.; Mahum, R.; Butt, F.S.; Amin, R.; El-Sherbeeny, A.M.; Lee, S.M.; Shaikh, S. A robust framework for object detection in a traffic surveillance system. Electronics 2022, 11, 3425. [Google Scholar] [CrossRef]
- Qureshi, S.A.; Hussain, L.; Chaudhary, Q.U.A.; Abbas, S.R.; Khan, R.J.; Ali, A.; Al-Fuqaha, A. Kalman filtering and bipartite matching based super-chained tracker model for online multi object tracking in video sequences. Appl. Sci. 2022, 12, 39538. [Google Scholar] [CrossRef]
- Sun, C.; Wang, Y.; Deng, Y.; Li, H.; Guo, J. Research on vehicle re-identification for vehicle road collaboration. J. Phys. Conf. Ser. 2023, 2456, 012025. [Google Scholar] [CrossRef]
- Noble, W.S. What is a support vector machine? Nat. Biotechnol. 2006, 24, 1565–1567. [Google Scholar] [CrossRef] [PubMed]
- Abramson, Y.; Steux, B. Hardware-friendly pedestrian detection and impact prediction. In Proceedings of the IEEE Intelligent Vehicles Symposium, Parma, Italy, 14–17 June 2004; pp. 590–595. [Google Scholar]
- Abramson, Y.; Steux, B.; Ghorayeb, H. Yet even faster (yef) real-time object detection. Int. J. Intell. Syst. Technol. Appl. 2007, 2, 102–112. [Google Scholar] [CrossRef]
- Havasi, L.; Szlávik, Z.; Szirányi, T. Pedestrian detection using derived third-order symmetry of legs a novel method of motion-based information extraction from video image-sequences. In Computer Vision and Graphics; Springer: Dordrecht, The Netherlands, 2006; pp. 733–739. [Google Scholar]
- Makris, D.; Ellis, T. Spatial and probabilistic modelling of pedestrian behaviour. In Proceedings of the 13th British Machine Vision Conference, BMVC 2002, Cardiff, UK, 2–5 September 2002; pp. 1–10. [Google Scholar]
- Large, F.; Vasquez, D.; Fraichard, T.; Laugier, C. Avoiding cars and pedestrians using velocity obstacles and motion prediction. In Proceedings of the IEEE Intelligent Vehicles Symposium, Parma, Italy, 14–17 June 2004; pp. 375–379. [Google Scholar]
- Girshick, R.; Donahue, J.; Darrell, T.; Malik, J. Rich feature hierarchies for accurate object detection and semantic segmentation. In Proceedings of the IEEE Conference on Computer Vision and Pattern Recognition, Columbus, OH, USA, 23–28 June 2014; pp. 580–587. [Google Scholar]
- Girshick, R. Fast r-cnn. In Proceedings of the IEEE International Conference on Computer Vision, Santiago, Chile, 7–13 December 2015; pp. 1440–1448. [Google Scholar]
- Ren, S.; He, K.; Girshick, R.; Sun, J. Faster r-cnn: Towards real-time object detection with region proposal networks. In Advances in Neural Information Processing Systems 28 (NIPS 2015); NeurIPS: San Diego, CA, USA, 2015. [Google Scholar]
- He, K.; Gkioxari, G.; Dollár, P.; Girshick, R. Mask r-cnn. In Proceedings of the IEEE International Conference on Computer Vision, Venice, Italy, 22–29 October 2017; pp. 2961–2969. [Google Scholar]
- Liu, W.; Anguelov, D.; Erhan, D.; Szegedy, C.; Reed, S.; Fu, C.Y.; Berg, A.C. Ssd: Single shot multibox detector. In Proceedings of the European Conference on Computer Vision, Amsterdam, The Netherlands, 11–14 October 2016; pp. 21–37. [Google Scholar]
- Sandler, M.; Howard, A.; Zhu, M.; Zhmoginov, A.; Chen, L.C. Mobilenetv2: Inverted residuals and linear bottlenecks. In Proceedings of the IEEE Conference on Computer Vision and Pattern Recognition, Salt Lake City, UT, USA, 18–22 June 2018; pp. 4510–4520. [Google Scholar]
- Jaiswal, S.; Chakraborty, P.; Huang, T.; Sharma, A. Traffic intersection vehicle movement counts with temporal and visual similarity based re-identification. In Proceedings of the 2023 8th International Conference on Models and Technologies for Intelligent Transportation Systems (MT-ITS), Nice, France, 14–16 June 2023; pp. 1–6. [Google Scholar]
- Kumar, A.; Kashiyama, T.; Maeda, H.; Zhang, F.; Omata, H.; Sekimoto, Y. Vehicle re-identification and trajectory reconstruction using multiple moving cameras in the carla driving simulator. In Proceedings of the 2022 IEEE International Conference on Big Data (Big Data), Osaka, Japan, 17–20 December 2022; pp. 1858–1865. [Google Scholar]
- Wang, Y.; Gong, B.; Wei, Y.; Ma, R.; Wang, L. Video-based vehicle re-identification via channel decomposition saliency region network. Appl. Intell. 2022, 52, 12609–12629. [Google Scholar] [CrossRef]
- Li, H.; Wang, Y.; Wei, Y.; Wang, L.; Li, G. Discriminative-region attention and orthogonal-view generation model for vehicle re-identification. Appl. Intell. 2023, 53, 186–203. [Google Scholar] [CrossRef]
- Bochinski, E.; Eiselein, V.; Sikora, T. High-speed tracking-by-detection without using image information. In Proceedings of the 2017 14th IEEE International Conference on Advanced Video and Signal Based Surveillance (AVSS), Lecce, Italy, 29 August–1 September 2017; pp. 1–6. [Google Scholar]
- Bochinski, E.; Senst, T.; Sikora, T. Extending IOU based multi-object tracking by visual information. In Proceedings of the 15th IEEE International Conference on Advanced Video and Signal Based Surveillance (AVSS), Auckland, New Zealand, 27–30 November 2018; pp. 1–6. [Google Scholar]
- Chu, Q.; Ouyang, W.; Li, H.; Wang, X.; Liu, B.; Yu, N. Online multi-object tracking using cnn-based single object tracker with spatial-temporal attention mechanism. In Proceedings of the IEEE International Conference on Computer Vision, Venice, Italy, 22–29 October 2017; pp. 4836–4845. [Google Scholar]
- Bewley, A.; Ge, Z.; Ott, L.; Ramos, F.; Upcroft, B. Simple online and realtime tracking. In Proceedings of the 2016 IEEE International Conference on Image Processing (ICIP), Phoenix, AZ, USA, 25–28 September 2016; pp. 3464–3468. [Google Scholar]
- Seita, D. Bdd100k: A large-scale diverse driving video database. Berkeley Artif. Intell. Res. Blog. Vers. 2018, 511, 41. [Google Scholar]
- Dai, J.; Li, Y.; He, K.; Sun, J. R-fcn: Object detection via region-based fully convolutional networks. In Advances in Neural Information Processing Systems 29 (NIPS 2016); NeurIPS: San Diego, CA, USA, 2016. [Google Scholar]
- Wang, C.-Y.; Bochkovskiy, A.; Liao, H.-Y.M. Yolov7: Trainable bag-of-freebies sets new state-of-the-art for real-time object detectors. In Proceedings of the IEEE/CVF Conference on Computer Vision and Pattern Recognition, Vancouver, BC, Canada, 17–24 June 2023; pp. 7464–7475. [Google Scholar]
- Diwan, T.; Anirudh, G.; Tembhurne, J.V. Object detection using yolo: Challenges, architectural successors, datasets and applications. Multimed. Tools Appl. 2023, 82, 9243–9275. [Google Scholar] [CrossRef] [PubMed]
- Zeusees. 2020. Available online: https://github.com/zeusees/HyperLPR (accessed on 25 October 2023).
- Milan, A.; Leal-Taixé, L.; Reid, I.; Roth, S.; Schindler, K. Mot16: A benchmark for multi-object tracking. arXiv 2016, arXiv:1603.00831. [Google Scholar]
- Unity Technologies. Unity—Manual: Execution Order of Event Functions; Unity Technologies: San Francisco, CA, USA, 2017. [Google Scholar]
- Behrisch, M.; Bieker, L.; Erdmann, J.; Krajzewicz, D. Sumo–simulation of urban mobility: An overview. In Proceedings of the SIMUL 2011, Third International Conference on Advances in System Simulation, Barcelona, Spain, 23–29 October 2011. [Google Scholar]
- Li, Y.; Huang, C.; Nevatia, R. Learning to associate: Hybridboosted multi-target tracker for crowded scene. In Proceedings of the 2009 IEEE Conference on Computer Vision and Pattern Recognition, Miami, FL, USA, 20–25 June 2009; pp. 2953–2960. [Google Scholar]
- Bernardin, K.; Stiefelhagen, R. Evaluating multiple object tracking performance: The clear mot metrics. EURASIP J. Image Video Process. 2008, 2008, 246309. [Google Scholar] [CrossRef]
- Wojke, N.; Bewley, A.; Paulus, D. Simple online and realtime tracking with a deep association metric. In Proceedings of the 2017 IEEE International Conference on Image Processing (ICIP), Beijing, China, 17–20 September 2017; pp. 3645–3649. [Google Scholar]
- Yu, F.; Li, W.; Li, Q.; Liu, Y.; Shi, X.; Yan, J. Poi: Multiple object tracking with high performance detection and appearance feature. In Proceedings of the European Conference on Computer Vision, Amsterdam, The Netherlands, 8–10 and 15–16 October 2016; pp. 36–42. [Google Scholar]
- Keuper, M.; Tang, S.; Zhongjie, Y.; Andres, B.; Brox, T.; Schiele, B. A multi-cut formulation for joint segmentation and tracking of multiple objects. arXiv 2016, arXiv:1607.06317. [Google Scholar]
- Lee, B.; Erdenee, E.; Jin, S.; Nam, M.Y.; Jung, Y.G.; Rhee, P.K. Multi-class multi-object tracking using changing point detection. In Proceedings of the European Conference on Computer Vision, Amsterdam, The Netherlands, 8–10 and 15–16 October 2016; pp. 68–83. [Google Scholar]
- Choi, W. Near-online multi-target tracking with aggregated local flow descriptor. In Proceedings of the IEEE International Conference on Computer Vision, Santiago, Chile, 7–13 December 2015; pp. 3029–3037. [Google Scholar]
- Sanchez-Matilla, R.; Poiesi, F.; Cavallaro, A. Online multi-target tracking with strong and weak detections. In Proceedings of the European Conference on Computer Vision, Amsterdam, The Netherlands, 8–10 and 15–16 October 2016; pp. 84–99. [Google Scholar]
- Redmon, J.; Divvala, S.; Girshick, R.; Farhadi, A. You only look once: Unified, real-time object detection. In Proceedings of the IEEE Conference on Computer Vision and Pattern Recognition, Las Vegas, NV, USA, 27–30 June 2016; pp. 779–788. [Google Scholar]
- Redmon, J.; Farhadi, A. Yolov3: An incremental improvement. arXiv 2018, arXiv:1804.02767. [Google Scholar]
- Howard, A.G.; Zhu, M.; Chen, B.; Kalenichenko, D.; Wang, W.; Wey, T.; Andreetto, M.; Adam, H. Mobilenets: Efficient convolutional neural networks for mobile vision applications. arXiv 2017, arXiv:1704.04861. [Google Scholar]
- He, K.; Zhang, X.; Ren, S.; Sun, J. Deep residual learning for image recognition. In Proceedings of the IEEE Conference on Computer Vision and Pattern Recognition, Las Vegas, NV, USA, 27–30 June 2016; pp. 770–778. [Google Scholar]
- Lin, T.Y.; Dollár, P.; Girshick, R.; He, K.; Hariharan, B.; Belongie, S. Feature pyramid networks for object detection. In Proceedings of the IEEE Conference on Computer Vision and Pattern Recognition, Honolulu, HI, USA, 21–26 July 2017; pp. 2117–2125. [Google Scholar]
- Ioffe, S.; Szegedy, C. Batch normalization: Accelerating deep network training by reducing internal covariate shift. In Proceedings of the 32nd International Conference on International Conference on Machine Learning, Lille, France, 6–11 July 2015; pp. 448–456. [Google Scholar]
- Chen, S.; Hu, J.; Shi, Y.; Peng, Y.; Fang, J.; Zhao, R.; Zhao, L. Vehicle-to-everything (v2x) services supported by lte-based systems and 5g. IEEE Commun. Stand. Mag. 2017, 1, 70–76. [Google Scholar] [CrossRef]
- Zhou, Y.; Tuzel, O. Voxelnet: End-to-end learning for point cloud based 3d object detection. In Proceedings of the IEEE Conference on Computer Vision and Pattern Recognition, Salt Lake City, UT, USA, 18–22 June 2018; pp. 4490–4499. [Google Scholar]


| Algorithm | Type | MOTA↑ | MOTP↑ | MT↑ | ML↓ | ID Sw↓ | FM↓ | FP↓ | FN↓ | Speed↑ |
|---|---|---|---|---|---|---|---|---|---|---|
| LMP_p [38] | BATCH | 71.0 | 80.2 | 46.9% | 21.9% | 434 | 587 | 7880 | 44,564 | <1 Hz |
| MCMOT_HDM [39] | BATCH | 62.4 | 78.3 | 31.5% | 24.2% | 1394 | 1318 | 9855 | 57,257 | 10 Hz |
| NOMTwSDP16 [40] | BATCH | 62.2 | 79.6 | 32.5% | 31.1% | 406 | 642 | 5119 | 63,352 | <1 Hz |
| EAMIT [41] | ONLINE | 52.5 | 78.8 | 19.0% | 34.9% | 910 | 1321 | 4407 | 81,223 | 5 Hz |
| POI * [37] | ONLINE | 66.1 | 79.5 | 34.0% | 20.8% | 805 | 3093 | 5061 | 55,914 | 4 Hz |
| SORT [25] | ONLINE | 59.8 | 79.6 | 25.4% | 22.7% | 1423 | 1835 | 8698 | 63,245 | 25 Hz |
| Deep SORT [36] | ONLINE | 61.4 | 79.1 | 32.8% | 18.2% | 781 | 2008 | 12,852 | 56,668 | 13 Hz |
| Ours (Fast R-CNN) | ONLINE | 59.2 | 78.3 | 27.2% | 20.3% | 699 | 2148 | 11,243 | 66,110 | 15 Hz |
| Algorithm | Type | MOTA↑ | MOTP↑ | MT↑ | ML↓ | ID Sw↓ | FM↓ | FP↓ | FN↓ | Speed↑ |
|---|---|---|---|---|---|---|---|---|---|---|
| IoU [22] | ONLINE | 53.4 | 67.6 | 18.6% | 26.9% | 204 | 2173 | 6712 | 10,830 | 22 Hz |
| V-IoU [23] | ONLINE | 54.7 | 66.8 | 20.9% | 26.8% | 174 | 1752 | 6810 | 9720 | 20 Hz |
| SORT [25] | ONLINE | 59.0 | 75.6 | 26.4% | 19.1% | 132 | 1135 | 4671 | 9217 | 19 Hz |
| Deep SORT [36] | ONLINE | 57.1 | 76.1 | 29.1% | 17.2% | 111 | 1008 | 4236 | 8713 | 11 Hz |
| Ours | ONLINE | 55.3 | 70.3 | 26.2% | 25.3% | 103 | 948 | 5119 | 9199 | 21 Hz |
Disclaimer/Publisher’s Note: The statements, opinions and data contained in all publications are solely those of the individual author(s) and contributor(s) and not of MDPI and/or the editor(s). MDPI and/or the editor(s) disclaim responsibility for any injury to people or property resulting from any ideas, methods, instructions or products referred to in the content. |
© 2023 by the authors. Licensee MDPI, Basel, Switzerland. This article is an open access article distributed under the terms and conditions of the Creative Commons Attribution (CC BY) license (https://creativecommons.org/licenses/by/4.0/).
Share and Cite
Wan, Y.; Xu, Y.; Xu, Y.; Wang, H.; Wang, J.; Liu, M. A Computer Vision-Based Algorithm for Detecting Vehicle Yielding to Pedestrians. Sustainability 2023, 15, 15714. https://doi.org/10.3390/su152215714
Wan Y, Xu Y, Xu Y, Wang H, Wang J, Liu M. A Computer Vision-Based Algorithm for Detecting Vehicle Yielding to Pedestrians. Sustainability. 2023; 15(22):15714. https://doi.org/10.3390/su152215714
Chicago/Turabian StyleWan, Yanqi, Yaqi Xu, Yi Xu, Heyi Wang, Jian Wang, and Mingzheng Liu. 2023. "A Computer Vision-Based Algorithm for Detecting Vehicle Yielding to Pedestrians" Sustainability 15, no. 22: 15714. https://doi.org/10.3390/su152215714
APA StyleWan, Y., Xu, Y., Xu, Y., Wang, H., Wang, J., & Liu, M. (2023). A Computer Vision-Based Algorithm for Detecting Vehicle Yielding to Pedestrians. Sustainability, 15(22), 15714. https://doi.org/10.3390/su152215714