Abstract
Karst is a peculiar natural landscape arising from high rock solubility and well-developed underground solutional channel porosity. It is unique for its surface relief (exokarst) and subsurface drainage, including cave systems (endokarst). In Portugal, karst areas mainly consist of marginal or low-density territories with great fragility and vulnerability and great geo-environmental richness that merits better policies and practices regarding their geo-conservation. Endokarst potential assessments can provide decision-makers and local authorities insight into present and future territorial management and planning. In this context, the main objective of this study was to produce a cartographic model to identify areas with a greater probability of containing karstic caves—i.e., a greater endokarst potential—in the northern sector of the Santo António Plateau (Estremadura Limestone Massif, Central Portugal). Geological, topographic, hydrogeological, and land cover data were collected, processed, and integrated into a spatial database using a Geographic Information System. The locations of known cave entrances in the study area were also identified from local public institutions and speleological team records. Subsequently, four conditioning factors were extracted from the data: lithostratigraphic units, fracture density, relief energy, and land cover. Using a multi-criteria decision-making analysis, each previously chosen conditioning factor and its respective classes were weighted using an analytic hierarchy process. The locations of known cave entrances served to evaluate the cartographic model built, with results showing an agreement of 81.9%. This prototype of the endokarst potential map for the study area may be used for strategic and operational environmental planning (at least on a local scale) to assist decision-makers, competent authorities, and local speleological teams. Its application may promote a more accurate and thoughtful definition of areas to be investigated, substantially reducing the time and costs associated with field prospecting.
1. Introduction
Karst landscapes are characterised by a near absence of permanent surface water courses due to a high degree of meteoric water infiltration, which represents a disruption, in terms of solution continuity, of the surface drainage network. Additionally, they are characterised by the presence of depressions near the surface (such as sinkholes), bare rock sculpted by the action of water dissolution (such as karrens and karren fields), karstic springs usually located on the edge of massifs, and an underground landscape. This last is denoted as endokarst, where caves occur and sometimes form part of a complex network of conduits traversed by water in generally rapid flows [1,2]. Several conditioning factors influence karstification, and its correct identification/processing can allow a systematic assessment of the endokarst potential. According to Dimuccio [3] ‘[…] In terms of the conditions of susceptibility to karstification of a carbonate lithic massif, these result from the capacity of the water system to erode (erosivity) and from the resistance of the lithic body in being eroded (erodibility), both differentiating in space and time […]’.
The construction of predictive cartographic models is an attractive yet complex task. Several authors consider that cartographic models comprise a compilation of different types of data combined to build an explanatory model of the spatial distribution of a given phenomenon [4,5,6,7]. Geographic Information Systems (GIS) include a set of essential tools that assist in the construction of these models, allowing the quick gathering of all necessary information into a spatial database, applying automatic/semi-automatic analytical procedures, and providing results such as maps, graphs, or vector/raster spatial data files [8,9,10,11].
In karst geomorphology [1,2,12,13,14,15,16]; and references herein], underground karstification features (caves) assume relevance when related to human activities. Human occupation of karst regions must be carried out through territorial planning and management that considers the inherent weaknesses of this type of natural environment. Particular attention needs to be paid to aspects related to water resources (availability and vulnerability), natural hazards (e.g., collapse of cave roofs, karst flash floods, landslides), and mineral resource extraction (e.g., stone) [1,17,18]. However, karst environments constrain human activities and provide a peculiar, sometimes spectacular, landscape to enjoy [19,20,21,22,23,24]. The endokarst, in particular, gains relevance both for its geotourism potential (e.g., speleo-tourism) [25,26,27,28] as well as its scientific and didactic-pedagogical scope [29,30,31].
Multi-criteria decision-making (MCDM) analyses [32,33,34] use several geostatistical techniques to define and map the underground karstification potential of specific territories. Taheri et al. [35] employed an analytic hierarchy process (AHP) to map the sinkhole occurrence susceptibility in a karst region. They used a magnitude-frequency analysis of the inventoried sinkholes to verify their model, although they needed more relevant geological data. Moradi et al. [36] used an AHP as an additional tool to explore the hydrogeology of a karst massif and classify areas according to a karstification potential assessment. These authors also used fuzzy logic with the same objective, concluding that the fuzzy logic showed better prediction accuracy than the AHP for their specific study area. Nevertheless, both methods help revise the weight of used parameters (i.e., factors) in other regions. Zaree et al. [37] evaluated water resources through potential recharge in karst units using the altitude, slope, lithology, infiltration, and soil weighting model (APLIS). They then applied an AHP together with a technique for order of preference by similarity to the ideal solution (TOPSIS) to modify the weight of the APLIS model, thus producing three final maps. When these cartographic results were matched and compared with the location of karstic springs and fractures, TOPSIS was selected as the best method.
In Portugal, a preliminary tentative study to model endokarst potential was carried out in the Arrábida Chain [38], where researchers extensively evaluated the parameters that affect karst landscape development. They used a model based on an interactive combinatory analysis of some dependent variables (lithology, fractures, intersections between fractures, slope, and terra rossa deposits), considering their relative contributions to endokarst development. The implementation of the model was based on an interactive software application that provided a set of maps indicating the likelihood of endokarst occurrence at any given point. A comparative analysis of the results and the location of two known caves delivered an opportunity to understand the parameters that contribute most to the formation of endokarst.
Considering the availability of detailed geological knowledge at the local scale and many known cave entrances, the present study is expected to allow the construction of a model that spatially represents the underground karstification potential. Using GIS potentialities, a prototype of the endokarst potential map for the study area was produced with the primary objective of enhancing and better directing the speleological prospection that should precede environmental impact studies and the diversified tasks related to cave protection/conservation [39,40,41], scientific research/divulgation [42,43,44], territorial planning, and management in karst areas [45,46,47,48]. The focus of the present work is to contribute to a more efficient management of the karst territory under study. Compared to other studies [33,34,35,36,37,38], this more practical objective led us to create a cartographic model procedure that could readily apply to other karstified carbonate massifs. Because it is easier to apply, it is easier to generalise its use, understand its weaknesses, and introduce all the necessary corrections to improve its robustness and efficiency.
After identifying the techniques used in other works with similar themes and objectives, as well as the strengths and weaknesses of these works, in the present study, we proceeded to identify, analyse, and weigh the conditioning factors of underground karstification affecting Jurassic carbonate units in the northern sector of the Santo António Plateau, located in the most emblematic and suggestive karstified massif of Portugal—the Estremadura Limestone Massif (sensu Martins [49]).
2. Study Area
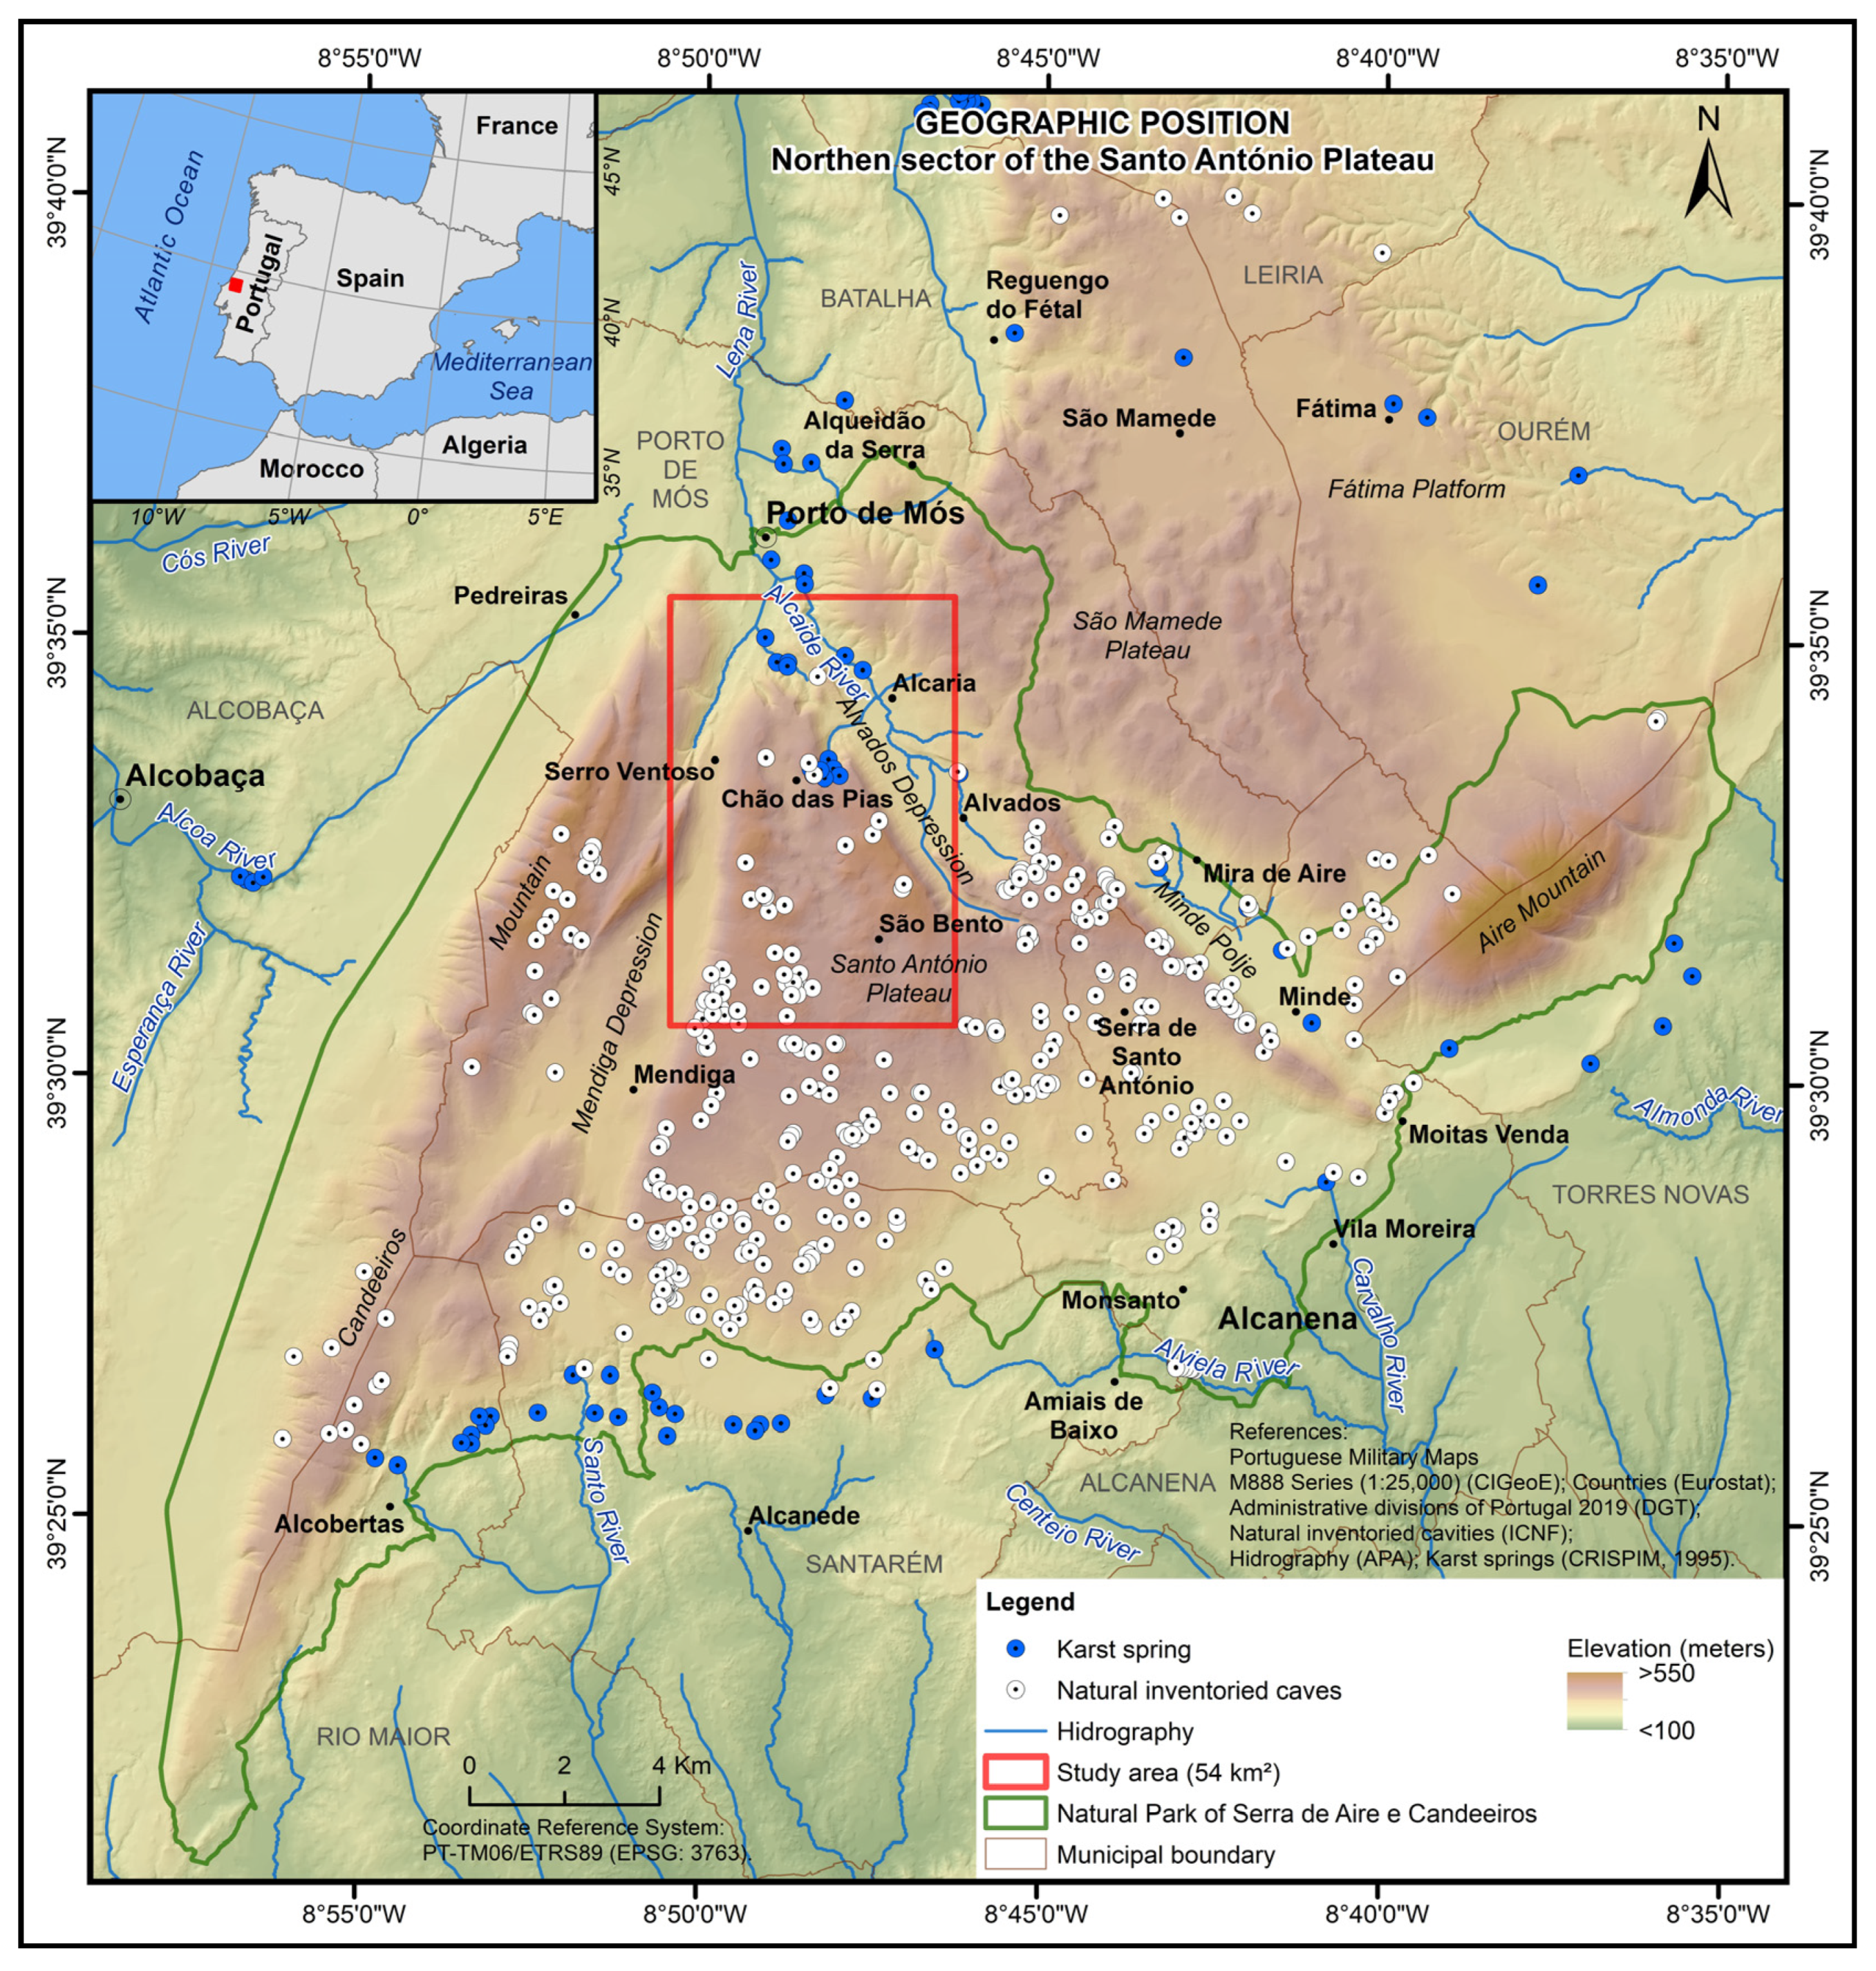
The Santo António Plateau, with a spatial extension of approximately 54 km2, corresponds to a small area on the north-western edge of the Estremadura Limestone Massif in Central Portugal (Figure 1) [50]. This study area was selected since it is affected, as is the entire massif, by a well-developed karstification [17,49,51,52,53,54]. Additionally, the inventory, exploration, and scientific dissemination of karstic caves carried out by local speleological teams [55], the Natural Park of Serras de Aire e Candeeiros, and the National Institute for the Conservation of Nature and Forests were also considered. However, even though this area has been extensively studied by geologists [54,56,57,58,59] and geographers [49,50,53], allowing us to obtain important data, it was not possible to extend the study area further as the spatial range of these scientific investigations largely coincide with the Santo António Plateau.
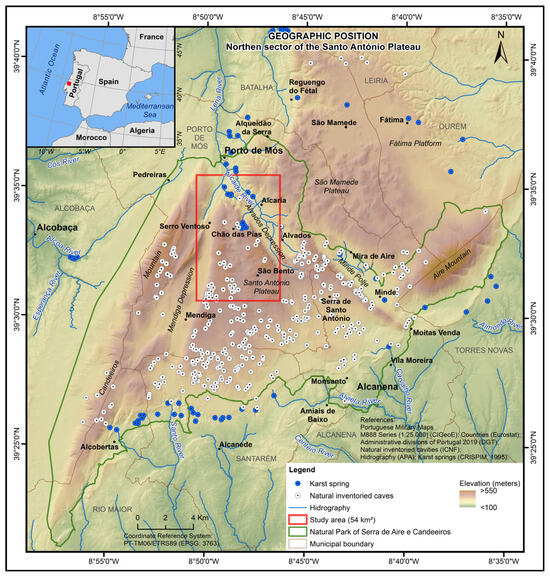
Figure 1.
Location map of the study area indicating terrain elevation, local administrative boundaries, karstic springs, and the entrance of known caves.
Geologically, the Estremadura Limestone Massif corresponds to an extensive and thick outcrop of Jurassic carbonate units that characterise the central sector of the Mesozoic Lusitanian Basin [60,61]. From a morpho-structural perspective, this massif comprises a set of limestone mountain ranges and plateaus, measuring approximately 36 km from north to south, with a maximum width of 23 km [62]. Martins [49] described its shape as an iron spear, pointing to SW, where the coincidence between lithology and hypsometry makes it peculiar. This massif corresponds to a large block that is slightly folded and raised owing to large fault systems. In particular, the Santo António Plateau has a flat surface to the southeast with an approximately triangular shape [18] and folds toward a syncline arrangement with a large radius of curvature [49]. To the north and northeast, it limits with the ‘Costa de Minde’ and ‘Costa de Alvados’ cliffs and to the west with the ‘Costa da Mendiga’ cliff (coincident with major faults). To the south, it limits with the Alcobertas depression, and in the southeast with the Arrifes fault and its escarpment. The northern sector of the plateau is higher, mainly due to tectonic uplift along the main regional faults (Minde, Alvados, and Mendiga). Internally, this plateau is quite fractured, with a predominance of accidents in the northwest–southeast direction and igneous rocks injecting some of these structures. The highest altitudes were recorded near the top of the Alvados, Minde, and Mendiga tectonic accidents [18,50].
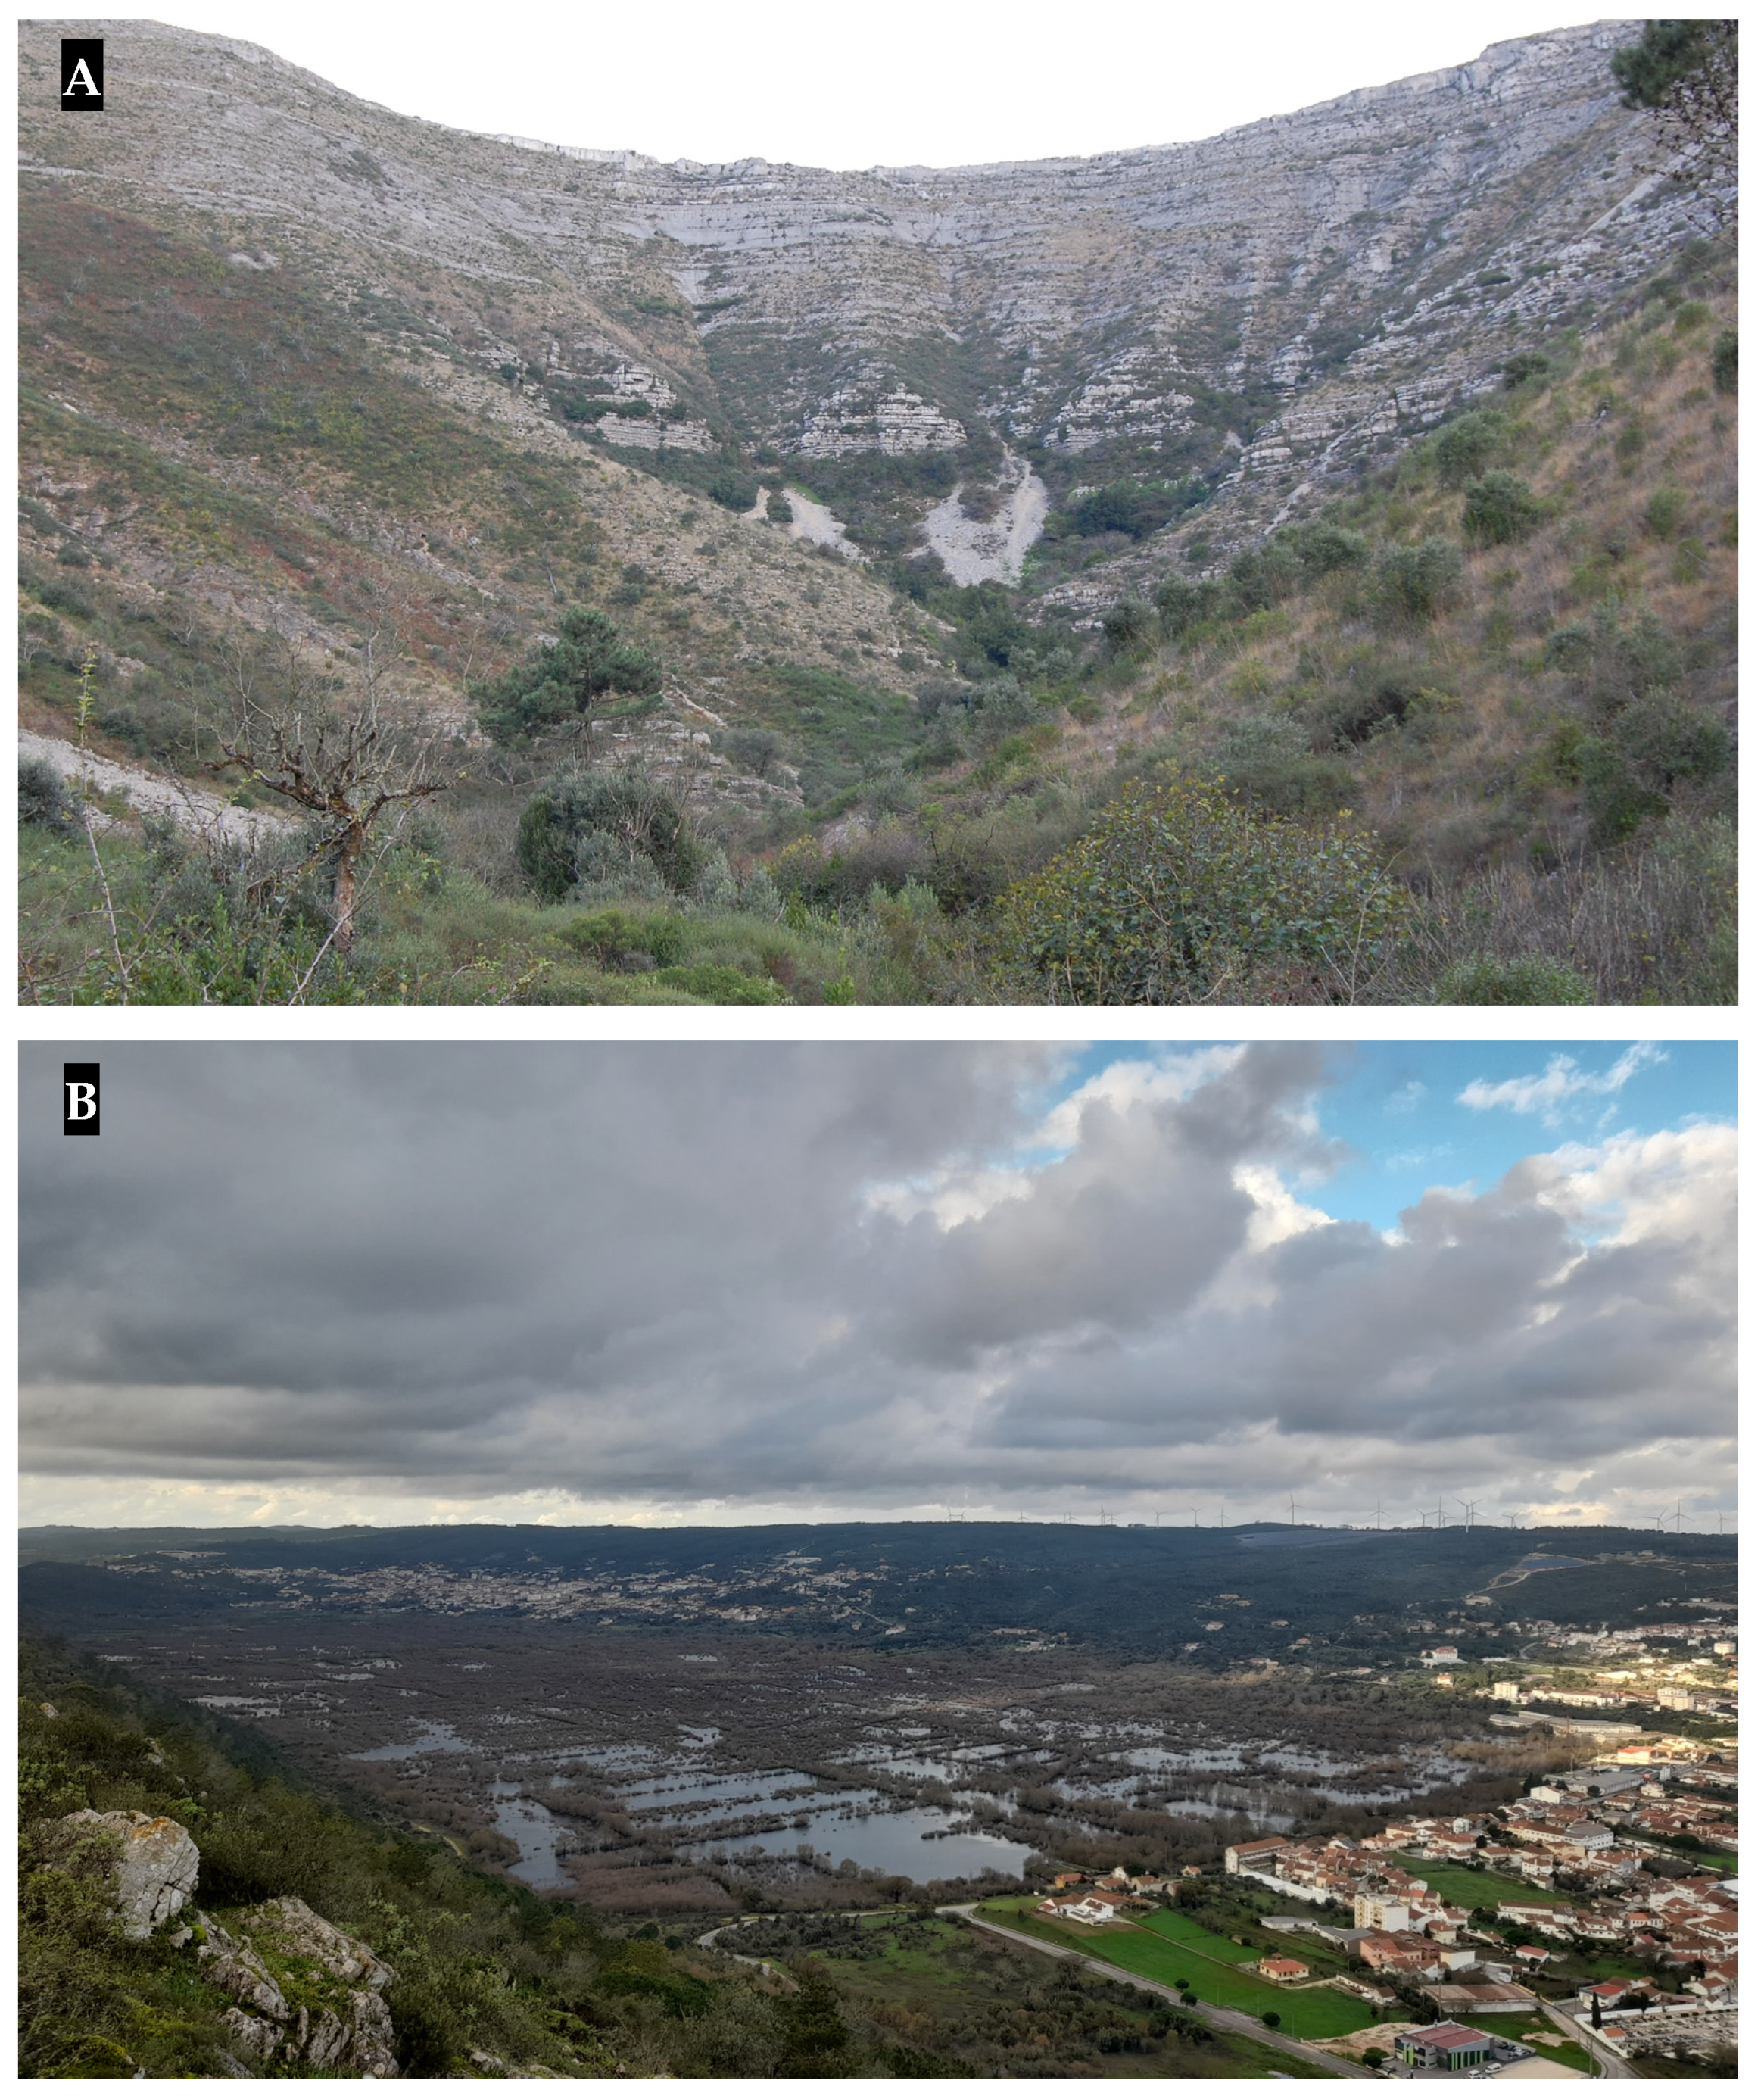
The Santo António Plateau is a well-studied area in terms of its geology, geomorphology, and speleology [17,18,49,51,52,54,55,56,57,59], which facilitated the construction and legitimisation of the model. Mainly, we relied on the Middle Jurassic carbonate facies characterised by Azerêdo [56], as well as the cave inventory job and previous assessment of lithostratigraphic units in terms of susceptibility to karstification carried out by Crispim [17,54]. In this plateau exists a profusion of surface and subsurface karst features, such as karren fields, dolines, uvalas, poljes, stephead valleys (amphitheatres) (Figure 2), rock shelters, and caves (Figure 3) [18,49,53].

Figure 2.
Some examples of the most emblematic surface karst features in the study area. (A) Stephead Valley (amphitheatres); (B) Mira-Minde Polje partially flooded in the winter of 2022.
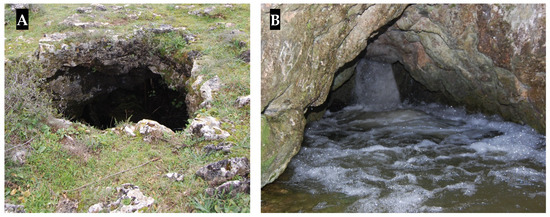
Figure 3.
Some examples of the subsurface karst features in the study area. (A) One entrance of ‘The Four Mouths Cave’; (B) Temporary karstic spring.
Martins [49] mentioned that the underground forms in the Estremadura Limestone Massif are more evolved than those from the surface and must, therefore, be older. Speleological exploration revealed that the local caves are connected to complex networks of underground conduits and extensive galleries. Some of these caves have often been indicated to be part of a much more extensive underground network [52,55], clearly showing the likeliness of a well-developed and mature endokarst in the region. In the words of Fleury [51] ‘[…] This massif is a true sponge, increasingly corroded as one descends in-depth […]’.
3. Material and Methods
In the present study, specific conditioning factors of underground karstification affecting carbonate units in the northern sector of the Santo António Plateau were identified, analysed, and weighted (Table 1).

Table 1.
Geodatabase constructed using GIS tools to obtain the chosen conditioning factors for the cartographic model to identify the endokarst potential in the study area.
We built a cartographic model based on AHP [63,64,65]. This MCDM method was chosen because of its intrinsic ability to approximate human perception, making it more friendly for decision-makers, as demonstrated by numerous prior investigations’ results [32,33,34,66,67].
The model’s predictive capacity was evaluated and verified based on known cave entrance locations. The degree of dependency (correlation) between these components was obtained by analysing the receiver operating characteristic (ROC) curve together with the associated metric corresponding to the area under the curve (AUC) [68,69].
3.1. Data Collection and Pre-Processing
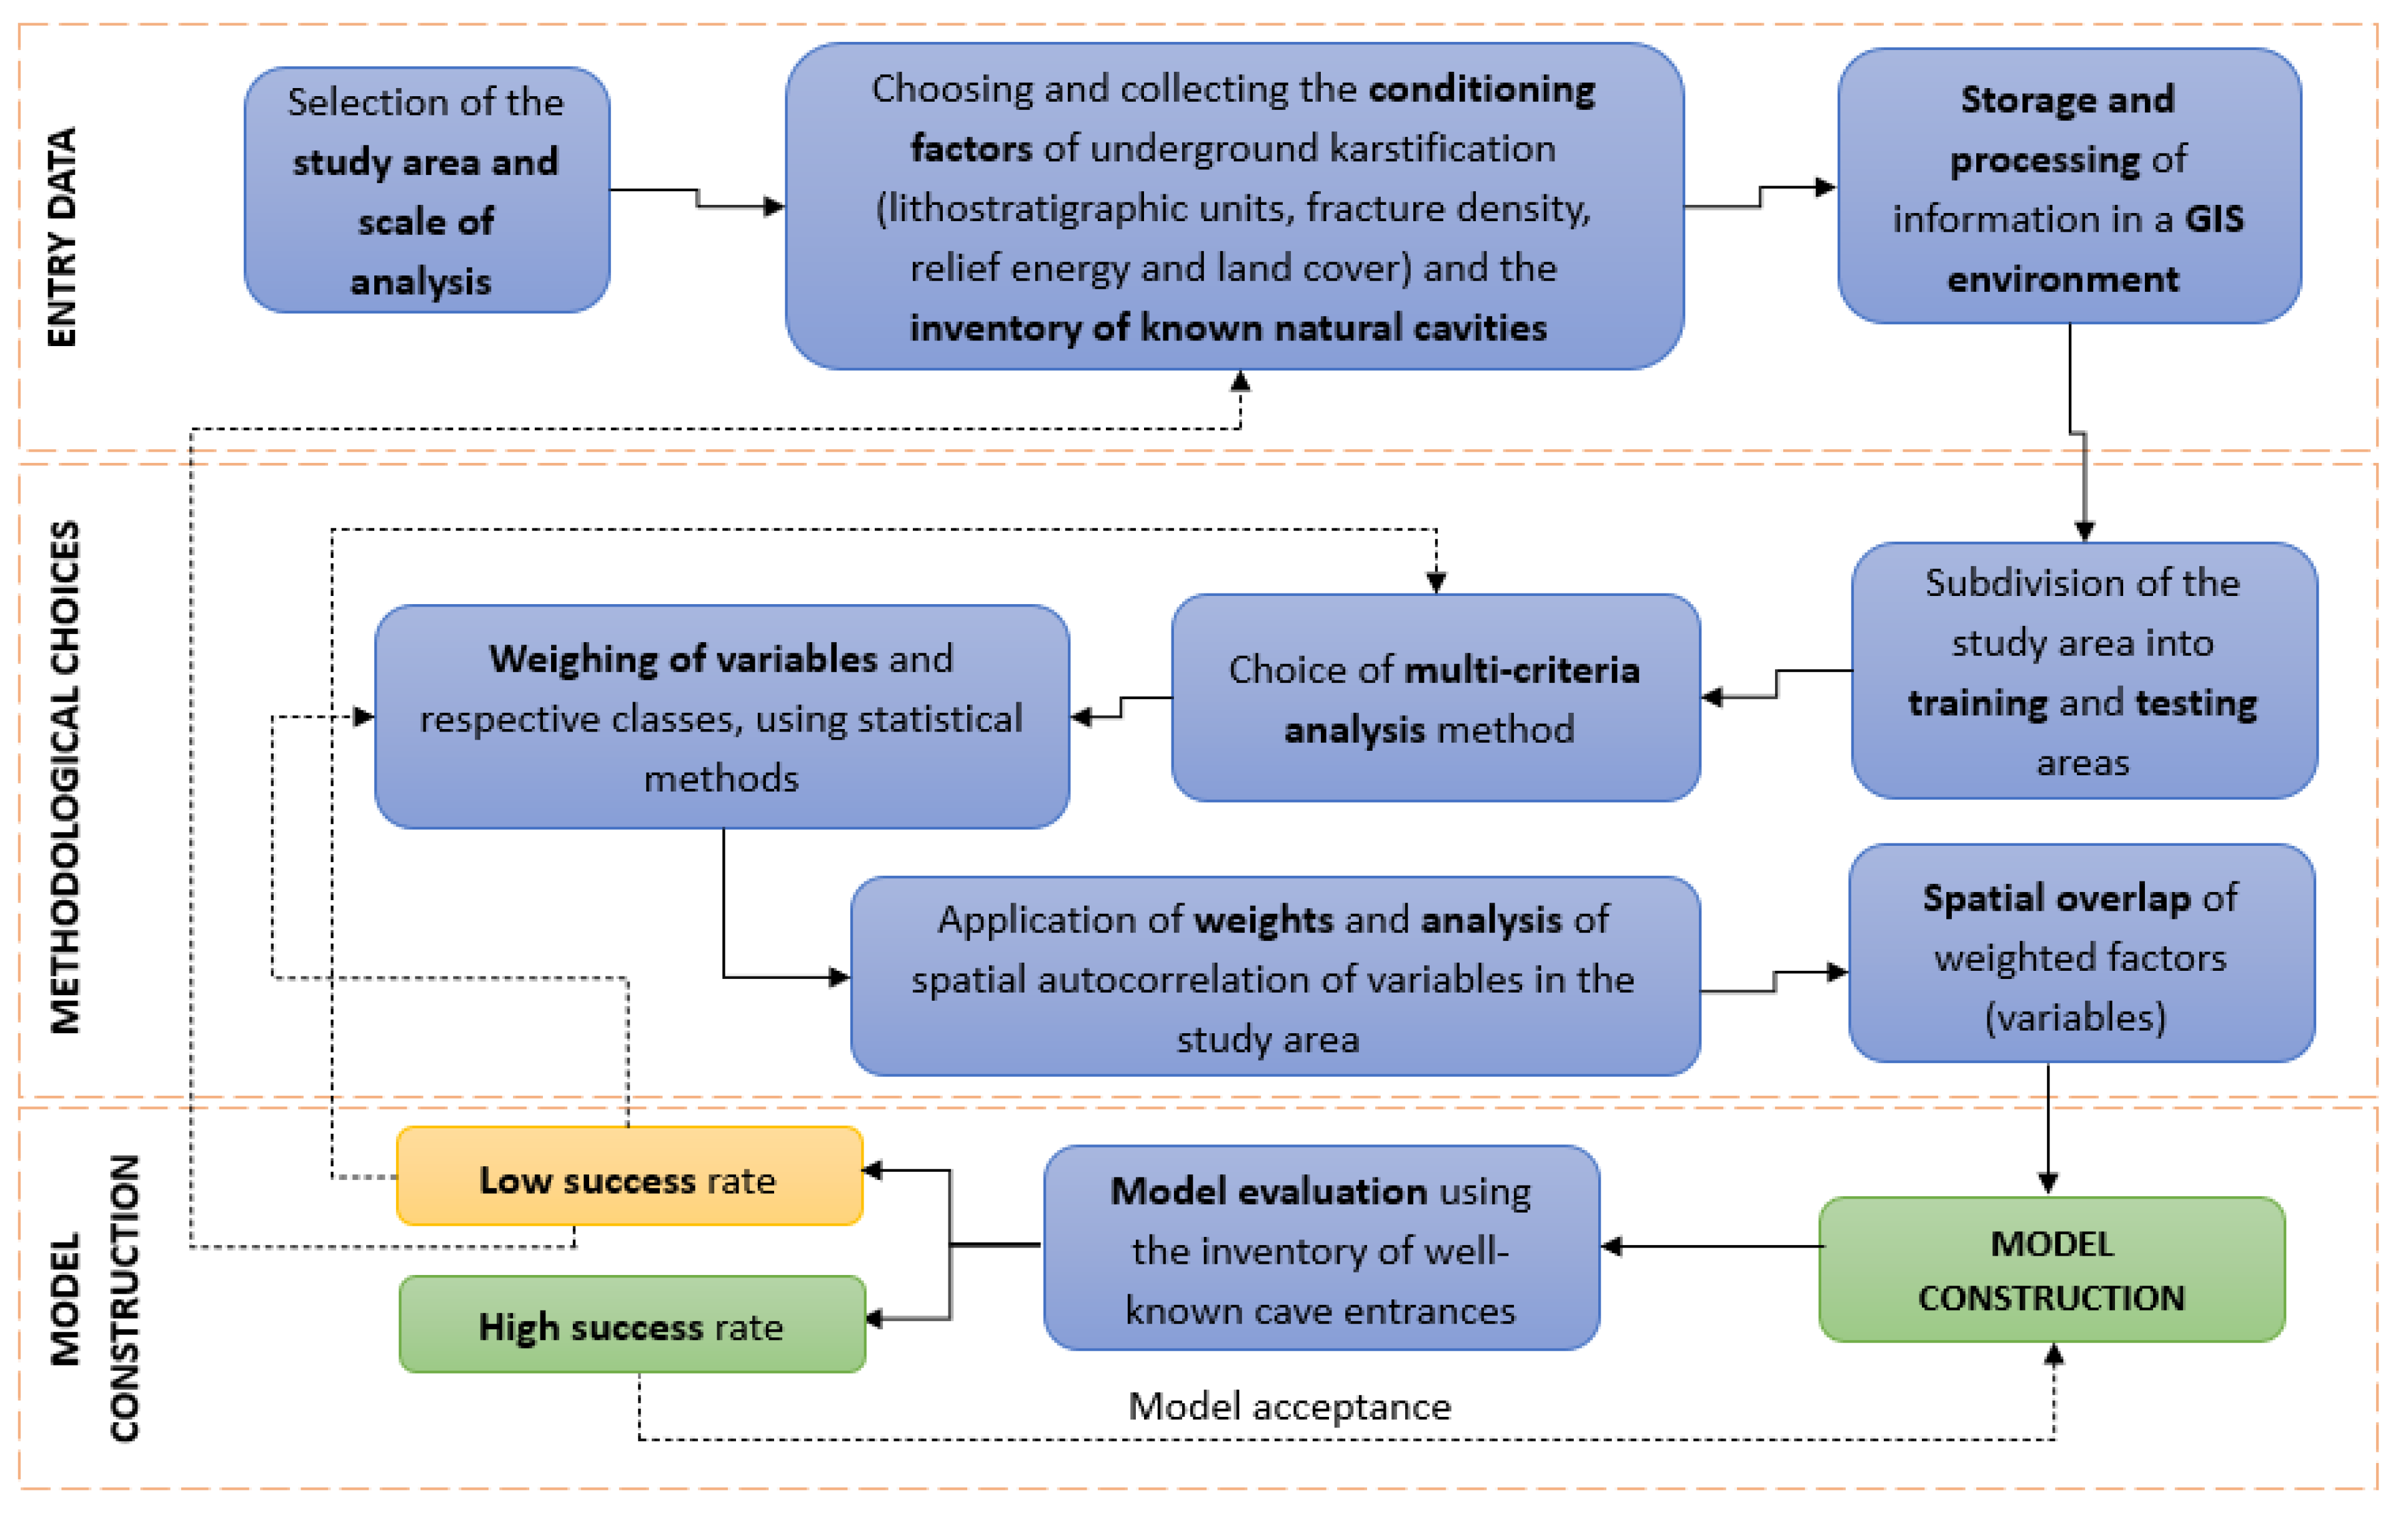
The methodology adopted in this study is shown in Figure 4. We began by researching the sources of information that allowed us to select an area of study adequate for our objectives (e.g., with known georeferenced endokarst details). We then exhaustively collected all the information to build the model: geological (including lithology, with related faciological/stratonomic characteristics, strata geometry, and tectonic structures), topographic, hydrogeological, and land cover data. Four conditioning factors were extracted from these collected data: lithostratigraphic units, fracture density, relief energy, and land cover (Table 1).
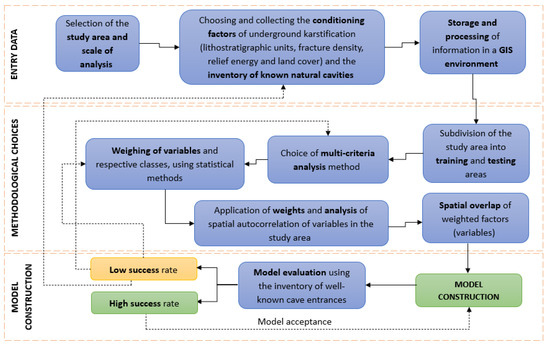
Figure 4.
Methodological flowchart adopted in this work to construct and evaluate the endokarst potential cartographic model of the study area.
However, it is essential to highlight that other factors associated with the dynamics of underground water circulation and the chemical properties of these waters may influence the occurrence of karstic caves. For instance, chemically aggressive waters retained in confined aquifers can be crucial in developing caves (speleogenesis) [1,2,70]. For the study area, the few available hydrochemical and underground water circulation data [17] did not allow us to construct an adequate cartography of these conditioning factors to be included in the modelling process. However, we verified that several studies that intended to determine/map areas more susceptible to deep karstification selected the same conditioning factors as us [36,38,71,72,73,74]. In some studies with slightly different objectives, factors associated with precipitation or temperature were considered, as the meteoric water temperature influences carbonate rocks’ dissolution [36,72]. Considering the small dimensions of the study area (Figure 1), using these additional factors would be unwarranted because there would be no significant spatial differentiation [43,72].
Regarding the chosen conditioning factors (Table 1), the lithostratigraphic units permit the evaluation of susceptibility to karstification of each unit based on lithology, facies identification (granulometry, texture, and qualitative porosity), stratonomic characteristics, and strata geometry. The stratigraphic information and some aspects related to the strata geometry (strike and dip) were obtained from the Geological Map of Portugal (Chart 27-A, Vila Nova de Ourém, at a 1:50,000 scale) and Crispim’s work [17]. Additionally, we obtained information concerning the characterisation of the carbonate facies from Azerêdo [56,57,75]. Data on the qualitative porosity of several sample rocks related to facies identified and characterised by Azerêdo [56] were obtained from Inês’s work [58].
Data related to the faults (major, hidden, and probable faults) were obtained from the Geological Map of Portugal (Chart 27-A Vila Nova de Ourém), whereas joints and lineaments were obtained from Carvalho’s work [59]. The calculation of fracture density, quantified as km of fracture per km2, was performed using the Line Density tool in ArcGIS (ESRITM) for two groups of fractures: the ‘faults’ and ‘joints and lineaments’ groups.
Relief energy was determined as the difference between the terrain elevation and local base level in each drainage sector [2,76]. Elevation data were obtained from a digital elevation model constructed using topographic data at a 1:10,000 scale. The limits of the drainage sectors and the elevation of the local base level were obtained from Crispim [17] using the positions of the karstic springs associated with each drainage sector. These data were digitalised from maps (~1:50,000 scale) included in Crispim’s work [17].
Land cover was obtained from the National Land Cover Map of 2018 (1:25,000 scale), and the most generic category of classes (Level 1) was used since they are easily comparable in describing the land cover types.
We also used information on the locations of known cave entrances inventoried by groups of speleologists over the last five decades. These caves allowed us to evaluate the performance of the cartographic model by analysing the spatial overlap between the obtained endokarst potential and the location of the known cave entrances.
To integrate cartographic information (with various scales and resolutions) into the modelling process, we built a set of raster thematic layers used as input variables with a homogeneous spatial resolution of 5 m pixels (see Table 1).
3.2. Model-Building Strategy
After collecting all the information, choosing the best analysis method was essential. As we had several influencing factors to consider with both quantitative and qualitative data, it was necessary to use a multi-criteria analysis [35,36,37,38,71,72,73,74,77,78]. We integrated multi-criteria analysis with a cartographic predictive model and subdivided the study area into training (1/3 of the study area) and testing (2/3 of the study area) subsets of data. The small size of the study area and the existence of two distinct areas—one with a typical karst environment and many inventoried karstic caves and another with few karst characteristics and no inventoried karstic caves—conditioned the delimitation of the training and testing areas. The training area was delimited to have a high concentration of caves and simultaneously cover two existing environments (karst and non-karst). Splitting the data into training and testing areas gives an impression of the goodness-of-fit of the model and its ability to predict new data; therefore, it indicates its generality and transferability [79,80]. The training area must represent a sample of the study area, including criteria-related data and data used for the assessment (inventoried caves) (Figure 4).
In the AHP, pairwise comparisons make it easier and more accurate to assign a preference between only two alternatives (factors/criteria) considering a given objective. The AHP uses a ratio scale from 1 to 9 associated with qualitative everyday life appreciation, where the operator makes a judgment, resulting in a quotient a/b that represents the dominance of a criterion over another (Table 2) [66,67,81].
Table 2.
Saaty’s 1–9 scale of pairwise comparisons (Saaty [81]).
These pairwise comparisons are stored in a reciprocal matrix, where a normalised eigenvector (scale 0–1) represents the weight () of each factor for the objective (eigenvalue method) (Table 3). A consistency index is applied for priorities to make sense, which cannot exceed 10% [63,81]. The AHP uses a logical procedure based on justifiable axioms, making it a robust method [67,81]. It is scalable, with a hierarchical structure that can be easily adjusted to fit many-sized problems and is not data-intensive. Compared to some well-known MCDM (e.g., PROMETHEE, MAUT, TOPSIS, ELECTRE), with AHP, the decision-maker takes the lead in establishing preferences and assigns weights [32,33,34].
Table 3.
Pairwise comparison matrix and calculation of the normalised eigenvector (adapted from Saaty [81]).
However, in AHP, structuring occurs when criteria have many sub-criteria, and the decision-maker tends to give more weight than when they are less detailed. In our study, we implemented three criteria with five sub-criteria and one criterion (land cover) with seven classes (see Figure 5), minimising this problem. There are also some issues related to judgment scales. The linear 1–9 scale can represent a problem because of the lack of sensitivity in situations where weights are unequally dispersed; a high concentration in certain weights coexists with a high dispersion of others. Several alternative scales have been proposed to solve this problem, but choosing one is tricky because AHP is mainly related to subjective issues [66,82]. We used a linear scale to consider the relatively homogenous nature of our judgment scales. However, the software application used, based on Microsoft® Excel® 2016 and developed by Goepel [83], allows employing other scales (e.g., logarithmic, square root, balanced-n). Rank reversal is one of the biggest criticisms of the AHP [32]; for example, if a criterion alternative is added or another is removed, the rank order of preferences can change. To avoid rank reversal (detectable in the aggregation of individual judgments), several authors have proposed the calculation of normalised weights using the geometric means (Formula (1)) instead of the eigenvalue method because the former indicates the central tendency and provides the same ranking [66]. The Goepel’s application implements the geometric mean method.
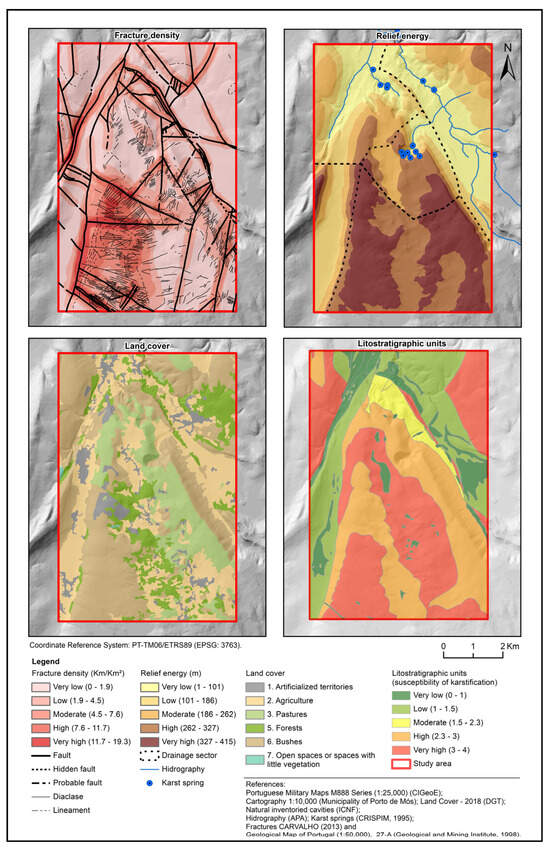
Figure 5.
Chosen karstification conditioning factors for the northern sector of the Santo António Plateau.
Implementing the AHP allowed us to consider our chosen conditioning factors (criteria) with a pairwise comparison for all factor classes (sub-criteria) and between the factors for a common objective to assess potential underground karstification. The karstification susceptibility assessment of lithostratigraphic units, in agreement with several authors [2,70,84]; and references included therein], was based on the following assumptions: (1) we considered the purest carbonate rocks, with the highest percentage of calcite, to be more susceptible to karstification (e.g., limestones are more susceptible of karstification than dolostones); (2) we considered the influence of the insoluble constituents’ present, e.g., clay minerals decreased the susceptibility to karstification and quartz grains increased rock porosity and the susceptibility to karstification; (3) as texture and granulometry are very dependent on the type of carbonate facies, we evaluated them together, and micritic and matrix-supported textures were considered more susceptible to karstification than sparitic and grain-supported ones; (4) the stratonomic data allowed an analysis of the lithostratigraphic units as a whole, highlighting other characteristics that enhance karstification but are not perceptible in the simple individual assessment of lithologies and facies—there was greater susceptibility to karstification in carbonate successions with relatively homogeneous beds in comparison with the more heterogeneous successions, which, together with the soluble strata, interstratify other relatively more insoluble layers (such as quartz sandstones, marls, and more or less carbonaceous mudstones); and (5) in terms of the carbonate bed geometry, we considered that the less inclined beds caused a slower circulation of water in depth, thus providing a higher rate of dissolution; even any stratification joints, more or less thick, could act as a barrier to vertical water circulation, thereby enabling a relatively more horizontal circulation that takes advantage of the stratification planes.
There was a need to disaggregate the lithological information available for the study area to retain the data related to the characteristics influencing karstification more clearly and address the predefined theoretical assumptions supported by the literature [2,70,76,85,86,87]. In particular, the analysis of lithostratigraphic units focused on assessing their susceptibility to karstification using descriptions and associations related to lithology, facies type, granulometry, texture, stratonomic characteristics, primary (apparent) porosity, and bedding geometry. These components were individually evaluated on a quantitative scale (0–1) for greater or lesser susceptibility to karstification, indicating the susceptibility of each lithostratigraphic unit on a 0 to 4 quantitative scale and five corresponding qualitative classes: 0–1 (Very low), 1–1.5 (Low), 1.5–2.3 (Moderate), 2.3–3 (High), and 3–4 (Very high) (see Table 4).
Table 4.
Assessment of susceptibility to karstification of the lithostratigraphic units. Carbonate facies characterisation by Azerêdo [56,57]. Apparent porosity generally was extracted by Inês [58] or was evaluated based on the type of lithology, granulometry, and texture.
Around tectonic structures, a greater spatial density of the fractures, related to the frequency with which faults, joints and simple lineaments occur, and the presence of intersection zones between them, clearly indicate areas with greater capacity for water infiltration in-depth and the possibility to guide the development of caves [2,70,90]. We considered that a greater or lesser propensity for water infiltration was associated with the fracture type. Slightly different criteria were used to calculate the density between the ‘faults’ and ‘joints + lineaments’ groups in a GIS: we applied a search radius of 200 m to the ‘faults’ group, assuming a greater concentration of water infiltration for the ‘joints + lineaments’ group, and we applied a survey radius of 600 m, taking a more diffuse water concentration. This exercise resulted in two raster maps used for the definitive calculation of fracture density using Formula (2) and the ArcGIS raster calculation tool.
Fracture density (km/km2) was ranked into five qualitative classes (from Very Low to Very High) using the ArcGIS natural-breaks classification method (Figure 5).
The potential energy available for the development of karstic caves has a component that represents the difference between the altitude of the terrain and that of the karstic spring(s), which is associated with the local base level in a specific groundwater circulation sector (i.e., drainage sector) of the carbonate massif [2,76]. This indicator is relevant for assessing the importance of topography in underground karstification and is referred to as relief energy hereafter. Figure 5 shows the relief energy ranked into five classes obtained through the ArcGIS natural-breaks classification method. We assumed that the altimetric difference was a driving force (potential energy) in terms of topography. This force influences the hydrodynamic capacity of the water running through the interior of the rock mass, with an evident influence on the development of karstification. Thus, the relief energy represents the role of topography as a driving force in karstification [2,36,76].
The land cover type also influences karstification. Meteoric waters are acidified in areas covered by soil and vegetation, and their percolation is slower, enhancing carbonate rocks’ dissolution. We considered that dissolution was enhanced in forest areas, pastures, and agricultural fields. In bush and uncovered areas, karstification dynamics are closer to those of bare karst, as the influence of these land cover types on chemical properties is reduced (although some influence exists in bush areas) [36,87,91]. In artificialised territories, soil sealing does not enhance karstification; however, this land cover type can only influence the development of current karstification and not the endokarst forms developed over geological time without anthropogenic action (Figure 5).
The known cave entrances allowed us to verify the predictive capacity of the cartographic model built by correlating the endokarst potential results with the referred entrances’ location and analysing the ROC curves [68,69,92,93].
In the first phase of AHP implementation, we weighted the classes of the four karstification factors using a pairwise comparison based on the assessment of karst territory experts—speleologists, geomorphologists, and geologists—after which we made pairwise comparisons between the factors. The quality of these comparisons was denoted by a consistency ratio, which was lower than 0.10 for all cases in this study, indicating satisfactory results. The relative weight of each factor (Wi) indicates the order of priority for each class associated with a factor and between factors (Table 5, Table 6, Table 7, Table 8 and Table 9); two classes may have the same weight when they are considered to have the same magnitude of importance, as is the case with the relief energy classes ‘Very high’ and ‘High’. Expectedly, for lithostratigraphic units, fracture density, and relief energy, ‘Very high’ and ‘High’ classes amounted for more than 60% of the importance to underground karstification. For the land cover, the ‘Forests’ category represented ~30%, and the ‘Pastures’ category 22% (Table 5, Table 6, Table 7 and Table 8). When comparing factors, the lithostratigraphic units had almost 50% importance, with fracture density 31%, relief energy 13%, and land cover residual importance 8% (Table 9).
Table 5.
Pairwise comparison for susceptibility to karstification classes of the lithostratigraphic units.
Table 6.
Pairwise comparison for fracture density classes.
Table 7.
Pairwise comparison for relief energy classes.
Table 8.
Pairwise comparison for land cover types.
Table 9.
Pairwise comparison for karstification conditioning factors.
The geographic information layers (in raster format) corresponding to each karstification factor (Figure 5) were considered to model the endokarst potential, and after reclassification, their classes coincided with the normalised Wi. Using a GIS, we calculated the endokarst potential with the following formula:
The adequacy of the model was verified through the spatial confrontation of the results and the known cave entrance. The predictive capacity of the model was verified based on the analysis of the ROC curves and the AUC, elaborated using the results of the binomial endokarst potential and the location of the cave entrances in both the training and testing subareas, as well as in the entire study area. In each ROC curve, the endokarst potential is represented in decreasing order on the abscissa axis. At the same time, a cumulative distribution function of the inventoried caves (with the data split into 20 classes) is represented on the ordinate axis. The variables have no dependence relationship if the ‘curve’ translates into a diagonal. A quick inflexion of the curve in the positive direction to that diagonal indicates that the model performs well; if the curve inflects in the negative direction, the model performs poorly and is considered unacceptable [68,69,92,93]. The AUC value allows a quantitative assessment of the model’s predictive capacity. The AUC values go from 0% to 100% (or 0 to 1), with values closer to 100% indicating a greater predictive capacity. The value of 50% graphically coincides with the diagonal line representing a casual predictive capacity. Values below 50% express a worse predictive capacity than a random model, and the corresponding model cannot be considered acceptable [68]. To assess the predictive capacity of the cartographic model built, we used the values adopted in studies related to natural hazards (e.g., susceptibility to landslides), particularly those by Guzzeti et al. [93] and Oliveira [69]. In these investigations, AUC values between 75% and 80% indicated an acceptable model, values between 80% and 90% stated a very good model, and values greater than 90% indicated an excellent model.
In general terms, we attempted to improve the spatial database whenever possible to construct the endokarst potential cartographic model in the study area. The components for assessing the susceptibility to karstification of the lithostratigraphic units were fine-tuned after more accurate literature research. Moreover, acquiring more data on the drainage sectors improved the relief energy calculation. This approach led us to obtain promising results and reduce the subjectivity inherent to the AHP.
4. Results and Discussion
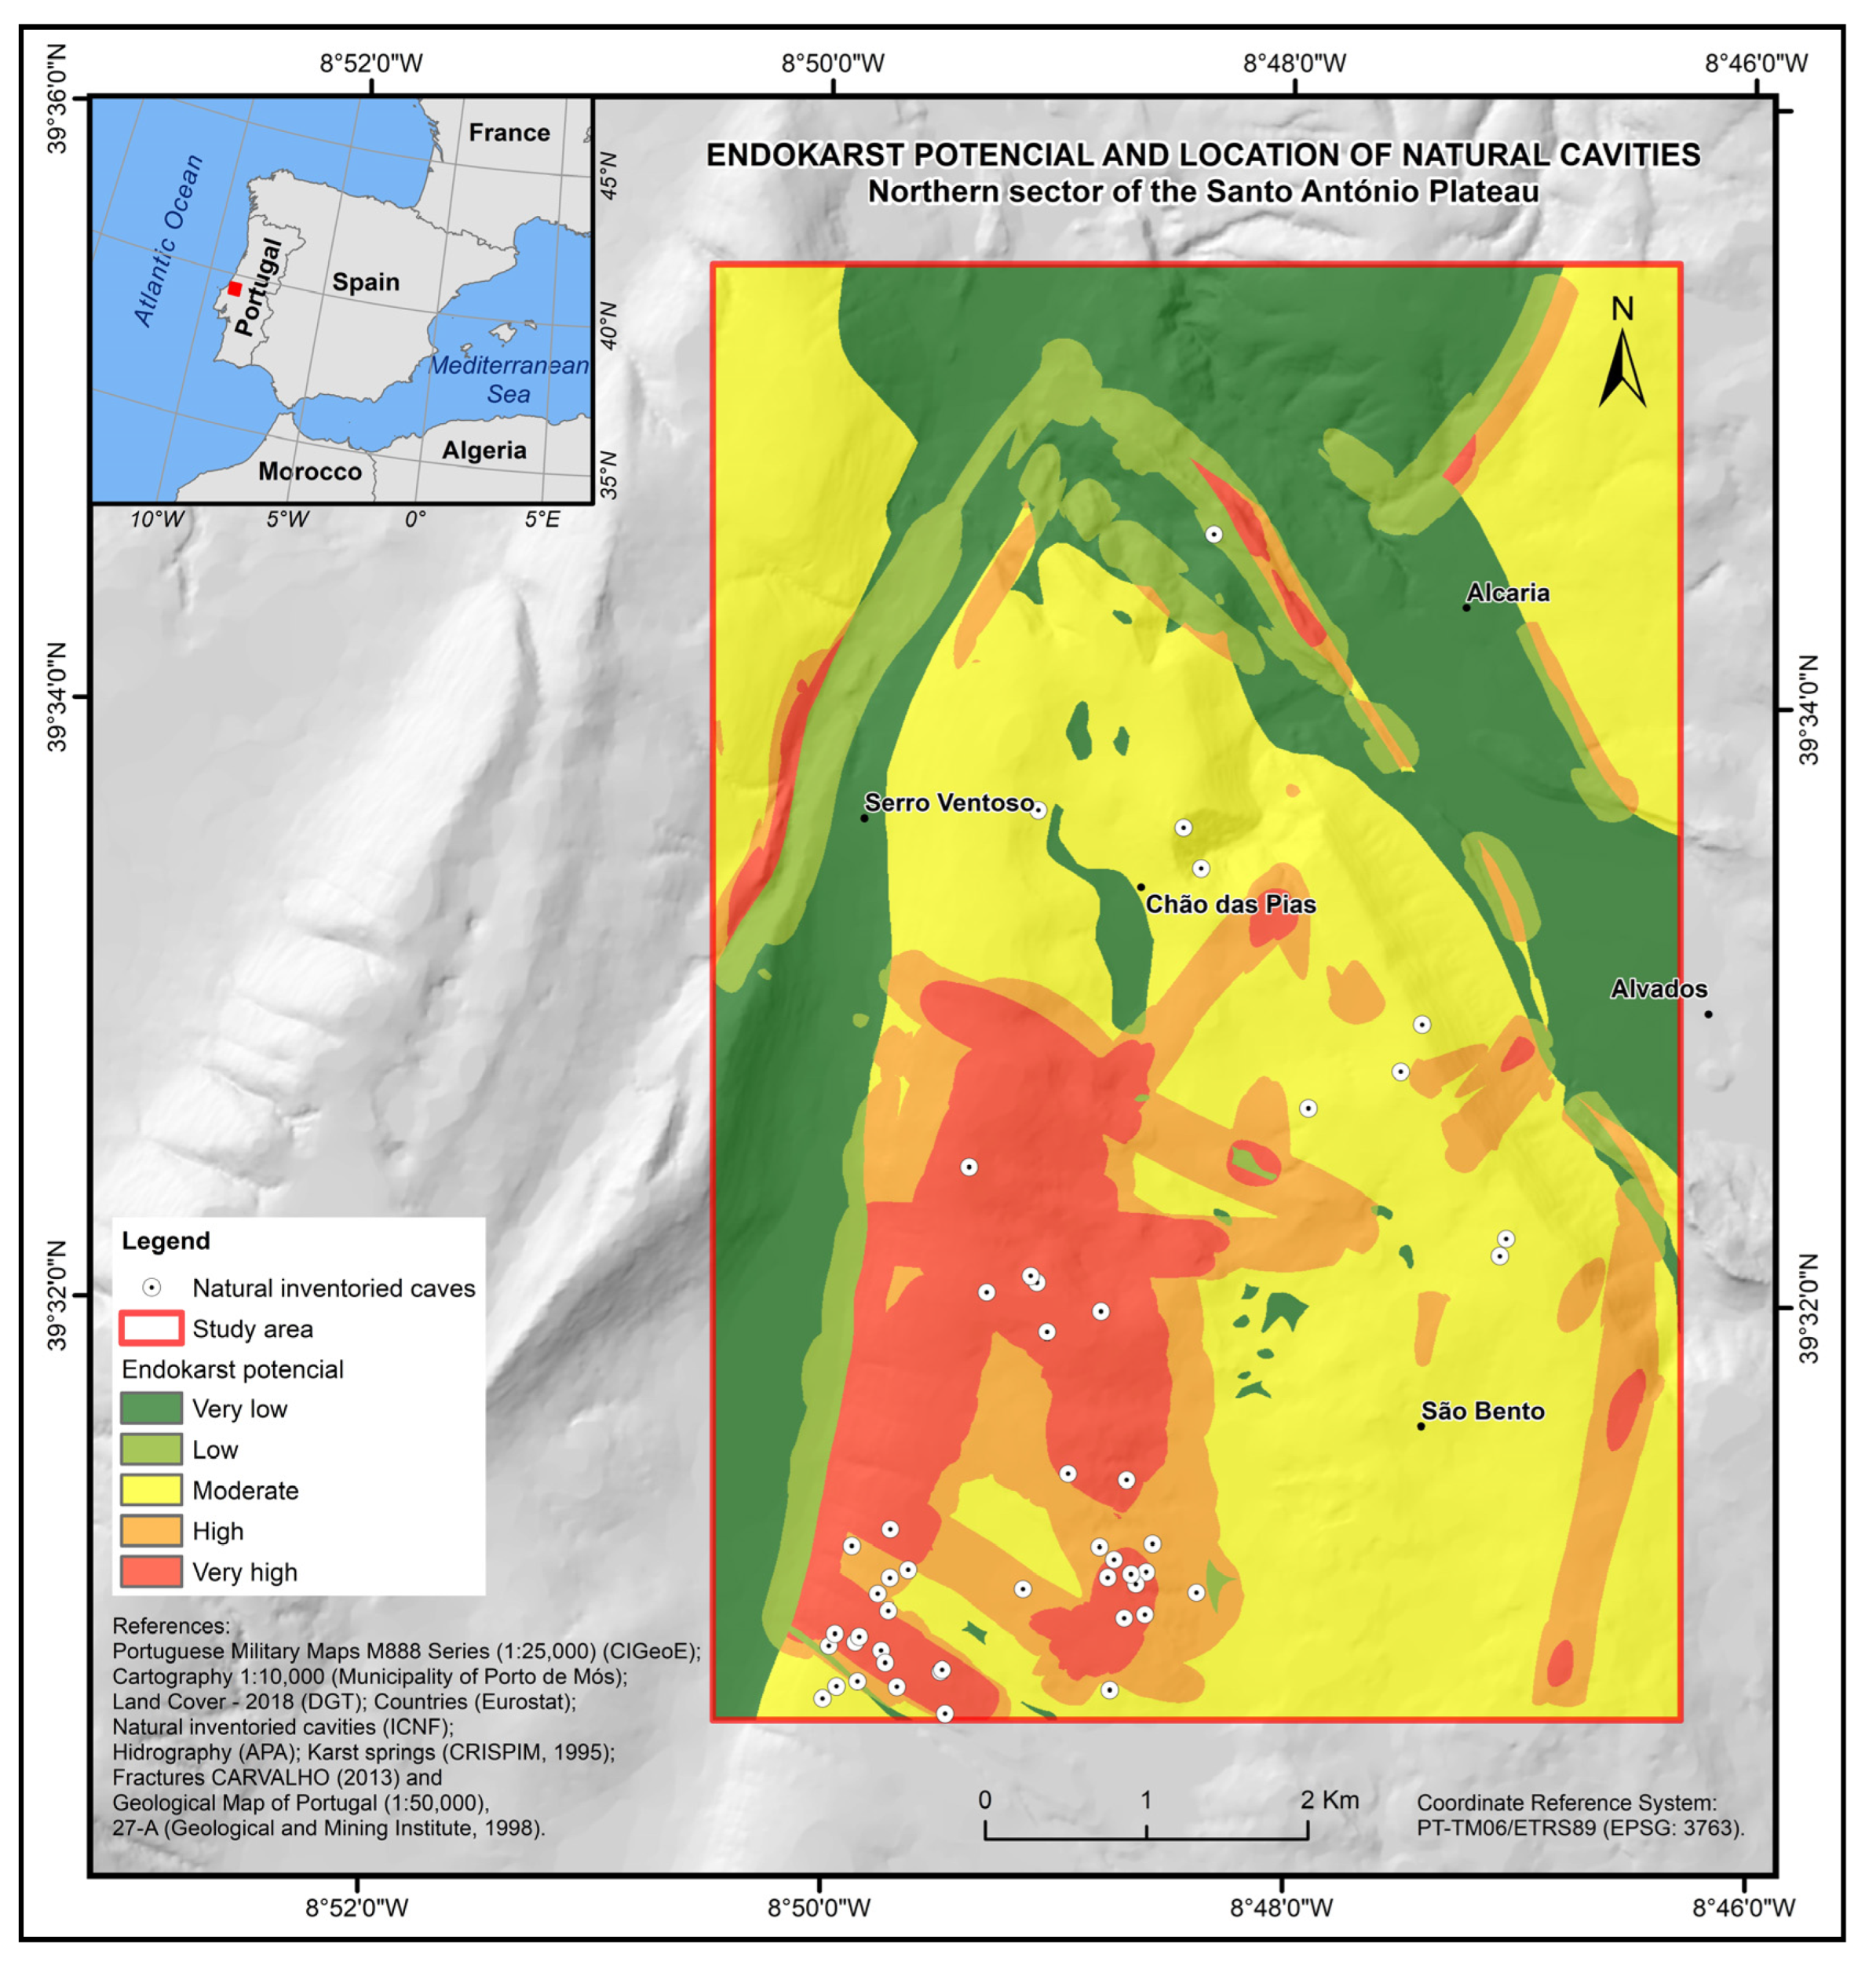
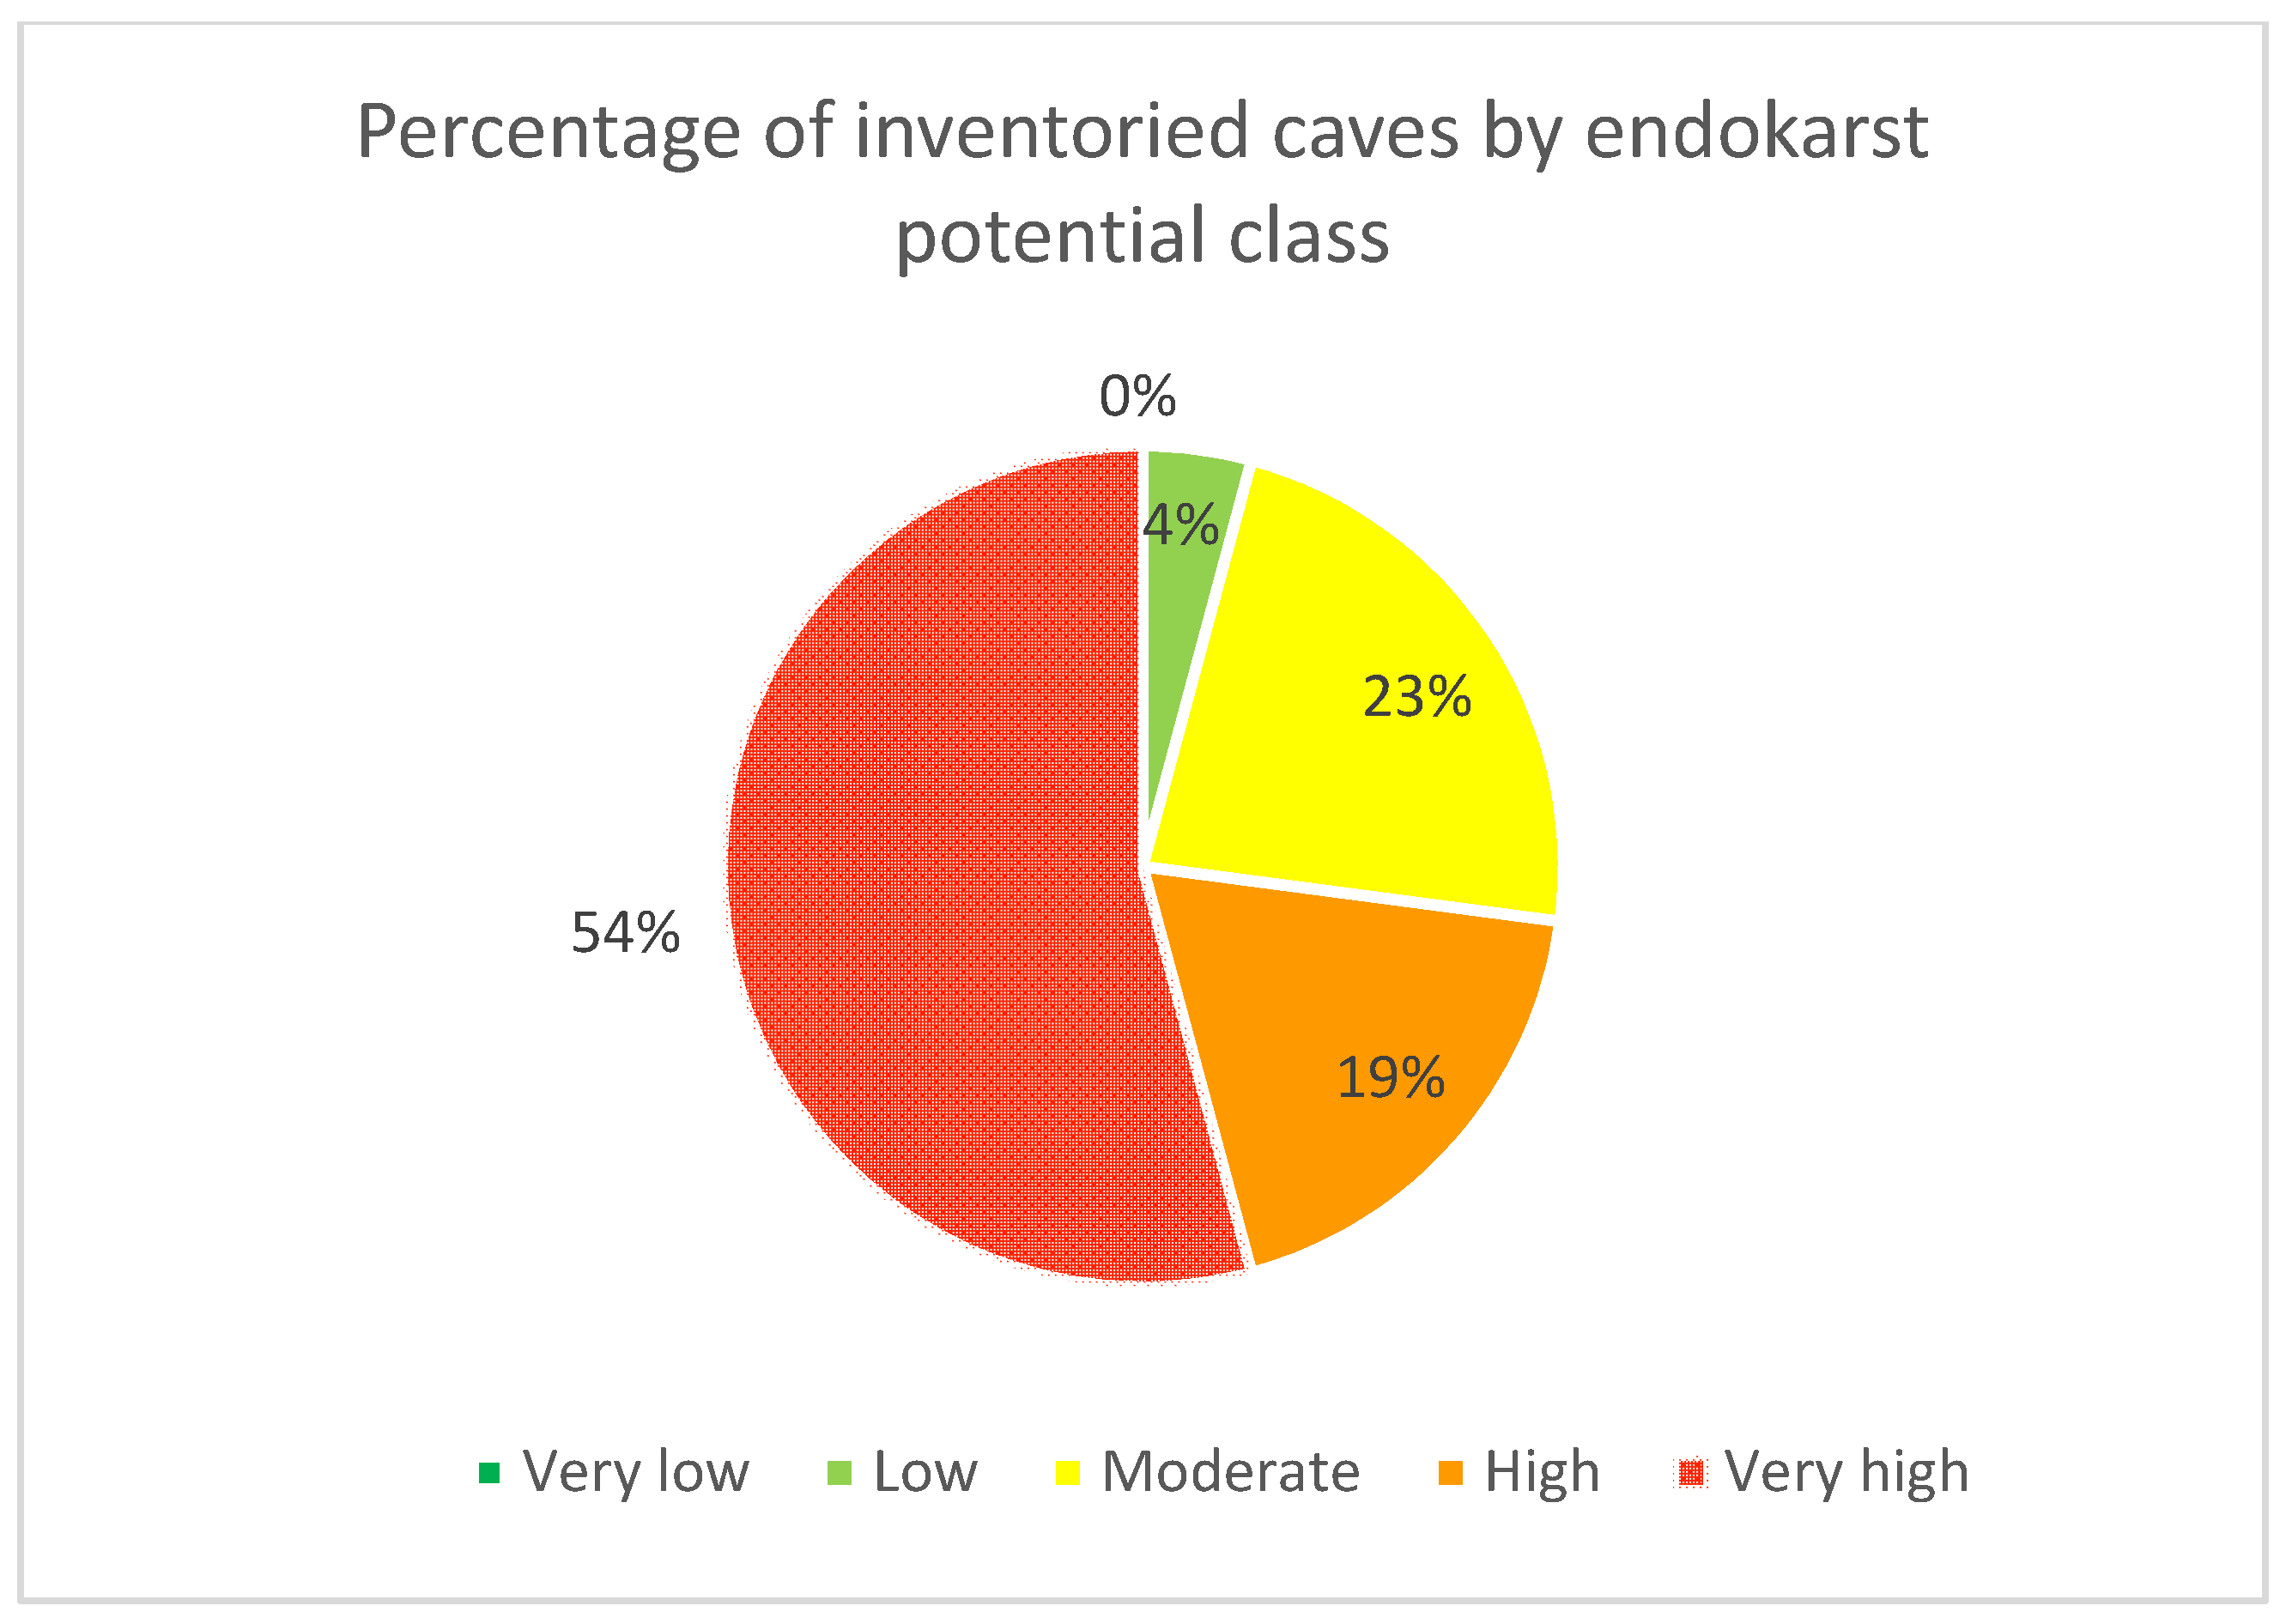
From the analysis of the cartographic model developed for the endokarst potential of the study area, overlapped by the location of the entrances of the known caves (Figure 6), we verified that the weights attributed through the AHP are consistent since most (73%) of these entrances fall within the classes of “Very High” or “High” endokarst potential (Figure 7). Conversely, no cave entrances are in the areas classified as having ‘Very Low’ endokarst potential. In contrast to this promising result, a considerable area northwest of São Bento and other sectors distributed throughout the territory under investigation were also classified as ‘Very High’ or ‘High’ despite not having known cave entrances. If the present assessment is valid, we should consider that there may also be karstic caves in these sectors. We also observed that areas with higher elevation had greater endokarst potential in these areas, which may partly explain the distribution of known cave entrances. The used speleological data only referred to the locations of cave entrances that may belong to complex underground conduit systems. Thus, a more adequate analysis of the results could be achieved using topographic data that allowed mapping the development of these systems and comparing them with the produced model. Furthermore, the inventory of cave entrance locations concerns current knowledge (at least until February 2021); this distribution may be modified by discovering new caves, thus conditioning the model’s spatial validity.

Figure 6.
Endokarst potential map and location of the known cave entrance on the northern sector of the Santo António Plateau.

Figure 7.
Percentage of inventoried caves corresponding to each karstification potential class in the study area.
We observed a correlation between the lithostratigraphic units that were most susceptible to karstification and the cave entrances distribution, namely, in the micritic limestones of Serra de Aire (J2SA) and the limestones of Chão das Pias (J2CP), which represent 38.2% of the study area and contain approximately 63% of the known cave entrances. The marly limestones and marls of Fórnea (J1−2Fo), marls and marly limestones of Zambujal (J2ZA), and bioclastic limestones of Codaçal (J2Co), which occupy 31.26% of the area, contain approximately 35% of the cave entrances. By analysing these data, we confirmed the propensity for karstification of units belonging to the Middle Jurassic, which were also classified as the most susceptible to karstification (Table 4).
Table 10 presents data on the number of caves in each class of the chosen conditioning factors and their density per km2. Against expectations, we observed that the ‘Moderate’ and ‘High’ fracture density classes had more cave entrances than the ‘Very High’ class. Nevertheless, we verified a higher density of cave entrances in the ‘High’ and ‘Very High’ classes. When we analysed the spatial relationship between relief energy and the location of known cave entrances, we observed a more significant number of these in areas with greater potential energy relief, such as those in the ‘High’ and ‘Very High’ classes. It should also be noted that the highest density of cave entrances was higher for the ‘Very High’ class, leading us to conclude that there is a greater concentration of caves in sectors with higher relief energy. Finally, when considering land cover, we obtained different values than those expected. In the ‘Bushes’ class, a more significant number and greater density of cave entrances were observed than those in the ‘Forests’, ‘Pastures’, and ‘Agriculture’ classes. As there were apparent inconsistencies between the weighted classes for the factors analysed and the expected cave entrance’s locations, these results must be relativised owing to the low importance attributed to land cover and the good results obtained in the model assessment.
Table 10.
Number of caves in each class of the chosen condition factors and their density per km2.
In addition to the results obtained from the modelling process, we compared our endokarst potential map with data from another study with a similar theme in the same area. As a result of this comparative exercise, we verified that the units categorised as ‘Karstified Units’ by Crispim [17,54] overlap areas in the higher endokarst potential classes identified in the present study. Additionally, the decrease in endokarst potential corresponded to a decrease in these ‘Karstified Units’. Areas with ‘Very High’ endokarst potential overlap approximately 98% of the total area of ‘Karstified Units’, while ‘High’ endokarst potential areas overlap ‘Karstified Units’ at ~92%. Furthermore, ‘Moderate’ endokarst potential areas overlap ‘Karstified Units’ and ‘Weakly Karstified Units’ at ~93%, and ‘Low’ endokarst potential areas overlap ‘Moderately Karstified Units’ and ‘Weakly Karstified Units’ at ~70%. Finally, the ‘Very low’ endokarst potential class overlaps the units of ‘Moderately Karstified Units’, ‘Weakly Karstified Units’, ‘Non-karstified Units’, and ‘Non-karstifiable Units’ at ~52%.
As previously mentioned, the assessment/verification of the cartographic model was based on ROC curve analysis (Figure 8). Approximately 13% of the area classified with ‘Very High’ endokarst potential (87% to 100% in the abscissa axis) explains 70% of the area with cave entrances. In contrast, approximately 32% of the area with lower endokarst potential (‘Low’ and ‘Very Low’) explains only about 5% of the area with cave entrances. For the entire study area, the AUC value was 81.9%, thus considering the model as acceptable or with a good predictive capacity, regardless of whether other more robust and sophisticated analytical methodologies (such as artificial intelligence) may be used. A comparison of different methodologies is beyond the scope of this study.
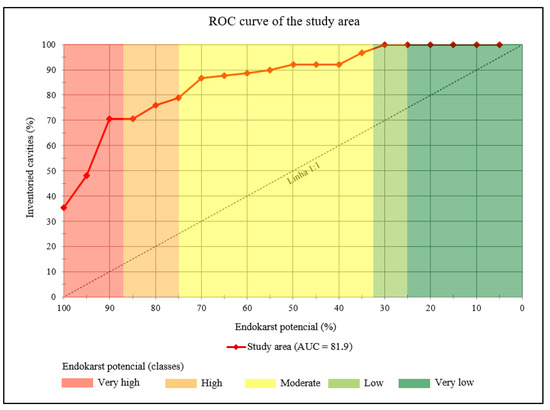
Figure 8.
ROC curve for the study area (more details in the text).
5. Conclusions
The endokarst potential of a carbonate massif depends on several conditioning factors that contribute differently to the underground karstification process and, as a rule, almost always work interdependently. Details associated with the carbonate strata (i.e., faciological/stratonomic and geometry characteristics) can determine a greater or lesser endokarst potential. For instance, relatively purer, finer-textured carbonate rocks in thicker and fewer dip strata enhance underground karstification at the local scale. An increase in the entry of meteoric water into the carbonate massif is intrinsically linked to the existence of fissures, such as fractures (faults + joints) and bedding planes. The hydraulic gradient enhances the velocity of these waters due to the altimetric difference between the input (e.g., cave entrances) and output points (karstic springs), which the relief energy can describe. How meteoric waters enter the rocky massif and circulate is of particular importance. It is also essential to characterise the existing cover (detrital siliciclastic cover, soil, vegetation). Endokarst potential is associated with the greater or lesser development of subterranean forms (caves) that sometimes have a surface expression.
The geological, topographic, hydrogeological and land cover characteristics of the northern sector of the Santo António Plateau (Estremadura Limestone Massif, Central Portugal) proved decisive for assessing endokarst potential. At the same time, the location of the known cave entrances was vital for the assessment/verification of the proposed cartographic model. Applying the same modelling process in larger areas of the Estremadura Limestone Massif and other karstified massifs of Portugal is essential to legitimate its extrapolation. It is also clear that the obtained cartographic result highly depends on the quality/quantity of the data on which it is based. The cartographic modelling process used in this study represents a correct and easy-to-use methodology for defining sectors in a carbonate massif with environmental vulnerability associated with karst hydrogeology, with more significant potential for hazards, and that (eventually) can be used in speleo-tourism activities. Indeed, from a practical perspective, it is relatively easy to compile existing geological information in official geological maps (lithology, strata geometry, tectonic structures), elevation data, and land cover cartography to implement an AHP. We attempted to reduce the subjectivity inherent in AHP by applying improvements in treating the used spatial geodatabase. Hence, we consider disseminating the used methodology the best way to improve it, and comparing its results with those of other methods will be necessary. It should be noted that the results obtained in this study refer to a local scale. In a small study area, the spatial distribution of some conditioning factors can be quite different from that in large territories. Data representation at different scales associated with different spatial and thematic accuracies presents a challenge when integrating into a multi-criteria analysis. Knowledge of the endokarst itself is critical, but the available speleological information generally only represents the entrances of the caves and not their extension.
Finally, we highlight the importance of our results for obtaining knowledge on the endokarst and what it represents for anthropogenic activity. Human occupation of karst territories requires intelligent territory planning and management. Still, the weaknesses inherent to the karst environment are often not considered, especially those regarding water resources, natural hazards, and mineral resource extraction. Indeed, many examples in Portugal (but not only) have demonstrated that karst dynamics can put people and property at risk; furthermore, karst environments have a very peculiar landscape, both at the surface and underground, which can be used for geotourism, scientific and educational activities.
Author Contributions
Conceptualisation, L.A.D. and L.C.; data curation, L.R., L.A.D. and L.C.; formal analysis, L.R., L.A.D. and L.C.; funding acquisition, L.A.D. and L.C.; investigation, L.R., L.A.D. and L.C.; methodology, L.R.; supervision, L.A.D. and L.C.; visualization, L.R.; writing—original draft, L.R., L.A.D. and L.C.; writing—review and editing, L.R., L.A.D. and L.C. All authors have read and agreed to the published version of the manuscript.
Funding
This research received support from the Centre of Studies in Geography and Spatial Planning (CEGOT), funded by national funds through the Foundation for Science and Technology (FCT) under the references UIDB/04084/2020 and UIDP/04084/2020.
Institutional Review Board Statement
Not applicable.
Informed Consent Statement
Not applicable.
Data Availability Statement
Land cover data can be found at https://snig.dgterritorio.gov.pt/, the National Registry of Geographic Data, where open data can be downloaded (Direção-Geral do Território®). Other datasets used for the present research will be available on request.
Acknowledgments
We thank Olimpio Martins from the Institute for the Conservation of Nature and Forests, I.P. (ICNF), for providing all the speleological data. We thank all speleologists who worked in the exploration and inventory of caves in the Estremadura Limestone Massif, mainly those belonging to the Portuguese Society of Speleology (SPE), Portuguese Federation of Speleology (FPE), and Speleology Nucleus of Leiria (NEL). We are equally grateful to the Porto de Mós City Council for supporting our research. The editor and anonymous reviewers are gratefully acknowledged for their constructive assessment, which helped improve the manuscript.
Conflicts of Interest
The authors declare no conflict of interest.
References
- White, W.B. Geomorphology and Hydrology of Karst Terrains; O.U.P.: New York, NY, USA, 1988. [Google Scholar]
- Ford, D.; Williams, P. Karst Geomorphology and Hydrology; John Wiley & Sons, Ltd.: Hoboken, NJ, USA, 2007. [Google Scholar]
- Dimuccio, A.L. A Carsificação Nas Colinas Dolomíticas a Sul de COIMBRA (Portugal Centro-Ocidental—Fáceis Deposicionais e Controlos Estratigráficos do (Paleo)Carso no Grupo de Coimbra (Jurássico Inferior). Ph.D. Thesis, Departamento de Ciências da Terra da Faculdade de Ciências e Tecnologia da Universidade de Coimbra, Coimbra, Portugal, 2014. [Google Scholar]
- Tomlin, C.D. Geographic Information Systems and Cartographic Modeling; Prentice-Hall: Englewood Cliffs, NJ, USA, 1990. [Google Scholar]
- Tomlin, C.D. Cartographic Modeling in International Encyclopedia of Geography. Am. Cancer Soc. 2017, 1–6. [Google Scholar] [CrossRef]
- De Smith, M.J.; Goodchild, M.F.; Longley, P.A. Geospatial analysis and model building. In Geospatial Analysis: A Comprehensive Guide to Principles, Techniques and Software Tools, 6th ed.; Winchelsea Press: London, UK, 2018. [Google Scholar]
- Bolstad, P.; Manson, S. Chapter 13: Spatial Models and Modeling. In GIS Fundamentals: A First Text on Geographic Information Systems, 7th ed.; Eider Press: Saint Paul, MN, USA, 2022; pp. 561–582. [Google Scholar]
- Church, R.L. Geographical information systems and location science. Comput. Oper. Res. 2002, 29, 541–562. [Google Scholar] [CrossRef]
- Longley, P.A.; Goodchild, M.F.; Maguire, D.J.; Rhind, D.W. Geographic Information Systems & Science, 3rd ed.; John Wiley & Sons: Hoboken, NJ, USA, 2011. [Google Scholar]
- Huang, B. Comprehensive Geographic Information Systems; Huang, B., Thomas, J.C., Ming-Hsiang, T., Eds.; GIS methods and techniques; Elsevier: Amsterdam, The Netherlands, 2018; Volume 1. [Google Scholar]
- Gao, J. Fundamentals of Spatial Analysis and Modelling, 1st ed.; CRC Press: Boca Raton, FL, USA, 2021. [Google Scholar]
- Jennings, J.N. Karst Geomorphology; Oxford Blackwell: Oxford, UK, 1985. [Google Scholar]
- Cunha, L. Geomorfologia Estrutural e Cársica. In O Quaternário em Portugal, Balanço e Perspectivas; Colibri: Lisboa, Portugal, 1993; pp. 63–74. Available online: https://www.researchgate.net/profile/Lucio-Cunha-2/publication/324088980_Geomorfologia_estrutural_e_carsica/links/5abd07990f7e9bfc0457a68b/Geomorfologia-estrutural-e-carsica.pdf (accessed on 15 May 2023).
- Palmer, A.N. Cave Geology; Allen Press: Lawrence, KS, USA, 2007. [Google Scholar]
- Dimuccio, L.A. Tempo e espaço num geossistema cársico: Os “pilares” em que assenta e se sustenta a interpretação da sua evolução geológicogeomorfológica. In Espaços e Tempos em Geografia: Homenagem a António Gama; Imprensa da Universidade de Coimbra: Coimbra, Portugal, 2017; pp. 207–238. [Google Scholar]
- De Waele, J.; Gutierrez, F. Karst Hydrogeology, Geomorphology and Caves; John Wiley & Sons Ltd.: Hoboken, NJ, USA, 2022. [Google Scholar]
- Crispim, J.A. Dinâmica Cársica e Implicações Ambientais nas Depressões de Alvados e Minde. Ph.D. Thesis, Faculdade de Ciências da Universidade de Lisboa, Departamento de Geologia, Lisboa, Portugal, 1995. [Google Scholar]
- Rodrigues, L.M.E. Evolução Geomorfológica Quaternária e Dinâmica Actual. Aplicações ao Ordenamento do Território. Exemplos no Maciço Calcário Estremenho. Ph.D. Thesis, Universidade de Lisboa, Lisboa, Portugal, 1998. [Google Scholar]
- Brilha, J. Património Geológico e Geoconservação a Conservação da Natureza na Sua Componente Geológica; Palimage: Viseu, Portugal, 2005. [Google Scholar]
- Cunha, L.; Dimuccio, L.A.; Aubry, T. Património cársico no Centro de Portugal. O caso do Maciço de Sicó. Património Geomorfológico e Geoconservação. Experiências em Portugal e no Brasil. In Proceedings of the do I Encontro Luso-Brasileiro de Património Geomorfológico e Geoconservação, Coimbra, Portugal, 5–7 February 2014; pp. 27–34. [Google Scholar]
- Cunha, L.; Dimuccio, A.L.; Paiva, I. Geopatrimónio cársico e desenvolvimento local no Maciço de Sicó. Desafios para afirmar a Lusofonia na Geografia Física e Ambiente. II Encontro Luso-Afro-Americano de Geografia Física e Ambiente 2018. pp. 1227–1233. Available online: https://repositorio.ul.pt/handle/10451/36644 (accessed on 15 May 2023).
- Aleksandar, A.; Nemanja, T.; Slobodan, M. Karst geoheritage and geotourism potential in the Pek River lower basin (eastern Serbia). Geogr. Pannonica 2019, 23, 32–46. [Google Scholar]
- Khalaf, E.E.D.A.H. Karst Heritage as a Tourist Attraction: A Case Study in the White Desert National Park, Western Desert, Egypt. Geoheritage 2022, 14, 1–30. [Google Scholar] [CrossRef]
- Valjavec, M.B.; Pejnović, N.D.; Draženović, M.; Čonč, Š.; Horvat, K.P. The Transboundary Approach to Landscape Geointerpretation: Challenges in Interpretive Planning and Geoconservation. Geoheritage 2022, 14, 1–13. [Google Scholar] [CrossRef]
- Rodrigues, H.A.; Rodrigues, M.L.; Lobo, H.S. Espeleoturismo em Portugal: Panorama Geral do Uso Turístico das Cavidades Naturais. Rev. Rosa Dos Ventos-Tur. E Hosp. 2017, 9, 92–106. (In Brazilian) [Google Scholar]
- Torres, E.; Spoladore, A.; Cunha, L. Espeleoturismo: Nota preliminar sobre as realidades paranaense e portuguesa. In Paisagem e Território; UEL: Londrina, Brazil, 2018; pp. 83–88. [Google Scholar]
- Ballesteros, D.; Fernández-Martínez, E.; Carcavilla, L.; Jiménez-Sánchez, M. Karst Cave Geoheritage in Protected Areas: Characterisation and Proposals of Management of Deep Caves in the Picos de Europa National Park (Spain). Geoheritage 2019, 11, 1919–1939. [Google Scholar] [CrossRef]
- Chiarini, V.; Duckeck, J.; De Waele, J.A. Global Perspective on Sustainable Show Cave Tourism. Geoheritage 2022, 14, 1–27. [Google Scholar] [CrossRef]
- Hobléa, F. Expertise et Médiation Scientifique Pour la Gestion Durable de L’Environnement Karstique; Actes de la réunion annuelle de la Société Suisse de Géomorphologie (SSGm), Gestion durable de l’environnement karstique; Persée: Paris, France, 2004; pp. 25–42. [Google Scholar]
- Leslie, A.N. Informal Karst Education in the United States and Internationally. Ph.D. Thesis, Department of Geography, University of South Florida, Tampa, FL, USA, 2011. [Google Scholar]
- Abdellah, A.B.; Jamila, R.; Ahmed, B.; Elhassan, L.; Samir, N. The Karst Landscapes of Beni Mellal Atlas (Central Morocco): Identification for Promoting Geoconservation and Tourism. Quaest. Geogr. 2022, 41, 87–109. [Google Scholar]
- Velasquez, M.; Hester, P.T. An analysis of multi-criteria decision making methods. Int. J. Oper. Res. 2013, 10, 56–66. [Google Scholar]
- Zlaugotne, B.; Zihare, L.; Balode, L.; Kalnbalkite, A.; Khabdullin, A.; Blumberga, D. Multi-Criteria Decision Analysis Methods Comparison. Environ. Clim. Technol. 2020, 24, 454–471. [Google Scholar] [CrossRef]
- Vakilipour, S.; Sadeghi-Niaraki, A.; Ghodousi, M.; Choi, S. Comparison between Multi-Criteria Decision-Making Methods and Evaluating the Quality of Life at Different Spatial Levels. Sustainability 2021, 13, 4067. [Google Scholar] [CrossRef]
- Taheri, K.; Gutiérrez, F.; Mohseni, H.; Raeisi, E.; Taheri, M. Sinkhole susceptibility mapping using the analytical hierarchy process (AHP) and magnitude-frequency relationships: A case study in Hamadan province, Iran. Geomorphology 2015, 234, 64–79. [Google Scholar] [CrossRef]
- Moradi, S.; Kalantari, N.; Charchi, A. Karstification Potencial Mapping in Northeast of Khuzestan Province, Iran, using Logic and Analytical Hierarchy Process (AHP) techniques. Geopersia 2016, 6, 265–282. [Google Scholar]
- Zaree, M.; Javadi, S.; Neshat, A. Potential detection of water resources in karst formations using APLIS model and modification with AHP and TOPSIS. J. Earth Syst. Sci. 2019, 128, 76. [Google Scholar] [CrossRef]
- Vargas, H.S.; Almeida, J.A.; Kullberg, J.C.; Brito, M.G. Prospecção interactiva de endocarso através de uma aplicação SIG. Finisterra 2003, 38, 51–64. [Google Scholar]
- Aken, M.V.; Harley, G.L.; Dickens, J.F.; Polk, J.S.; North, L.A. A GIS-based modeling approach to predicting cave disturbance in karst landscapes: A case study from west-central Florida. Phys. Geogr. 2014, 35, 123–133. [Google Scholar] [CrossRef]
- Auler, A. Cave protection as a Karst conservation tool in the environmentally sensitive Lagoa Santa Karst, Southeastern Brazil. Acta Carsologica 2016, 45, 131–145. [Google Scholar] [CrossRef]
- Gunn, J.; Gillieson, D.; Auler, A.; Bolger, T. Guidelines for Cave and Karst Protection, 2nd ed.; International Union of Speleology: Postojna, Slovenia; IUCN: Gland, Switzerland, 2022. [Google Scholar]
- Theilen-Willige, B.; Malek, H.A.; Charif, A.; El Bchari, F.; Chaïbi, M. Remote Sensing and GIS Contribution to the Investigation of Karst Landscapes in NW-Morocco. Geosciences 2014, 4, 50–72. [Google Scholar] [CrossRef]
- Telbisz, T.; Mari, L.; Albert, G. GIS Research of Karst Terrains in Hungary. In Cave and Karst Systems of Hungary. Cave and Karst Systems of the World; Veress, M., Leél-Őssy, S., Eds.; Springer: Berlin/Heidelberg, Germany, 2022; pp. 249–274. [Google Scholar]
- Hamed, Y.; Hadji, R.; Ahmadi, R.; Ayadi, Y.; Shuhab, K.; Pulido-Bosch, A. Hydrogeological investigation of karst aquifers using an integrated geomorphological, geochemical, GIS, and remote sensing techniques (Southern Mediterranean Basin—Tunisia). Environ. Dev. Sustain. 2023, 1–33. [Google Scholar] [CrossRef]
- Cooper, A.; Farrant, A.; Price, S. Karst, GIS and geological hazard planning and management in Great Britain. In 2º Workshop Internazionale, I Sinkholes, Gli Sprofondamenti Catastrofici Nell’ambiente Naturale ed in Quello Antropizzato; Istituto Superiore per la Protezione e la Ricerca Ambientale: Rome, Italy, 2010; pp. 242–256. [Google Scholar]
- Zhang, C.; Qi, X.; Wang, K.; Zhang, M.; Yue, Y. The application of geospatial techniques in monitoring karst vegetation recovery in southwest China: A review. Prog. Phys. Geogr. Earth Environ. 2017, 41, 450–477. [Google Scholar] [CrossRef]
- Fathi, S.; Sjåstad, J.H.; Hoseen, A.H. Synthesizing existing frameworks to identify the potential for Managed Aquifer Recharge in a karstic and semi-arid region using GIS Multi Criteria Decision Analysis. Groundw. Sustain. Dev. 2020, 11, 100390. [Google Scholar] [CrossRef]
- Mokarram, M.; Mohammadizadeh, P. Prediction of karst suitable area using fuzzy AHP method and Dempster-Shafer theory. Earth Space Sci. 2021, 8, e2019EA000719. [Google Scholar] [CrossRef]
- Martins, A.F. Maciço Calcário Estremenho. Contribuição Para um Estudo de Geografia Física. Ph.D. Thesis, Faculdade de Letras da Universidade de Coimbra, Coimbra, Portugal, 1949. [Google Scholar]
- Rodrigues, M.L. The Limestone Massif of Estremadura. In Landscapes and Landforms of Portugal. World Geomorphological Landscapes; Vieira, G., Zêzere, J., Mora, C., Eds.; Springer: Berlin/Heidelberg, Germany, 2020; pp. 229–250. [Google Scholar]
- Fleury, E. Portugal Subterrâneo, Ensaio de Espeleologia Portuguesa; Coleção Natura: Lisboa, Portugal, 1925. [Google Scholar]
- Thomas, C. Cova da Velha. Espeleo Divulg. 1985, 4, 30–35. [Google Scholar]
- Ferreira, A.B.; Rodrigues, M.L.; Zêzere, J.L. Problemas da Evolução Geomorfológica do Maciço Calcário Estremenho. Finisterra 1988, 23, 5–28. [Google Scholar] [CrossRef]
- Crispim, J.A. Características cársicas das rochas carbonatadas da região central do Maciço Calcário Estremenho. Algar Bol. Soc. Port. De Espeleol. 1992, 3, 9–18. [Google Scholar]
- Canais, F.; Fernandes, J. Lapas e Algares da Serra de Santo António; SubTerra—Grupo de Espeleologia: Torres Novas, Portugal, 1999. [Google Scholar]
- Azerêdo, A.C. Jurássico Médio do Maciço Calcário Estremenho (Bacia Lusitânica): Análise de fácies, micropaleontologia, paleogeografia. Ph.D. Thesis, Departamento de Geologia da Faculdade de Ciências da Universidade de Lisboa, Lisboa, Portugal, 1993. [Google Scholar]
- Azerêdo, A.C. Geometry and facies dynamics of Middle Jurassic carbonate ramp sandbodies. West-Central Portugal. Geol. Soc. Lond. Spéc. Publ. 1998, 149, 281–314. [Google Scholar] [CrossRef]
- Inês, N. Paleotipologias Diagenéticas em Formações Carbonatadas do Jurássico Médio da Bacia Lusitânica: Análise Multiscala e Aplicações à Caraterização de Reservatórios. Master’s Thesis, Estratigrafia, Sedimentalogia e Palentologia, Departamento de Geologia da Faculdade de Ciências da Universidade de Lisboa, Lisboa, Portugal, 2010. [Google Scholar]
- Carvalho, J.M. Tectónica e caraterização da fraturação do Maciço Calcário Estremenho, Bacia Lusitânica. Contributo para a Prospeção de Rochas Ornamentais e Ordenamento da Atividade Extrativa. Ph.D. Thesis, Departamento de Geologia da Faculdade de Ciências da Universidade de Lisboa, Lisboa, Portugal, 2013. [Google Scholar]
- Rocha, R.B.; Soares, A.F. Algumas reflexões sobre a sedimentação jurássica na orla meso-cenozóica ocidental de Portugal. Mem. Notícias Univ. Coimbra 1984, 97, 133–142. [Google Scholar]
- Kullberg, J.C.; Rocha, R.B.; Soares, A.F.; Rey, J.; Terrinha, P.; Axerêdo, A.C.; Callapez, P.; Duarte, L.V.; Kullberg, M.C.; Martins, L.; et al. A Bacia Lusitaniana: Estratigrafia, Paleogeografia e Tectónica. In Portugal, Vol. II, Geologia Meso-Cenozóica de Portugal. Escolar Editora; Dias, R., Araújo, A., Terrinha, P., Kullberg, C., Eds.; Escolar Editora: Lisboa, Portugal, 2013; pp. 195–347. [Google Scholar]
- Daveau, S. O Relevo de Portugal. Grandes Unidades Regionais; Feio, M., Daveau, S., Eds.; Associação Portuguesa de Geomorfólogos: Coimbra, Portugal, 2004; pp. 61–73. [Google Scholar]
- Saaty, T.L. A scaling method for priorities in hierarchical structures. J. Math. Psychol. 1977, 15, 234–281. [Google Scholar] [CrossRef]
- Saaty, T.L. Axiomatic foundation of the analytic hierarchy process. Manag. Sci. 1986, 32, 841–855. [Google Scholar] [CrossRef]
- Saaty, T.L. Theory and Applications of the Analytic Network Process: Decision Making with Benefits, Opportunities, Costs, and Risks; RWS Publications: Pittsburg, PA, USA, 2009. [Google Scholar]
- Ishizaka, A.; Labib, A. Analytic Hierarchy Process and Expert Choice: Benefits and limitations. Oper. Reasearch Soc. 2009, 22, 201–220. [Google Scholar] [CrossRef]
- Saaty, T.L.; Ergu, D. When is a Decision-Making Method Trustworthy? Criteira for Evaluating Multi-Criteria Decision-Making Methods. Int. J. Inf. Technol. Decis. Mak. 2015, 14, 1171–1187. [Google Scholar] [CrossRef]
- Bi, J.; Bennett, K.P. Regression Error Characteristic Curves. In Proceedings of the Twentieth International Conference on Machine Learning 2003, (ICML-2003), Washington, DC, USA, 23–24 June 2003; pp. 43–50. [Google Scholar]
- Oliveira, S.M.C. Incidência Espacial e Temporal da Instabilidade Geomorfológica na Bacia do Rio Grande da Pipa (Arruda dos Vinhos). Ph.D. Thesis, Universidade de Lisboa, Lisboa, Portugal, 2012. [Google Scholar]
- Klimchouk, A.; Ford, D.; Palmer, A.; Dreybrodt, W. Spleogenesis, Evolution of Karst Aquifers; National Speleological Society January: Huntsville, AL, USA, 2000; 527p. [Google Scholar]
- Paiva, I.M.R. Hidrossistema Cársico de Dregracias-Sicó. Estudo do Funcionamento Hidrodinâmico a Partir das Suas Respostas Naturais. Ph.D. Thesis, Faculdade de Letras da Universidade de Coimbra, Coimbra, Portugal, 2014. [Google Scholar]
- Seif, A.; Ebrahimi, B. Using GIS to evaluate degree of karstification according to some important factors in carbonate rocks in Iran. Carbonate Evaporites 2014, 29, 107–126. [Google Scholar] [CrossRef]
- Nola, I.T.S.; Bacellar, L.A.P. Multi-criteria analysis for mapping susceptibility to iron formation caves development in the Gandarela mountain range (MG), southeast Brazil. Int. J. Speleol. 2021, 50, 137–187. [Google Scholar] [CrossRef]
- Al-shabeeb, A.R. The Use of AHP within GIS in Selecting Potential Sites for Water Harvesting Sites in the Azraq Basin—Jordan. J. Geogr. Inf. Syst. 2016, 8, 73–88. [Google Scholar] [CrossRef]
- Azerêdo, A.C. Formalização da litostratigrafia do Jurássico Inferior e Médio do Maciço Calcário Estremenho (Bacia Lusitânica). Comun. Geológicas 2007, 94, 29–51. [Google Scholar]
- Salomon, J.N. Précis de Krastologie; Presses Universitaries de Bourdeaux: Bourdeaux, France, 2000. [Google Scholar]
- Figueiredo, R.F. Modelação Cartográfica em Ambiente SIG Para Apoio à Decisão: Aplicação ao Estudo da Afectação Potencial de Usos do Solo no Sector Norte do Maciço Marginal de Coimbra. Master’s Thesis, Faculdade de Letras da Universidade de Coimbra, Coimbra, Portugal, 2001. [Google Scholar]
- Ramos, A.; Cunha, L.; Cunha, P. Application de la Méthode de l’Analyse Multicritère Hiérarchique à l’étude des glissements de terrain dans la région littorale du centre du Portugal: Figueira da Foz—Nazaré. Geo-Eco-Trop Liège 2014, 38, 33–44. [Google Scholar]
- Fielding, A.H.; Bell, J.F. A review of methods for the assessment of prediction errors in conservation presence/absence models. Environ. Conserv. 1997, 24, 38–49. [Google Scholar] [CrossRef]
- Bennett, B.; Ibrahim, A.M. The Assessment of Machine Learning Model Performance for Predicting Alluvial Deposits Distribution. Procedia Comput. Sci. 2014, 36, 637–642. [Google Scholar]
- Saaty, T.L. How to make a decision: The analytic hierarchy process. Eur. J. Oper. Res. 1990, 48, 9–26. [Google Scholar] [CrossRef]
- Hämäläinen, R.P.; Salo, A.A. The Issue is Understanding the Weights. J. Multi-Criteria Decis. Anal. 1997, 6, 340–343. [Google Scholar] [CrossRef]
- Goepel, K. AHP Excel Template with Multiple Inputs 2018, Version AHPcalc-v2018-09-15; Business Performance Management Singapore: Singapore, 2018; Available online: https://bpmsg.com/ (accessed on 15 May 2023).
- Barton, H.A. Biospeleogenesis. Treatise on Geomorphology; Shroder, J., Frumkin, A., Eds.; Karst Geomorphology; Academic Press: San Diego, CA, USA, 2013; Volume 6, pp. 38–56. [Google Scholar]
- Rauch, H.W.; White, W.B. Lithologic controls on the development of solution porosity in carbonate aquifers. Water Resour. Res. 1970, 6, 1175–1192. [Google Scholar] [CrossRef]
- Waltham, A.C. Origin and development of limestone caves. Prog. Phys. Geogr. Earth Environ. 1981, 5, 242–256. [Google Scholar] [CrossRef]
- James, N.P.; Choquette, P.W. Diagenesis 9, Limestones—The Meteoric Diagenetic Environment. Carbonate Sedimentol. Petrol. 1984, 4, 45–78. [Google Scholar]
- Manupella, G.; Telles, A.M.; Costa, C.A.; Azerêdo, A.C.; Barbosa, B.; Cardoso, J.L.; Crispim, J.A.; Duarte, L.V.; Henriques, M.H.; Martins, L.T.; et al. Notícia Explicativa da Folha 27-A Vila Nova de Ourém; Departamento de Geologia, Instituto Geológico e Mineiro: Lisboa, Portugal, 2000. [Google Scholar]
- Dunham, R.J. Classification of Carbonate Rocks According to Depositional Texture. In Classification of Carbonate Rocks; Ham, W.E., Ed.; American Association of Petroleum Geologists: Tulsa, OK, USA, 1962; pp. 108–121. [Google Scholar]
- Cunha, L. As Serras Calcárias de Condeixa-Sicó-Alvaiázere. Estudo de Geomorfologia. Ph.D. Thesis, Faculdade de Letras da Universidade de Coimbra, Coimbra, Portugal, 1988. [Google Scholar]
- Trudgill, S.T. Field observations of limestone weathering and erosion in the Malham District, North Yorkshire. Filed Stud. 1985, 6, 201–236. [Google Scholar]
- Ghung, C.F.; Fabbri, A.G. Validation of Spatial Prediction Models for Landslide Hazard Mapping. Nat. Hazards 2003, 30, 451–472. [Google Scholar]
- Guzzetti, F.; Reichenbach, P.; Cardinali, M.; Galli, M.; Ardizzone, F. Probabilistic landslide hazard assessment at the basin scale. Geomorphology 2005, 72, 272–299. [Google Scholar] [CrossRef]


Disclaimer/Publisher’s Note: The statements, opinions and data contained in all publications are solely those of the individual author(s) and contributor(s) and not of MDPI and/or the editor(s). MDPI and/or the editor(s) disclaim responsibility for any injury to people or property resulting from any ideas, methods, instructions or products referred to in the content. |
© 2023 by the authors. Licensee MDPI, Basel, Switzerland. This article is an open access article distributed under the terms and conditions of the Creative Commons Attribution (CC BY) license (https://creativecommons.org/licenses/by/4.0/).