Article

Rationalization of Electrical Energy Consumption in Households through the Use of Cheap IoT Module with Cloud Data Storage

Department of Electrical Engineering and Industrial Automation, Faculty of Mining, Safety Engineering and Industrial Automation, Silesian University of Technology, Akademicka 2 St., 44-100 Gliwice, Poland
Sustainability 2023, 15(21), 15507; https://doi.org/10.3390/su152115507
Submission received: 17 August 2023 / Revised: 20 October 2023 / Accepted: 26 October 2023 / Published: 31 October 2023

Abstract

:
This article explores mechanisms to enhance the efficient utilization of renewable energy sources (RES), with a particular emphasis on photovoltaic installations. One such strategy involves implementing a customized electricity rate system for individual consumers. This paper discusses the potential economic and environmental benefits of transitioning from a flat-rate tariff to a time-of-day tariff. This modification can lead to increased energy consumption during off-peak hours, aligning with occasional periods of photovoltaic installations’ overproduction, which might require their temporary shutdowns. The energy that could be produced by RES is supplied by conventional power plants (mostly coal-fueled). Not only does this have negative effects on the environment, but it also increases energy costs. In order to make an informed decision regarding the change of tariff, the consumer must be aware of its potential benefits and drawbacks. The article introduces an IoT-based, cost-effective system with cloud data storage for monitoring residential electricity consumption, offering various features, including an assessment of the financial viability of switching tariffs. This system has been operational for more than six months in real installation, encouraging homeowners to transition from a flat rate tariff to time-of-day tariff and optimize their use of electrical appliances. The article presents the potential benefits of this action, encompassing both financial aspects for users of the installation and environmental protection issues.

1. Introduction

One of the paramount factors in the pursuit of decarbonization and the mitigation of global warming involves not only increasing the proportion of renewable energy sources in the energy mix, but also striving to streamline and reduce energy consumption in both the industrial and residential sectors. According to the report provided by the transmission system operator (TSO) in Poland for the year 2022, 82.6% of the power generated in the country originated from fossil fuels, while 17.4% was derived from RES [1]. However, it is important to note that this particular metric is susceptible to notable fluctuations on a monthly and daily basis. The combination of a low proportion of RES use and a high electricity demand necessitates increased output from thermal power plants. Conversely, during periods of minimal energy demand and high renewable energy production, it becomes necessary to limit production from these sources [2,3]. One strategy employed to enhance energy demand during periods of overproduction is the implementation of a tariff system that differentiates energy costs throughout the day. This incentivizes consumers to shift a portion of their energy consumption from peak hours to off-peak hours, with the expectation of optimizing the generation and transmission of resources within the power system [4]. This aspect becomes particularly crucial in anticipation of the further increase in the share of RES in electricity production.
Typically, individual recipients may struggle to assess the cost-effectiveness of transitioning to a two-rate tariff [5,6]. The rapid development of IoT devices has led to the emergence of technical solutions enabling continuous monitoring and analysis of energy consumption in home installations [7,8,9,10]. However, commercially available systems tend to be relatively costly for individual customers, and the accompanying PC/mobile applications may not always be customized to meet the customer’s specific requirements. Energy consumption monitoring systems proposed in the literature often fail to clearly demonstrate the potential benefits to users when switching to a time-of-day tariff. Systems designed for analyzing energy consumption by individual devices [11,12,13,14,15], some of which offer remote control capabilities, are not suitable for monitoring the energy consumption of an entire installation with multiple appliances. Solutions that rely solely on measuring current and voltage to determine apparent power (without considering power factor) [16,17,18,19,20,21] have limited practicality because electricity billing is primarily based on active energy consumption, while many appliances, such as LED lamps and electronic devices, have a low power factor. To evaluate the profitability of transitioning to a time-of-day tariff, it is essential to have a system that measures and records data on active energy consumption throughout the entire installation during both peak and off-peak hours. The systems mentioned in [22,23,24,25], along with some of commercially available solutions [26,27,28] can assist in assessing tariff adjustments. However, this necessitates users to independently analyze energy consumption during specific periods, and calculating energy costs may prove challenging.
The following section of the article examines the current state of the energy market, with a primary focus on the advancement of RES. The data on the production and consumption of electricity in Poland presented in the article were primarily derived from reports published by Transmission System Operator in Poland (TSO) [1] and monthly bulletins of the Ministry of Climate and Environment [29]. These statistics do not include the production of electricity by prosumers for their own needs; it is estimated to constitute 20–30% of the energy they produce [30]. Subsequent sections outline a proposal for a framework designed to monitor energy consumption in a domestic setting, utilizing wireless data transmission to a cloud-based platform. The system includes a cost-effective IoT-based measurement system and a mobile application that allows for convenient and continuous monitoring of energy parameters, examination of stored data, and generation of specific statistics, including those that aid in rationalization of electricity usage, such as choosing an optimal tariff.

2. Current Status and Prospects for RES Development in Poland

Coal-fired power facilities are the predominant source of electricity in Poland, resulting in a relatively low ranking in the EU sustainable development economy [31]. However, the share of RES in Poland’s electricity production has been steadily increasing for many years. Over the past decade, the amount of energy produced from RES and fed into the national power system has grown more than 6-fold, rising from 2.5% in 2012 to nearly 16% in 2022 [1]. This substantial increase in RES share in overall energy production can be largely attributed to the rising number of prosumers, who generate power through residential solar systems, with a smaller contribution from wind installations. Poland benefits from conditions conducive to the efficient operation of photovoltaic cells, with average annual insolation varying across individual regions, ranging from approximately 1060 kWh/m2 in the north to approximately 1130 kWh/m2 in the south of the country [32]. While these values are lower than in southern European countries, the efficiency of PV cells is enhanced by lower temperatures. The solar map of Poland is presented in Figure 1.
In certain periods, the combined output of wind farms and photovoltaic farms can meet even more than 70% of Poland’s total energy demand [29]. During periods of high insolation and favorable wind conditions, when electricity demand is minimal, particularly during non-working days, there is a potential for electricity overproduction. However, due to the necessity of maintaining system stability, it is not always possible to reduce energy production in conventional power plants to a minimum, which would be optimal in terms of energy generation costs and environmental protection. One factor associated with conventional power plants is the minimum safe output of the unit—the power output level below which a power unit cannot be maintained in continuous service. Modern gas turbine units offer a high degree of flexibility in this regard, as they can promptly resume production after a shutdown and rapidly increase the power output into the system. The minimum safe output of coal power stations typically ranges from 40% to 60% [33,34]. Decreasing production levels below this threshold may potentially reduce the durability of individual units. Consequently, there are instances when it becomes necessary to curtail photovoltaic generation connected to the medium- and high-voltage transmission grid (this reduction does not apply to prosumer installations). In 2023, the TSO has already ordered four times (23 April, 30 April, 2 July, and 8 October) to reduce the production of energy from photovoltaic sources. An efficacy analysis of photovoltaic power plants revealed that 60 GWh of energy were irretrievably lost over the course of these four days. Assuming that this energy had to be produced in coal-fired power plants, these power plants additionally consumed approximately 30,000 tons of hard coal, resulting in approximately 54,000 tons of CO2 emissions (assuming that the production of 1 kWh of electricity in a hard coal-fired power plant is associated with the emission of approximately 0.9 kg of CO2 [35,36]). Historically, there were instances where the TSO has mandated a reduction in production from wind farms, but this is the first time such a directive has applied to photovoltaic energy sources [37].
Another indicator that effectively illustrates the relationship between electricity demand and supply is the price of electricity on the balancing market. The comparatively low pricing can be attributed to limited demand for energy compared to the available production capacity. In the first two weeks of July 2023, the mean price observed in the energy market amounted to 590 PLN/MWh on weekdays, 454 PLN/MWh on Saturdays, and 307 PLN/MWh on Sundays [1]. During periods of energy overproduction, the price of energy decreased to levels below 20 PLN/MWh. Figure 2 and Figure 3 present a comparative analysis of energy output from photovoltaic sources and purchase prices on the energy market for the dates of 22 and 23 April, as well as 1 and 2 July (day pairs with similar insolation). Low prices in periods of overproduction (between the hours of 12 and 16 on 23 April 2023 and between hours of 7 and 19 on 2 July 2023) result from the fact that large energy producers offer electricity at very low prices (or even with a surcharge), as it is more profitable for them than temporarily stopping production (prices on the energy market at a given time are the same for all producers).
In many European countries, energy overproduction results in negative pricing [38]. Poland experienced this phenomenon for the first time on 11 June 2023, when prices on the day-ahead market dropped below negative 20 PLN/MWh [39]. Since then, in the year 2023, similar situations occurred on 1, 3, and 10 September, as well as on 8 October [1]. It is expected that such situations will be more frequent in the future [40].
During periods of energy overproduction, the potential for electricity export to neighboring countries is often limited due to similar meteorological conditions there. One potential solution to the issue of overproduction is the implementation of energy storage systems, which would enable the collection and retention of excess energy generated by renewable sources, to be released during periods of increased demand. In Poland, energy storage is primarily achieved through pumped storage power stations, which currently have an installed capacity of approximately 1.9 GW. Additionally, there are plans to construct three more power stations with a combined capacity of 2.5 GW by 2023 [41]. The market for battery energy storage systems (BESS) is also under development. Currently, BESS in Poland has a total rated power of approximately 50 MW, with expansion plans in place. Given the expected shift from fossil fuel-derived energy sources to weather-dependent RES, there will be a growing need for energy storage [42,43]. Estimates suggest that the projected rated power of BESS facilities in Poland is expected to reach 3750 MW by 2040, accompanied by a storage capacity of 15,000 MWh [44]. The ageing of the BESS is influenced by various factors, including the charging and discharging C-rates. To ensure a service life of 15–20 years, it is advisable to maintain a relatively low C-rate (e.g., 0.1–0.2 C) [45], which means it becomes necessary to install a BESS with high capacity and correspondingly high costs. The profitability of implementing BESS also depends on its operational regime, including charging and discharging periods based on the current price of energy [46,47]. The anticipated halving of battery prices over the next decade is expected to make BESS profitable by 2030 [48,49,50].
With the increasing share of RES in electricity generation, especially PV installations [51], and a decrease in the energy intensity of production [52,53,54], it is likely that the above-described overproduction from these sources will become more frequent. One mechanism to mitigate these situations is the introduction of incentives for energy consumers to increase consumption during periods of reduced demand and reduce consumption during peak demand periods. This is achieved for individual consumers through a tariff system in which the price of electricity and transmission service fluctuates throughout the day.

3. Material and Methods

It has been observed that a significant portion of individual Polish consumers (87%) choose the G11 flat rate tariff [55]. The two-rate time-of-day tariff G12 encompasses a specific time period, during which off-peak hours are applicable for a duration of 10 h each day. Typically, these off-peak hours span from 1 pm to 3 pm and from 10 pm to 6 am. The use of this tariff is primarily observed among consumers who rely on electric heating systems. Also available is the G12w tariff, which defines bank holidays and weekends (from 10 pm on Friday to 6 am on Monday) as off-peak hours. The cost of consumed electrical energy consists of charges for electrical energy, energy transmission and distribution (T&D) services, and additional standing charges. The cost-effectiveness of a certain tariff is contingent upon the use and price of energy during specific periods of the day. Since standing charges are identical across all compared tariffs, they will not be taken into further consideration. Assuming this, the cost of energy for a consumer using the G11 tariff is as follows:
G 11 = E p + E o · p 11 + d 11
whereas for a G12 or G12w tariff user it is:
G 12 = E p · p 12 p + d 12 p + E o · p 12 o + d 12 o
where:
Ep—electrical energy usage during peak hours, kWh,
Eo—electrical energy usage during off-peak hours, kWh,
p11—electricity rate in G11 tariff, PLN/kWh,
p12p—electricity rate during peak hours in G12 tariff, PLN/kWh,
p12o—electricity rate during off-peak hours in G12 tariff, PLN/kWh,
d11—T&D rate in G11 tariff, PLN/kWh,
d12d—T&D rate during peak hours in G12 tariff, PLN/kWh,
d12o—T&D rate during off-peak hours in G12 tariff, PLN/kWh.
The G12 tariff is more profitable in the case where the following condition is satisfied:
G 12 < G 11
hence
E o > E p p 12 p + d 12 p p 11 + d 11 p 11 + d 11 p 12 o + d 12 o
or after marking ET—total energy used in a given time period:
E o > E T p 12 p + d 12 p p 11 + d 11 p 12 p + d 12 p p 12 o + d 12 o
The prices of electricity and distribution exhibit variability contingent upon the seller (provider) and geographical location. The rates for TAURON (one of the largest energy companies in Poland) are as follows [56,57] (not including VAT):
p11 = 0.4140 PLN/kWh
p12p = 0.4929 PLN/kWh (0.5024 PLN/kWh for G12w)
p12o = 0.2763 PLN/kWh (0.3254 PLN/kWh for G12w)
d11 = 0.1754 PLN/kWh
d12p = 0.2064 PLN/kWh (0.2367 PLN/kWh for G12w)
d12o = 0.0484 PLN/kWh (0.0443 PLN/kWh for G12w)
After substituting data into Equation (5):
E o > 0.29 · E T   ( for   G 12   tariff )
E o > 0.40 · E T   ( for   G 12 w   tariff )
In other words, if the proportion of off-peak energy in relation to overall energy consumption is equal to or exceeds 29%, the user should consider changing their tariff to G12. The G12w tariff becomes profitable when 40% of the total energy usage occurs during off-peak periods. Typically, most individual customers rely on periodic settlements received from their supplier as their primary source of information regarding energy consumption. The frequency of these settlements may vary depending on the supplier and contract terms, with settlement periods typically spanning 1, 2, 6, or 12 months. To evaluate the financial viability of a tariff change, users should observe the energy usage patterns of their residential system throughout both peak and off-peak periods. Some power suppliers currently offer the opportunity to install a meter equipped with remote reading capabilities to visualize energy use. However, it is important to note that this service is currently limited to specific providers.
Furthermore, it is worth noting that, in addition to the variety of measurement equipment available from different manufacturers, the accompanying software, often in the form of smartphone applications, may not provide a straightforward means of assessing the cost-effectiveness of switching tariffs. The cost of more sophisticated solutions is another constraint on the widespread use of these devices.
The cost of more sophisticated solutions is another constraint on the widespread use of these devices. The subsequent section of this paper outlines the development of an IoT-based, cost-effective measuring system. This system enables the monitoring of energy consumption and other relevant factors while facilitating the assessment of the cost-effectiveness of a tariff change.

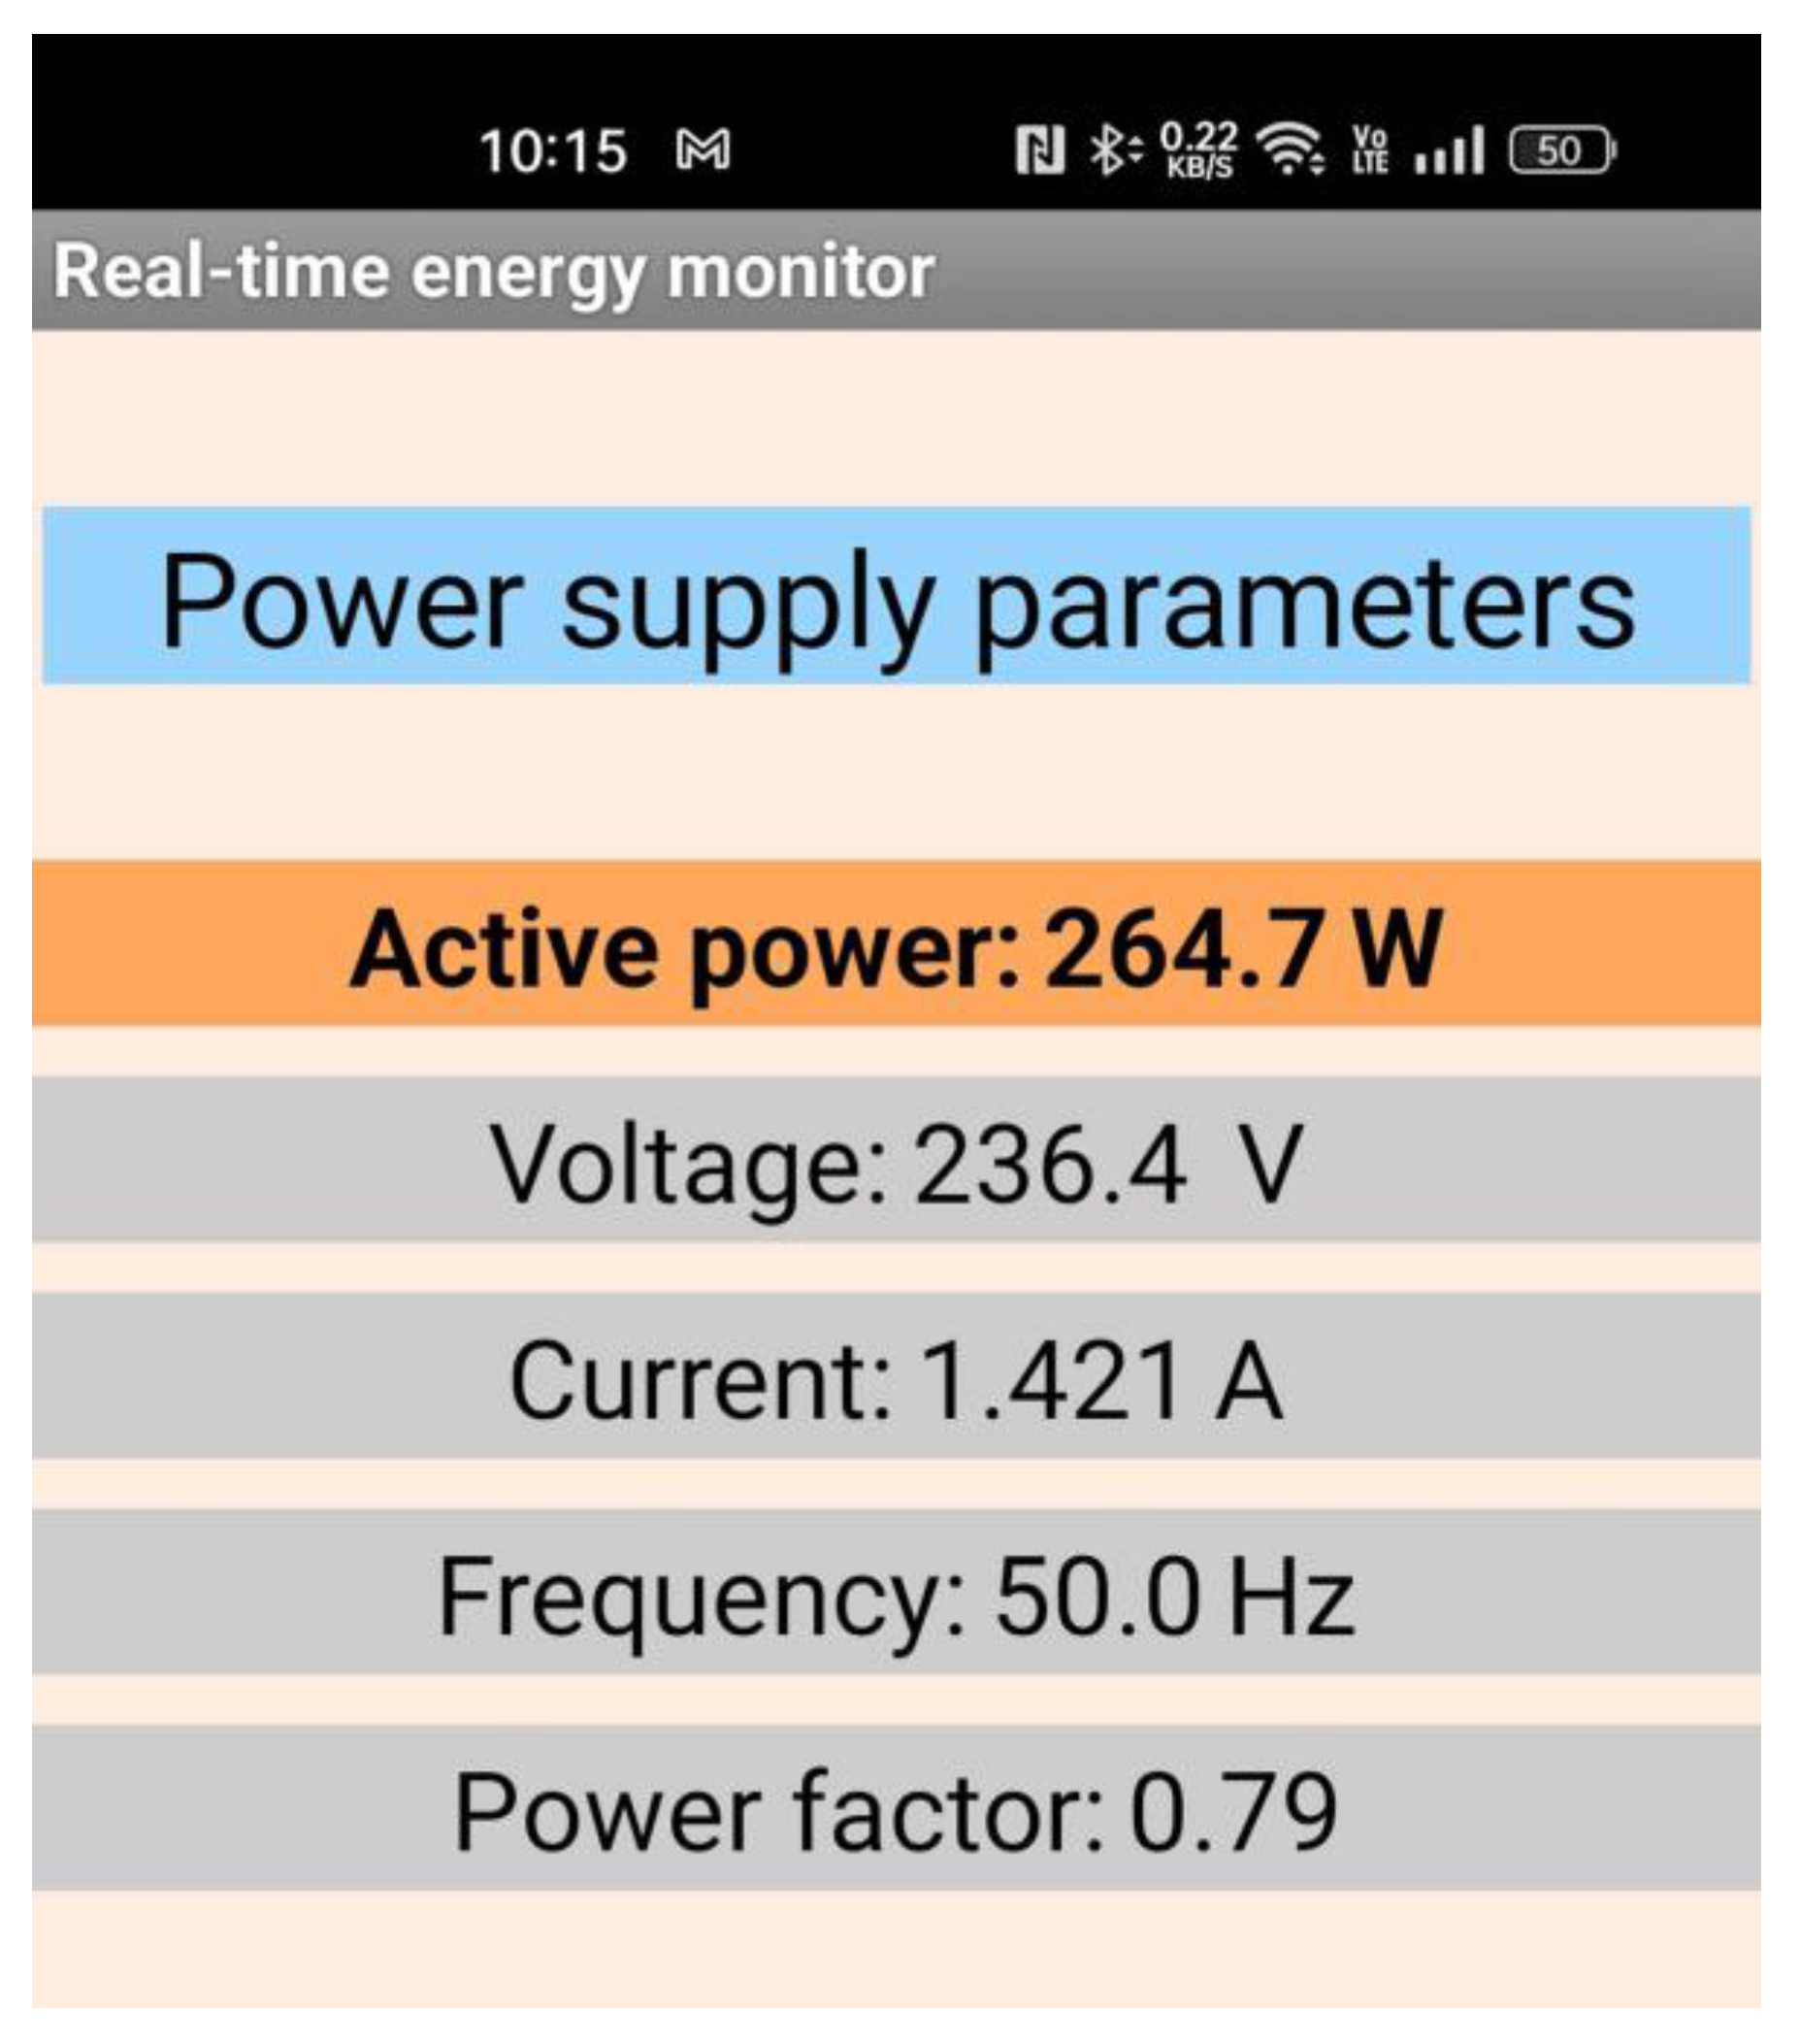
3.1. System for Monitoring Energy Consumption

The design of the IoT-based monitoring system was based on the use of the cheap PZEM-004T 100 A module, capable of measuring voltage, current, active power, power factor, frequency, and active electric energy [58]. The project utilized a module variant with a measuring current capacity of up to 100 A, equipped with a current transformer for current measurement (an alternative module variant without a current transformer with a measuring current capacity of 10 A is also available). The PZEM-004T measurement module communicates via an RS485 interface with the Wemos D1 Mini microcontroller, which is built on the ESP8266 chip. This microcontroller is compatible with the Arduino platform and possesses the capability to establish Internet communication via Wi-Fi. The Wemos module offers advantages such as compact dimensions, affordability, and energy-efficient operation. The measurement device is powered by a 5 V DC supply module. The cost of the components used in constructing the system amounts to approximately EUR12. All these elements were installed on a printed circuit board (PCB), as shown in Figure 4.
Based on the data provided in the manufacturer’s catalogue card [58], the measurement accuracy for voltage, current, power, and active energy is reported to be 0.5%. Since the developed system would not be used for invoicing or laboratory measurements, this level of accuracy appears to be satisfactory. Nevertheless, the system’s accuracy was evaluated under controlled laboratory settings. To achieve this objective, a stand was constructed to facilitate a comparative analysis of the measurement outcomes obtained from the PZEM-004T module and the professional Power Network Meter ND30 manufactured by LUMEL (as depicted in Figure 5).
The measurements conducted by the designed system were transmitted wirelessly through a Wi-Fi connection to the computer. Meanwhile, the communication between the computer and the ND30 meter was carried out through the RS485 interface, using the MODBUS protocol. The experimental procedure involved conducting measurements using a load of varying magnitude. A virtual instrument was created within the LabVIEW environment to visualize differences in electrical quantities measured by the ND30 and PZEM-004T devices and export recorded data to a text file.
Figure 6 illustrates comparison of active power measurements taken by the ND30 power meter (blue line) and the PZEM-004T (red line) module at 0.5 s intervals. The load consisted of several devices, including incandescent and LED lamps, a computer monitor, and electronic devices. Power consumption and power factor of the load varied as appliances were switched on and off. There is a noticeable time delay (approximately 0.5 s) in the PZEM-004T measurement results compared to the ND30 meter. This delay can be attributed in part to latency caused by data transmission over Wi-Fi. However, a more comprehensive examination conducted when the system was directly connected to the computer through a USB port revealed that the measurement outcomes exhibited a minor delay, approximately 0.3 s in duration.
Additionally, aside from the abrupt changes, the PZEM-004T module tended to overestimate the active power value by approximately 1.5% in comparison to the measurement obtained from the ND30 meter. The power measurement accuracy stated by the makers of both meters is 0.5% [58,59]. Any observed differences can be partially attributed to current distortion. When the total harmonic distortion (THD) factor is lower (e.g., between 30 and 40 s of measurement when the load consisted only of incandescent lamp), the variation in measurement outcomes does not exceed 1%
In the context of employing the PZEM004T module for energy consumption monitoring, the primary focus is on conducting a comparative analysis between the measurements obtained from the proposed system and the values recorded by the watt-hour meter used for billing, as outlined in this article. The measuring system underwent a rigorous testing in an actual residential setting for a period exceeding six months. The PZEM-004T device enables uninterrupted electricity measurement, independent of microcontroller signals. This feature is advantageous as it ensures energy measurement remains unaffected by factors such as loss of Wi-Fi network or absence of communication with the microcontroller. The recorded values of electric energy, as measured by the PZEM-004T device and the watt-hour meter for over six months (from 23 January to 4 August 2023) are presented in Table 1.
The precision of electricity measurement (error 0.73%) is more than adequate for determining the profitability of a given tariff.

3.2. Measurement System Software

The entire measurement system described here consists of three components: the hardware presented in the previous section, the data acquisition system, and the mobile application. The architecture of the system is shown in Figure 7.
The PZEM-004T unit was installed within distribution board of installation and was physically connected to the Wemos D1 Mini microcontroller. The microcontroller reads electrical parameters from PZEM-004T, processes, and sends them via Wi-Fi to a Google Spreadsheet. The mobile application reads data from cloud storage and presents it on smartphone screen.
The software for the Wemos D1 Mini microcontroller was developed using the Arduino Integrated Development Environment (IDE). Voltage, current, active power, power factor, and frequency were measured at intervals of 1 s. Most of metering devices with data storage capabilities track energy use and peak demand as the average in one or more quarter-hourly intervals. Therefore, a series of 900 consecutive measurements was conducted, from which average values were derived over 15-min intervals. Subsequently, these calculated averages were transmitted to the cloud data storage via Wi-Fi. A regular energy measurement was also recorded at 15-min intervals. Additional energy readings are collected and recorded at 6:00, 13:00, 15:00, and 22:00, which coincides with the pricing switches within the G12 tariff. The Network Time Protocol (NTP) was used to retrieve the present time from the time server (europe.pool.ntp.org). The Wemos microcontroller has the capability to function as a server, transmitting real-time measurements of various quantities upon receiving a request from the client, which may be a mobile application or a personal computer. This feature enables the user to observe and track the real-time power consumption of individual devices in the installation. This is achieved by comparing the power used by the entire installation when the specific device is turned on, versus when it is turned off. If deemed essential, this data can be documented, such as by the use of a virtual instrument operating within the LabVIEW environment. The software of the microcontroller demonstrates consistent stability, as no disruptions in its functioning were noticed over a period of six months. In instances where the Wi-Fi connection becomes unavailable, the transmission of data to the cloud storage is interrupted, however, the energy consumption continues to be recorded. Once the Wi-Fi range is detected, the system initiates an automated connection.
Numerous organizations provide a cloud data storage service, typically presenting users with both restricted functionality options and paid alternatives (particularly on a subscription basis). This includes Amazon Web Services, Microsoft Azure, IBM Cloud, Apple iCloud, and others. One of the aims in the development of this system was to minimize costs wherever possible, therefore the free Google Apps service was used along with Google Apps Script (code written within the spreadsheet). The microcontroller transmits data to the spreadsheet, where it is recorded in designated cells, and the script carries out automated calculations upon receiving the data. For instance, it calculates the proportion of off-peak energy in the overall energy consumption for a specific day. The maximum capacity of a Google Spreadsheet is 100 MB or 5 million cells, which is sufficient—after over eight months of usage, a Google Spreadsheet containing all measurement data has approximately 190,000 cells and a size of only around 1.2 MB.
One of the system’s aims was to provide users with easy access to energy consumption data, regardless of their location and the time. Therefore, an Android mobile application was developed using the MIT App Inventor platform. This application downloads data from the Google Spreadsheet and shows statistics and charts regarding energy usage and parameters. Figure 8a shows a screenshot of the mobile application presenting data regarding daily energy consumption since the initiation of measurements (third column) and the share of energy consumed during off-peak hours every day (fourth column). By scrolling down, the user can access data for all days since the beginning of measurements. Another screenshot of an application is shown in Figure 8b. This screen presents the share of off-peak energy within the last 7 and 30 days, and its cost (excluding standing charges and VAT) as per the G11 and G12 tariffs. The current electricity rates, displayed at the bottom of Figure 8b, can be changed by the user by entering appropriate values into specific cells of the Google Spreadsheet.
Furthermore, the mobile application allows for a graphical representation of the active power demand. Each bar in the graph represents the average 15-min power consumption (as shown in Figure 9a). Additionally, the application is capable of generating graphs that depict the 15-min averages of other electrical quantities (voltage, current, power factor) recorded by the measuring equipment, as illustrated in Figure 9b. These graphs can be generated for each day since the beginning of data recording.
In addition to the mobile application charts, users can download recorded data from Google Spreadsheets, which have been collected since the system’s installation. This allows them to import data into other software and create various statistics and charts on an hourly, daily, weekly, or monthly basis for any chosen period. Figure 10 illustrates exemplary charts created in MS Excel 2016.

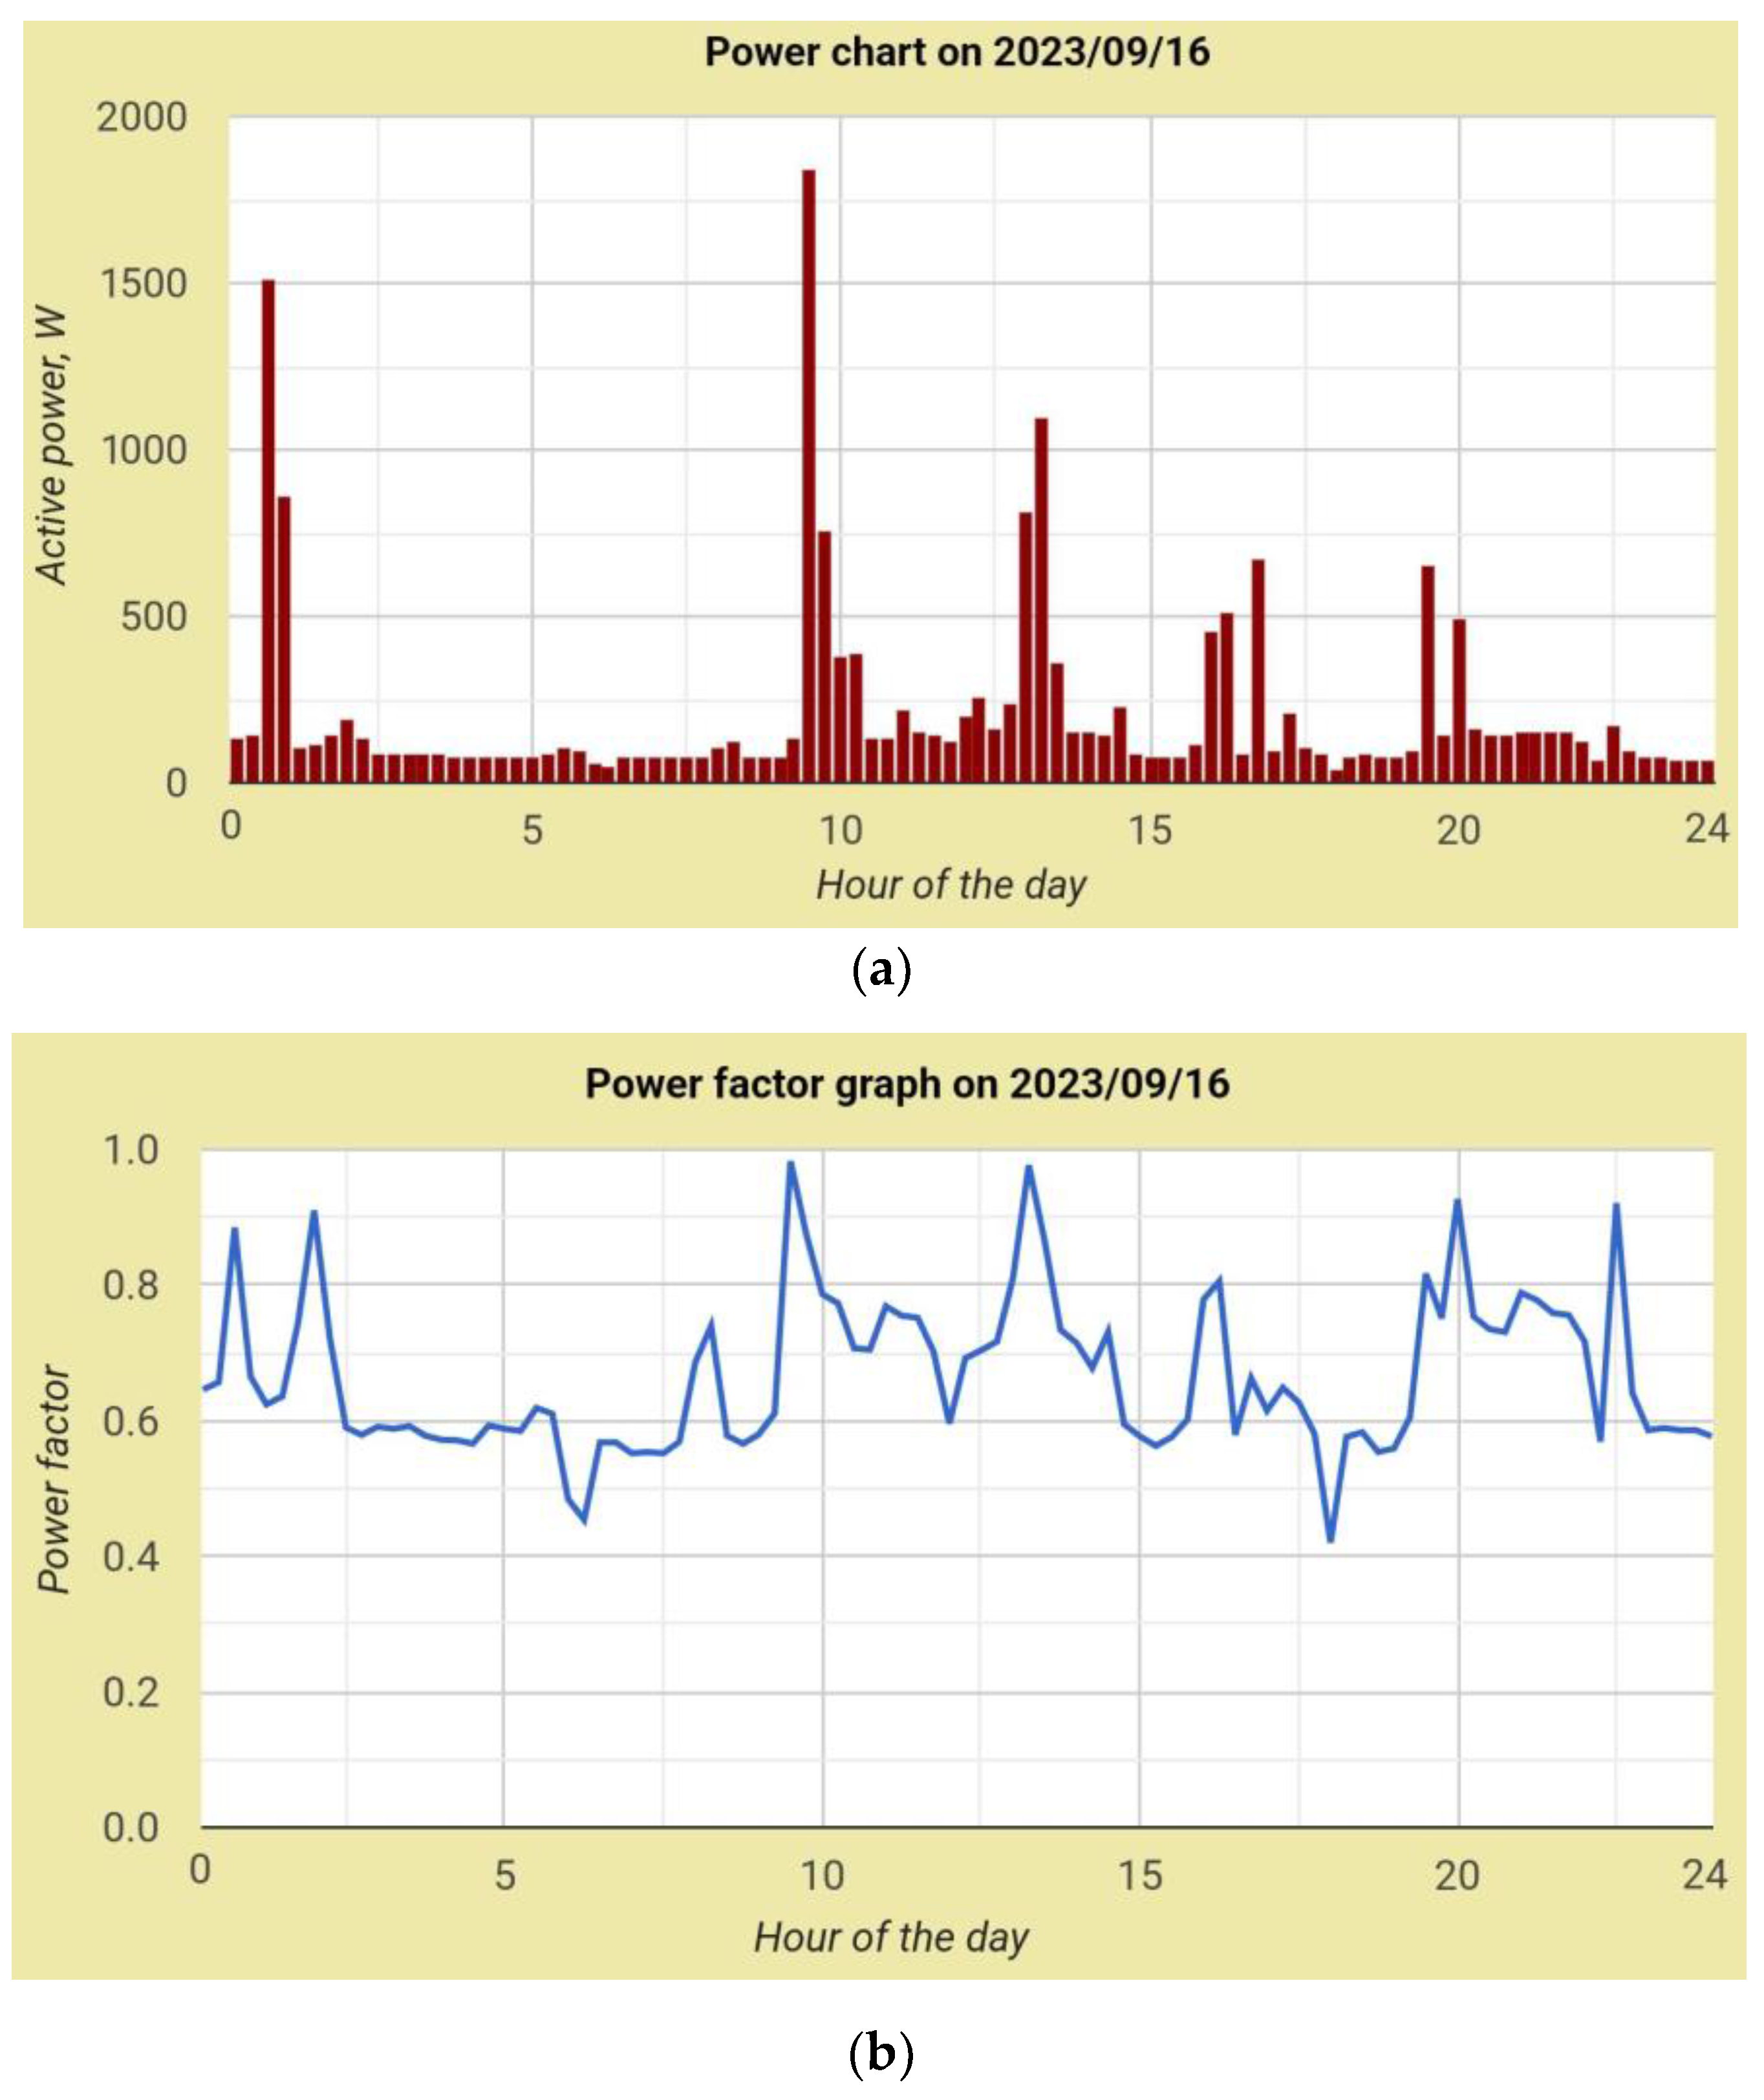
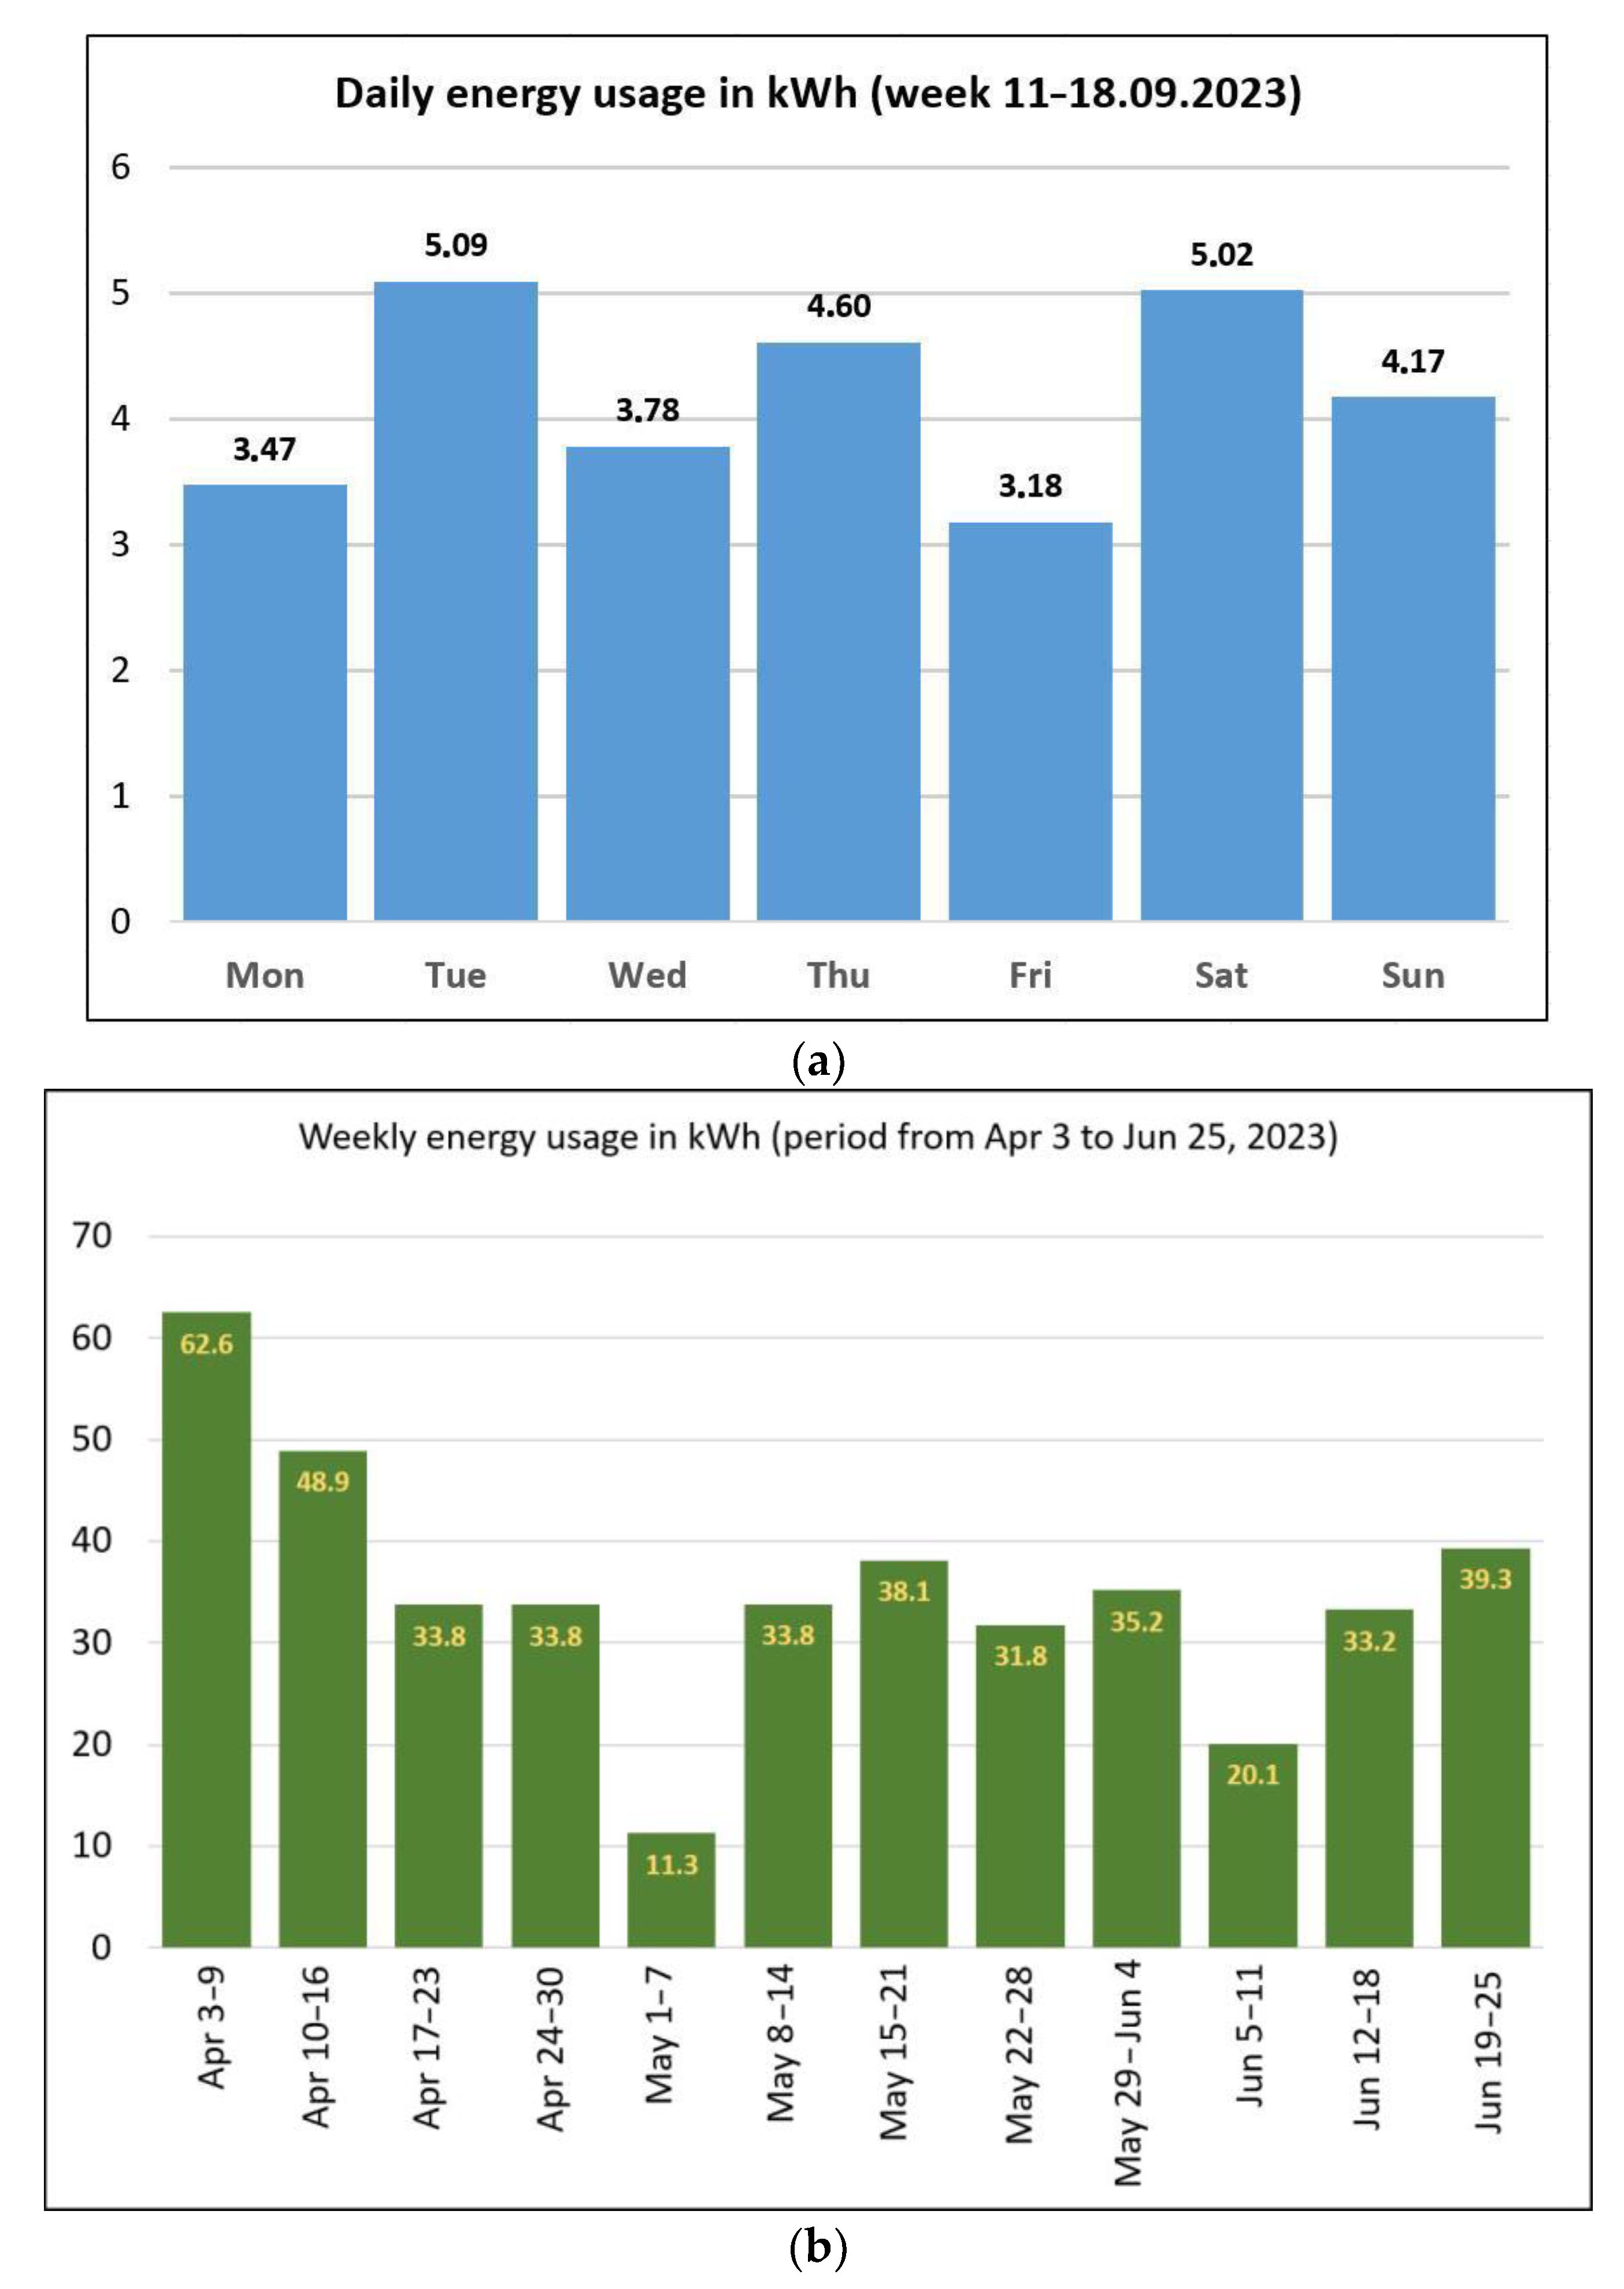
4. Results of Energy Monitoring and Discussion

The aforementioned measurement equipment was installed in the distribution board of a standard residential setting. The occupants, two adults, opted for the G11 tariff.
As mentioned earlier, the metering system enables real-time monitoring of energy parameters (as shown in Figure 11). These parameters are updated every second, enabling users to determine the power consumption of individual devices by comparing the active power before and after turning off a specific appliance.
The initial result of implementing the measurement system was that users of the installation started to pay attention to the energy consumption of unused devices, many of which remained in standby mode for extended periods. These devices include TV sets with tuners, computer set with monitor and speakers, hi-fi system, printer, and others. The total measured active power consumed by these devices in standby mode is approximately 35 W. Assuming these devices are in standby mode for 70–90% of the time on average, completely turning them off (unplugging them from the electrical socket) can save approximately 0.6 to 0.75 kWh per day, or around 220 to 270 kWh per year. This represents approximately 10% of the total energy consumption of the given installation. This value appears to be typical for domestic installations, as supported by research conducted in other countries [60,61,62]. It is estimated [61] that approximately 1% of CO2 emissions are caused by devices operating in standby mode. Although completely switching off such devices may entail certain inconveniences, such as longer start-up times, it not only results in financial savings for the user but also brings measurable environmental benefits in the form of reduced carbon dioxide emissions.
The measurement system was used in the household installation with the G11 tariff for over six months, during which the average daily electricity consumption was 5.5 kWh. Within this period, approximately 38% of the energy was used during off-peak hours (in the G12 time-of-day tariff, off-peak hours account for over 40% of the day). As previously mentioned, a time-of-day tariff is advantageous when more than 29% of energy is consumed during off-peak hours. This suggests that if the installation owner had chosen the G12 rate, the energy cost would have been reduced by PLN 43.37, as indicated in Table 2.
It is essential to emphasize that the individuals using the installation initially did not take into consideration the timing of operation, specifically whether electrical devices were being used during peak or off-peak periods. The findings of the measurements provided motivation for the user of the installation to modify the tariff to G12 and to adjust the operating hours of electricity-consuming devices, such as a washing machine or dishwasher, to the off-peak period. One enabling factor is the inclusion of a timer switch in modern domestic appliances, allowing them to activate during off-peak hours, even when occupants are not present in the residence. During the first six weeks after the tariff change and the adjustment of usage hours for the most energy-intensive devices, the measured daily share of off-peak energy in the installation varied between 19% and 71% with an average of 46%. Total savings (difference between the cost of electricity in G11 and G12 tariff) in this period amounted to approximately PLN 15.
The annual energy consumption of this installation in 2022 amounted to approximately 2300 kWh. It is worth noting that the Polish government froze electricity rates for individual consumers in 2023 at previous year’s level (frozen rates are applicable for the first 2000 kWh used). Without this decision, electricity prices in 2023 would be approximately 2.5 times higher. Table 3 presents a comparison of annual electricity costs for a consumption of 2300 kWh according to the G11 tariff and the G12 tariff, depending on the share of off-peak energy in the total energy consumption in two scenarios—for frozen rates and for 2023 rates.
Based on the results of the conducted measurements, it is expected that by switching to the G12 tariff and optimizing the operating hours of household appliances, the proportion of off-peak energy in the installation will increase to 45–50%, resulting in savings of PLN 200 per year (anticipated savings may reach PLN 300 after releasing energy prices). Additional savings can be achieved by unplugging unused devices to reduce standby power consumption, potentially conserving approximately 200 kWh per year, leading to an additional PLN 120 reduction in energy costs (for a total of PLN 300 after releasing energy prices). This finding contradicts the popular opinion that the two-zone tariff is only advantageous for customers with electric heating.

5. Conclusions

The global trend towards sustainable energy resource management, energy crisis driven by political and economic factors, anticipated increases in energy prices for individual consumers in the coming years, and the climate policy commitments made by the Polish government will intensify the pressure to rationalize both the production and utilization of electrical energy. An examination of the current state of electricity generation from renewable energy sources in Poland, along with the projected increase in the proportion of wind and solar energy in the energy mix, suggests that instances of RES overproduction will become more frequent during periods of reduced energy demand. Generally, individual end-use customers do not pay significant attention to the timing of electricity usage. Shifting energy consumption to off-peak hours will enable better utilization of RES during overproduction periods and reduce the burden on conventional power plants during peak hours, resulting in economic and environmental benefits. One mechanism that encourages this shift is the reduced price of energy during off-peak hours within the G12 tariff zone, which is currently utilized by a relatively small number of end consumers. This article proposes a cost-effective energy monitoring system that allows for real-time tracking of energy consumption and facilitates informed decision-making regarding the switch from a flat-rate tariff to a time-of-day tariff. Over a period of more than seven months of system use, it demonstrated its usefulness and encouraged users to change to time-of-day tariff and rationalize the use of electrical devices by adjusting the usage hours of selected appliances and unplugging devices that remain in standby mode for long periods of time. These changes are expected to yield not only tangible financial benefits for installation owners but also result in environmental advantages through the reduction of CO2 emissions.

Funding

This research received no external funding.

Institutional Review Board Statement

Not applicable.

Informed Consent Statement

Not applicable.

Data Availability Statement

The data regarding electrical energy production and usage was developed on the basis of TSO daily reports [1] and monthly bulletins of the Ministry of Climate and Environment [29]. Source codes for data storage cloud (GoogleApps Script), microcontroller and mobile applications are available on GitHub repository (https://github.com/SergiuszB/Sustainable, accessed on 31 August 2023). Additional information is available on request from the corresponding author.

Conflicts of Interest

The author declares no conflict of interest.

References

  1. PSE. Available online: https://www.pse.pl/dane-systemowe/funkcjonowanie-kse/raporty-dobowe-z-pracy-kse (accessed on 15 August 2023).
  2. GEPL. Available online: https://globenergia.pl/ponad-16-mln-zl-tyle-kosztowalo-polske-ograniczenie-energii-z-oze-w-dwa-dni (accessed on 15 August 2023).
  3. PGL. Available online: https://www.bloomberg.com/news/articles/2023-04-23/polish-grid-limits-renewable-power-generation-due-to-oversupply (accessed on 19 October 2023).
  4. Andruszkiewicz, J.; Lorenc, J.; Borowiak, W.; Michalski, A. Time of use tariff design for domestic customers integrating the management goals of efficient energy purchase and delivery. In Proceedings of the 12th International Conference on the European Energy Market (EEM), Lisbon, Portugal, 19–22 May 2015; pp. 1–5. [Google Scholar] [CrossRef]
  5. Haghdadi, N.; MacGill, I.; Gorman, N.; Passey, R.; Bruce, A. An open source tool for analyzing the impact of electricity network and retail tariffs on consumers. In Proceedings of the 2020 IEEE Power & Energy Society General Meeting (PESGM), Montreal, QC, Canada, 2–6 August 2020; pp. 1–5. [Google Scholar] [CrossRef]
  6. Ihbal, A.M.; Rajamani, H.S.; Abd-Alhameed, R.A.; Jalboub, M.K. The influence of different tariffs schemes on electricity consumption for the UK domestic buildings. In Proceedings of the Eighth International Multi-Conference on Systems, Signals & Devices, Sousse, Tunisia, 22–25 March 2011; pp. 1–6. [Google Scholar] [CrossRef]
  7. Moghadam, M.N.; Abapour, M. IoT-based Office Buildings Energy Management with Distributed Edge Computing Capability. In Proceedings of the 8th International Conference on Technology and Energy Management (ICTEM), Mazandaran, Iran, 8–9 February 2023; pp. 1–5. [Google Scholar] [CrossRef]
  8. Saleem, M.U.; Usman, M.R.; Usman, M.A.; Politis, C. Design, Deployment and Performance Evaluation of an IoT Based Smart Energy Management System for Demand Side Management in Smart Grid. IEEE Access 2022, 10, 15261–15278. [Google Scholar] [CrossRef]
  9. Mir, U.; Abbasi, U.; Mir, T.; Kanwal, S.; Alamri, S. Energy Management in Smart Buildings and Homes: Current Approaches, a Hypothetical Solution, and Open Issues and Challenges. IEEE Access 2021, 9, 94132–94148. [Google Scholar] [CrossRef]
  10. Reka, S.S.; Dragicevic, T. Future effectual role of energy delivery: A comprehensive review of Internet of Things and smart grid. Renew. Sustain. Energy Rev. 2018, 91, 90–108. [Google Scholar] [CrossRef]
  11. Raiker, G.A.; Reddy, B.S.; Umanand, L.; Agrawal, S. Internet of Things based Demand Side Energy Management System using Non-Intrusive Load Monitoring. In Proceedings of the IEEE International Conference on Power Electronics, Smart Grid and Renewable Energy (PESGRE2020), Cochin, India, 2–4 January 2020; pp. 1–5. [Google Scholar] [CrossRef]
  12. Tsao, T.-F.; Kuo, C.-C. A smart monitoring and control system for the household electric power usage. In Proceedings of the IEEE PES Asia-Pacific Power and Energy Engineering Conference (APPEEC), Hong Kong, China, 8–11 December 2013; pp. 1–4. [Google Scholar] [CrossRef]
  13. Rokonuzzaman, M.; Mishu, M.K.; Islam, M.R.; Hossain, M.I.; Shakeri, M.; Amin, N. Design and Implementation of an IoT-Enabled Smart Plug Socket for Home Energy Management. In Proceedings of the 5th International Conference on Smart Grid and Smart Cities (ICSGSC), Tokyo, Japan, 18–20 June 2021; pp. 50–54. [Google Scholar] [CrossRef]
  14. Rahman, M.M.; Van Heerden, C.; Shafiullah, G.M. Electricity Tariffs Evaluation Using Smart Load Monitoring Devices for Residential Consumer. In Proceedings of the 3rd Asia-Pacific World Congress on Computer Science and Engineering (APWC on CSE), Nadi, Fiji, 5–6 December 2016; pp. 265–270. [Google Scholar] [CrossRef]
  15. Sivakumar, S.A.; Kumar, R.; Ayshwarya, B.; Ponnusamy, H.S.M.; Ganesh, R.S. IoT Based Smart Energy Forecasting and Data Logging System. In Proceedings of the 5th International Conference on Computing Methodologies and Communication (ICCMC), Erode, India, 8–10 April 2021; pp. 783–787. [Google Scholar] [CrossRef]
  16. Fernandes, J.B.; Sangeetha, D.P.; Padmapriya, G.; Sekar, K. IoT based Energy Assistive Meter to Analyse the Electricity usage in Commercial and Household uses via Wirelessly in a Cloud Network. In Proceedings of the International Conference on Power, Energy, Control and Transmission Systems (ICPECTS), Chennai, India, 8–9 December 2022; pp. 1–4. [Google Scholar] [CrossRef]
  17. Balamurugan, S.; Saravanakamalam, D. Energy monitoring and management using internet of things. In Proceedings of the International Conference on Power and Embedded Drive Control (ICPEDC), Chennai, India, 16–18 March 2017; pp. 208–212. [Google Scholar] [CrossRef]
  18. Chaudhari, B.; Shinde, N.; Yelave, G.; Sonawane, G.; Borse, K. Real-Time Electricity Bill Management System Using IoT. In Proceedings of the 5th IEEE International Conference on Emerging Smart Computing and Informatics (ESCI), Pune, India, 1–3 March 2023; pp. 1–5. [Google Scholar] [CrossRef]
  19. Choudhari, A.; Manekar, A.; Tirgure, M.; Ranglani, S.; Dhongde, P.; Gawai, J. Smart Device for Electricity Management. In Proceedings of the 5th International Conference on Energy, Power and Environment: Towards Flexible Green Energy Technologies (ICEPE), Shillong, India, 15–17 June 2023; pp. 1–6. [Google Scholar] [CrossRef]
  20. Ravishankar, A.; Vignesh, A.; Vel, V.; Dhiwaakar Purusothaman, S.R.R.; Vijayaraghavan, V. Low-cost non-intrusive residential energy monitoring system. In Proceedings of the IEEE Conference on Technologies for Sustainability (SusTech), Portland, OR, USA, 24–26 July 2014; pp. 130–134. [Google Scholar] [CrossRef]
  21. Santhosh, P.; Singh, A.K.S.; Ajay, M.; Gaayathry, K.; Haran, H.S.; Gowtham, S. IoT based Monitoring and Optimizing of Energy Utilization of Domestic and Industrial Loads. In Proceedings of the 5th International Conference on Intelligent Computing and Control Systems (ICICCS), Madurai, India, 6–8 May2021; pp. 393–397. [Google Scholar] [CrossRef]
  22. Adriani, F.; Agung, T.K.; Syafii. IoT System for Household Electrical Appliance Monitoring and Control. In Proceedings of the International Conference on Technology and Policy in Energy and Electric Power (ICT-PEP), Jakarta, Indonesia, 18–20 October 2022; pp. 244–248. [CrossRef]
  23. Angdresey, A.; Sitanayah, L.; Rumpesak, Z.M.P. An Electricity Consumption Monitoring and Prediction System Based on The Internet of Things. In Proceedings of the Seventh International Conference on Informatics and Computing (ICIC), Denpasar, Bali, Indonesia, 8–9 December 2022; pp. 1–6. [Google Scholar] [CrossRef]
  24. Hlaing, W.; Thepphaeng, S.; Nontaboot, V.; Tangsunantham, N.; Sangsuwan, T.; Pira, C. Implementation of WiFi-based single phase smart meter for Internet of Things (IoT). In Proceedings of the International Electrical Engineering Congress (iEECON), Pattaya, Thailand, 8–10 March 2017; pp. 1–4. [Google Scholar] [CrossRef]
  25. Syafii; Luthfi, A.; Rozzi, Y.A. Design of Raspberry Pi Web-based Energy Monitoring System for Residential Electricity Consumption. In Proceedings of the International Conference on Information Technology Systems and Innovation (ICITSI), Bandung, Indonesia, 19–22 October 2020; pp. 192–196. [Google Scholar] [CrossRef]
  26. TUYA. Available online: https://expo.tuya.com/smart/electrical/meters/electric-energy-meters/CT9cn90yyaumny-CT9cn97xhrpq8v-CT9cnfmde762bm (accessed on 31 August 2023).
  27. ACREL. Available online: https://www.jsacrel.com/ProDetail/ADW-Series-IoT-wireless-Power-Meter-ADW310-WIFI (accessed on 31 August 2023).
  28. IAM. Available online: https://www.iammeter.com/products/single-phase-meter (accessed on 31 August 2023).
  29. ARA. Informacja Statystyczna o Energii Elektrycznej. Ministerstwo Klimatu i Środowiska. Agencja Rynku Energii, S.A. Available online: https://www.are.waw.pl/wydawnictwa#informacja-statystyczna-o-energii-elektrycznej (accessed on 15 August 2023).
  30. PVA. Available online: https://lepiej.tauron.pl/zielona-energia/fotowoltaika-autokonsumpcja-jak-ja-zwiekszyc/ (accessed on 15 August 2023).
  31. Faraji Abdolmaleki, S.; Esfandiary Abdolmaleki, D.; Bello Bugallo, P.M. Finding Sustainable Countries in Renewable Energy Sector: A Case Study for an EU Energy System. Sustainability 2023, 15, 10084. [Google Scholar] [CrossRef]
  32. Kulpa, J.; Olczak, P.; Surma, T.; Matuszewska, D. Comparison of Support Programs for the Development of Photovoltaics in Poland: My Electricity Program and the RES Auction System. Energies 2022, 15, 121. [Google Scholar] [CrossRef]
  33. Wang, Y.; Lou, S.; Wu, Y.; Wang, S. Flexible Operation of Retrofitted Coal-Fired Power Plants to Reduce Wind Curtailment Considering Thermal Energy Storage. IEEE Trans. Power Syst. 2020, 35, 1178–1187. [Google Scholar] [CrossRef]
  34. Metodyka Obliczeń Wartości Parametrów Techniczno-Ekonomicznych. Polskie Sieci Elektroenergetyczne 2020. Available online: https://www.pse.pl/documents/20182/98611984/Metodyka_obliczen_wartosci_parametrow_techniczno-ekonomicznych.pdf (accessed on 15 August 2023).
  35. Maradin, D. Advantages and disadvantages of renewable energy sources utilization. Int. J. Energy Econ. Policy 2021, 11, 176–183. [Google Scholar] [CrossRef]
  36. Karcz, A.; Burmistrz, P.; Strugała, A. Oszacowanie emisji CO2 związanej z wydobyciem, wzbogacaniem i transportem węgli—Otencjalnych surowców dla procesów wytwarzania wodoru. Polityka Energetyczna 2009, 12, 93–110. Available online: https://min-pan.krakow.pl/wydawnictwo/wp-content/uploads/sites/4/2017/12/karcz-burmistrz-strugala-POL.pdf (accessed on 15 August 2023).
  37. SBKSE. Available online: https://www.pse.pl/biuro-prasowe/aktualnosci/-/asset_publisher/fwWgbbtxcZUt/content/informacja-osp-w-sprawie-sytuacji-bilansowej-kse-w-okresie-30-12-2022-r-1-01-2023-r- (accessed on 15 August 2023).
  38. Atănăsoae, P.; Pentiuc, R.D.; Hopulele, E.; Ailoae, I.C.; Irimia, C.F. Analysis of the Price Coupling Mechanism in the Day Ahead Electricity Markets. In Proceedings of the 8th International Conference on Modern Power Systems (MPS), Cluj, Romania, 21–23 May 2019; pp. 1–4. [Google Scholar] [CrossRef]
  39. TGE. Available online: https://tge.pl/ (accessed on 19 October 2023).
  40. WNOZE. Available online: https://wysokienapiecie.pl/93216-oze-pokryly-97-zapotrzebowania-polski-piec-godzin-ujemnych-cen-pradu/ (accessed on 19 October 2023).
  41. PSPP. Available online: https://wysokienapiecie.pl/82421-pge-tauron-i-orlen-zbuduja-elektrownie-szczytowo-pompowe/ (accessed on 19 October 2023).
  42. Malinowski, M.; Leon, J.I.; Abu-Rub, H. Solar Photovoltaic and Thermal Energy Systems: Current Technology and Future Trends. Proc. IEEE 2017, 105, 2132–2146. [Google Scholar] [CrossRef]
  43. Kopeć, S.; Lach, Ł.; Spirydowicz, A. Wpływ rozbudowy infrastruktury fotowoltaicznej na rozwój gospodarczy w Polsce—prognoza do 2040 r. Energetyka Rozproszona 2022, 7, 29–53. [Google Scholar] [CrossRef]
  44. Kopeć, S.; Lach, Ł.; Adamska, B.; Wrocławski, M.; Szczeciński, P. Wpływ Rozbudowy Infrastruktury Magazynów Energii na Rozwój Gospodarczy w Polsce—Prognoza do 2040 r. Analizy AGH. 2022. Available online: https://psme.org.pl/wp-content/uploads/2022/05/RAPORT_komunikat-2_2022.pdf (accessed on 15 August 2023).
  45. Farinet, D.; Maurer, M.; Vacca, L.; Spataru, S.V.; Stroe, D.-I. Battery Lifetime Analysis for Residential PV-Battery System used to Optimize the Self Consumption—A Danish Scenario. In Proceedings of the IEEE Energy Conversion Congress and Exposition (ECCE), Baltimore, MD, USA, 29 September–3 October 2019; pp. 6693–6698. [Google Scholar] [CrossRef]
  46. Cetinkaya, U.; Demirbas, S.; Ayik, S.; Bayindir, R. Battery Energy Storage Systems in Different Countries for Arbitrage Services. In Proceedings of the 11th International Conference on Smart Grid (icSmartGrid), Paris, France, 4–7 June 2023; pp. 1–5. [Google Scholar] [CrossRef]
  47. Agrela, J.C.; Rezende, I.; Soares, T. Analysis of battery energy storage systems participation in multi-services electricity markets. In Proceedings of the 18th International Conference on the European Energy Market (EEM), Ljubljana, Slovenia, 13–15 September 2022; pp. 1–6. [Google Scholar] [CrossRef]
  48. Augustine, C.; Blair, N. Energy Storage Futures Study: Storage Technology Modeling Input Data Report. Golden, CO: National Renewable Energy Laboratory, 2021. NREL/TP-5700-78694. Available online: https://www.nrel.gov/docs/fy21osti/78694.pdf (accessed on 15 August 2023).
  49. Siewierski, T.; Malarek, A. Optimization of Battery Storage Capacity and Operation for Balancing Residential PV Installation. In Proceedings of the 14th International Conference on Software, Knowledge, Information Management and Applications (SKIMA), Phnom Penh, Cambodia, 2–4 December 2022; pp. 104–109. [Google Scholar] [CrossRef]
  50. Hamanee, S.; Wahlstedt, E.; Lazarou, S.; Theocharis, A. Measurements and analysis of electrical power consumption patterns for the computation of an aggregated battery energy storage system. In Proceedings of the IEEE International Conference on Environment and Electrical Engineering and 2020 IEEE Industrial and Commercial Power Systems Europe (EEEIC/I&CPS Europe), Madrid, Spain, 9–12 June 2020; pp. 1–6. [Google Scholar] [CrossRef]
  51. Haegel, N.M.; Kurtz, S.R. Global Progress Toward Renewable Electricity: Tracking the Role of Solar. IEEE J. Photovolt. 2021, 11, 1335–1342. [Google Scholar] [CrossRef]
  52. Zawada, M.; Szajt, M. Energy Consumption in Poland—Global and Sector Perspective. In Proceedings of the 5th International Conference on the European Electricity Market, Lisbon, Portugal, 28–30 May 2008; pp. 1–4. [Google Scholar] [CrossRef]
  53. Kumar, S.; Madlener, R. Renewable energy roadmap for central Europe until 2050: A scenario based techno-economic analysis. In Proceedings of the 21st Century Energy Needs—Materials, Systems and Applications (ICTFCEN), Kharagpur, India, 17–19 November 2016; pp. 1–6. [Google Scholar] [CrossRef]
  54. Angheluta, S.P.; Burlacu, S.; Diaconu, A.; Curea, C.S. The Energy from Renewable Sources in the European Union: Achieving the Goals. Eur. J. Sustain. Dev. 2019, 8, 57–65. [Google Scholar] [CrossRef]
  55. IZEE. Available online: https://nowa-energia.com.pl/2022/12/19/ile-zaplacimy-za-energie-elektryczna-od-stycznia-2023-r (accessed on 15 August 2023).
  56. Wyciąg z Taryfy Dla Energii Elektrycznej w Zakresie Dystrybucji Energii Elektrycznej TAURON Dystrybucja, S.A. na rok. 2023. Available online: https://www.tauron-dystrybucja.pl/-/media/offer-documents/dystrybucja/aktualna-taryfa/wyciag-z-taryfy-td-sa-na-rok-2023-dla-odbiorcow-grup-g.ashx (accessed on 15 August 2023).
  57. Taryfa Dla Energii Elektrycznej Sprzedaży Kompleksowej z Urzędu TAURON Sprzedaż GZE Spółka z o.o. Available online: https://www.tauron.pl/-/media/offer-documents/dokumenty-do-taryfy/taryfa-dokumenty/taryfa-sprzedawcy/gze-1-01-2021/20220201-gze-taryfa-sprzeda%C5%BC-gze-g-k-www.ashx (accessed on 15 August 2023).
  58. PZEM-004T Voltage Current Watt Meter Single Phase. Product Parameters. Ningbo Peacefair Electronic Technology. Available online: http://en.peacefair.cn/products/3487.html (accessed on 15 August 2023).
  59. Power Network Meter ND30. User’s Manual. LUMEL S.A. 2022. Available online: https://www.lumel.com.pl/resources/Pliki%20do%20pobrania/ND30/ND30_service_manual.pdf (accessed on 15 August 2023).
  60. Cora, A.; Güçlü, H. A complete solution for the problem of eliminating residential stand-by power and protecting them against over voltage and over current. In Proceedings of the International Symposium on Innovations in Intelligent Systems and Applications, Trabzon, Turkey, 2–4 July 2012; pp. 1–5. [Google Scholar] [CrossRef]
  61. Mcgarry, L. Standby power challenge. In Proceedings of the International IEEE Conference on the Asian Green Electronics (AGEC), Hong Kong, China & Shenzhen, China, 7–9 January 2004; pp. 56–62. [Google Scholar] [CrossRef]
  62. Gram-Hanssen, K.; Kofod, C.; Nærvig Petersen, K. Different everyday lives: Different patterns of electricity use. In Proceedings of the ACEEE Summer Study on Energy Efficiency in Buildings, Pacific Grove, CA, USA, 22 August 2004; pp. 1–13. [Google Scholar]
Figure 1. Map of annual insolation in Poland in kWh/m2 (long-term average from period 1994–2018) © 2023 The World Bank, Source: Global Solar Atlas 2.0, Solar resource data: Solargis.
Sustainability 15 15507 g001
Figure 2. Comparison of PV power plants output (a) and purchase energy prices (b) on 22 and 23 April 2023. Insolation on these two days was similar, lower output of PV on 23 April resulted from production decrease mandated by TSO, own elaboration based on [1].
Sustainability 15 15507 g002
Figure 3. Comparison of PV power plants output (a) and purchase energy prices (b) on 1 and 2 July 2023. Insolation on these two days was similar, lower output of PV on 2 July resulted from production decrease mandated by TSO, own elaboration based on [1].
Sustainability 15 15507 g003
Figure 4. Measuring device for monitoring energy consumption (1—PZEM-004T, 2—current transformer, 3—Wemos D1 Mini, 4—power supply module).
Sustainability 15 15507 g004
Figure 5. Laboratory stand for PZEM-004T for accuracy assessment. 1—ND30 Power Meter, 2—PZEM-004T module, 3—RS485-USB converter for ND30 measurements reading.
Sustainability 15 15507 g005
Figure 6. Comparison of active power measurements by ND30 (blue line) and PZEM-004T devices (red line). The load varied by turning on and off the receivers connected to the measuring system.
Sustainability 15 15507 g006
Figure 7. Block diagram showing architecture of proposed electrical energy measurement system.
Sustainability 15 15507 g007
Figure 8. Screenshots of mobile application. (a) Daily energy consumption in kWh (third column) and percentage of off-peak energy (fourth column); (b) off-peak energy percentage and cost of energy as per G11 and G12 tariff in last 7 and 30 days.
Sustainability 15 15507 g008
Figure 9. Screenshots of the mobile application. (a) Active power chart (15-min average); (b) power factor graph.
Sustainability 15 15507 g009
Figure 10. Exemplary charts of energy usage created in MS Excel based on data downloaded from Google Spreadsheet: (a) daily energy consumption during a week; (b) weekly energy consumption between 3 April and 25 June 2023.
Sustainability 15 15507 g010
Figure 11. Screenshot of mobile application for real-time monitoring of electrical parameters of installation (displayed parameters are updated every second).
Sustainability 15 15507 g011
Table 1. Comparison of energy consumption measurements.
Number of DaysPZEM-004T Measurement EPWatt-Hour Meter Measurement EWPercentage Difference
(EPEW)/EP × 100
1921053.7 kWh1046 kWh0.73%
Table 2. Comparison of electricity costs for the G11 and G12 tariffs in a home installation.
DaysPeak EnergyOff-Peak EnergyCost G11 1Cost G12 1
192645 kWh401 kWh758.31 PLN714.94 PLN
1 including VAT, excluding standing charges (electricity rates according to [56,57]).
Table 3. Comparison of annual electricity cost (in PLN) for the G11 and G12 tariffs depending on the share of off-peak energy (for a consumption of 2300 kWh).
Tariff and Share of Off-Peak EnergyG11G12 (10%)G12 (20%)G12 (30%)G12 (40%)G12 (50%)
Annual cost (frozen rates), PLN 1166718721766166015541448
Annual savings after switching from G11 to G12 tariff, PLN−205−997113219
Annual cost (2023 rates), PLN 1397344094190397137523532
1 including VAT, excluding standing charges (electricity rates according to [56,57]).
Disclaimer/Publisher’s Note: The statements, opinions and data contained in all publications are solely those of the individual author(s) and contributor(s) and not of MDPI and/or the editor(s). MDPI and/or the editor(s) disclaim responsibility for any injury to people or property resulting from any ideas, methods, instructions or products referred to in the content.

