Article

Influence of Psychological and Socioeconomic Factors on Purchase Likelihood for Autonomous Vehicles: A Hybrid Choice Modeling Approach

1
School of Traffic & Transportation Engineering, Central South University, Changsha 410075, China
2
College of Transportation Engineering, Tongji University, Shanghai 201804, China
3
School of Business, Xinjiang University, Urumqi 830091, China
*
Author to whom correspondence should be addressed.
Sustainability 2023, 15(21), 15452; https://doi.org/10.3390/su152115452
Submission received: 26 July 2023 / Revised: 3 October 2023 / Accepted: 17 October 2023 / Published: 30 October 2023

Abstract

:
This study looks into how psychological and socioeconomic factors interact to affect people’s propensity to purchase autonomous vehicles (AVs). Inspired by the Technology Acceptance Model, six psychological variables—social influence, convenience, perceived utility, perceived ease of use, perceived risk, and usage attitude—are proposed. Twenty-two measurement variables are introduced because it is difficult to measure these latent factors directly. To understand the link between the latent variables and calculate their factor scores, a structural equation model is created. The latent variables, along with observable socioeconomic attributes, are included as explanatory variables in a mixed logit model to estimate the purchase likelihood for AVs on different levels. A stated preference survey is conducted for data collection. We obtained 302 effective samples. The experiment results demonstrate that perceived usefulness has the most significant positive impact on purchase likelihood, followed by social influence and perceived ease of use. However, perceived risk has a significant negative impact on the purchase likelihood. Individuals with less driving experience and those without a motor vehicle driving license are more inclined to adopt autonomous vehicles. Additionally, there is a substantial correlation between the frequency of car use and the propensity to support the deployment of autonomous vehicles.

1. Introduction

Understanding how different factors affect users’ purchase likelihood for autonomous vehicles (AVs) is important for users and manufacturers. AVs are intelligent cars that achieve driverless operation through computer systems. In 2018, SAE International defined six levels of driving automation for these vehicles: L0 (No Automation), L1 (Driver Assistance), L2 (Partial Automation), L3 (Conditional Automation), L4 (High Automation), and L5 (Full Automation) [1]. Potential consumers of AVs include mass-market travelers, transportation managers in government departments, logistics and freight companies, etc., and consumers of AVs who need to perform special tasks [2]. This paper focuses on vehicles of level L3 and above, wherein the autonomous vehicles can handle all driving tasks under specific conditions without human intervention. AVs have great potential in contributing to sustainability. They are anticipated to significantly reduce traffic accidents caused by human errors, leading to safer roads and reducing the negative societal impacts of traffic-related fatalities. Also, they are expected to relieve traffic congestion. This will lead to shorter travel time and lower greenhouse gas emissions [3]. The latter is consistent with the Sustainable Development Goals of the United Nations [4]. There are already some AV deployments in some countries, such as China [5], Germany [6], and the United States [7]. How likely are users to purchase Avs and how is it possible to increase the likelihood? These questions bring the need to understand how different factors affect users’ purchase likelihood for AVs at present and in the future. This is important because this understanding helps the manufacturers improve the products and marketing strategies, and provides more comfortable AV services for users.
There are many factors influencing users’ purchase likelihood for AVs, including users’ personal characteristics, perceptions and attitudes toward autonomous driving technology, expectations and needs for autonomous vehicles, and the influence of the external environment. These factors can be classified into psychological and socioeconomic types. As pointed out by Shariff et al. [8], the biggest obstacle on the road to the large-scale adoption of AVs is not technological but psychological in nature. There are still many consumers who are cautious and skeptical about the feasibility and safety of AVs [9]. This may affect their acceptance of and willingness to use autonomous driving due to issues such as the safety of autonomous driving vehicles, the psychological state of users, and their trust in and adaptability to autonomous driving vehicles. However, the effect of psychological factors, let alone the coupled effect of the two types of factors on the purchase likelihood for AVs, is unknown. The objective of this study is to investigate the effect of psychological factors and the coupled effect. The methodology developed in this study is applicable all over the world, but will first be tested in China due to research resource limitations. In further studies, the results obtained by this study will be adjusted based on samples from all over the world to reduce bias.

2. Literature Review

This section reviews existing studies on the impact of socioeconomic and psychological factors on purchase likelihood for AVs.

2.1. Impact of Socioeconomic Factors on Purchase Likelihood for AVs

Socioeconomic status has a wide-ranging impact on an individual’s life philosophy, opportunities, and choices. Thus, many studies have explored the diverse socioeconomic features of people and their impact on AV adoption.
Purchasing power is a crucial factor influencing consumer acceptance of AVs [10]. Higher-income individuals may be more likely to purchase upscale products and enjoy luxury spending, while lower-income individuals may be more concerned with affordability. The high price of AVs may classify them as luxury items affordable only to a portion of consumers [11]. Therefore, the public is highly sensitive to the cost–performance ratio of AVs, and the level of this ratio is likely to significantly impact individuals’ acceptance [12]. Keoleian, G. A. also looked at the environmental economic attributes of autonomous vehicles, finding that the use of these vehicles can reduce greenhouse gas emissions, thereby contributing to environmental protection [10]. This environmental benefit may play a part in the acceptance of self-driving cars. M.NORUZOLIAEE et al. found that users with higher travel time values tend to choose AVs over traditional vehicles [13]. However, these literature studies have completely ignored social impacts, competence norms, and users’ perceptual attitudes towards new products, relying solely on product attributes (such as purchase price and technological features) to predict the adoption of emerging products such as electric vehicles or AVs [14].
Users with a greater need to save time are more inclined to purchase AVs. users who may live in congested urban areas and therefore may benefit more from autonomous driving technology to improve the commuting experience [15]. Gender analysis showed that men were more likely to adopt and use personal self-driving cars and small self-driving cars compared to women [16]. Socioeconomic status may also influence an individual’s cultural and social acceptance of automated driving technology. Automated driving is an emerging technology and well-educated individuals may be able to understand and access information about AVs more easily, which also greatly influences consumer decision-making [17]. Meanwhile, the recent literature reports that effective organizational infrastructures and institutional frameworks (e.g., relevant policies, regulations, financial incentives, research, and development) can positively influence the adoption of autonomous vehicles and related technologies, and that socioeconomics may also influence consumers in terms of policy and regulatory measures [18].
Because of improved safety measures, amenities such as multitasking opportunities and the ability to share self-driving cars among family members, married couples are more likely to adopt and use self-driving cars and small self-driving cars than single individuals [19]. Fagnant, D.J. et al. argue that government policies can drive the adoption of autonomous vehicles by reducing costs, providing incentives, and regulating safety standards [20].

2.2. Impact of Psychological Factors on Purchase Likelihood for AVs

Psychological factors significantly affect the acceptance of new technologies and the penetration of new products. Scholars argue that trust directly impacts acceptance intention while attitudes, perceived usefulness, and perceived ease of use indirectly affect acceptance intention [21]. With further research, some researchers have found that the introduction of autonomous driving technology is not a panacea for all problems [22]. Instead, it is necessary to consider different user needs to provide customized transportation services [23]. Perceived usefulness is a measure of individuals’ beliefs about whether using a specific system will enhance their job performance [15]. Perceived ease of use refers to individuals’ perceptions of how easy or difficult a particular system or technology is to use [12]. Xiao et al. [24] found that perceived ease of use can directly influence the intention to accept autonomous driving technology and can indirectly affect it through attitudes and perceived usefulness. Recently, although it has been found that perceived ease of use can have a direct or indirect effect on public acceptance of autonomous driving technology, there is a significant variation in the public’s perception of its difficulty level. Furthermore, perceived risk is a major factor that hinders the diffusion rate of innovative products and is often incorporated into the Technology Acceptance Model. Perceived risk indirectly affects acceptance through attitudes [25]. Hedonic motivation, social influence, and performance expectations influence behavioral Intentions to purchase and use conditionally autonomous vehicles [26].

2.3. Contributions

It can be found that previous studies mainly concentrate on quantitively analyzing the impact of socioeconomic factors on purchase likelihood for AVs. Even though some existing studies demonstrated that the impact of psychological factors is ignorable through statistical description, very few of them shed light on quantitatively analyzing the impact of psychological factors, let alone the coupled impact of psychological and socioeconomic factors on the purchase likelihood for AVs. The theoretical contribution of this study is that a hybrid choice model consisting of a structural equation model (SEM) and a logit model is developed to quantitatively analyze the impact of psychological factors, and, more importantly, the coupled impact of psychological and socioeconomic factors on the purchase likelihood for AVs. The managerial contribution of this study is that perceived usefulness is found to have the most significant positive impact on purchase likelihood, followed by social influence, perceived ease of use, and perceived risk. Also, when the impact of psychological factors is considered and not considered, education level does and does not show a significant impact on the purchase likelihood, respectively.

3. Methods

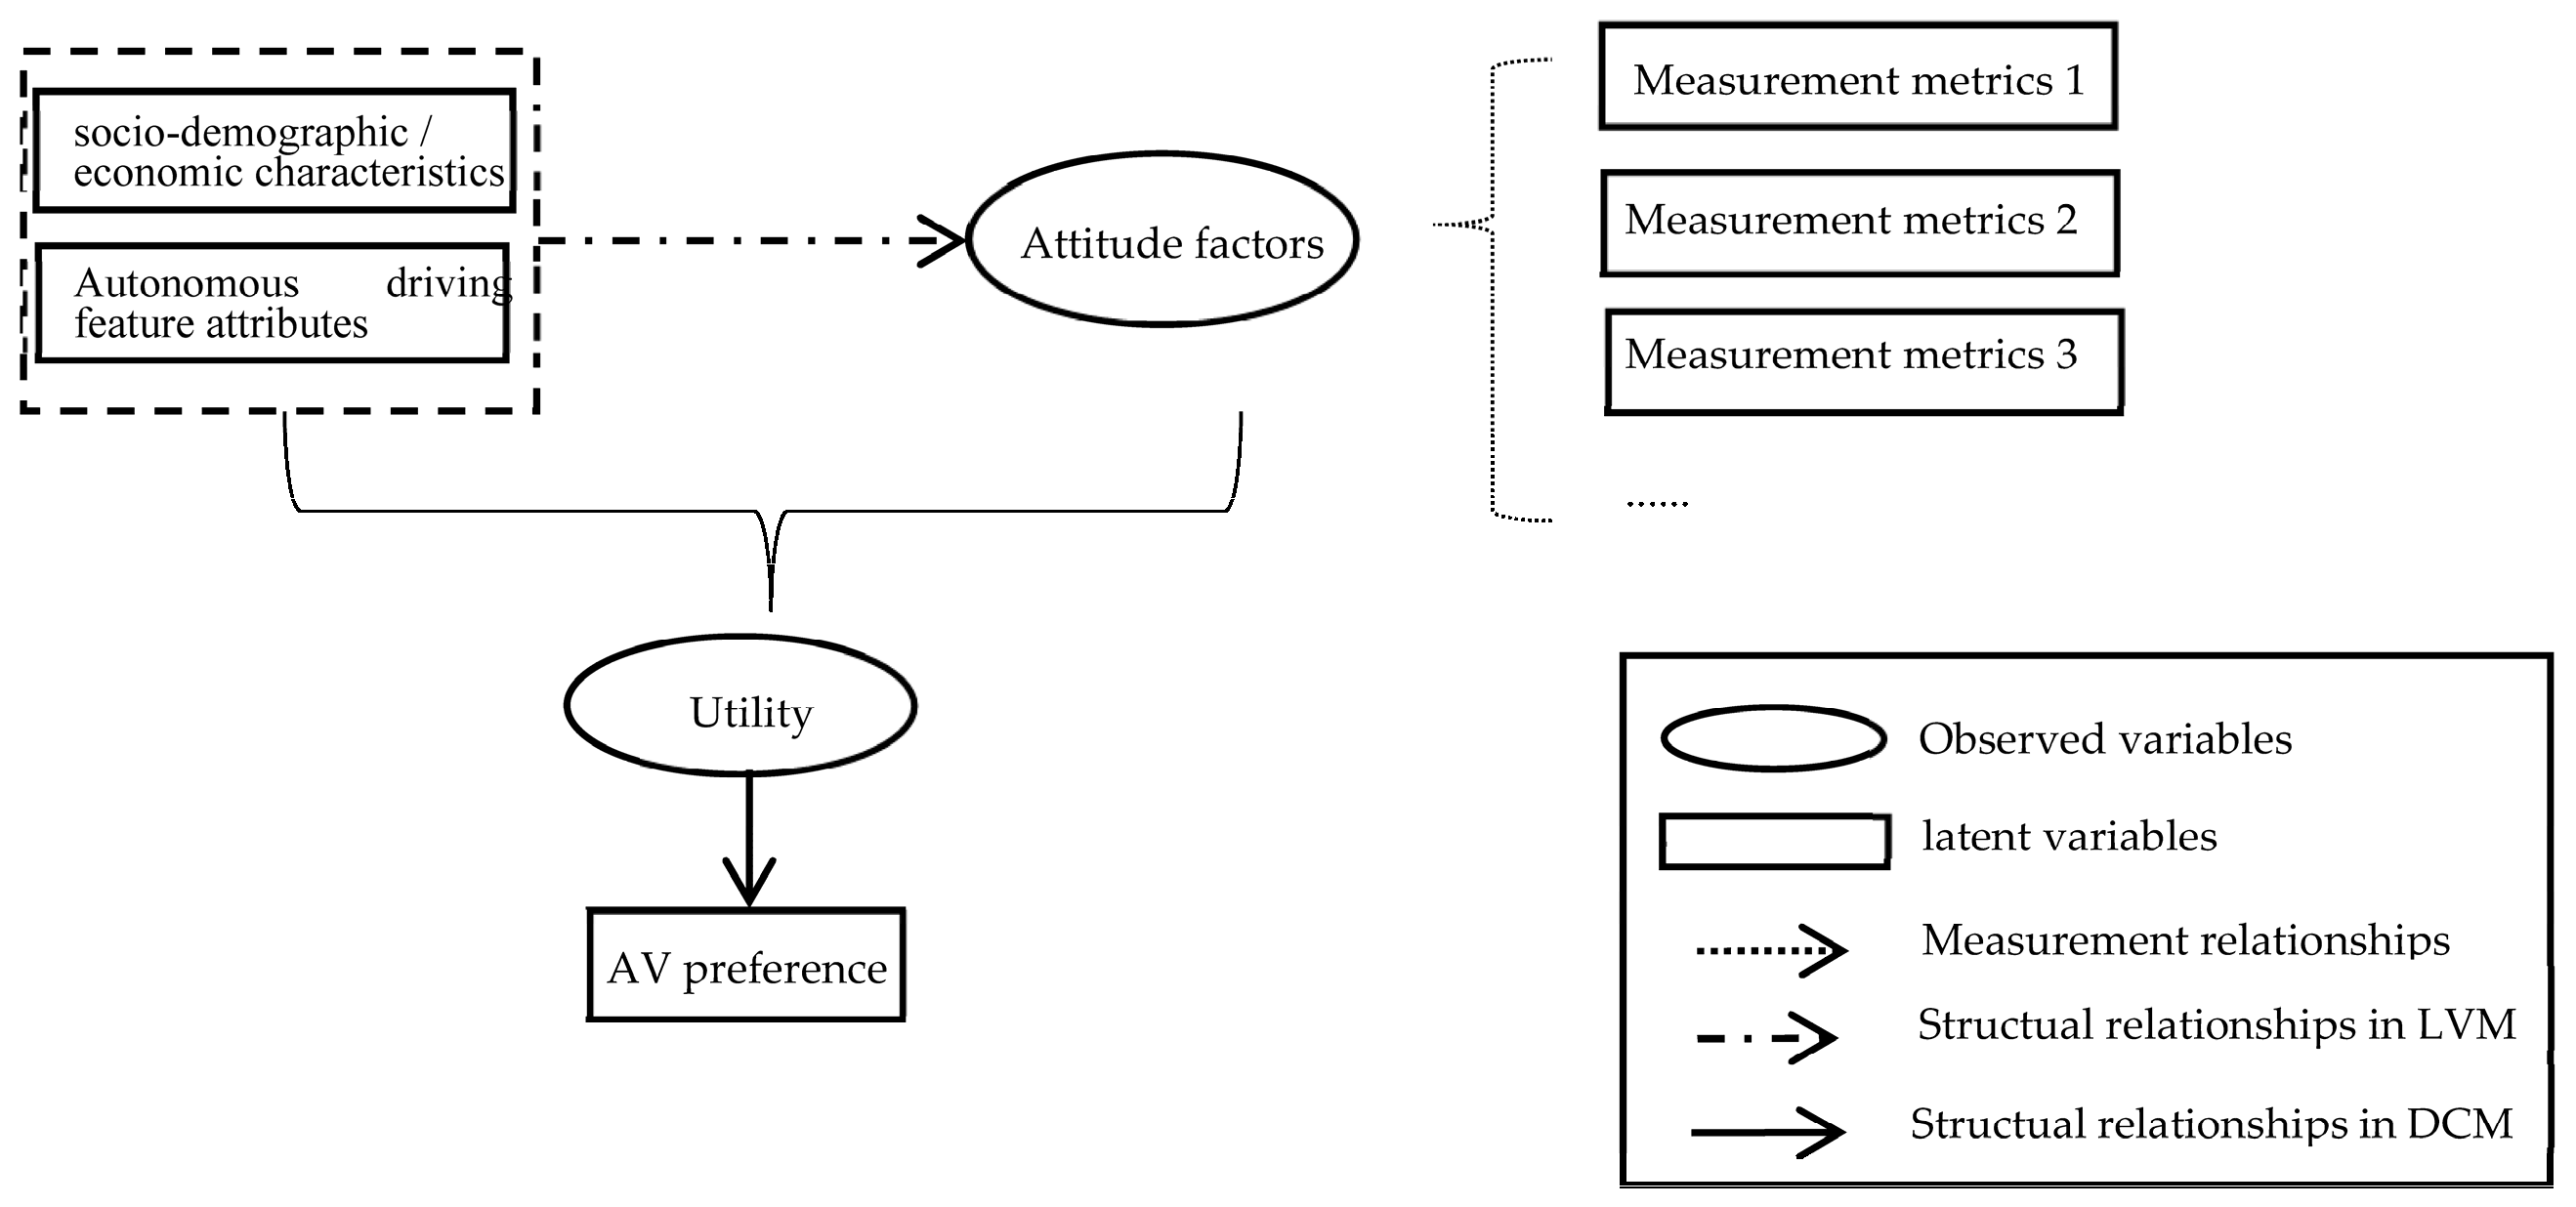
3.1. Modeling Framework

This study developed a choice model to investigate factors influencing user mode choice. A mixed logit model, also known as an integrated choice and latent variable model, was used. This model combines a discrete choice latent variable model that considers not only observable variables such as decision-maker characteristics and alternative attributes but also unobservable latent variables that represent psychological factors influencing decisions [20]. The mixed choice model can analyze the multimodal choice behavior of consumers in different situations. The acceptance of self-driving cars may be affected by a variety of factors, including price, technology maturity, safety, etc. Mixed selection models can identify and capture different selection behaviors of different subpopulations. At the same time, the model allows the researchers to account for individual differences, so they can better understand the acceptance of autonomous vehicles by different consumers. It can identify the preferences of different groups, for example, where the acceptance of self-driving cars may differ by age, gender, geographic location, or driving habits. It is also possible to consider multiple potential influencing factors simultaneously, such as perceived usefulness, perceived ease of use, perceived risk, etc., to determine their relative importance to acceptance. This helps to formulate a more comprehensive policy and market strategy. The field of self-driving cars is full of uncertainties, such as the speed of development of technology and changes in regulations.
The mixed choice model employed in this paper is an extension of discrete choice models, commonly used to analyze the decision-making behavior of entities (individuals, households, firms, or other decision-making units) when faced with two or more alternative options. Discrete choice models provide a powerful basis for the decision-making of businesses, households, and individuals, and have gradually become a robust tool for studying individual choice behavior. The latent variable model, also known as the structural equation model, is a multivariate, multi-equation modeling method that integrates factor analysis, path analysis, and latent variable models. It has widespread applications across various fields, including transportation, marketing, and psychology. The ICLV model comprises two parts: the discrete choice model and the latent variable model. Each part contains one or more structural equations and one or more measurement equations.
Mixed choice models can include random effects in the model to deal with this uncertainty. However, mixed choice models usually require large amounts of data to accurately estimate model parameters, especially when multiple factors and individual differences are considered. This can require expensive data collection and processing. A multinomial logit model was used as the discrete choice model for this study. For the attitude measurement model, the measurement equation of the latent variable model adopted an ordered logit form to properly account for the ordinal nature of the Likert scale indicators. The final model framework used for the analysis in this study is illustrated in Figure 1.
In Figure 1, solid arrows represent the structural relationships in the choice model, linking the observable explanatory variables and latent variables to utilities. Dashed arrows with double dots represent the structural relationships between observable explanatory variables and latent variables in the latent variable model, as well as the interactions between latent variables. Dashed arrows represent the measurement relationships that link the latent variables or utilities with their observable indicators (i.e., the observed preferences y and indicator I). Since the latent variables and utilities are unobservable, they are typically measured through survey items pertaining to respondents’ perceptions, attitudes, and preferences.

3.2. Hybrid Choice Model

Considering the purchase likelihood for AVs is influenced by multiple latent factors including psychology, social economics, etc., this study proposed a hybrid choice model to estimate the purchase likelihood for AVs. Hybrid Choice Model (HCM) is useful for exploring the effects of latent factors, such as attitudinal factors, on preferences [27]. There are two main methods of SP/RP data fusion, firstly, correcting SP data with RP data and combining RP data with corrected data for joint modeling [28]; secondly, applying the logit model structure to build a virtual layer [29]. The logit model was proposed by Luce [30]. The explicit characteristics of the model probability expression make the model solution fast and easy to apply. When the model choice set does not change and only the level values of each variable are changed, the probability of each choice branch being selected in the new environment can be easily solved. Mixed logit models are suitable for modeling that includes latent variables, allow for heterogeneity in individual variables [27], and are well suited for fusion analyses of SP data and RP data.
HCM consists of two components: discrete choice modeling and latent variable modeling. Each part contains one or more structural equations and measurement equations [31]. In this work, the structural equations were designed for latent variable modeling, and a mixed logit model was employed as the equation to measure participants’ purchase likelihood for AVs.

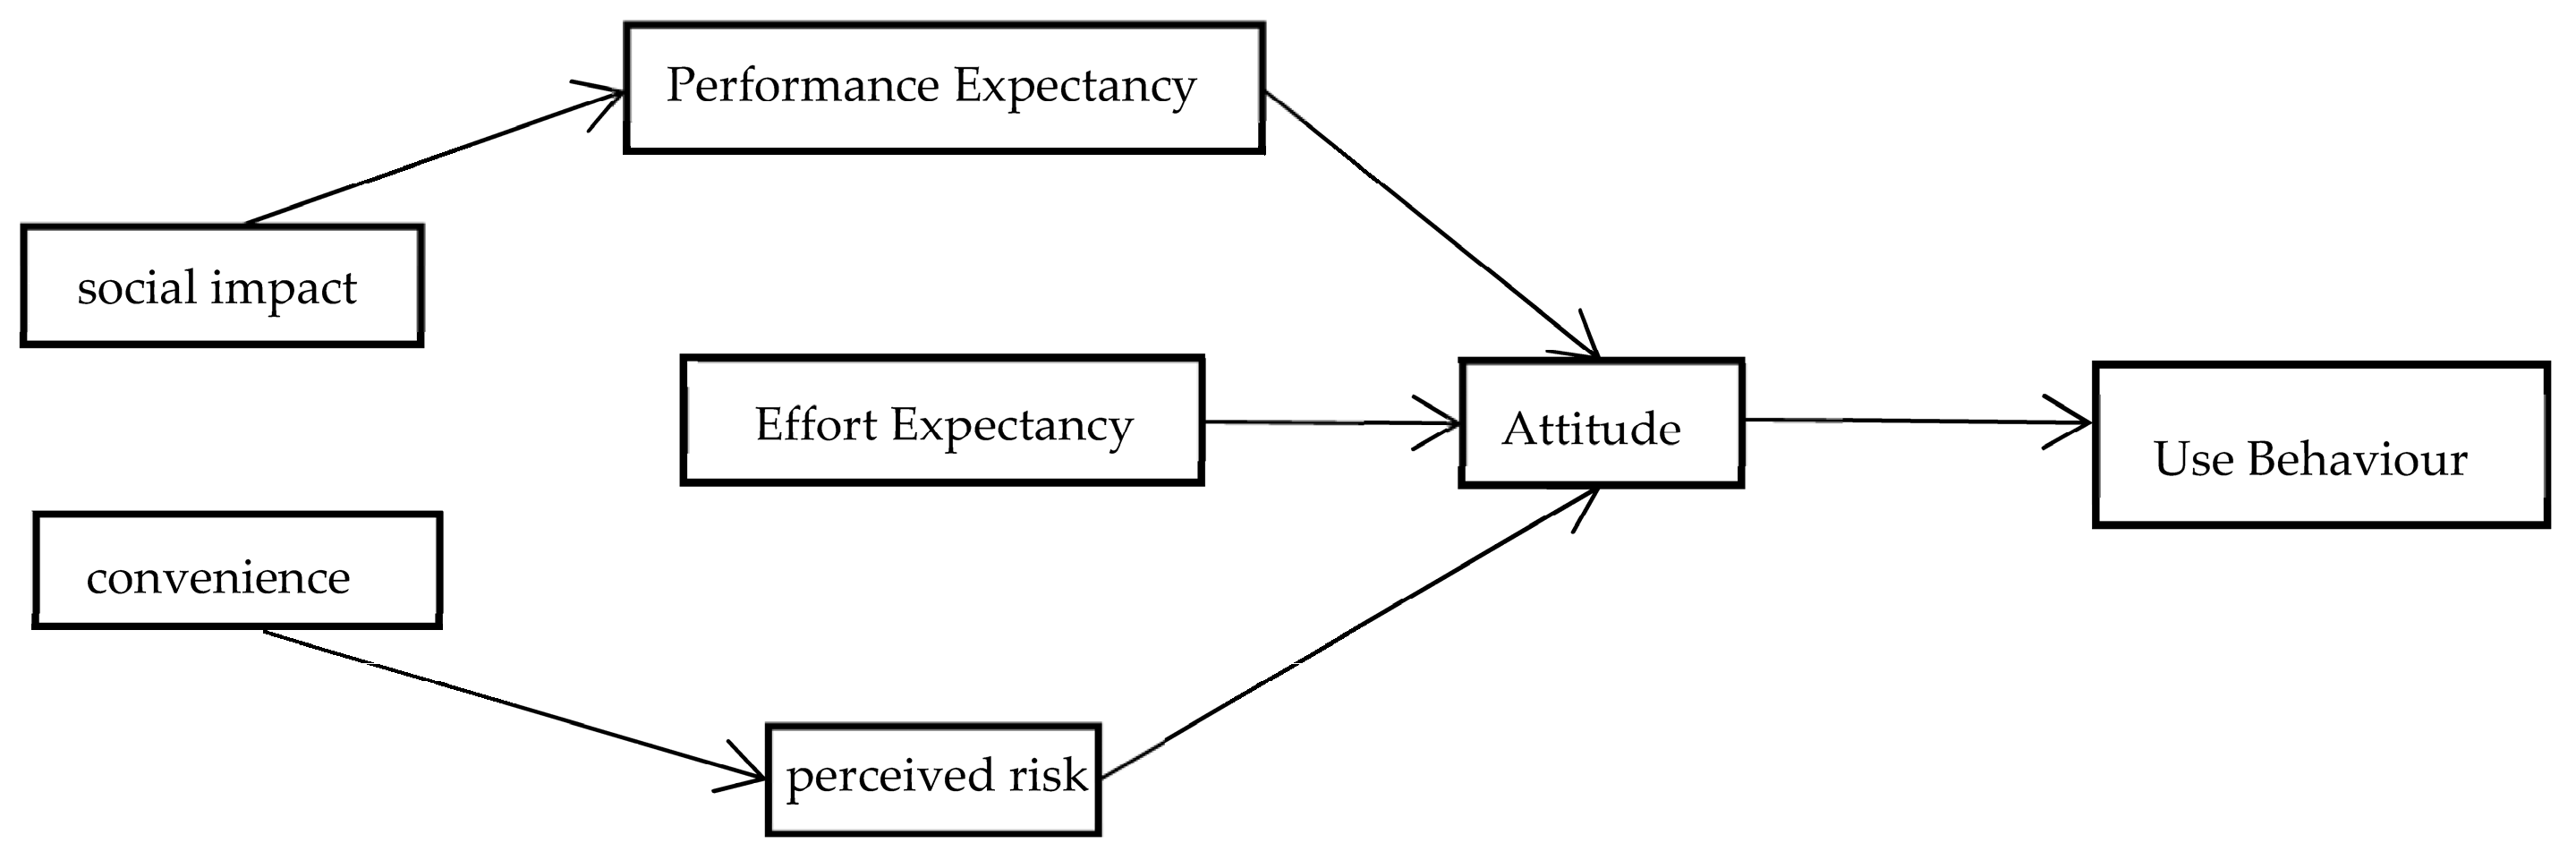
3.2.1. Structural Equation

The structural equation model (SEM) is a statistical method for analyzing causality and measurement error among multiple variables [32]. SEM can consider both latent variables (those that are not directly observable) and explicit variables (those that are directly observable) and can combine multiple regression or factor analysis models into a holistic model. Kupek et al. [33] present a method for analyzing binary variables using SEM and how it can be used to explore the effects of unobserved confounders. The SEM employed in this study was built upon existing theoretical foundations. Our research framework draws upon seminal works in the fields of technology acceptance, behavioral psychology, and transportation studies, thus substantiating the rationale behind our chosen hypotheses. The integration of psychological constructs, latent variables, and observable indicators serves as a comprehensive framework that enhances the explanatory power of our study.
The structural equation represents the relationship between observable and latent variables. In this study, it is constructed to explore users’ intention to use autonomous vehicles. The structural equation is defined as [34]:
L V n l = γ l Z n + η n l
where  L V n l  is the  l th variable of individual n ( l L  = {participants of the survey});  γ l  is a vector of unknown parameters representing the effects of explanatory variables  Z n η n l  is the random term following a standard distribution.

3.2.2. Mixed Logit Model

This research investigates the purchase likelihood of AVs by estimating the mixed logit model. Two discrete purchase likelihood categories are considered: willing to purchase and unwilling. In this study, a linear function capturing the determinants of purchase likelihood should be first introduced as
P i n = β i X i n + ε i n
where  P i n  is a purchase likelihood function determining the probability of purchase likelihood level i for respondent n,  X i n  is a vector of explanatory variables affecting purchase likelihood category i,  β i  is a vector of estimable parameters, and  ε i n  is an error term which is assumed to follow an independent and identically distributed extreme value [35].
The functional form of the probability of choosing each option depends on the hypothesis of the distribution of the random residual. Since multiple factors influencing the likelihood of AVs purchase are considered and investigated in this study, multinomial logit models (MNL) are applied in this study [36]. MNL is shown as follows:
P i n = exp ( β i X i n ) k exp ( β i X i k )

3.2.3. Model Calibration

Since the probability distribution of the mixed Logit model is not closed, the parameter estimation of the mixed Logit model needs to be completed by computer simulation in this study. The general steps of the computer simulation are as follows:
① Find the simulation probability Pin.
First, under the premise of 1, a random vector B is randomly selected from the probability density function f(B day), denoted as B’. The one drawn for the first time is recorded as −1. Then, according to Formula (3), we calculate the value of Lin (B™). We repeat the above process n times, the mouth is about 500–1000, and the average value of Lin (B) is used as the simulation probability, that is:
Pin = 1 n 1 n L i n β γ
② Construct a maximum likelihood operator, record the sample size as N, and record the number of options as assuming that the consumer (decision maker) chooses plan i; the result is:
σ i n = 1 ,   T h e   c o n s u m e r   ( d e c i s i o n   m a k e r )   c h o o s e s   o p t i o n   i 0 ,   o t h e r }
The simulated likelihood function of the sample is:
SL ( β ) = n = 1 N j = 1 J P i n δ i n
Take the logarithmic form of the above formula as the simulated maximum likelihood operator:
LL ( β ) = n = 1 N j = 1 J δ i n l n P i n
③ Solve for 1.
Constantly change the value of 1, until the simulated maximum likelihood operator obtains the maximum value. From the structural equation parameter values calculated by the AMOS 24.0 software, we can derive the latent variable fit values. By substituting these latent variable fit values, individual attribute values, and autonomous vehicle attribute values into the multinomial logit model, we can estimate corresponding model parameters.

4. Survey Design

4.1. Research Subjects

The two main subjects involved in the research question of this paper are travelers and autonomous vehicles. Travelers refer to consumers who choose the services of autonomous vehicles for their transportation needs. Considering both universality and specificity, the study focuses on future potential users of autonomous vehicles. However, autonomous vehicles have not yet been widely adopted in the market. Given the overlapping features between autonomous vehicles and current ride-sharing and car-sharing services, the study identifies current users of ride-sharing and car-sharing services as potential future users of autonomous vehicles. The scope of research subjects is also appropriately expanded based on the characteristics of autonomous vehicles to include individuals with limited mobility.

4.2. Instrument Development

To ensure the quality and quantity of the questionnaires collected in this survey, we plan to utilize a combination of on-site and online surveys, with a focus on online methods. The language of instrument development is either English or Chinese. The online surveys were compiled using the questionnaire Star platform and its website is https://www.wjx.cn/, accessed on 1 November 2006. The data were collected by an online questionnaire, which users could fill out by scanning a QR code or clicking on a link https://www.wjx.cn/vm/tW0gc, accessed on 10 March 2023. The author conducted questionnaire delivery on Internet platforms with a large number of users in China. The author desensitized and anonymized the questionnaire IP. The author set an IP mask in the questionnaire to screen the data of the target place. On-site surveys will primarily be conducted at various transportation hubs, university towns, industrial zones, software parks, leisure shopping centers, and central commercial streets.

4.3. The Design of the Questionnaire Scales

The questionnaire consists of three sections:
  • Basic Information about the Travelers: this includes sociodemographic and economic characteristics.
  • Perceptions and Acceptance of Autonomous Vehicles: this section features latent variable measurement surveys regarding attitudes toward autonomous driving technology. To formulate questions about participants’ attitudes, the previous literature is referenced. Attitudinal questions are framed using a 5-point Likert scale (1 = strongly disagree, 5 = strongly agree).
  • In addition to the multiple-choice questionnaire, the survey also employed a Stated Preference (SP) choice experiment, asking participants to hypothetically consider that they were preparing to purchase a new car. Thus, the choice scenarios were designed based on participants’ responses to different car scenarios. When participants encountered the choice experiment, they were asked to select the type of vehicle they would most prefer to purchase from options that included traditional cars and different levels of autonomous vehicles. Participants considered multiple attributes of each mode, including market share, car price, dedicated lane availability, safety record (accident rate per thousand kilometers), and traffic efficiency (time savings in daily commuting).

4.4. Survey on Individual Socioeconomic Attributes

The first part of the questionnaire aimed to collect information on participants’ socioeconomic attributes. Participants were required to provide information regarding their age, gender, education level, occupation, and income level. These demographic factors are crucial for understanding the background of the respondents and can provide valuable insights into how these factors may influence their attitudes and perceptions toward autonomous vehicles. By acquiring this information, our aim was to gain a comprehensive understanding of the participants’ socioeconomic characteristics and the potential impact of these characteristics on their acceptance of and willingness to adopt autonomous vehicles.

4.5. Survey on Latent Variable Measurements

The second part of the questionnaire is for a latent variable measurement survey, aiming to assess participants’ perceptions and attitudes towards various aspects of autonomous vehicles, including social impact, convenience, perceived usefulness, perceived ease of use, perceived risk, attitude towards using, and actual system use. The Technology Acceptance Model (TAM) proposed by Davis breaks down users’ attitudes and intentions toward technology into two main factors: Perceived Usefulness and Perceived Ease of Use, which are used to study users’ acceptance degree and use behavior of technology [37]. TAM only considers the impact of Perceived Usefulness and Perceived Ease of Use on Behavioral Intention, ignoring other factors that may affect user acceptance, which cannot fully explain the psychological state of users in the decision-making process. In addition, there are some limitations in TAM [38]:
Simplification: TAM emphasizes the impact of ease of use and usefulness on technology acceptance but may overlook other important factors such as culture, social influences, or individual innovativeness
Static Nature: TAM mainly focuses on the willingness to accept technology at a specific point in time, rather than the acceptance process or behavior that changes over time.
Lack of External Variables: Although TAM allows researchers to include external variables, its core constructs may not be sufficient to capture all the factors affecting technology acceptance.
Based on previous research methods and considering the characteristics of autonomous vehicles, each latent variable is designed with 3–4 measurable items. The specific items are as follows:
Perceived Usefulness
PU1: I believe that autonomous vehicles can improve road safety and reduce traffic accidents.
PU2: I believe that autonomous vehicles can improve energy efficiency and reduce exhaust emissions and air pollution.
PU3: I believe that autonomous vehicles can shorten travel time and reduce travel costs.
PU4: I believe that autonomous vehicles can improve the travel efficiency of individuals who cannot drive (elderly, young, sick, under the influence, etc.).
PU5: While using autonomous vehicles, I can have more time to do other things (work, leisure, rest, etc.).
Perceived Ease of Use
PEU1: I believe that autonomous driving is easier to operate than traditional vehicles.
PEU2: I believe that I can easily grasp the process of using autonomous vehicles.
Perceived Risks
PRE1: I am concerned that autonomous vehicles may lead to privacy breaches.
PRE2: I am concerned that the functionality, infrastructure, and services of autonomous vehicles may be inadequate and cause trouble for me.
PRE3: I am concerned that using autonomous vehicles may put myself and my family in danger.
Facilitating Conditions
FC1: I will have sufficient control over the journey to the destination.
FC2: I have the knowledge required to use the vehicle.
FC3: The vehicle and infrastructure are feasible in practice.
Social Influence
SI1: I would actively showcase this vehicle to people around me.
SI2: If this vehicle is widely used by others, I would be more inclined to use it.
SI3: I prefer to use this vehicle with other passengers.
Behavioral Attitudes
ATB1: I believe that autonomous vehicles are a good technology.
ATB2: I believe that autonomous vehicles are trustworthy.
ATB3: In future travel, I would support the replacement of traditional vehicles with autonomous vehicles.
Intention to Use
BI1: After autonomous vehicles are available on the market, I am willing to use or purchase them.
BI2: After autonomous vehicles are available on the market, I will use related autonomous vehicle services in future travels.
BI3: I would recommend family and friends to ride in autonomous vehicles.
Due to the limitations of the traditional Technology Acceptance Model (TAM) in addressing the acceptance issues of autonomous vehicles (AVs) and reflecting the impact of the unique characteristics of AVs on users’ purchase intention, modifications have been made to the traditional model. The improvements mainly focus on variable design by adding new variables on top of perceived usefulness and perceived ease of use to reflect the current characteristics of AVs. These new variables include perceived risk, convenience conditions, and social influence. This study primarily investigates consumers’ willingness to purchase autonomous vehicles. Based on the previous survey and analysis, a suitable model for AV technology acceptance has been constructed. The diagram of the model is seen in Figure 2.

4.6. Questionnaire of AV Acceptance Survey

Before constructing new transportation facilities or formulating new transportation policies, it is necessary to analyze potential transportation demand and evaluate the effectiveness of their implementation [39]. There are two types of surveys: one is the survey of completed choice events, called the Revealed Preference (RP) survey and the other is the survey of respondents’ choices in a virtual environment with given assumptions, called the Stated Preference (SP) survey. In the evaluation process, it is necessary to conduct RP surveys based on actual choices and apply SP surveys to obtain respondents’ preferences for new facilities or policies. It is not possible to obtain respondents’ preferences for policies that have not yet been implemented using only RP data. Using only SP data to implement modeling predictive analysis, the actual choices of the final respondents may differ significantly from the results of the intention survey [40].
The content of the RP survey includes education level or educational attainment, income, number of vehicles owned, and actual driving experience. The answers are listed in Table 1.
The key characteristic of the SP survey method is that it typically involves scenarios that have not yet occurred, and respondents need to make intention choices based on their judgment and evaluation of the hypothetical scenarios. In this study, since autonomous vehicles have not officially entered the market, it is not possible to directly observe the actual behavior of travelers choosing autonomous vehicles or autonomous vehicle travel. However, the SP survey can effectively reflect the intentions of travelers regarding the choice of autonomous vehicles and autonomous vehicle travel. The autonomous driving attribute variables include the autonomous vehicle penetration rate, vehicle purchase subsidies, AV usage scenarios, and technological maturity. The attribute levels for each variable are set as shown in Table 2. A Bayesian D-efficient experimental design was utilized to construct 24 scenarios, as demonstrated in Table 3.
Based on the results of a preliminary survey, the formal survey is conducted in two phases, primarily spanning from April to June 2023. A balance is maintained between weekdays and weekends, as well as between peak and off-peak periods, to ensure the objectivity and universality of the data collected as much as possible. Before the questionnaire began, respondents were asked to watch a series of images and videos related to autonomous vehicles, as shown in Figure 3.

4.6.1. Sample Size

In discrete choice related studies, the setting of sample size significantly affects the performance of the output model. It is crucial to ensure the sample size is sufficient while maintaining the feasibility of the survey. Currently, the sample size setting mainly follows the minimum sample size empirical rule recommended by Rose et al. [41], as shown by the following formula:
N 500 L m a x J S
Herein: J—Number of options; S—Number of scenarios. In this research, Lmax is set at 3, J is set at 3, and S is set at 5. The minimum required sample size is calculated to be 100. Therefore, when the sample size is greater than 100, the discrete choice model established in this paper can be assured of having high validity

4.6.2. Sampling Method

Previous research has shown that people’s acceptance, willingness to pay, and preferences for autonomous vehicles are significantly related to age, with noticeable differences between different age groups. Based on this, the study plans to use quota sampling based on age. The study also references user profiles from major ride-sharing and car-sharing platforms in the current market to set the proportion for each quota. The main platforms referred to include Didi Chuxing, Global Car Sharing, First Car Sharing, and Pand Auto, and the average proportion from each platform is taken into account. After screening for missing values and other data processing steps, we obtained over 300 valid questionnaires. After screening for missing values and other data processing steps, we obtained over 300 valid questionnaires. Table 4 summarizes the ratios of the valid samples with different ages.

5. Results for the Analysis

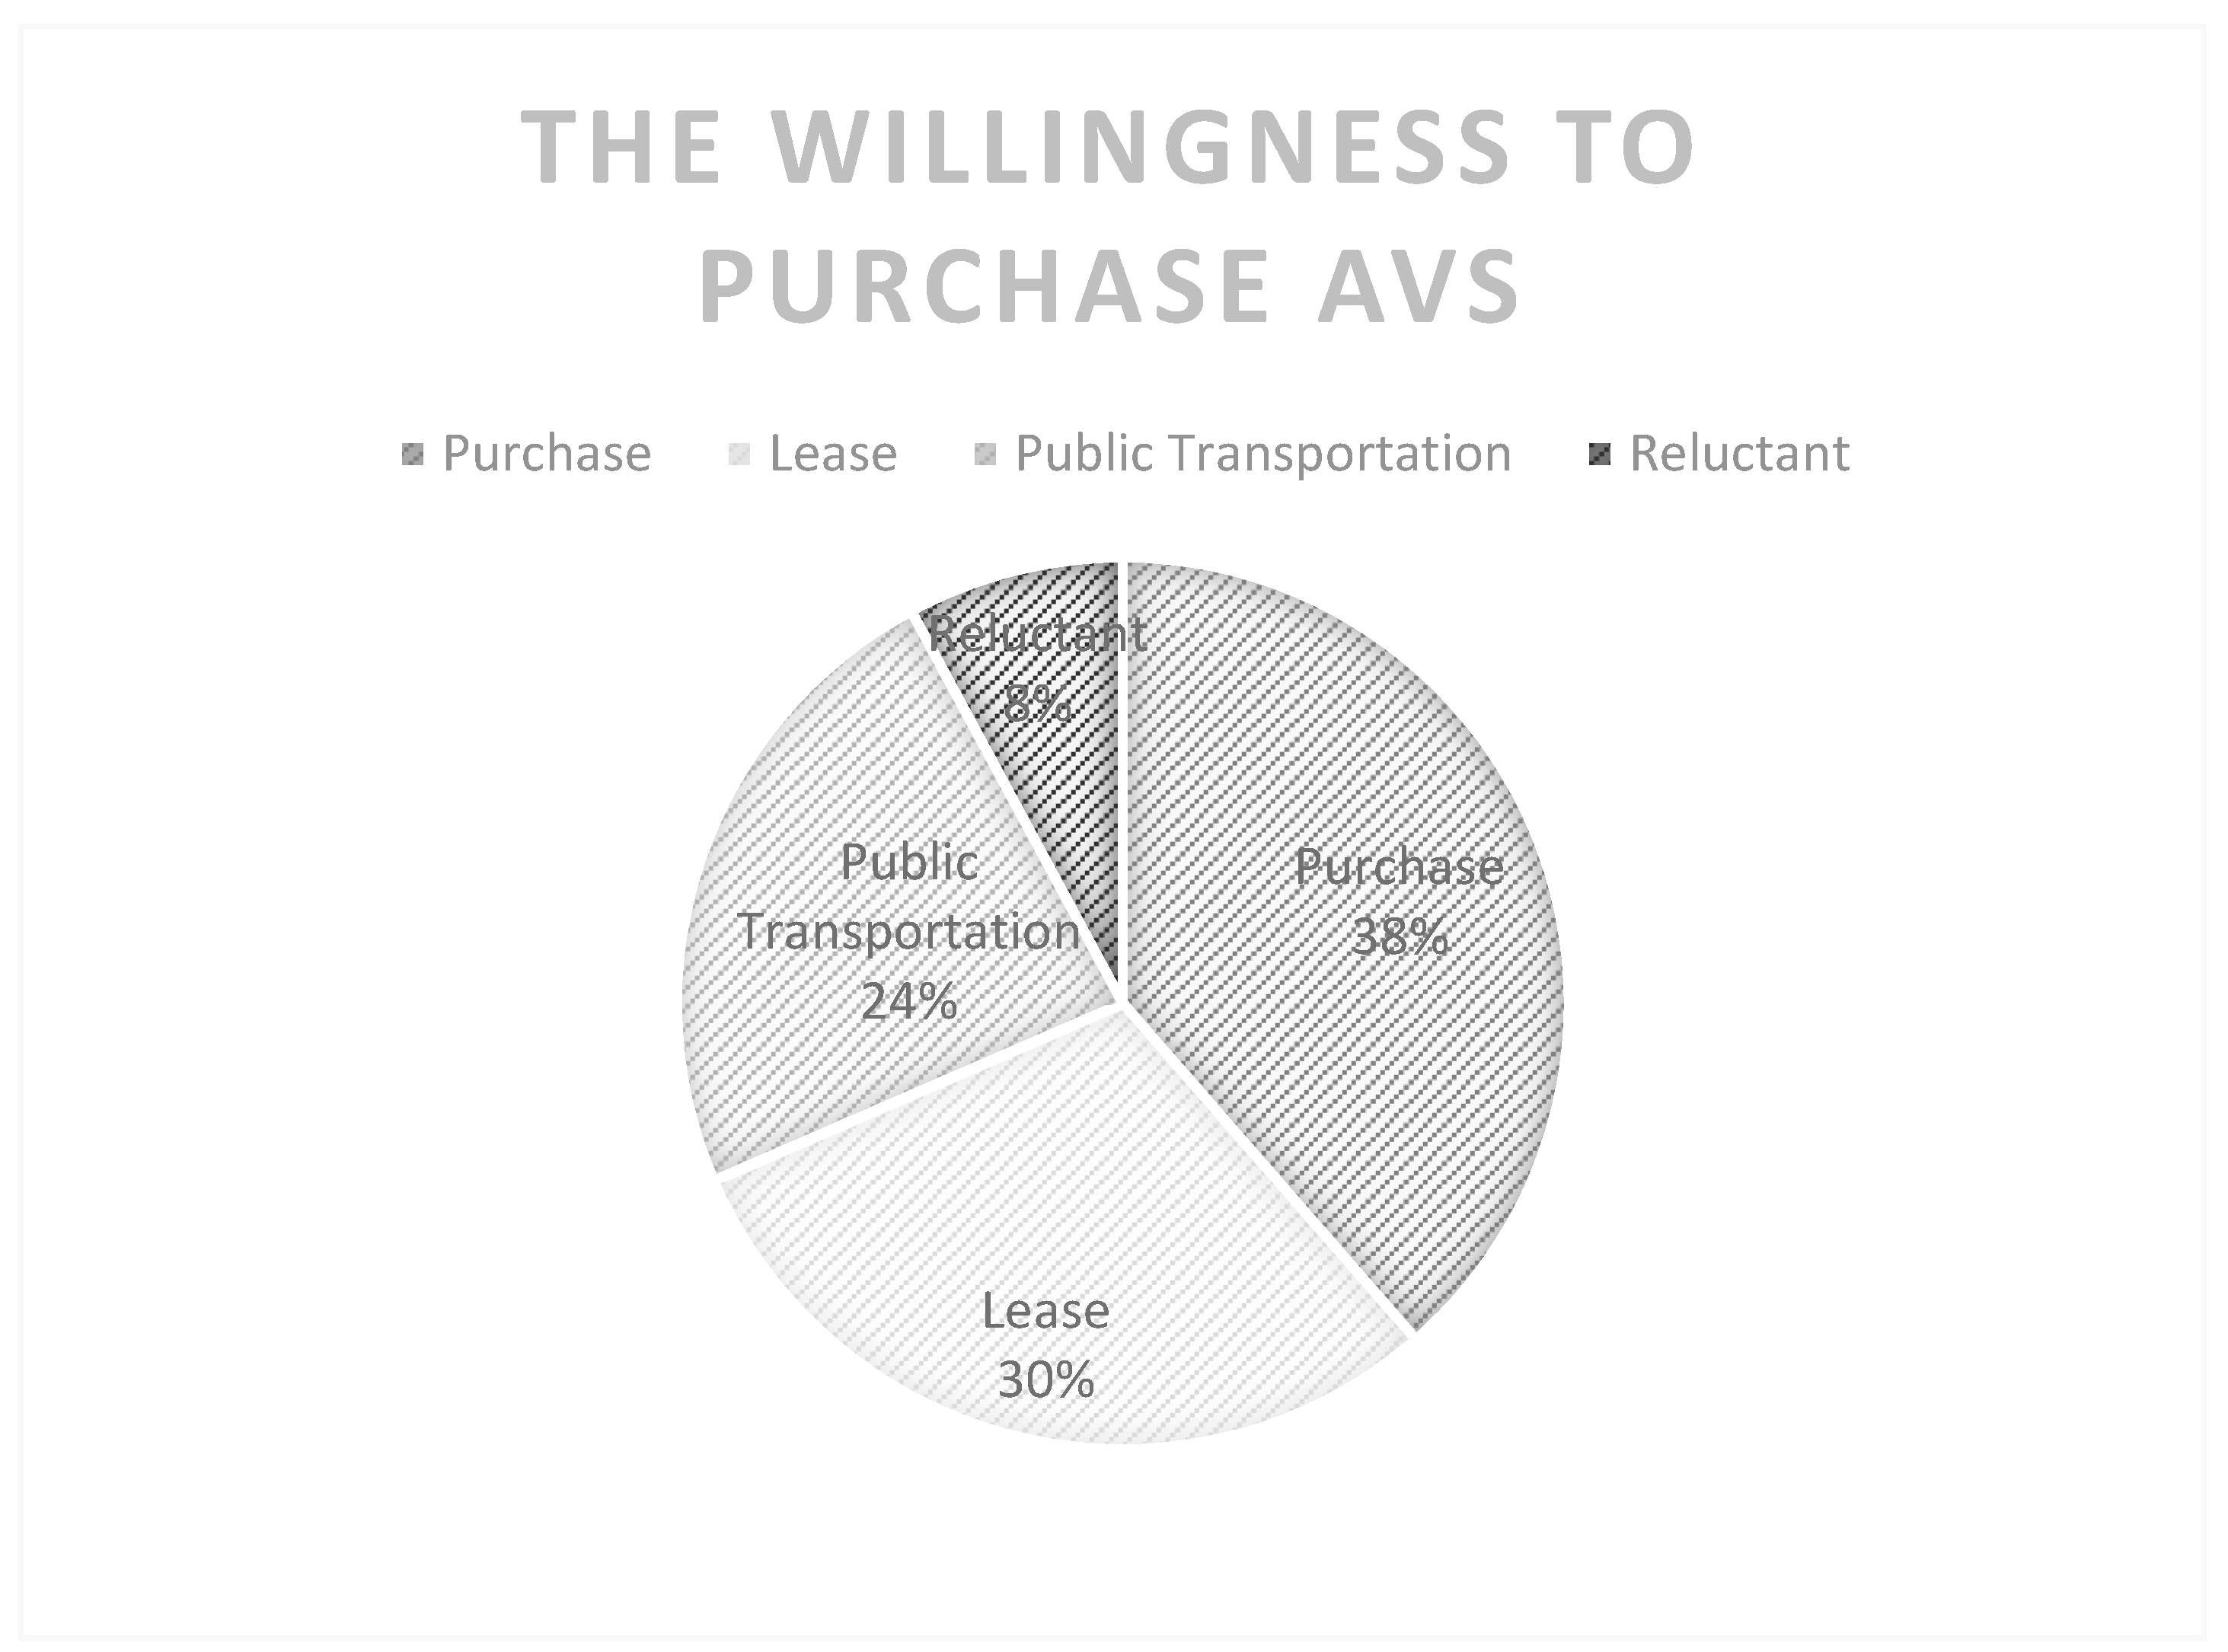
5.1. Statistical Description of the Data

Descriptive statistics of respondents’ basic personal information were analyzed using SPSS, as shown in the Table 5, including gender, age, education level, and monthly income level, among other socioeconomic characteristics. Among the survey respondents, 48.3% were male and 51.7% were female. The majority of the survey sample fell within the age range of 18–30. The education level was relatively high, with over half of the respondents having a college education or above, with a majority having a bachelor’s degree. In terms of household income, the majority fell within the range of below 2000–6000 CNY (69.53%), followed by 6001–8000 CNY (12.19%), and above 8000 CNY (10.22%), with 8.06% falling within the range of below 2000 CNY. In terms of household car ownership, over half of the households owned one car.
The analysis of the survey results revealed that overall, the highest proportion of respondents (41.39%) expressed a preference for purchasing autonomous vehicles. The next highest preference was for leasing, with a proportion of 28.38%. Additionally, 24.16% of respondents indicated a preference for using autonomous vehicles as public transportation, while a very small proportion (6.08%) expressed a reluctance to use autonomous vehicles. When comparing the intentions of male and female respondents, it was found that male respondents were more inclined towards purchasing autonomous vehicles, while female respondents showed a greater inclination towards leasing or using them as public transportation. The proportion of male and female respondents expressing a reluctance to use autonomous vehicles was relatively similar.
Analyzing the intentions of respondents across different age groups, it was found that the highest proportion of respondents expressing a preference for purchasing autonomous vehicles was in the 50–64 age group, with a proportion of 55.86%. The next highest proportion was among respondents aged 30–49, accounting for 41.15%. The lowest proportion was among respondents aged 18–29, with a proportion of 35.99% (as shown in the Figure 4 and Figure 5).

5.2. Mean and Standard Deviation of Latent Variables

Preliminary analysis of the latent variables was conducted by examining the minimum, maximum, mean, and standard deviation of each measurement variable in the psychological latent variable section. Taking the measurement variables of intention to use autonomous vehicle travel as an example, the average values of the measurement items related to “knowledge” ranged from 3.55 to 3.56. These values fell between the “neutral” and “understand” levels of the Likert scale, indicating that the surveyed sample as a whole had a moderate level of understanding of autonomous vehicle travel. The average values of the measurement items related to “perceived risks” ranged from 2.43 to 2.45, all of which were less than 3. This suggests that the surveyed sample perceived certain uncertainties and risks associated with choosing autonomous vehicle travel. These uncertainties and risks could potentially lead to direct refusal of selecting this mode of transportation, indicating a need for further in-depth research and analysis. As for the variables in the TAM, the average values of the measurement items related to “attitude” ranged from 3.74 to 3.82, which were close to 4. This indicates a generally positive attitude of the sample population towards using autonomous vehicles for travel. The average values of the measurement items related to “subjective norms” ranged from 3.59 to 3.61, all of which were greater than 3, indicating that the intention of using autonomous vehicle travel of the sample population is easily influenced by important individuals in their social environment. The average values of the measurement items related to “perceived behavioral control” ranged from 3.64 to 3.68, all of which were greater than 3, indicating a high level of perceived control over the choice of using autonomous vehicle travel. The average values of the measurement items related to “behavioral intention” ranged from 3.60 to 3.65, all of which were greater than 3, indicating a generally high intention to use autonomous vehicle travel among the sample population. Additionally, the standard deviations of all the measurement items were less than 1, indicating low data dispersion, which can be used for further research analysis. The specific statistical results are shown in the Table 6.
SPSS was used to conduct reliability and validity analyses on all latent variable sample data. Table 6 presents the results of the reliability test for the measurement variables of each latent variable in the autonomous vehicle model.
Correlation analysis is a statistical method commonly used to explore the correlation characteristics between random variables. However, it does not reflect causality between variables. Before conducting the path analysis using latent variables, it is necessary to perform correlation analysis (Pearson correlation coefficient) on the variables to assess the significance of the influence of one variable on multiple variables. This study will calculate the degree of association between all latent variables in the model using the Pearson correlation analysis method. Taking the example of correlation coefficient testing between latent variables in the autonomous vehicle model, from the test results in Table 7, it can be observed that there are significant correlations between “knowledge”, “perceived risks”, “attitude”, “subjective norms”, “perceived behavioral control”, and “behavioral intention.” This effectively verifies the theoretical hypothesis of the interaction effects between latent variables in the model. ** indicates that the correponding p-value is 0.05.

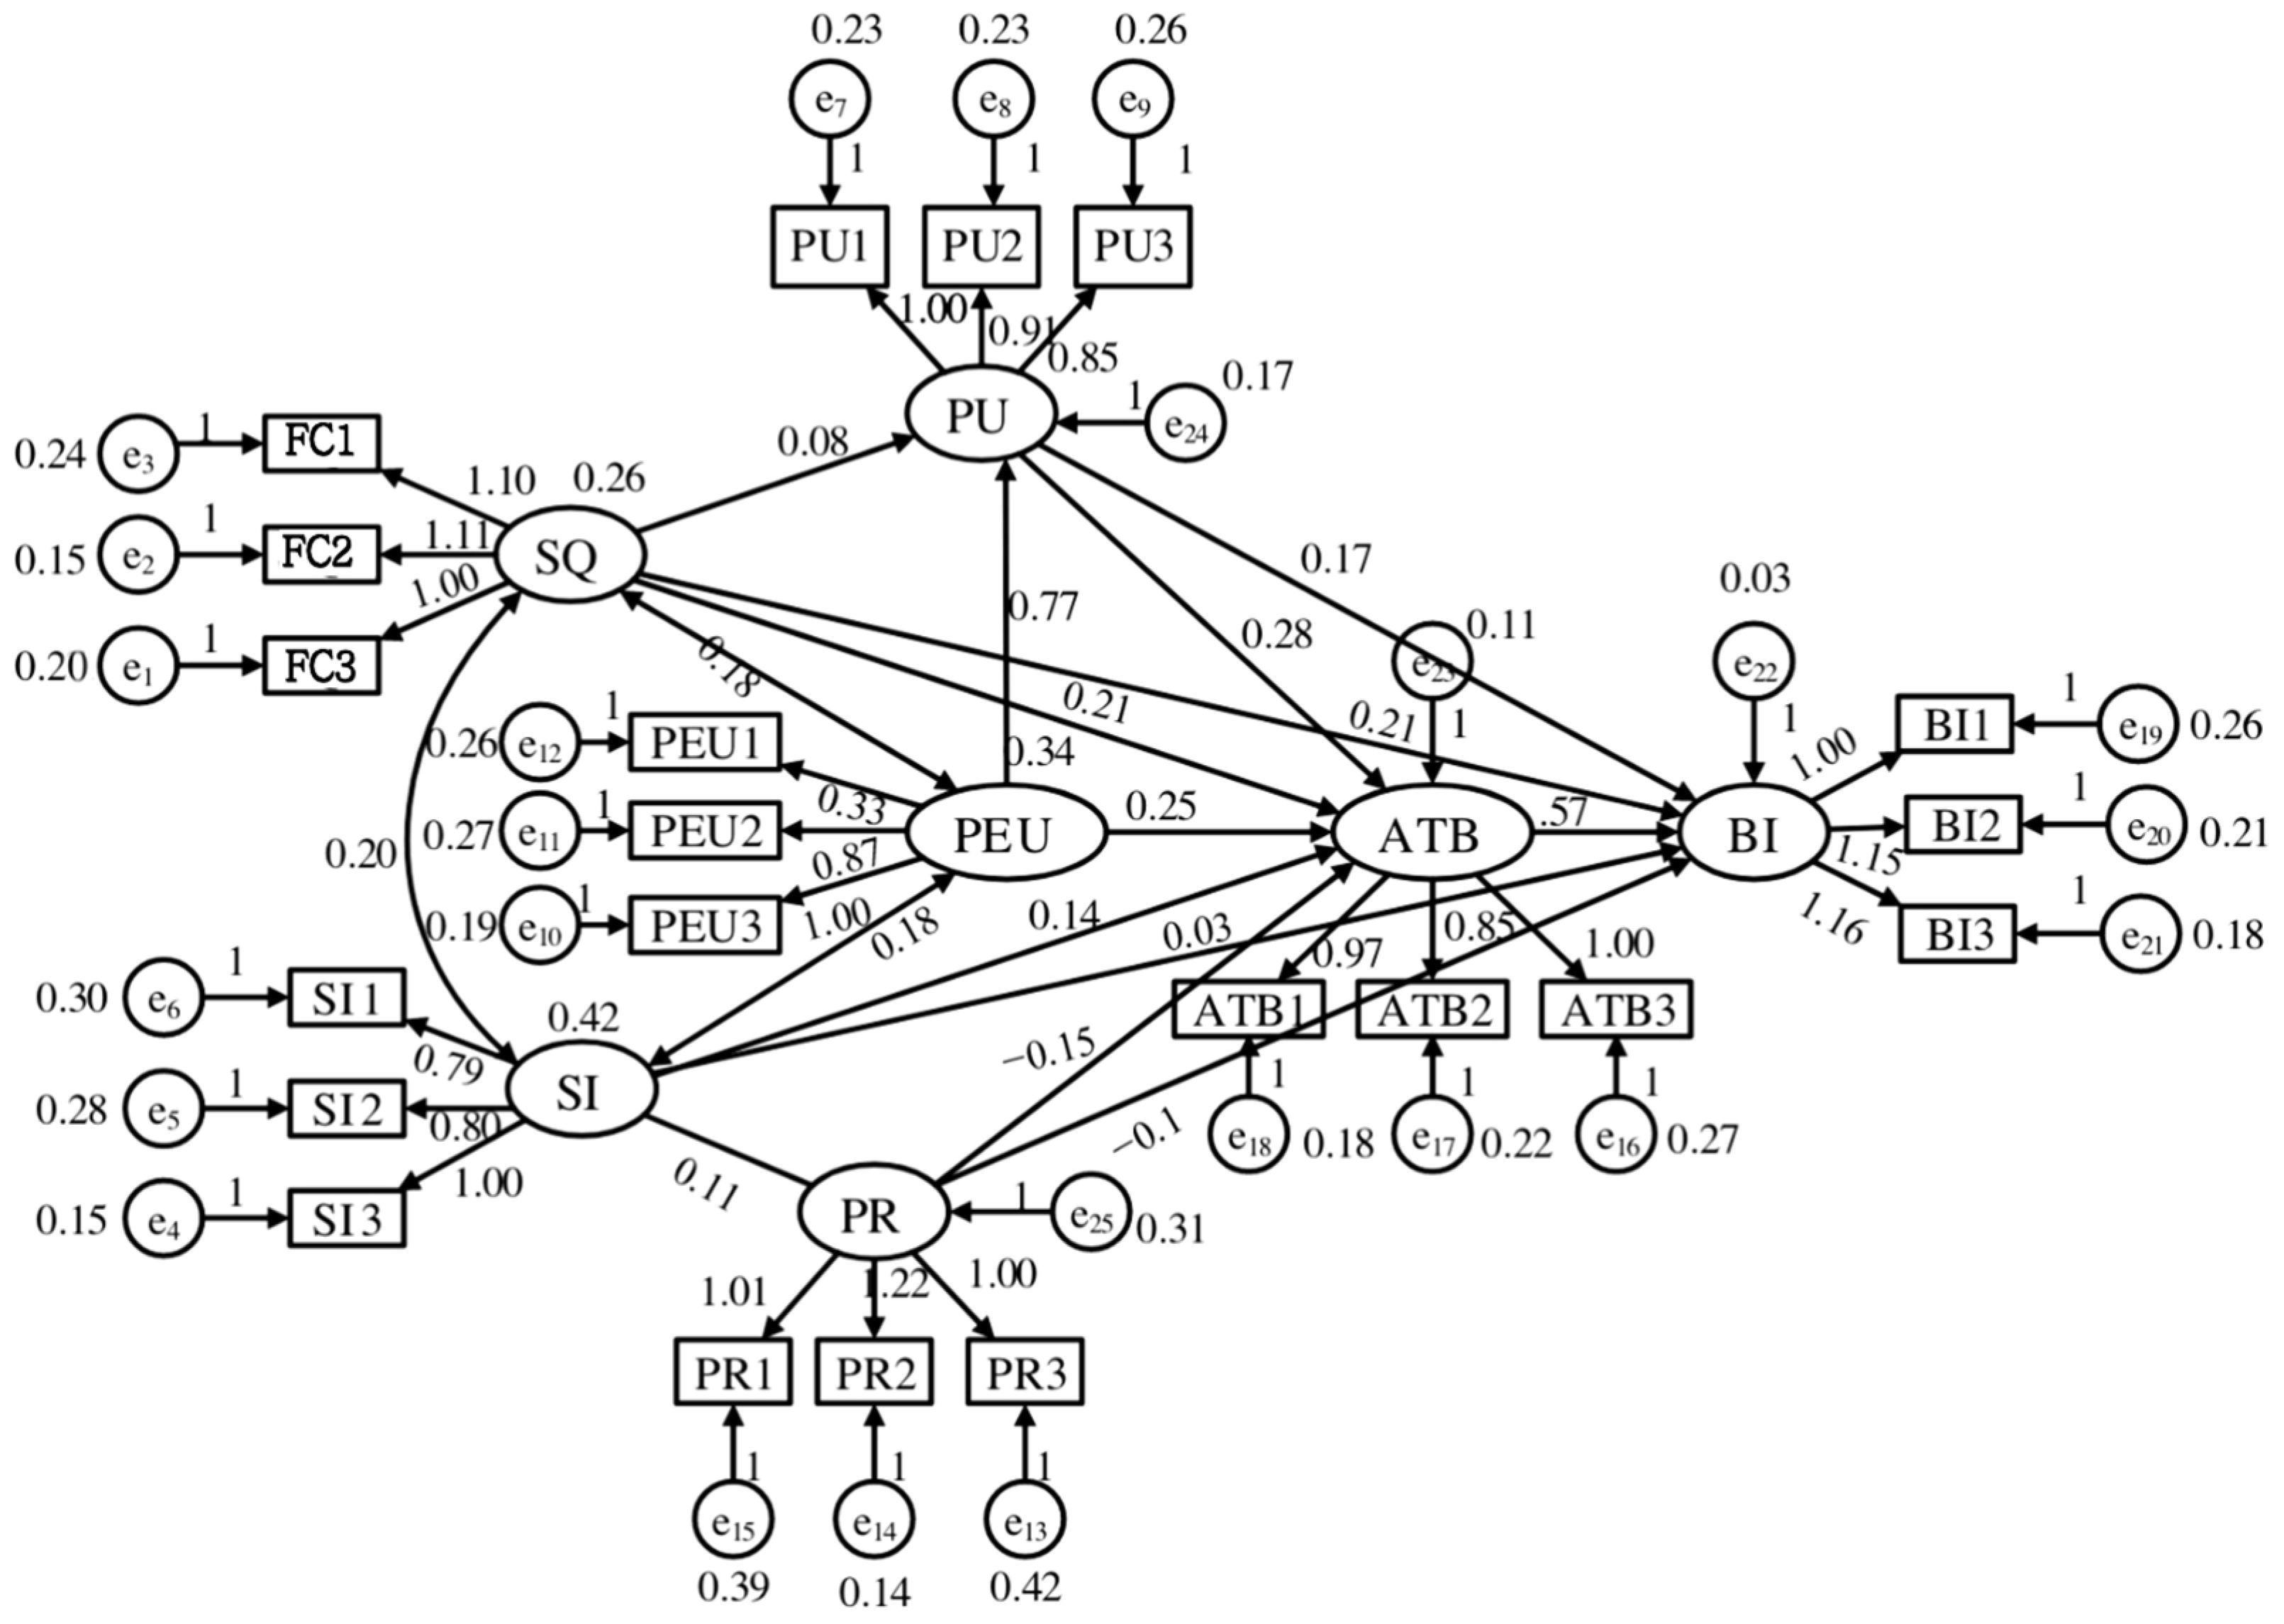
5.3. Structural Equation Modeling and Hypothesis Testing

The construction of the SEM was executed using AMOS 24.0, with a paramount focus on ensuring its robustness and applicability to our research context. Subsequent to the model’s development, we diligently assessed its goodness of fit through the examination of various indices. The chi-square to degrees of freedom ratio (CMIN/DF) yielded a value of 1.792, well below the recommended threshold of 3, thus affirming the model’s structural integrity. The root mean square error of approximation (RMSEA) and the comparative fit index (CFI) also demonstrated values of 0.051 and 0.951, respectively, reinforcing the model’s suitability. The results are shown in Figure 6.
Table 8 shows the results of the significance analysis of the proposed hypotheses. “**” means the correponding p-value is 0.05. The paths “Social Influence → Perceived Risk”, “Social Influence → Intention to Use”, and “Service Quality → Perceived Usefulness” have significance levels with p > 0.05, indicating that they are not statistically significant. However, the remaining paths have reached the statistical significance requirement and are in the predicted direction. Therefore, out of the 13 hypotheses, H7 (negative effect of social influence on perceived risk), H9 (positive effect of social influence on users’ intention to use autonomous vehicles), and H10 (positive effect of service quality on perceived usefulness) are not supported, while the other ten hypotheses are supported.
Social influence, perceived usefulness, perceived ease of use, behavioral attitude, and perceived risk collectively explain 40.9% of the variance in intention to use (R2 = 0.409), which is a good explanatory power.

5.4. Results of Model Calibration

According to the method mentioned in 3.4, we can acquire fit values of latent variables. By substituting these latent variable fit values, individual attribute values, and autonomous vehicle attribute values into the multinomial logit model, we can estimate the model parameters using Stata 17.0 software. The model that takes into account the relevant psychological attributes is referred to as MNL, and the base terms of the autonomous vehicle attributes are used for the model parameter estimation. If the p-value is less than 0.05, we consider that the variable has a significant impact on the selection behavior. Some insignificant variables (such as age and gender) are removed from the model. The parameter estimation results are shown in the Table 9. Comparing the goodness-of-fit test results of the models in the table, the fit of model MNL is higher. If the ratio of goodness-of-fit is greater than 0.2, the model has a higher accuracy. Therefore, the parameter calibration result of model MNL is the final model parameter estimation result.
The parameter calibration results are consistent with the previous analysis. Perceived usefulness, behavioral attitude, and service quality are significant positive influencing factors, while perceived risk is a significant negative influencing factor. Travel time, waiting time, and travel cost are significant negative factors in people’s choice of autonomous driving vehicles. This suggests that reducing travel time, waiting time, and lowering the cost of autonomous driving cars can incentivize travelers to choose autonomous driving vehicles.
In terms of personal economic and social attribute variables, groups with higher education levels, higher personal monthly income, and higher car ownership are more willing to choose autonomous driving vehicles for travel. This means that autonomous driving car companies can target the highly educated or higher-income groups as their initial target market for promotion.

5.5. Elasticity Analysis

Based on the results of the previous model parameter calibration and analysis, there are significant factors that influence the choice of autonomous driving vehicles. Elasticity analysis quantitatively demonstrates the impact of significant influencing factors on choice behavior. The formula for calculating point elasticity is as follows:
E ( S i j ) = p j S i j × S i j P j = β i ( 1 P j ) × S i j
where E(Sij) is the elasticity of the probability of choosing behavior j with respect to the i-th attribute variable in the given scenario; θi is the estimated parameter value of the i-th attribute variable; Pj is the probability of choosing behavior j; Sij is the average value of the i-th attribute variable for choice scenario.
In Stata, we calculate the elasticity values of the probability of choosing autonomous driving vehicles with respect to variables such as travel time. From the elasticity analysis results in the Table 10, it can be observed that an increase of 1% in travel time, waiting time, travel cost, and perceived risk leads to a respective decrease in the probability of choosing autonomous driving vehicles by 1.56%, 3.40%, 4.05%, and 1.52%. On the other hand, an increase of 1% in perceived usefulness, perceived ease of use, and behavioral attitude leads to an increase in the probability of choosing autonomous driving vehicles by 5.02%, 3.75%, and 1.48% respectively.
Based on the above, it can be concluded that the sensitivity of users to the influencing factors can be ranked in the following order from strongest to weakest: perceived usefulness, travel cost, perceived ease of use, waiting time, travel time, perceived risk, and behavioral attitude. These results can provide reference for designing incentive strategies to enhance user willingness to use autonomous driving vehicles.
Since the survey respondents are different in age, income, actual driving experience, and other latent factors such as nationality and religion, there is potential bias in this study. For example, in a country with a surplus of labor or with unemployment, no technology that takes away people’s jobs will be allowed, leading to an overall low willingness to purchase. These cross-country factors are taken into account in the model in subsequent research. In addition, there may be some differences among people in the same country due to religion, geography, etc. In order to reduce the potential threat of bias among sample groups and make the results more representative, weighting techniques, such as reverse probability weighting, are used in this study for data analysis.

6. Discussion and Conclusions

The results demonstrate that personal income significantly affects users’ purchase likelihood for AVs. This is in line with the results obtained by [42,43]. It is interesting to find that education level does not have a significant impact on users’ purchase likelihood for AVs. However, Ali Behnood et al. found that users with higher education levels are more likely to purchase AVs [35]. This may be because users with higher education levels have more perceived usefulness and perceived ease of use.
The results indicate that perceived usefulness, perceived ease of use, and trust have a significant impact on users’ purchase likelihood for AVs. This is consistent with the results obtained in [44]. However, Lee J and Lee D found that perceived ease of use has little impact on purchase likelihood [45]. The results obtained by this study show that social impact significantly affects users’ purchase likelihood for AVs. This agrees with the results in [44,46]. This may be because, to some extent, automobiles are considered symbols of social status. The results obtained by this study demonstrate that perceived risks have a significant impact on users’ purchase likelihood for AVs. This is in contrast to the results obtained in [35]. The reason for the difference may be that Chinese people are more concerned about the safety performance of AVs.
In conclusion, this study expands and improves the technological acceptance model (TAM) by including factors including perceived risk, service quality, and social influence. Additionally, we create a hybrid choice model by fusing the extended technology acceptance model with a polynomial logit model in order to better examine consumers’ willingness. The likelihood that a user will decide to take a trip in a self-driving automobile is quantified by the model. It was found that users’ propensity to embrace self-driving cars is influenced directly or indirectly by perceived usefulness, perceived ease of use, perceived risk, social impact, service quality, and behavioral attitudes. Additionally, these hidden factors affect one another. Models with and without latent variables were compared, and it was found that adding latent variables increased model fit. The findings of the parameter calibration demonstrated that the desire of users to accept self-driving automobiles was significantly influenced by variables including journey time, travel expense, and waiting time. Perceived utility, trip expense, perceived usability, and waiting time had the biggest effects on consumers’ willingness, according to elasticity study.
From the perspective of theoretical implications, this study fills the gap that there is a lack of research on quantitative analysis of the coupled impact of psychological and socioeconomic factors on the purchase likelihood for AVs. Also, the hybrid choice modeling approach proposed in this study could serve as a reference for quantitatively analyzing the coupled impact of psychological and socioeconomic factors on the acceptance of new travel modes (e.g., shared mobility and electric vehicles).
From the perspective of managerial implications, this study benefits the manufacturers and users of AVs. Specifically, the results of this study provide valuable support to the manufacturers in improving the products and marketing strategies. Also, the results of this study enable the users to enjoy AV services that fit well with their psychological and socioeconomic characteristics.

Author Contributions

Conceptualization, Y.L.; Methodology, Y.L., J.T. and Z.W.; Software, M.J.; Formal analysis, Z.W.; Investigation, M.J.; Resources, Y.L.; Data curation, M.J.; Writing—original draft, M.J.; Writing—review & editing, Y.L. and M.J.; Visualization, J.T.; Supervision, J.T.; Project administration, Z.W.; Funding acquisition, Y.L. All authors have read and agreed to the published version of the manuscript.

Funding

This work was supported in part by National Natural Science Foundation of China (Grant No. 52002281), Hunan Provincial Natural Science Foundation of China (Grant No. 2023JJ40731) and China Postdoctoral Science Foundation: No. 2023M733939.

Institutional Review Board Statement

Not applicable.

Informed Consent Statement

Informed consent was obtained from all subjects involvved in the study.

Data Availability Statement

The data presented in this study are available on request from the corresponding author.

Conflicts of Interest

The authors declare no conflict of interest.

References

  1. SAE. Taxonomy and Definitions for Terms Related to Driving Automation Systems for On-Road Motor Vehicles. 2018. Available online: https://www.sae.org/standards/content/j3016_201806/ (accessed on 18 January 2021).
  2. Pettigrew, S.; Dana, L.M.; Norman, R. Clusters of potential autonomous vehicles users according to propensity to use individual versus shared vehicles. Transp. Policy 2019, 76, 13–20. [Google Scholar] [CrossRef]
  3. Analysys. May 2018 Analysis of China’s Internet Car Time-Sharing Rental Market [EB/OL]. Available online: https://www.useit.com.cn/thread-21044-1-1.html (accessed on 6 May 2018).
  4. Analysys & GoFun. November 2018 White Paper on China’s Car Time-Sharing Rental [EB/OL]. Available online: https://www.useit.com.cn/thread-21044-1-1.html (accessed on 9 November 2018).
  5. Luo, C.; He, M.; Xing, C. Public acceptance of autonomous vehicles in China. Int. J. Hum.-Comput. Interact. 2022, 1–12. [Google Scholar] [CrossRef]
  6. Kaltenhäuser, B.; Werdich, K.; Dandl, F.; Bogenberger, K. Market development of autonomous driving in Germany. Transp. Res. Part A Policy Pract. 2020, 132, 882–910. [Google Scholar] [CrossRef]
  7. Aoyama, Y.; Leon, L.F.A. Urban governance and autonomous vehicles. Cities 2021, 119, 103410. [Google Scholar] [CrossRef]
  8. Shariff, A.; Bonnefon, J.-F.; Rahwan, I. Psychological roadblocks to the adoption of self-driving vehicles. Nat. Hum. Behav. 2017, 1, 694–696. [Google Scholar] [CrossRef] [PubMed]
  9. Clark, B.; Parkhurst, G.; Ricci, M. Understanding the Socioeconomic Adoption Scenarios for Autonomous Vehicles: A Literature Review; University of the West of England: Bristol, UK, 2016. [Google Scholar]
  10. Keoleian, G.A.; Kim, S.H.; Kamat, M. Life cycle analysis of greenhouse gas emissions from plug-in hybrid vehicles: Implications for policy. Environ. Sci. Technol. 2015, 49, 2502–2510. [Google Scholar]
  11. Garrow, L.A.; Haigney, D.N. An investigation of consumers’ willingness to adopt self-driving vehicles. J. Transp. Geogr. 2015, 47, 78–88. [Google Scholar]
  12. Dong, X.; DiScenna, M.; Guerra, E. Transit user perceptions of driverless buses. Transportation 2017, 46, 35–50. [Google Scholar] [CrossRef]
  13. Nazari, F.; Noruzoliaee, M.; Mohammadian, A.K. Shared versus private mobility: Modeling public interest in autonomous vehicles accounting for latent attitudes. Transp. Res. Part C Emerg. Technol. 2018, 97, 456–477. [Google Scholar] [CrossRef]
  14. Le Vine, S.; Zolfaghari, A.; Polak, J. Autonomous cars: The tension between occupant experience and intersection capacity. Transp. Res. Part C Emerg. Technol. 2015, 52, 1–14. [Google Scholar] [CrossRef]
  15. Haboucha, C.J.; Ishaq, R.; Shiftan, Y. User Preferences Regarding Autonomous Vehicles. Transp. Res. Part C Emerg. Technol. 2017, 78, 37–49. [Google Scholar] [CrossRef]
  16. Krueger, R.; Rashidi, T.H.; Rose, J.M. Preferences for shared autonomous vehicles. Transp. Res. Part C Emerg. Technol. 2016, 69, 343–355. [Google Scholar] [CrossRef]
  17. Gurumurthy, K.M.; Kockelman, K.M. Modeling Americans’ autonomous vehicle preferences: A focus on dynamic ride-sharing, privacy & long-distance mode choices. Technol. Forecast. Soc. Chang. 2020, 150, 119792. [Google Scholar]
  18. Zhang, T.; Tao, D.; Qu, X.; Zhang, X.; Zeng, J.; Zhu, H.; Zhu, H. Automated vehicle acceptance in China: Social influence and initial trust are key determinants. Transp. Res. Part C Emerg. Technol. 2020, 112, 220–233. [Google Scholar] [CrossRef]
  19. Webb, J.; Wilson, C.; Kularatne, T. Will people accept shared autonomous electric vehicles? A survey before and after receipt of the costs and benefits. Econ. Anal. Policy 2019, 61, 118–135. [Google Scholar] [CrossRef]
  20. Fagnant, D.J.; Kockelman, K.M. Preparing a nation for autonomous vehicles: Opportunities, barriers and policy recommendations. Transp. Res. Part A Policy Pract. 2015, 77, 167–181. [Google Scholar] [CrossRef]
  21. Ajzen, I. The theory of planned behavior. Organ. Behav. Hum. Decis. Process. 1991, 50, 179–211. [Google Scholar] [CrossRef]
  22. Rahman, M.M.; Thill, J.-C. What Drives People’s Willingness to Adopt Autonomous Vehicles? A Review of Internal and External Factors. Sustainability 2023, 15, 11541. [Google Scholar] [CrossRef]
  23. Hwang, J.; Kim, S. Autonomous vehicle transportation service for people with disabilities: Policy recommendations based on the evidence from hybrid choice model. J. Transp. Geogr. 2023, 106, 103499. [Google Scholar] [CrossRef]
  24. Xiao, J.; Goulias, K.G. Perceived usefulness and intentions to adopt autonomous vehicles. Transp. Res. Part A Policy Pract. 2022, 161, 170–185. [Google Scholar] [CrossRef]
  25. Bansal, P.; Kockelman, K.M. Forecasting Americans’ long-term adoption of connected and autonomous vehicle technologies. Transp. Res. Part A Policy Pract. 2017, 95, 49–63. [Google Scholar] [CrossRef]
  26. Merat, N.; Louw, T.; Madigan, R.; Wilbrink, M.; Jamson, A.H.; Reed, N.; Lai, F.C. How do drivers of different ages respond to system failures of a partially automated driving system? Ergonomics 2014, 57, 346–360. [Google Scholar]
  27. Hensher, D.A.; Greene, W.H. The mixed logit model: The state of practice. Transportation 2003, 30, 133–176. [Google Scholar] [CrossRef]
  28. Ben-Akiva, M.; Morikawa, T. Estimation of travel demand models from multiple data sources. In Proceedings of the 11th International Symposium on Transportation and Traffic Theory, Yokohama, Japan, 18–20 July 1990. [Google Scholar]
  29. Idris, A.O.; Habib, K.M.N.; Shalaby, A. An investigation on the performances of mode shift models in transit ridership forecasting. Transp. Res. Part A Policy Pract. 2015, 78, 551–565. [Google Scholar] [CrossRef]
  30. Luce, R.D. Individual Choice Behavior: A Theoretical Analysis; Courier Corporation: North Chelmsford, MA, USA, 1959. [Google Scholar]
  31. Ghasri, M.; Vij, A. The potential impact of media commentary and social influence on consumer preferences for driverless cars. Transp. Res. Part C Emerg. Technol. 2021, 127, 103132. [Google Scholar] [CrossRef]
  32. Ullman, J.B.; Bentler, P.M. Structural equation modeling. In Handbook of Psychology, 2nd ed.; Wiley: Hoboken, NJ, USA, 2012; Volume 2. [Google Scholar]
  33. Kupek, E. Beyond logistic regression: Structural equations modelling for binary variables and its application to investigating unobserved confounders. BMC Med. Res. Methodol. 2006, 6, 13. [Google Scholar] [CrossRef]
  34. Namgung, H.; Chikaraishi, M.; Fujiwara, A. Influence of real and video-based experiences on stated acceptance of connected public transportation and autonomous vehicles in a transit mall: A hybrid choice modeling approach. Transp. Res. Part A Policy Pract. 2023, 173, 103695. [Google Scholar] [CrossRef]
  35. Behnood, A.; Haghani, M.; Golafshani, E.M. Determinants of purchase likelihood for partially and fully automated vehicles: Insights from mixed logit model with heterogeneity in means and variances. Transp. Res. Part A Policy Pract. 2022, 159, 119–139. [Google Scholar] [CrossRef]
  36. Lovreglio, R.; Fonzone, A.; Dell’olio, L. A mixed logit model for predicting exit choice during building evacuations. Transp. Res. Part A Policy Pract. 2016, 92, 59–75. [Google Scholar] [CrossRef]
  37. Davis, F.D. Perceived usefulness, perceived ease of use, and user acceptance of information technology. MIS Q. 1989, 13, 319–340. [Google Scholar] [CrossRef]
  38. Malatji, W.R.; Van Eck, R.; Zuva, T. Understanding the usage, modifications, limitations and criticisms of technology acceptance model (TAM). Adv. Sci. Technol. Eng. Syst. J. 2020, 5, 113–117. [Google Scholar] [CrossRef]
  39. de Luca, S.; Di Pace, R. Modelling users’ behaviour in inter-urban carsharing program: A stated preference approach. Transp. Res. Part A Policy Pract. 2015, 71, 59–76. [Google Scholar] [CrossRef]
  40. Bhat, C.R.; Castelar, S. A unified mixed logit framework for modeling revealed and stated preferences: Formulation and application to congestion pricing analysis in the San Francisco Bay area. Transp. Res. Part B Methodol. 2002, 36, 593–616. [Google Scholar] [CrossRef]
  41. Rose, J.M.; Bliemer, M.C.J. Sample size requirements for stated choice experiments. Transportation 2013, 40, 1021–1041. [Google Scholar] [CrossRef]
  42. Noy, I.Y.; Shinar, D.; Horrey, W.J. Automated driving: Safety blind spots. Saf. Sci. 2018, 102, 68–78. [Google Scholar] [CrossRef]
  43. Greenblatt, J.B.; Saxena, S. Autonomous taxis could greatly reduce greenhouse-gas emissions of US light-duty vehicles. Nat. Clim. Chang. 2015, 5, 860–863. [Google Scholar] [CrossRef]
  44. Nordhoff, S.; van Arem, B.; Happee, R. Conceptual model to explain, predict, and improve user acceptance of driverless podlike vehicles. Transp. Res. Rec. 2016, 2602, 60–67. [Google Scholar] [CrossRef]
  45. Lee, J.; Lee, D.; Park, Y.; Lee, S.; Ha, T. Autonomous vehicles can be shared, but a feeling of ownership is important: Examination of the influential factors for intention to use autonomous vehicles. Transp. Res. Part C Emerg. Technol. 2019, 107, 411–422. [Google Scholar] [CrossRef]
  46. Yurtsever, E.; Lambert, J.; Carballo, A.; Takeda, K. A survey of autonomous driving: Common practices and emerging technologies. IEEE Access 2020, 8, 58443–58469. [Google Scholar] [CrossRef]
Figure 1. Research theoretical framework diagram.
Sustainability 15 15452 g001
Figure 2. Block diagram of constituent factors of the AVAM.
Sustainability 15 15452 g002
Figure 3. Images and videos related to autonomous vehicles.
Sustainability 15 15452 g003
Figure 4. The survey results of respondents’ intention to use AVs.
Sustainability 15 15452 g004
Figure 5. The difference in willingness to use AVs between male and female respondents.
Sustainability 15 15452 g005
Figure 6. Structural equation model operation result diagram.
Sustainability 15 15452 g006
Table 1. RP survey.
Table 1. RP survey.
CategorySample Classification
GenderMale
Female
AgeUnder 18 years old
19–25 years old
26–30 years old
31–40 years old
Over 40 years old
Education level or educational attainmentHigh school or below
College diploma
Bachelor’s degree
Master’s degree or below
Income<5000
5000–1 W
1–2 W
2–3 W
3–5 W
>5 W
Number of vehicles owned0
1
2
3 or more vehicles
Actual driving experienceNo driver’s license or licensed but no actual driving experience
0–1 year of driving experience
1–3 years of driving experience
More than 3 years of driving experience
Table 2. Scenario setting factors and their level values.
L3 Autonomous
Driving Car
L4 Autonomous
Driving Car
L5 Autonomous
Driving Car
AV market share10%, 20%, 30%5%, 10%, 20%1%, 5%, 10%
Ex-factory price25, 27, 2927, 30, 3330, 35, 40
AV purchase subsidy1, 2, 32, 3.5, 53, 6, 9
AV usage scenariosPartially autonomous
driving on large multi-lane highways
Fully autonomous driving
on large multi-lane highways
All sections
Table 3. Examples of scenario design scenes.
AV Market
Share
Ex-Factory PriceAV Purchase SubsidyFinal
Price
AV Usage
Scenarios
A. Conventional car
B. L3 autonomous driving car20%25223Partially autonomous driving on large multi-lane highways
C. L4 autonomous driving car10%333.529.5Fully autonomous driving on large multi-lane highways
D. L5 autonomous driving car5%35332All sections
Table 4. Reference proportion of user portrait on travel platform.
AgeRatio
[18, 25)25.1%
[25, 35)53.3%
[35, 45)18.5%
45+3.1%
Table 5. Descriptive Statistical Analysis.
CategorySample ClassificationSample SizeProportion or Ratio (%)
GenderMale14648.3
Female15651.7
AgeUnder 18 years old103.31
19–25 years old16554.64
26–30 years old6421.19
31–40 years old5718.87
Over 40 years old61.99
Education level or educational attainmentHigh school or below3110.26
College diploma5217.22
Bachelor’s degree18360.60
Master’s degree or below3611.92
Income<500016154.3
5000–1 W4816.9
1–2 W3411.3
2–3 W289.3
3–5 W144.6
>5 W143.6
Number of vehicles owned05417.9
118862.3
25518.2
3 or more vehicles51.7
Actual driving experienceNo driver’s license or licensed but no actual driving experience10334.1
0–1 year of driving experience6220.5
1–3 years of driving experience8327.5
More than 3 years of driving experience5417.9
Table 6. Measurement Variable Reliability Test Form.
Latent VariableMeasured VariableSample SizeMaximum ValueMinimum ValueMean or AverageStandard Deviation
Performance expectancyPU1302513.550.853
PU2302513.650.882
PU3302513.550.866
PU4302512.430.692
PU5302512.450.743
Effort expectancyPEU1302512.450.728
PEU2302513.820.777
Perceived riskPRE1302513.740.792
PRE2302513.610.796
PRE3302513.590.745
Convenient conditionsFC1302513.590.730
FC2302513.670.736
FC3302513.680.703
Social impactSI1302513.640.732
SI2302513.650.709
SI3302513.670.749
AttitudeATB1302513.610.746
ATB2302513.600.956
ATB3302513.540.738
Use BehaviorBI1302513.780.732
BI2302513.510.751
BI3302513.550.774
Table 7. Correlation Test Table for Various Factors.
Performance ExpectancyEffort ExpectancyPerceived RiskConvenient ConditionsSocial ImpactAttitudeUse Behavior
Performance expectancyPearson correlation10.366 **−0.536 **0.580 **0.511 **0.688 **0.547 **
significance (two-tailed) 0.000.000.000.000.000.00
N302302302302302302302
Effort expectancyPearson correlation0.415 **1−0.536 **0.678 **0.579 **0.702 **0.611 **
significance (two-tailed)0.00 0.000.000.000.000.00
N302302302302302302302
Perceived riskPearson correlation−0.311 **−0.540 **1−0.505 **−0.441 **−0.674 **−0.523 **
significance (two-tailed)0.000.00 0.000.000.000.00
N302302302302302302302
Convenient conditionsPearson correlation0.498 **0.826 **−0.366 **10.643 **0.864 **0.546 **
significance (two-tailed)0.000.000.00 0.000.000.00
N302302302302302302302
Social impactPearson correlation0.685 **0.477 **−0.578 **0.856 **10.834 **0.284 **
significance (two-tailed)0.000.000.000.00 0.000.00
N302302302302302302302
AttitudePearson correlation0.466 **0.645 **−0.865 **0.768 **0.528 **10.824 **
significance (two-tailed)0.000.000.000.000.00 0.00
N302302302302302302302
Use BehaviorPearson correlation0.553 **0.583 **−0.843 **0.343 **0.743 **0.381 **1
significance (two-tailed)0.000.000.000.000.000.00
N302302302302302302302
Table 8. Data significance test results.
Index or Serial NumberPathPath Coefficient Estimatep-ValueValidation ResultExplained Variance R2
H1Performance Expectancy to Attitude0.2770.003 **established
H2Performance Expectancy to Use Behavior0.170.006 **established
H3Effort Expectancy to Performance Expectancy0.7740.000 **established
H4Effort Expectancy to Attitude0.2540.018 **established
H5perceived risk to Attitude−0.1480.008 **established
H6perceived risk to Use Behaviour−0.1110.01 **established
H7social impact to Attitude0.1050.082 **not established0.409
H8social impact to attitude0.1440.028 **established
H9social impact to perceived risk0.0850.539 **not established
H10convenient conditions to Performance Expectancy0.030.393 **not established
H11convenient conditions to Attitude0.2140.024 **established
H12convenient conditions to Use Behaviour0.210.002 **established
H13Attitude to Use Behaviour0.5190.000 **established
Table 9. Parameter estimation results.
Car Purchase IntentionVariable NameMNL
Estimated Parameter ValueZ-Test Valuep > IzI
Autonomous vehicleConstant term1.3871.540.124
Autonomous vehicle ownership rate−0.121−9.900.000
AV usage scenarios−0.402−8.730.000
AV purchase price0.800−10.760.000
Performance expectancy0.4373.260.001
Effort expectancy0.1011.980.048
Perceived risk−0.194−2.000.046
Social impact−0.209−1.700.089
Convenient conditions−0.108−1.960.050
Attitude−0.331−2.010.045
Use Behavior0.5333.020.003
Driver’s license−0.357v2.620.009
Education level 10.0920.230.820
Education level 20.3630.890.372
Education level 30.3801.410.158
Personal income 10.5291.630.102
Personal income 20.4341.220.222
Personal income 30.2690.720.474
Personal income 40.3650.980.328
Personal income 50.8732.040.042
Number of car ownership 11.5392.850.004
Number of car ownership 21.0892.070.038
Number of car ownership 31.2072.230.026
Number of ca r ownership 4 (reference item)---
Table 10. Elastic analysis results.
Variable NameAutonomous Vehicle Ownership RateAV Usage ScenariosAV Purchase PricePerformance ExpectancyEffort ExpectancyPerceived RiskAttitude
Elasticity value−0.0156−0.0340−0.0405 0.0502 0.0375 −0.02520.0148
p > IzI0.000 0.000 0.000 0.024 0.038 0.028 0.037
Disclaimer/Publisher’s Note: The statements, opinions and data contained in all publications are solely those of the individual author(s) and contributor(s) and not of MDPI and/or the editor(s). MDPI and/or the editor(s) disclaim responsibility for any injury to people or property resulting from any ideas, methods, instructions or products referred to in the content.

