Abstract
The rising integration of China’s digital economy with its real economy is propelling the global economy toward a new stage of system reconstruction, profoundly affecting the economic and social development, national governance, and lives of various countries. Formulating and implementing a development strategy for the digital economy is crucial for China. However, there is a lack of research on the innovation-driven relationship between the digital economy and the real economy using authoritative statistics. This paper addresses this gap by adopting Romer’s R&D model and theories from other scholars, thereby constructing an innovation-driven analysis model. Leveraging over 10,000 authoritative statistics and econometric regression, it quantitatively assesses the innovation-driven effect of China’s digital economy on the real economy at both national and regional levels. The study concludes with empirical-based development suggestions to promote the profound integration and innovation within China’s digital and real economies, thereby offering an objective and valuable reference.
1. Introduction
The new generation of information technology is accelerating the convergence between the digital and real economies, ushering in a transformation from the IoE to intelligent interconnections across various domains. This transition encompasses technological integration, product-based innovation, shifts in business models, and changes in organizational structure, thereby empowering various aspects of life and catalyzing systemic reconstruction and paradigm shifts within the global economy. These transformative changes profoundly impact economic and social development, national governance, and the overall global quality of life. Data resources, now recognized as a new production factor, play a strategic role in promoting high-quality economic and social development.
In recent years, the digital economy has grown rapidly in China. As a new economic form that leads the future, it has unprecedentedly reconstructed a new picture of economic and social development and is a new variable for improving economic quality and efficiency [1]. Reviewing previous research, it has been observed that current scholars are primarily conducting studies on the digital economy from two main perspectives. The first perspective involves exploring the integration relationships between specific industries within the context of the digital economy. The second perspective involves studying the developmental relationship between the digital economy and the real economy. However, there are few scholars who have approached this topic from an innovation-driven perspective, utilizing authoritative statistical data to study the developmental relationship between the digital economy and the real economy. Building upon a review of relevant prior research, this paper constructs an econometric model to conduct both theoretical and empirical research concerning the innovation-driven effects of the digital economy on the real economy, thereby developing a more objective study of the influence mechanism of the digital economy on real economic development and performing an analysis from a new perspective. Additionally, this paper compares regional disparities in the innovation-driven effects, investigating the regional heterogeneity of the digital economy’s impact on real economic development. Thus, our findings have a good policy reference value for China in efforts to advance the deep integration of the digital economy and the real economy, reduce regional disparities in the digital economy, and promote high-quality economic development.
2. Literature Review and Analysis
The global economy has experienced a transformative evolution from a digital perspective, progressing through three stages: the information economy, the internet economy, and the digital economy. Each stage has been driven by the emergence of new-generation information technologies, encompassing big data, cloud computing, artificial intelligence (AI), and 5G. As technological innovation continues to advance, the inherent “data-driven” nature of various socio-economic sectors will become more pronounced. This accentuation will lead to the emergence of new technologies, applications, models, and business paradigms, which, in turn, will act as catalysts for promoting high-quality socio-economic development.
2.1. Technological Innovation and Economic Growth Theory
The term innovation was first introduced by Schumpeter, who divided it into five processes: new products, technologies, markets, supply channels, and business organization [2]. Scholars, like Utterback and Abernathy, expanded on this, proposing the A-U model with three stages: flow, transition, and specific [3,4]. Extensive global research on technological innovation focuses on its crucial role in economic growth and industrial structure adjustment. The innovation system enhances technological imitation, original innovation, and industry competitiveness. Moreover, increased R&D expenditure positively impacts the economic operations’ stable growth rate of physical capital, knowledge, and output.
At the same time, economic development theory has evolved from exogenous growth to endogenous growth, with the latter emphasizing the crucial role of technology in economic growth. The “R&D Growth Model” by Grossman, Helpman, Aghion, and Howitt is a significant result in this field, providing a theoretical basis to analyze knowledge and human capital’s contribution to the economy [5,6]. Scholars like Lucas and Becker have also developed human capital models, highlighting the importance of formal education and the increasing return effect of human capital accumulation. As a result, countries or industries with higher human capital levels can attract more external capital due to their higher interest rates on capital [7,8].
2.2. Research Related to Digital Economy Driving Real-Economy Development
At the micro level, the digital economy primarily satisfies personalized consumer demand via economies of scale and scope, enhancing supply–demand matching efficiency and reducing transaction costs through data-driven strategies. Concerning economies of scale, business production costs manifest as “high fixed costs” and “low marginal costs”. This structure encourages businesses to expand their production scale for conducting operations, thereby fostering the normalization of economies of scale [9]. The digital economy is profoundly changing the way of production and life of human beings, thus promoting the dual digital transformation of the energy supply side and demand side, which has a profound impact on energy consumption [10]. The digital economy can directly or indirectly contribute to large-scale pig farming by improving technological innovation, increasing commodity sales, and reducing pig labor costs [11]. In terms of scope, based on the economies of scale and network effects of the digital economy, traditional enterprises can effectively enhance the relevance of their products, greatly expand their practical business scope and operating hours, and form a “long tail effect” through customized production [12]. The digital economy can promote the growth of enterprise productivity through the economy of scope effect and other ways [13]. Under the deep integration of the digital economy and traditional industries, it can greatly promote the enhancement of technological innovation capacity, realize economies of scale and scope, and continuously promote the generation of new industries and new business models, thus promoting the high-quality development of China’s economy [14].
At the macro level, the digital economy has an impact on economic development through three key areas: factor allocation efficiency, capital deepening, and technological innovation. Concerning the improvement in the factor allocation efficiency, data and information not only directly contribute to production but also bolster the productivity of traditional factors, including labor, capital, and entrepreneurial talent [15]. The digital economy has a significant U-shaped feature on green total factor productivity, with positive direct impacts and spatial spillover effects, which mainly come from the digital economy’s promotion of green technological progress [16]. In terms of capital deepening, new technologies offer the potential to modernize production structures and improve the quality and overall level of productivity [17]. The digital economy can alleviate the crowding effect in developed areas, such as eastern regions and large cities, and provide a good foundation for high-quality economic development [18]. Results have shown that the digital economy can directly drive high-quality green development, and industrial restructuring and green technology innovation are important intermediary mechanisms [19]. The other cycles of the circular economy need a clear enabler that is personalized in a strong push for eco-efficiency, which is achieved through sustained incentives to invest in eco-innovation research and development [20]. In terms of technological innovation effects, according to endogenous growth theory, endogenous R&D and innovation are the key factors driving economic growth and technological innovation [21]. The digital economy significantly improves the efficiency of the green economy, and technological innovation is an important way for the digital economy to improve the efficiency of the green economy [22]. The resilience of regional innovation ecosystems has a positive spatial spillover effect on the development of the digital economy [23]. The government should set up a special fund to encourage companies to expand innovative activities in their own production processes, and R&D investment is expected to increase, which can further increase productivity and reduce the reliability of knowledge spillovers [24]. For example, Chou et al. found a significant positive impact on TFP growth through I.T. externalities and I.T. innovation in their research [25].
The literature establishes the fundamental basis for understanding the connection between the digital economy and the development of the real economy. Nevertheless, three critical scientific inquiries necessitate deeper exploration. Firstly, in theoretical research, what constitutes the underlying pattern of the innovation-driven impact of the digital economy on the real economy? Secondly, how can we quantitatively evaluate the scale of this innovation-driven impact in empirical analyses? Thirdly, is it viable to delve into the distinct characteristics of this impact across various regions, both at the national and regional levels? This study utilizes Romer’s R&D model, along with contributions from other scholars, as a theoretical foundation to explore the innovation-driven impact of the digital economy on China’s real economy. It constructs a two-sector theoretical analysis model, integrates authoritative statistical data, and employs econometric regression techniques to quantitatively assess this impact at both national and regional levels. Based on the empirical research conclusions, the paper provides development suggestions to foster the deep integration and innovative development of China’s digital and real economies (Figure 1).
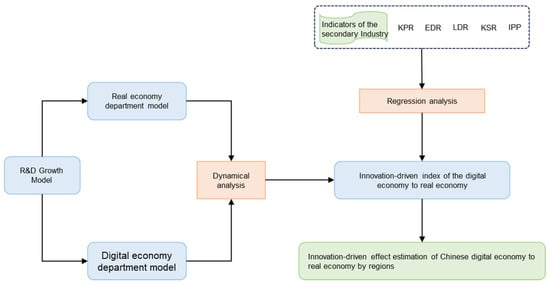
Figure 1.
Overview of the workflow for innovation-driven effect estimation of digital economy and real economy.
3. Model Construction and Empirical Analysis
3.1. A theoretic Analytical Model of the Innovation-Driven Effects of the Digital Economy and the Real Economy from A Bi-Sectoral R&D Perspective
3.1.1. Hypothesis
The R&D Growth Model by Romer et al. posits that the economy consists of two subsystems, namely, the digital economy and the real economy, each involving production and R&D activities. These processes necessitate the input of physical capital, human capital, and accumulated knowledge. In the knowledge innovation process, insights come from deliberate independent development and incidental “learning-by-doing”. Both subsystems allocate physical and human capital in certain proportions to carry out production and R&D activities. Specifically, both the digital and real economy sector models employ the Cobb–Douglas (C-D) production function, rooted in the R&D Growth Model:
In the above equation, , where d represents the digital economy subsystem, and s represents the real economy subsystem. represents the productive human capital invested by the ith subsystem at moment t. From an economy-wide perspective, is used to denote the output at moment t, denotes the total physical capital at moment t, and A(t) denotes the total technology or knowledge at moment t. Assuming that the proportion of human capital is constant since the whole economy consists of two subsystems, the digital economy and the real economy, .
Meanwhile, this model assumes that both human and physical capital within the two subsystems are composed of R&D and production components, respectively, and that the ratios are fixed constants; then:
This paper follows Romer’s research idea, assuming that the savings rate and population growth rate are exogenously constant and the depreciation rate is zero; then:
where s denotes the savings rate and n denotes the population growth rate.
3.1.2. Digital Economy Sector and Real Economy Sector Models
Based on the above assumptions, the production function model and the knowledge production function model for the digital economy sector can be constructed as follows:
where denotes the digital economy output. ) is the capital output elasticity. denotes the total physical capital invested in the digital economy. denotes the digital economy knowledge or technology stock. denotes the total human capital invested in the digital economy. denotes the new knowledge generated by the digital economy at moment t. denotes the knowledge production conversion parameter of the digital economy. denotes the physical capital used by the digital economy for autonomous R&D activities, denotes the human capital used by the digital economy for autonomous R&D activities, and denotes the human capital used for production in the digital economy.
Similarly, the production function model and the knowledge production function model for the real economy sector can be constructed as follows:
where denotes the output of the real economy; ) is the output elasticity; denotes the total physical capital invested in the real economy; denotes the stock of knowledge or technology in the real economy; and denotes the total human capital invested in the real economy. denotes the new knowledge generated by the real economy at moment t, denotes the knowledge production conversion parameter of the real economy, denotes the physical capital used by the real economy for its R&D activities, denotes the human capital used by the real economy for its R&D activities, denotes the physical capital used for production in the real economy, and denotes the human capital used for production in the real economy.
3.1.3. Dynamical Analysis of the Bi-Sector Model
Analysis of Digital Economy Sector Dynamics
Based on the above base model and the assumptions regarding the configuration of human and physical capital in this paper, and by employing the approach of endogenous growth theory, the production function and knowledge production function of the digital economy sector can be expressed as follows:
By dividing both sides of the knowledge production function for the digital economy sector by simultaneously and taking the logarithm and differentiating in time:
From the above equation, knowledge production in the digital economy sector will maintain a fixed growth rate in the case that . At this point, a straight line about and with slope and intercept is obtained. Meanwhile, the slope of with a relative magnitude of 1 determines the payoff of scale for knowledge production in the digital economy sector. This paper focuses on , the dynamic evolution of knowledge production, and physical capital accumulation in the digital economy sector in the case of diminishing returns to the scale of knowledge production.
Next, the process of the evolution of physical capital dynamics in the digital economy sector is considered. Since the text assumes the savings rate to be exogenously fixed, the production function and the capital growth function of the digital economy sector lead to:
Dividing the above equation by , taking the logarithm, and differentiating with respect to time yields:
In the case of , the trajectories of and have an intersection (i.e., equilibrium point) and will eventually converge on this equilibrium point regardless of the initial values of and , which also implies that the growth rates of knowledge production and physical capital accumulation in the digital economy sector reach the following steady state:
The above analysis shows that knowledge production and physical capital accumulation in the digital economy will grow at a constant rate in the case of decreasing returns to the scale of knowledge production in the digital economy sector. Since a constant payoff of scale characterizes the economic production of the digital economy sector, the growth rate of the economic output of the digital economy sector is: .
Analysis of Real Economy Sector Dynamics
Similarly, drawing on the dynamic analysis of the digital economy sector, the growth function of knowledge production in the real economy sector can be derived as follows:
Observing the above equation, , , and influence the payoffs for the scale of knowledge production in the real sector of the economy. Under the consideration of , several scenarios will occur for the payoff of the scale of knowledge production in the real economy sector. One is if , which means that there is no knowledge spillover from the digital economy sector to the real economy sector, and the trend of knowledge production function in the real economy sector is similar to that of the digital economy sector. Second, if , it indicates that there is a small amount of knowledge spillover from the digital economy sector to the real economy sector, but the knowledge production function of the real economy sector still shows the characteristic of diminishing returns to scale, and the degree of diminishing is weaker compared with that of the digital economy sector. Third, if , it indicates that the knowledge spillover effect of the digital economy sector can realize the knowledge production of the real economy sector exactly at the level of constant returns to scale. Fourth, if , it indicates that the knowledge spillover effect of the digital economy sector is stronger and can drive the knowledge production of the real economy at the level of increasing returns to scale.
Then, the dynamic evolution process of physical capital in the real sector of the economy is considered. Similar to the digital economy sector, the growth function of physical capital in the digital economy sector can be derived as follows:
In the case that , the economic growth of the digital economy sector will also converge to the equilibrium growth path. Therefore, can be substituted into Equation (15) and then combined with Equations (15) and (16) to obtain the steady-state points of the growth rate of knowledge production and capital accumulation in the real economy as follows:
The above analysis shows that knowledge production and physical capital accumulation in the real economy will grow at a constant rate in the case of . Since constant payoffs of scale characterize economic production in the real economy sector, the growth rate of economic output in the real economy sector is: .
Construction of Innovation-Driven Index of the Digital Economy and Real Economy
By analyzing the dynamics of the digital economy sector and the real economy sector, it is known that the growth rate of capital accumulation and the growth rate of knowledge production in both economic sectors will reach a steady state. Therefore, this paper constructs the “Innovation-Driven Index of the Digital Economy on Real Economy” (IDIDR) based on the steady-state knowledge production growth rates of the two sectors as follows:
As seen from the above equation, the size of IDIDR can reflect the strength of the innovation-driven effect between the digital economy and the real economy and the size of the cognitive gap between the two economic subsystems. When IDIDR > 1, there is a cognitive gap between the two economic subsystems, and the innovation-driven effect of the digital economy on the real economy is stronger (referred to as “enhanced driven”), i.e., for every n% increase in the knowledge output of the digital economy, the knowledge output of the real economy will be greater than n%. The real economy will show the characteristics of catching up with the development of the digital economy. The real economy will be characterized by catching up with the development of the digital economy. When IDIDR = 1, there may be a cognitive gap between the digital economy and the real economy. The cognitive gap between the digital economy and the real economy will remain large or develop in parallel, and the positive driving effect of the digital economy on the real economy is not significant enough (referred to as “synchronous driven”). When 0 < IDIDR < 1, the knowledge innovation of the digital economy cannot bring about the same proportion or more of the knowledge innovation of the real economy, and the cognitive gap between the two economic subsystems will continue to expand over time (referred to as “decaying driven”). When IDIDR < 0, the knowledge innovation of the digital economy will inhibit the knowledge innovation of the real economy, showing the crowding-out effect of the digital economy on the real economy (referred to as “exclude driven”). The driven effects under different values of IDIDR are shown in Table 1.

Table 1.
Innovation-Driven Index of the Digital Economy and Real Economy (IDIDR) classification.
3.2. Empirical Analysis of the Innovation-Driven Effect of the Digital Economy on the Real Economy (Taking the Secondary Industry as An Example)
3.2.1. Econometric Model Construction, Variables Description, and Data Sources
Econometric Model Construction
According to the above theoretical findings, knowledge production in the real economy is mainly derived from three aspects: independent R&D activities in the real economy, “learning by doing” activities in the real economy, and knowledge spillover effects in the digital economy. Given that IPR protection may have an important impact on the innovation-driven effects, a panel data model of the development of China’s secondary industry can be established:
denotes the new knowledge production of the secondary industry in year t in region i, denotes the independent R&D effect of the secondary industry in year t in region i, denotes the learning-by-doing effect of the secondary industry in year t in region i, and denotes the knowledge spillover effect of the digital economy sector on the secondary industry in year t in region i. denotes the intensity of intellectual property protection. , and have the same meanings as those related to the theoretical study in this paper, and denotes the random error. The variables description is shown in Table 2.
Table 2.
Variables description.
Data Sources
According to the statistical boundary definition between the digital economy and the secondary industry in this paper, the following are adopted: the 2004–2021 China Statistical Yearbook; the 2004–2021 Statistical Communiqué of the People’s Republic of China on the National Economic and Social Development; the 2004–2021 China Science and Technology Statistical Yearbook; the 2018 Software and Information Technology Service Industry Statistical Annual Report; China Industrial Economy Statistical Yearbook 2004–2021; China High Technology Industry Statistical Yearbook 2004–2021; China Input-Output Tables for 2002, 2007, 2012, 2017, and 2020; as well as data related to the input–output of 22 provinces of China [40,41,42,43]. Considering data availability, timeliness, and reliability, data processing in this paper adhered to the following principles: firstly, the input-output tables published by China every five years are utilized, with the latest available year being 2020. Secondly, to maintain data timeliness, industry development data spanning from 2003 to 2020 are used for analysis. Thirdly, for data consistency, since the National Bureau of Statistics ceased publishing the total output value of each industrial segment after 2012, this paper employs business income as a measure of industry value added. Fourthly, patent applications in the computer, communication, and other electronic equipment manufacturing industries are excluded from the count of patent applications in the secondary industry, with the excluded data representing the actual number of patent applications in the secondary industry. Lastly, internal expenditures of R&D funds in the computer, communication, and other electronic equipment manufacturing industries are excluded from the internal expenditure count of R&D funds in the secondary industry, with the excluded data reflecting the actual internal expenditure of R&D funds in the secondary industry. The correspondence between each data source and indicator is shown in Table 3:
Table 3.
The correspondence between data sources and indicators.
3.2.2. Empirical Analysis
Analysis of Data Smoothness and Cointegration
The text was tested for the smoothness and cointegration of all variables using Eviews 10.0 software. For data smoothness tests, three methods, the LLC test (Levin, Lin and Chu test), ADF-Fisher, and PP-Fisher were used [44,45] (Table 4). According to the test results, lnKPR, lnRDR, lnLDR, lnIPP, and lnKSR are all smooth in the first-order difference state.
Table 4.
Unit root test results of the three methods.
After completing the unit root test, a total of three methods, Pedroni (Engle–Granger based), Kao (Engle–Granger based), and Fisher (combined Johansen), were used to test the cointegration relationship between the variables [46,47,48] (Table 5 and Table 6). According to the test results, it is clear that there is a cointegration relationship between the variables.
Table 5.
Results of the cointegration test for Pedroni and Kao methods.
Table 6.
Results of Fisher’s (combined Johansen) method of cointegration test.
Through data stationarity and a cointegration analysis, this paper concludes that the selected data samples meet the requirements of a panel regression analysis.
Panel Model Selection
After conducting unit root and cointegration tests on the variables, the panel data regression model is determined by implementing the F-test and Hausman test [49,50]. To examine the variations in innovation-driven effects across regions, four distinct regions (national, northern and eastern, central and southern, and western) are examined, obtaining coefficients representing their innovation-driven effects. Therefore, F-tests and Hausman tests are conducted for each region to establish the regression model for their respective panel data (Table 7). Based on the test outcomes, individual fixed-effect models are established for all four regions.
Table 7.
Results of the F-test and Hausman test.
Analysis of Empirical Results
Based on the regression models for each region, the Cross Section Weight (CSW) method is used to estimate the national and regional coefficients, and the Seemingly Unrelated Regression (SUR) method is used for the northern and eastern, central and southern, and western regional coefficients [51,52] (Table 8):
Table 8.
Results of the analysis of innovation-driven effect of China’s secondary industries by regions.
At the national level, between 2003 and 2020, the strength of IPR protection was crucial for promoting high-quality knowledge spillovers from the digital economy to the secondary sector, considering the impact of IPR protection on the innovation-driven effect. Secondly, the core drivers of the secondary industry are the learning-by-doing effect (0.3232), the knowledge spillover from the digital economy to the secondary industry (0.1872), and the independent R&D effect (0.1182). Reflecting on the developmental trajectory of China’s secondary industry, it can be inferred that the “learning-by-doing” effect predominantly stems from the proliferation of “labor-intensive” manufacturing industries during the early 21st century. This expansion was primarily facilitated by China’s demographic dividend, a comparative advantage that boosted employment and expedited the accumulation of production techniques, processes, and managerial experience in industries reliant on human capital. Consequently, the “learning-by-doing” effect has continually enhanced production efficiency. However, it is worth noting that independent R&D, although critical, has demanded persistent capital and high-level talent investments, whereas the “learning by doing” effect has fostered knowledge innovation. This discrepancy has led to a comparatively lower emphasis and investment in independent R&D by market participants, resulting in minimal contribution to knowledge production within the secondary industry. Since 2012, China’s digital economy has transitioned from the “consumer Internet” to the “industrial Internet” era. During this phase, the real economy, including the secondary industry, has enthusiastically adopted new technologies, products, and internet-based models, progressively establishing an industry rooted in big data, 5G, artificial intelligence, and the Internet. Concurrently, the knowledge spillover effect of the digital economy on the secondary industry has been persistently amplified, becoming, alongside the “learning by doing” effect, a pivotal driver for knowledge innovation within the secondary industry.
On a regional scale, the determinants and magnitude of knowledge production within the northern and eastern, central and southern, and western regions exhibit some variation compared to the national level from 2003 to 2020. However, the influence of Intellectual Property Rights (IPR) protection remains paramount across all regions, significantly contributing to knowledge production endeavors. The additional factors influencing knowledge production within each region are delineated below:
The principal determinants of secondary industry development in the northern and eastern regions, in decreasing order of significance, comprise the “learning-by-doing” effect (0.4146), the knowledge spillover from the digital economy to the secondary industry (0.1876), and the independent R&D effect (0.1724). This finding largely stems from the extensive presence of “human-intensive” and “capital-intensive” manufacturing sectors in northern and eastern China. Consequently, the structure of knowledge innovation dynamics in this region mirrors that of the nation, but the “learning-by-doing” effect and the independent R&D effect emerge as more substantial contributors to knowledge production.
In the central and southern regions, the hierarchy of primary determinants for the secondary-industry development mirrors that of the northern and eastern regions and the nation. However, the “learning-by-doing” effect is less pronounced in the central and southern regions (0.2587) due to a lower secondary industry density. Notably, the digital economy’s spillover effect (0.1923) is substantial, indicating an active interplay between the digital economy and the secondary industry in these regions. The independent R&D effect (0.1186) closely aligns with the national value (0.1182). In the western region, the main drivers of the secondary-industry development, in descending order, are independent R&D (0.3039), “learning-by-doing” (0.2318), and knowledge spillover from the digital economy (0.0770). These significantly deviate from the national ranking. Given that the western region lags compared to other regions, it faces a relative shortage of professional and high-level talents, leading to a persistent outflow of human resources. Additionally, its digital economy’s development level remains relatively lower than that of other regions. Consequently, this region cannot fully leverage the “learning-by-doing” effect to spur knowledge production. Instead, it predominantly depends on “independent R&D” to stimulate knowledge innovation activities within the secondary industry. The spillover from the digital economy to the secondary industry is correspondingly minimal.
Finally, the results of the “learning-by-doing” effect, independent R&D effect, and knowledge spillover effect in each region are all less than 1. Therefore, knowledge production in the secondary industry is characterized by a decreasing scale effect.
3.2.3. Calculation and Analysis of Innovation-Driven Index by Regions in China
Based on the coefficients estimated in Table 8, the innovation-driven index for China from 2003 to 2020 is calculated by combining Equation (18) as shown in Table 9.
Table 9.
Calculation results of IDIDR in various regions of China from 2003 to 2020.
The innovation-driven effect of the digital economy on the secondary industry demonstrates an enhancing effect at the national and regional levels. The national IDIDR is 1.4251 at the national level, suggesting that a 1% increase in digital economy innovation yields a robust 1.4251% economic growth in the secondary industry. Regionally, the northern and eastern areas show the highest IDIDR (1.7792), significantly surpassing other regions. This implies a solid industrial development foundation within these regions and a harmonious interaction with the digital economy. The elevated IDIDR in the western region compared to the central and southern regions can largely be attributed to the western region’s active pursuits in industrial restructuring and digital economy alignment in recent years. This has led to considerable advancements in integrating digital and real economies, reflecting the economic development characteristic of “catching up afterward.” Despite the central and southern regions exhibiting the lowest IDIDR (1.3815), the digital economy’s innovation-driven effect on the secondary industry within these regions remains in an enhancing phase, offering a potent stimulus for the economic growth of the secondary industry.
To analyze the innovation-driven effect at the provincial level more thoroughly, a regression analysis was performed on data gathered from 22 provinces and municipalities in China, spanning the period from 2003 to 2020. We then computed the IDIDR on the Secondary Industry for each province and municipality during this time frame. The results of this computation are presented in Table 10. Based on these findings, we classified the 22 provinces and municipalities into four categories: 1. Regions exhibiting a strong innovation-driven effect, also referred to as “strongly driven” regions (IDIDR ≥ 1.25). 2. Regions with a notable innovation-driven effect, known as “obviously driven” regions (1.25 > IDIDR ≥ 1.00). 3. Regions displaying an insufficient innovation-driven effect, termed “insufficiently driven” regions (1.00 > IDIDR ≥ 0). 4. Regions suffering from severe underdrive, also known as “reverse driven” regions (0 > IDIDR).
Table 10.
IDIDR and innovation-driven models of 22 provinces and municipalities in China from 2003 to 2020.
The “strong-driven” regions consist of 10 provinces and municipalities, namely, Shandong, Guangxi, Beijing, Jilin, Sichuan, Hunan, Zhejiang, Shanghai, Hebei, and Fujian. These regions exhibit an IDIDR exceeding 1.25, signifying a substantial driving effect of the digital economy on their secondary industries. A further analysis reveals that these regions experience high knowledge spillover effects from the digital economy, with the spillover effect driving the digital economy being the most significant among the three effects in most regions. This suggests a strong interactive integration between digital economy industries and secondary industries in these regions.
The “obvious driven” regions, including Jiangxi, Shaanxi, Guizhou, Tianjin, Guangdong, Henan, Liaoning, and Jiangsu, exhibit IDIDRs ranging from 1 to 1.25, indicating a noticeable driving effect of the digital economy on their secondary industries. A further analysis reveals that the driving effect of the digital economy on the secondary industry in these regions is generally less significant compared to independent R&D, suggesting that independent R&D serves as the primary driving force for the development of the secondary industry in these regions. However, the knowledge spillover effect of the digital economy still plays a supporting role in promoting secondary-industry development.
The “insufficient driven” and “reverse driven” regions consist of four provinces and municipalities, namely, Chongqing, Anhui, Gansu, and Hubei. These regions exhibit IDIDRs less than 1, with Gansu and Hubei even having IDIDRs below 0. These values indicate a lack of an evident innovation-driven effect of the digital economy on the secondary industry in these regions. Further analysis reveals that the driving effect of the digital economy is negative in Chongqing, Anhui, and Hubei, suggesting insufficient integration and interaction between the digital economy and the secondary industry. In these regions, the innovation development of the secondary industry primarily relies on independent R&D and the “learning-by-doing“ effect. Meanwhile, Gansu’s secondary industry faces challenges in harnessing the “learning-by-doing” effect, hindering the absorption of knowledge spillover from the secondary industry to the digital economy and resulting in an insufficient innovation-driven effect.
4. Discussion, Key Findings, and Policy Recommendations
(1) There are significant variations in the innovation-driven impact of the digital economy on the secondary industry across different regions. Therefore, it is imperative to promote a high-level collaborative development between the digital economy and the secondary industry in various regions. Based on the research in this paper, there are significant levels of regional heterogeneity in terms of innovation-driven effects in the process of integrated development between the digital economy and the real economy. The northern and eastern regions exhibit the highest Innovation-Driven Index (IDIDR), while the western, central, and southern regions have a relatively lower IDIDR. Furthermore, the strength of intellectual property protection plays a crucial role in the innovation-driven effects of both economic subsystems at both the national and regional levels. There are notable regional differences in the contributions of the “learning-by-doing” effect, the knowledge spillover, and the independent R&D on the innovation-driven effects of the two economic subsystems. This contributes significantly to the regional disparities in the IDIDR across various regions. Therefore, in the process of promoting the high-level integration of the digital economy and the secondary industry, it is essential to fully consider the resource endowments and industrial foundations of different regions. Priority should be given to driving the digital transformation and upgrading of advantaged niche industries within each region, thereby narrowing the gap between regions in terms of knowledge spillover from the digital economy to the secondary industry. This will indirectly boost the independent R&D and the “learning-by-doing” effect of advantaged industries in each region, effectively harnessing the empowerment and driving role of the digital economy in various regional industries. This, in turn, raises the IDIDR levels in different regions. Simultaneously, there is a need to break down policy barriers hindering cross-regional coordination between the digital economy and the secondary industry. This includes promoting the flow of key production factors such as data, capital, labor, and land between regions, thus effectively reducing the regional disparities in IDIDR.
(2) Building upon the promotion of coordinated development between the digital economy and the secondary industry in various regions to further reduce the disparities in the IDIDR between regions, it is imperative to enhance the digital support from regions with intensive digital infrastructure to other areas. Additionally, elevating the collaborative development level of core digital economy industries and the secondary industry across regions is also crucial. Currently, there are substantial disparities in the levels of digital infrastructure construction across different regions in China. Regions including Beijing–Tianjin–Hebei, the Yangtze River Delta, the Greater Bay Area, Chengdu-Chongqing, Guizhou, Inner Mongolia, Gansu, and Ningxia are in the process of constructing national integrated computing network hub nodes. These areas possess denser digital infrastructure than other regions. Besides providing digital support to local secondary industries, they also have the capacity to offer digital services to surrounding areas or other economically developed regions. Therefore, strengthening the complementarity and fusion of digital infrastructure between regions is a critical strategic direction for enhancing “Industrial digitalization” in coordinated regional development. This approach also serves as robust support for the nationwide integration of the digital economy and the real economy. In this regard, this paper primarily provides the following recommendations for promoting the convergence of digital infrastructure between regions: leveraging the construction of city clusters to facilitate the provision of cloud computing and its related services from regions with intensive digital infrastructure to less developed areas with a high demand for digital infrastructure. This approach can create new growth points in the digital economy and effectively address the high computing demands of less-developed regions, thus significantly reducing the IDIDR disparities.
(3) A new model should be actively created for the high-level integration of China’s digital economy and the secondary industry, and a comprehensive solution should be provided for promoting the deep integration of the global digital economy and the real economy. China has achieved significant development in the digital economy. If it can effectively address the regional heterogeneity in the innovation-driven effect, it is expected to form a comprehensive solution with the potential for replication and promotion globally. This, in turn, will serve as a reference for promoting high-quality global economic development. For example, policies can be formulated and implemented between regions to promote the digital transformation and upgrading of advantageous industries, the flow of key production factors, collaborative mechanisms for utilizing digital infrastructure, and the reduction of market access barriers. This approach will generate a series of practices for digital transformation and upgrading that are tailored to regional resource endowments and industrial foundations. It will also create pioneering cross-regional digital infrastructural empowerment mechanisms and case studies. These measures will offer a comprehensive solution for promoting the high-level integration of the digital economy and the secondary industry in regions worldwide with similar development characteristics.
5. Conclusions
This study constructs a theoretical analysis model to explore the innovation-driven effect of the digital economy on the real economy from an R&D perspective across both sectors. It introduces the “Innovation-Driven Index of the Digital Economy and Real Economy” (IDIDR) based on dynamic analyses results. Employing rigorous econometric analysis and drawing upon a rich dataset comprising over 10,000 statistical data points from various Chinese provinces from 2004 to 2021, this study quantitatively assesses the innovation-driven effect at national, regional, and inter-provincial levels. Throughout this analysis, it is evident that intellectual property protection assumes a crucial role in facilitating innovation-driven effects at all levels. Additionally, the “learning-by-doing” effect, knowledge spillover, and independent R&D exhibit variations contingent upon regional development disparities. It indicates that there is obvious regional heterogeneity in the innovation-driven effect, i.e., the innovation-driven effect is stronger in developed and pilot regions but relatively weaker in less-developed regions. Additionally, this study conducted a further analysis of the IDIDR coefficients for the four regions mentioned above and the 22 provinces in China. It was found that China’s IDIDR is at a relatively high level at the regional level. The IDIDR is as high as 1.7792 in the northern and eastern regions, indicating that these regions not only possess a strong industrial foundation but also exhibit a well-established synergy between traditional industries and the digital economy. Conversely, the western, central, and southern regions have relatively lower IDIDR values, indicating a demand to strengthen the driving effects of the digital economy on the secondary industry. At the provincial level, this study classifies China’s 22 provinces into four categories based on the calculated results: the first category comprises regions with strong innovation-driven effects (referred to as “strong driven”), with an IDIDR value of 1.25 or higher, including a total of 10 provinces. The second category includes regions with obvious innovation-driven effects (referred to as “obvious driven”), with IDIDR values ranging from 1.25 to 1.00, encompassing eight provinces. The third category involves regions with insufficient innovation-driven effects (referred to as “insufficient driven”), having IDIDR values ranging from 1.00 to 0, which includes two provinces. The fourth category pertains to regions with severely insufficient innovation-driven effects (referred to as “reverse driven”), with an IDIDR of 0, which encompasses two provinces. Therefore, the majority of China exhibit a significant innovation-driven effect of the digital economy on the secondary industry, which will continue to be a core driving force for industrial innovation and development in the future. Based on the theoretical and empirical research findings, this study also provides specific development recommendations in promoting a high-level coordinated development of the digital economy and the secondary industry in various regions, motivating digital infrastructure-intensive areas to support other regions with digitization, and actively creating a new model for the high-level integration of China’s digital economy and the secondary industry. These recommendations are poised to provide useful insights for global efforts in formulating effective strategies to foster the profound integration of the digital economy and the real economy.
Author Contributions
G.X.: Conceptualization, data curation, formal analysis, methodology, writing—original draft. J.S.: Writing—original draft, writing—review and editing, visualization. C.L.: Formal analysis, funding acquisition, project administration. X.C.: Writing—review and editing. N.Z.: Software, Writing—review and editing. All authors have read and agreed to the published version of the manuscript.
Funding
This work was supported by the National Natural Science Foundation of China grant numbers: 72261005 and the Guizhou Office of Philosophy and Social Science Planning China grant numbers 22GZQN20.
Institutional Review Board Statement
Not applicable.
Informed Consent Statement
Not applicable.
Data Availability Statement
Data will be made available on request.
Conflicts of Interest
The authors declare that they have no known competing financial interests or personal relationships that could have appeared to influence the work reported in this paper.
References
- Zhang, W.; Zhao, S.; Wan, X.Y.; Yao, Y. Study on the effect of digital economy on high-quality economic development in China. PLoS ONE 2021, 16, e0257365. [Google Scholar] [CrossRef]
- Schumpeter, J. The Theory of Economic Development; The Commercial Press: Beijing, China, 1990. [Google Scholar]
- Utterback, J.M.; Abernathy, W.J. A dynamic model of process and product innovation. Omega Int. J. Manag. Sci. 1975, 3, 639–656. [Google Scholar] [CrossRef]
- Abernathy, W.J.; Utterback, J.M. Patterns of Industrial Innovation. Technol. Rev. 1978, 80, 40–47. [Google Scholar]
- Grossman, G.M.; Helpman, E. Quality Ladders in the Theory of Growth. Rev. Econ. Stud. 1991, 58, 43–61. [Google Scholar] [CrossRef]
- Howitt, P.; Aghion, P. A Model of Growth Through Creative Destruction. Econometrica 1992, 60, 323–351. [Google Scholar]
- Lucas, R.E., Jr. On The Mechanics of Economic Development. J. Monet. Econ. 1988, 22, 3–42. [Google Scholar] [CrossRef]
- Becker, G.S. Investment in Human Capital: A Theoretical Analysis. J. Political Econ. 1962, 70, 9–49. [Google Scholar] [CrossRef]
- Ji, W.J.; He, Y.; Liu, H. China Internet economy and internet economics 20 years: 1998–2018. J. Shanxi Univ. Financ. Econ. 2020, 42, 46–60. [Google Scholar]
- Xue, Y.; Tang, C.; Wu, H.T.; Liu, J.M.; Hao, Y. The emerging driving force of energy consumption in China: Does digital economy development matter? Energy Policy 2022, 165, 112997. [Google Scholar] [CrossRef]
- Zhou, K.; Wang, H.; Wu, J.; Li, J.Q. Effect of digital economy on large-scale pig farming: An empirical study from China. Cogent Food Agric. 2023, 9, 2238985. [Google Scholar] [CrossRef]
- Anderson, C. The Long Tail: Why the Future of Business Is Selling Less of More; Hyperion Books: New York, NY, USA, 2006. [Google Scholar]
- Li, Q.X. Research on the Impact Mechanism and Application of Financial Digitization and Optimization on Small- and Medium-Sized Enterprises. Sci. Program. 2021, 2021, 9534976. [Google Scholar] [CrossRef]
- Tian, Z.X.; Li, Y.; Niu, X.G.; Liu, M.Y. The impact of digital economy on regional technological innovation capability: An analysis based on China’s provincial panel data. PLoS ONE 2023, 18, e0288065. [Google Scholar] [CrossRef] [PubMed]
- Hu, B.B.; Wang, S.G. The new production function in the Internet era. Stud. Soc. Sci. 2017, 35, 1308–1312. [Google Scholar]
- Lyu, Y.W.; Wang, W.Q.; Wu, Y.; Zhang, J.N. How does digital economy affect green total factor productivity? Evidence from China. Sci. Total Environ. 2023, 857, 159428. [Google Scholar] [CrossRef] [PubMed]
- Perez, C. Great Surges of Development and Alternative Forms of Globalization; Tallinn University of Technology: Cambridge, UK, 2007; pp. 1–32. [Google Scholar]
- Li, J.L.; Chen, L.T.; Chen, Y.; He, J.W. Digital economy, technological innovation, and green economic efficiency-Empirical evidence from 277 cities in China. Manag. Anddecision Econ. 2022, 43, 616–629. [Google Scholar] [CrossRef]
- Guo, B.N.; Wang, Y.; Zhang, H.; Liang, C.Y.; Feng, Y.; Hu, F. Impact of the digital economy on high-quality urban economic development: Evidence from Chinese cities. Econ. Model. 2023, 120, 106194. [Google Scholar] [CrossRef]
- Aldieri, L.; Brahmi, M.; Bruno, B.; Vinci, C.P. Circular Economy Business Models: The Complementarities with Sharing Economy and Eco-Innovations Investments. Sustainability 2021, 13, 12438. [Google Scholar] [CrossRef]
- Ding, Z.F. Research on the mechanism of digital economy driving high-quality economic development: A theoretical analysis framework. Mod. Econ. Res. 2020, 1, 85–92. [Google Scholar]
- Ma, D.; Zhu, Q. Innovation in emerging economies: Research on the digital economy driving high-quality green development. J Bus Res 2022, 145, 801–813. [Google Scholar] [CrossRef]
- Liang, L.; Li, Y. How does government support promote digital economy development in China? The mediating role of regional innovation ecosystem resilience. Technol. Forecast. Soc. Change 2023, 188, 122328. [Google Scholar] [CrossRef]
- Aldieri, L.; Brahmi, M.; Chen, X.; Vinci, C.P. Knowledge spillovers and technical efficiency for cleaner production: An economic analysis from agriculture innovation. J. Clean. Prod. 2021, 320, 128830. [Google Scholar] [CrossRef]
- Chou, Y.C.; Chuang, H.H.C.; Shao, B.B.M. The impacts of information technology on total factor productivity: A look at externalities and innovations. Int. J. Prod. Econ. 2014, 158, 290–299. [Google Scholar] [CrossRef]
- Junhong, B.; Keshen, J.; Jing, L. The Estimation of China’s Regional Innovation Efficiency by SFA Model. J. Manag. World 2009, 10, 51–61. [Google Scholar]
- Guan, J.C.; He, Y. Evaluation of regional innovation system based on DEA method. Stud. Sci. Sci. 2005, 2, 265–272. [Google Scholar]
- Acs, Z.J.; Anselin, L.; Varga, A. Patents and innovation counts as measures of regional production of new knowledge. Res. Policy 2002, 31, 1069–1085. [Google Scholar] [CrossRef]
- Romer, P.M. Endogenous Technological Change. J. Political Econ. 1990, 98, S71–S102. [Google Scholar] [CrossRef]
- Jones, C.I. R&D-Based Models of Economic Growth. J. Political Econ. 1995, 103, 759–784. [Google Scholar]
- Jones, C.I.; Williams, J.C. Measuring the Social Return to R&D. Q. J. Econ. 1998, 113, 1119–1135. [Google Scholar]
- Benkard, C.L. Learning and Forgetting: They Dynamics of Aircraft Production; NBER Working Paper Series; National Bureau of Economic Research: Cambridge, MA, USA, 2000; p. 7127. [Google Scholar]
- Chen, Y.Y.; Bao, Z.K. Learning-by-doing and the Market Structure of Chinese Manufacturing Industry: An Endogenous Sunk Cost Perspective. China Ind. Econ. 2012, 8, 43–55. [Google Scholar]
- Los, B. The Empirical Performance of a New Inter-industry Technology Spillover Measure. In Global Economics & Management; Edward Elgar Publishing: Cheltenham, UK, 2000; pp. 118–151. [Google Scholar]
- Yin, J.; Ping, X.Q. On the Spillovers Between Regions or Manufacturing Industries in China. Ind. Econ. Res. 2006, 1, 1–10. [Google Scholar]
- Porter, M.E.; Stern, S. Measuring the Ideas Production Function: Evidence from International Patent Output; NBER Working Paper Series; National Bureau of Economic Research: Cambridge, MA, USA, 2000; p. 7891. [Google Scholar]
- Alikhan, S. Socio-Economic Benefits of Intellectual Property Protection in Developing Countries; World Intellectual Property Organization: Geneva, Switzerland, 2006. [Google Scholar]
- Ginarte, J.C.; Park, W.G. Determinants of patent rights: A cross-national study. Res. Policy 1997, 26, 283–301. [Google Scholar] [CrossRef]
- Han, Y.X.; Li, H.Z. Quantitative Evaluation for the Level of Intellectual Property Protection in China. Stud. Soc. Sci. 2005, 23, 377–382. [Google Scholar]
- China Statistical Yearbook (1999–2020). Available online: http://www.stats.gov.cn/tjsj/ndsj/ (accessed on 26 September 2023).
- Annual Report of China Software & Information Technology Service Industry (2018–2019). Available online: https://www.miit.gov.cn/jgsj/xxjsfzs/xyyx/art/2020/art_7431516acb7944b38db842281c7eebba.html (accessed on 26 September 2023).
- China Statistical Yearbook on Science and Technology (2005–2019). Available online: https://www.sts.org.cn/Page/Main/Index?pid=62&tid=62 (accessed on 26 September 2023).
- The Chinese Input-Output Association: Input-Output Table (2002–2017). Available online: http://www.stats.gov.cn/ztjc/tjzdgg/trccxh/zlxz/trccb/201701/t20170113_1453448.html (accessed on 26 September 2023).
- Levin, A.; Lin, C.F.; Chu, C.S.J. Unit root tests in panel data: Asymptotic and finite-sample properties. J. Econom. 2002, 108, 1–24. [Google Scholar] [CrossRef]
- Maddala, G.S.; Wu, S. A Comparative Study of Unit Root Tests with Panel Data and a New Simple Test. Oxf. Bull. Econ. Stat. 1999, 61, 631–652. [Google Scholar] [CrossRef]
- Pedroni, P. Critical Values for Cointegration Tests in Heterogeneous Panels with Multiple Regressors. Oxf. Bull. Econ. Stat. 1999, 61, 653–670. [Google Scholar] [CrossRef]
- Kao, C. Spurious regression and residual-based tests for cointegration in panel data. J. Econom. 1999, 90, 1–44. [Google Scholar] [CrossRef]
- Johansen, S. Identifying restrictions of linear equations with applications to simultaneous equations and cointegration. J. Econom. 1995, 69, 111–132. [Google Scholar] [CrossRef]
- Olshen, R.A. The Conditional Level of the F-Test. J. Am. Stat. Assoc. 1973, 68, 692. [Google Scholar]
- Hausman, J.A. Specification Tests in Econometrics. Econom. Explor. Diagn. 1997, 46, 173–193. [Google Scholar] [CrossRef]
- Altonji, J.G.; Matzkin, R.L. Cross section and panel data estimators for nonseparable models with endogenous regressors. Econometrica 2005, 73, 1053–1102. [Google Scholar] [CrossRef]
- Zellner, A. Estimators for Seemingly Unrelated Regression Equations: Some Exact Finite Sample Results. J. Am. Stat. Assoc. 1963, 58, 977–992. [Google Scholar] [CrossRef]
Disclaimer/Publisher’s Note: The statements, opinions and data contained in all publications are solely those of the individual author(s) and contributor(s) and not of MDPI and/or the editor(s). MDPI and/or the editor(s) disclaim responsibility for any injury to people or property resulting from any ideas, methods, instructions or products referred to in the content. |
© 2023 by the authors. Licensee MDPI, Basel, Switzerland. This article is an open access article distributed under the terms and conditions of the Creative Commons Attribution (CC BY) license (https://creativecommons.org/licenses/by/4.0/).