1. Introduction
Currently, with the intensification of urbanization processes, the evolution of urban mobility and the possibilities for its development are a focus of the transport profession [
1]. In recent decades, private transport has played an increasingly important role in passenger transport in the member states of the European Union (EU). In contrast, the use of public transport has gradually decreased, a phenomenon which has also been observed in Hungary [
2]. Increasing road congestion means it takes longer to reach our destinations [
3]. These processes are becoming an increasing problem for the livability of cities, with more and more vehicles on the roads. Due to the pandemic, the number of people using public transport has fallen, for example, passenger numbers have decreased by half in Germany and by over 50% in Japan and China compared to 2019 passenger numbers.
In a “volatile”, “uncertain”, “complex”, and “ambiguous” (VUCA) world, change is rapid, constant, and unpredictable. A multitude of external environmental impacts are affecting various sectors, and these impacts need to be adapted to as quickly as possible to ensure sustainable operation. Several factors have influenced the decline in the number of passengers using public transport. In addition to a dynamic increase in the number of cars, the development of cycling, scooter transport, and ridesharing systems may also reduce the number of people using public transport [
4].
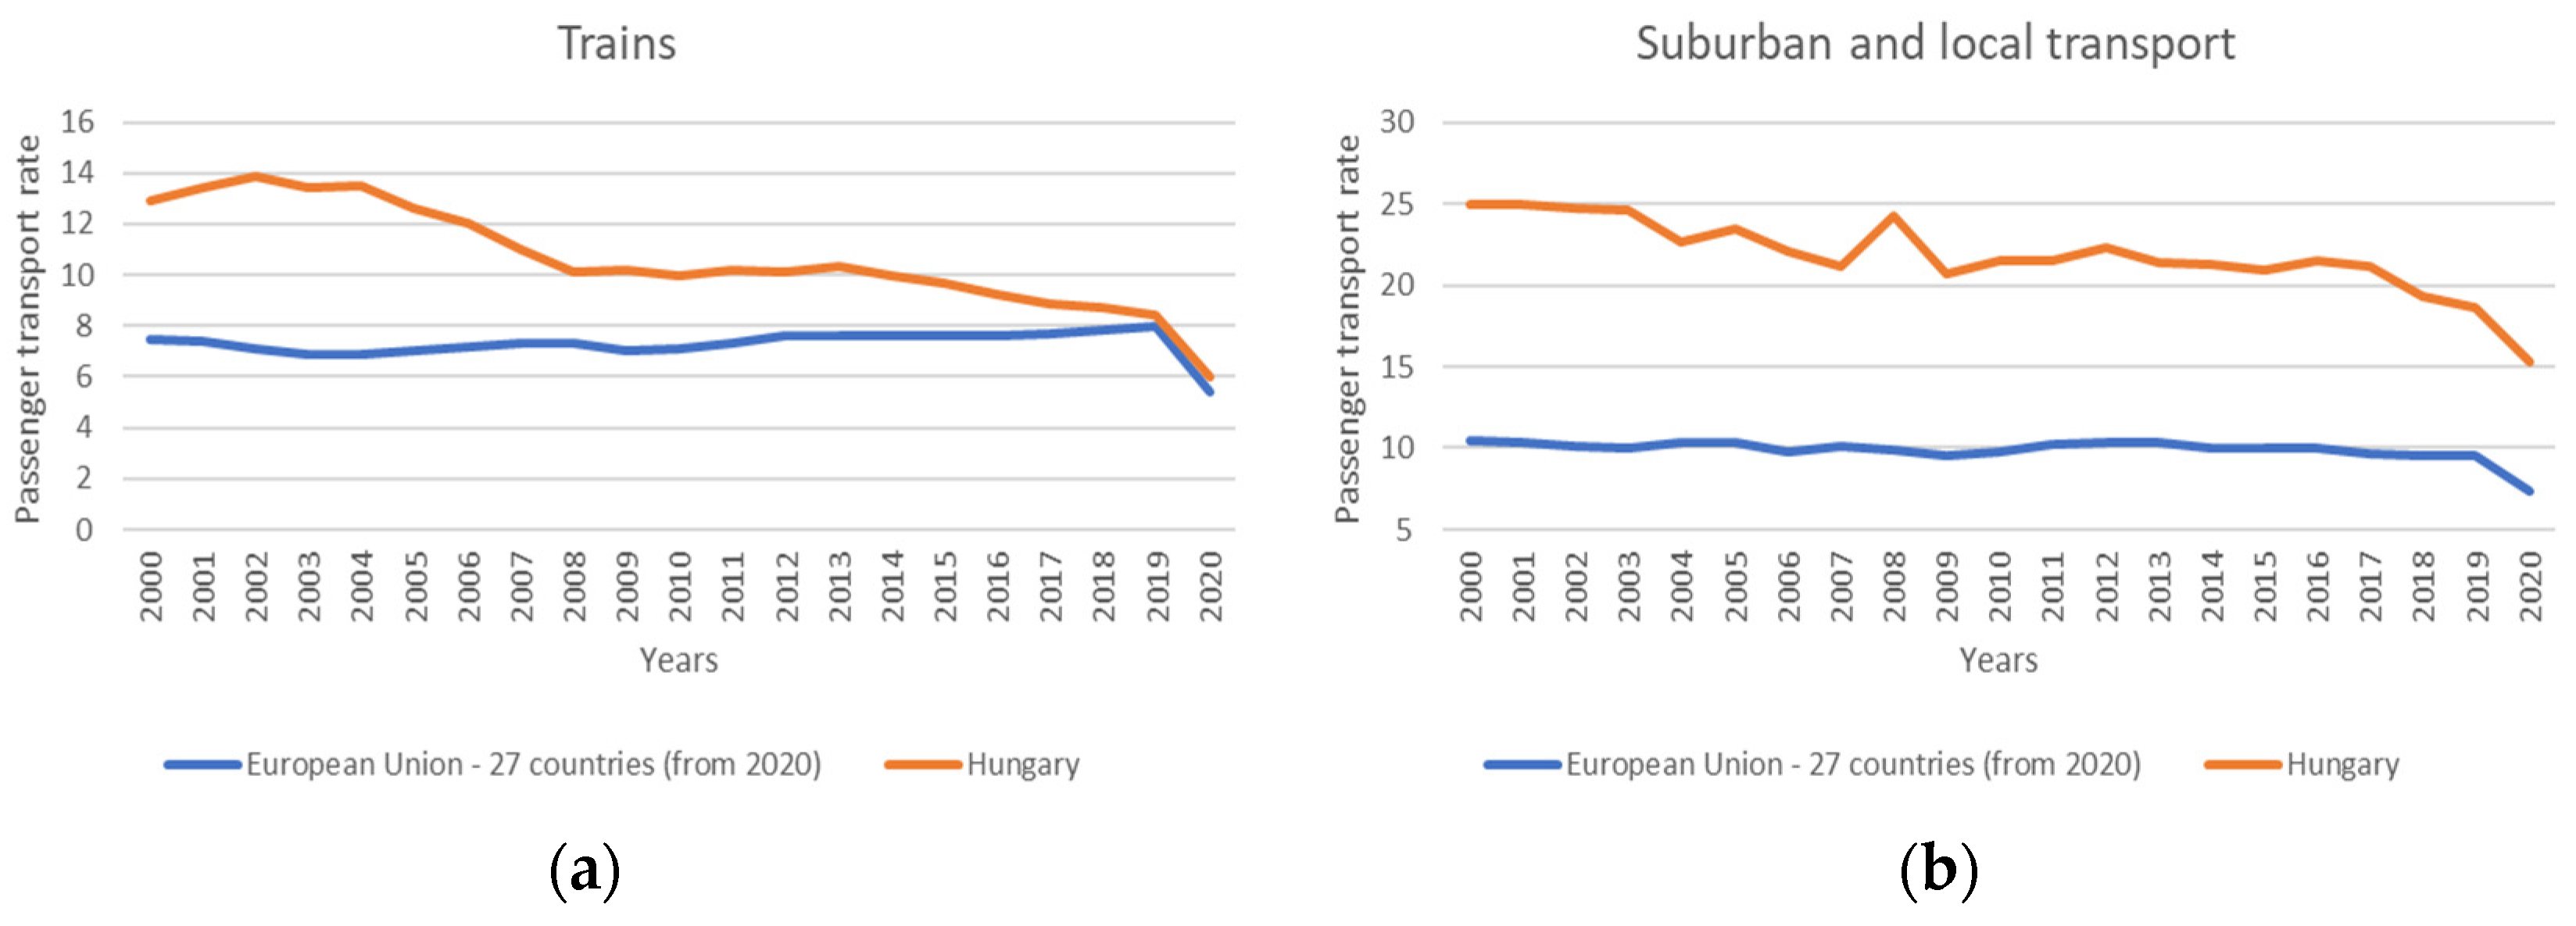
An analysis of the proportion of individual and public transport users in the EU member states has shown that, from the turn of the millennium until the beginning of the pandemic, the proportion of people using public transport for passenger transport was around 17–18%. The share of rail (
Figure 1a) and suburban/local transport (
Figure 1b) users remained relatively stagnant during these years. Although these figures still show a more favorable picture for Hungary than the EU average, they show a significant downward trend over this period. The overall 38% in the early 2000s had fallen below Hungary’s 27% modal split by the year before the pandemic.
In recent years, in addition to the underlying decline in passenger numbers, the effects of the COVID-19 pandemic and the measures taken during this period have also reduced the number of people using public transport. According to the Continental’s Mobility Study 2020, the COVID-19 pandemic has increased the importance of private or individual transport [
5,
6]. On 11 March 2020, the World Health Organization (WHO) declared that the new coronavirus outbreak was a global pandemic [
7]. On the same day, the Hungarian government declared a state of emergency and a state of public health emergency for the whole country [
8]. The decree was followed by a series of restrictive measures, all with one thing in common, i.e., limiting personal contacts to prevent the spread of the epidemic. These provisions had severe economic and social implications, including effects on mobility in all its forms. Today, the proportion of people using a social networking form of transport has fallen further due to the viral situation, for example, to 13% in the EU and 21% in Hungary. It can be argued that this is due to changes in travel habits during the pandemic period (people’s fear of the virus spreading faster in confined spaces) and the effects of the measures taken in the context of the epidemic situation, which have had a substantial impact on public transport in the city of Debrecen. Seat occupancy rate and fare revenues have decreased significantly. During the first shorter period of the first wave of the virus, the public service operator realized about 30% of its regular revenues. Transport experts had already predicted a slower “bounce-back” at the beginning of the virus’s spread, expecting the population to return to public transport after up to five years, with ridership returning to the levels seen in previous years. The two years since then confirm these predictions, with a slow recovery in both ridership and revenue.
Many studies have examined the impact of the pandemic on the service sector since its spread in 2020 [
9,
10,
11,
12,
13,
14,
15,
16,
17]. Nevertheless, only 44 studies in the Web of Science (WoS) database collection have examined the effects of COVID-19 restrictions on public transport. Research by Meena and Sharma [
18] and Tóth et al. [
19] has shown that, since the pandemic, consumers have preferred to travel individually rather than by public transport. A study by Fumagalli et al. [
20] in Curitiba, Brazil, showed an 80% drop in public transport in March 2020, with pre-pandemic daily passenger numbers of 1.36 million falling to 200,000. In line with our present research, they also showed that this was partly due to the spread of the virus, but they also highlighted that another cause was the strict measures taken, such as cancelling flights. However, they did not investigate the role of case numbers and measures taken in this decline. They found that 90% of passengers use the same route every day, given that a large proportion of the travelling public are commuters and students, and suggested that their travel habits should be studied to design methods of travel and services that are convenient for them.
Proper scaling and scheduling to connect people’s daily activities could bring more comfort and safety during the COVID-19 pandemic and give users more time by synchronizing their routines. Luo et al. [
21] also came to this conclusion when studying public transport in New York. Based on the COVID-19 pandemic, they stated that a well-planned subway system in New York City could sustain 88% of the transit flow while reducing the risk of disease transmission by 50% relative to fully loaded public transit systems. Wang et al. [
22] analyzed the effects of government measures by comparing data on morbidity and mortality from 121 countries. They highlighted misguided measures and their consequences, focusing on public transport. They concluded that without public transportation closures, cases and deaths would have been reduced by 40% and 10%, respectively. In Japan, Murano et al. [
23] examined the impact of government measures in the context of public transport, but they looked at the effect on the spread of the virus, not the economics, as this study does. However, many of their conclusions align with the present study’s findings. Their analysis highlighted that, instead of strict lockdowns that might seriously damage the economy, milder travel restrictions could have a similar impact on controlling the domestic transmission of COVID-19 without devastating economic damage. Tirachini and Cats [
24] stated if public transportation is perceived as unsafe and unhealthy by large segments of the population, it will not be able to fulfill the societal roles that it is set to serve, including accessibility, sustainability, and equity. Our societies need public transportation services to prosper and to address key societal challenges that are paramount and persistent. It is, therefore, critical to avoid contributing to stereotyping the use of public transportation as unhealthy, a phenomenon which may outlive the pandemic itself and hinder the long-term prospects of public transportation services.
The results of the above studies, while different in approach, confirm that over-restrictive measures and closures impose more burdens on the economy than they bring benefits. In the present study, we examine this at the firm level, from the perspective of a public transport operator, by looking at the effects of COVID-19 measures.
This study examines the impact of the different factors during the COVID-19 epidemic and the measures taken to evolve the number of paying passengers in the city of Debrecen. The following working hypotheses have been formulated:
H1. Sales of travel tickets were reduced by the evolution of active caseloads.
H2. Sales of general passes were reduced by the evolution of active caseloads.
H3. Sales of discounted passes were reduced by the evolution of active caseloads.
H4. Sales of supplement passes were reduced by the evolution of active caseloads.
The distinctiveness of the present research is manifested in the fact that we examined the impact of the pandemic on paying passenger numbers from the perspective of the service provider, which, to the best of our knowledge, is perhaps not unique, but certainly provides a particular perspective on the effects of the pandemic.
2. Materials and Methods
2.1. Databases Used
The sales records of the DKV for the period between 1 January 2020 and 31 December 2021 were provided by the company’s sales department. The sales data were provided monthly, but in the case of the means of transport entitlement, we aggregated the data and created four main groups, as follows:
Travel tickets which included single advance tickets, single mobile tickets, a single ticket from the driver, a block of 11 tickets, small group tickets, one-hour mobile tickets, one-, three- and seven-day tickets, tickets for student groups, and three-day family tickets.
General passes which included half-monthly, monthly, yearly, and transferable passes sold at a group rate.
Discounted passes which included student monthly combined passes, pensioner monthly combined passes, and passenger with young children passes.
Supplement passes which included the general monthly pass supplements and the student monthly pass supplements.
The groups representing each travel entitlement are based on the DKV recommendation.
The evolution of passenger numbers in the city of Debrecen has shown changes in the modal split at the European and national transport levels [
19]. In the years preceding the pandemic, passenger numbers showed a slight increase due to the stability and improvements in service quality.
Nearly 100 million trips are made in the city each year. Commuters mainly use the services on their daily commute to work and school. In Debrecen, tourism has become increasingly important in recent years, so the number of ad hoc trips is also significant. These passengers mainly buy one-way travel tickets or day tickets. Thanks to its geographical location and role as an economic, educational, and health center, the city is a prime destination for daily commuters from the agglomeration and the surrounding cities. In addition to the travel tickets, these residents can buy supplement passes to accompany general passes.
Data related to the COVID-19 epidemic are from the Worldometers.info database [
25]. Worldmeters is a small, independent, U.S.-based digital media company, and the operating team is made up of developers, cadres, and volunteers. Worldmeters data on the outbreak are obtained from official government reports or indirectly from local media sources deemed reliable by the publisher. For our calculations of the outbreak data, we used the active cases as a rate indicator, which is calculated using the formula below:
The active cases figure represents the current number of people detected and confirmed to be infected with the virus. Data published on the Worldmeters.info website are in a daily format. Sometimes, we had to combine daily data and produced monthly statistics.
2.2. Correlation Analysis and Stochastic Time Series ARMA Model
Pearson’s correlation coefficient [
26] was used to test the correlations between the different means of providing transport entitlements.
The correlation between active caseloads and travel entitlements was performed using a stochastic time series analysis. We chose this method because we had a relatively short time series with only 24 months of data. In addition, we believe that random effects and stresses on the process are built into the phenomenon and have a process-building role in the longer term. Time series that consider the role of chance and stochastic time series started to become known in the 1970s. During this period, Box and Jenkins popularized the use of autoregressive integrated moving average (ARIMA) models [
27,
28].
First, we examined the stationarity of the data series. For this, we used an augmented Dickey–Fuller (ADF) test. The null hypothesis of this test is that the time series has a unit root, i.e., it is not stationary. Based on the ADF test, we obtained substantial results for all travel entitlements; the null hypothesis was rejected, i.e., the processes are stationary. A stationary time series does not contain trend effects, and the time series values fluctuate around a constant mean value with a constant standard deviation. A stationary time series is also characterized by the temporal constancy of the autocorrelation coefficients of the time series, representing the internal relationships between the data of the time series. The values of the autocorrelation coefficients depend on the distance between variables, on lags, but not on time. The autocorrelation coefficients as a function of the lag are given by the autocorrelation function, also known as the correlogram.
In the theory and practice of time series analysis, autoregressive and moving average (ARMA) processes have gained significant importance since the 1970s because ARMA processes are mathematically tractable, and many of the random processes that occur in practice and follow stationary behavior can be well approximated and described by them [
29]. Stationary processes can be well-modeled with ARMA models. Such processes can be economical, biological, industrial, chemical and others. Thus, indeed, there are wide-ranging applications of ARMA processes.
In this model, the number of active cases can be included as a regressor. Its coefficient shows how COVID-19 affects the evolution of different travel entitlements. The autoregressive (AR) indicator means that the history of the process can be described as a linear regression. Furthermore, the moving average (MA) indicator expresses that the “error term” of the linear regression is the moving average of the white noise εt, i.e., the linear combination of the present and the finite past.
The formula for the first order ARMA(1,1) model with regressor (R) is as follows:
where
yt is the amount of travel entitlement for the
t time,
C is the intercept,
φ1 is the coefficient of the autoregressive term,
yt−1 is the amount of travel entitlement for the
t − 1 time,
β1 is the coefficient of active caseloads,
Rt is the active caseloads at
t time,
εt is the error at the
t time,
θ1 is the moving average coefficient, and
εt−1 is the error term of
t − 1 time.
3. Results
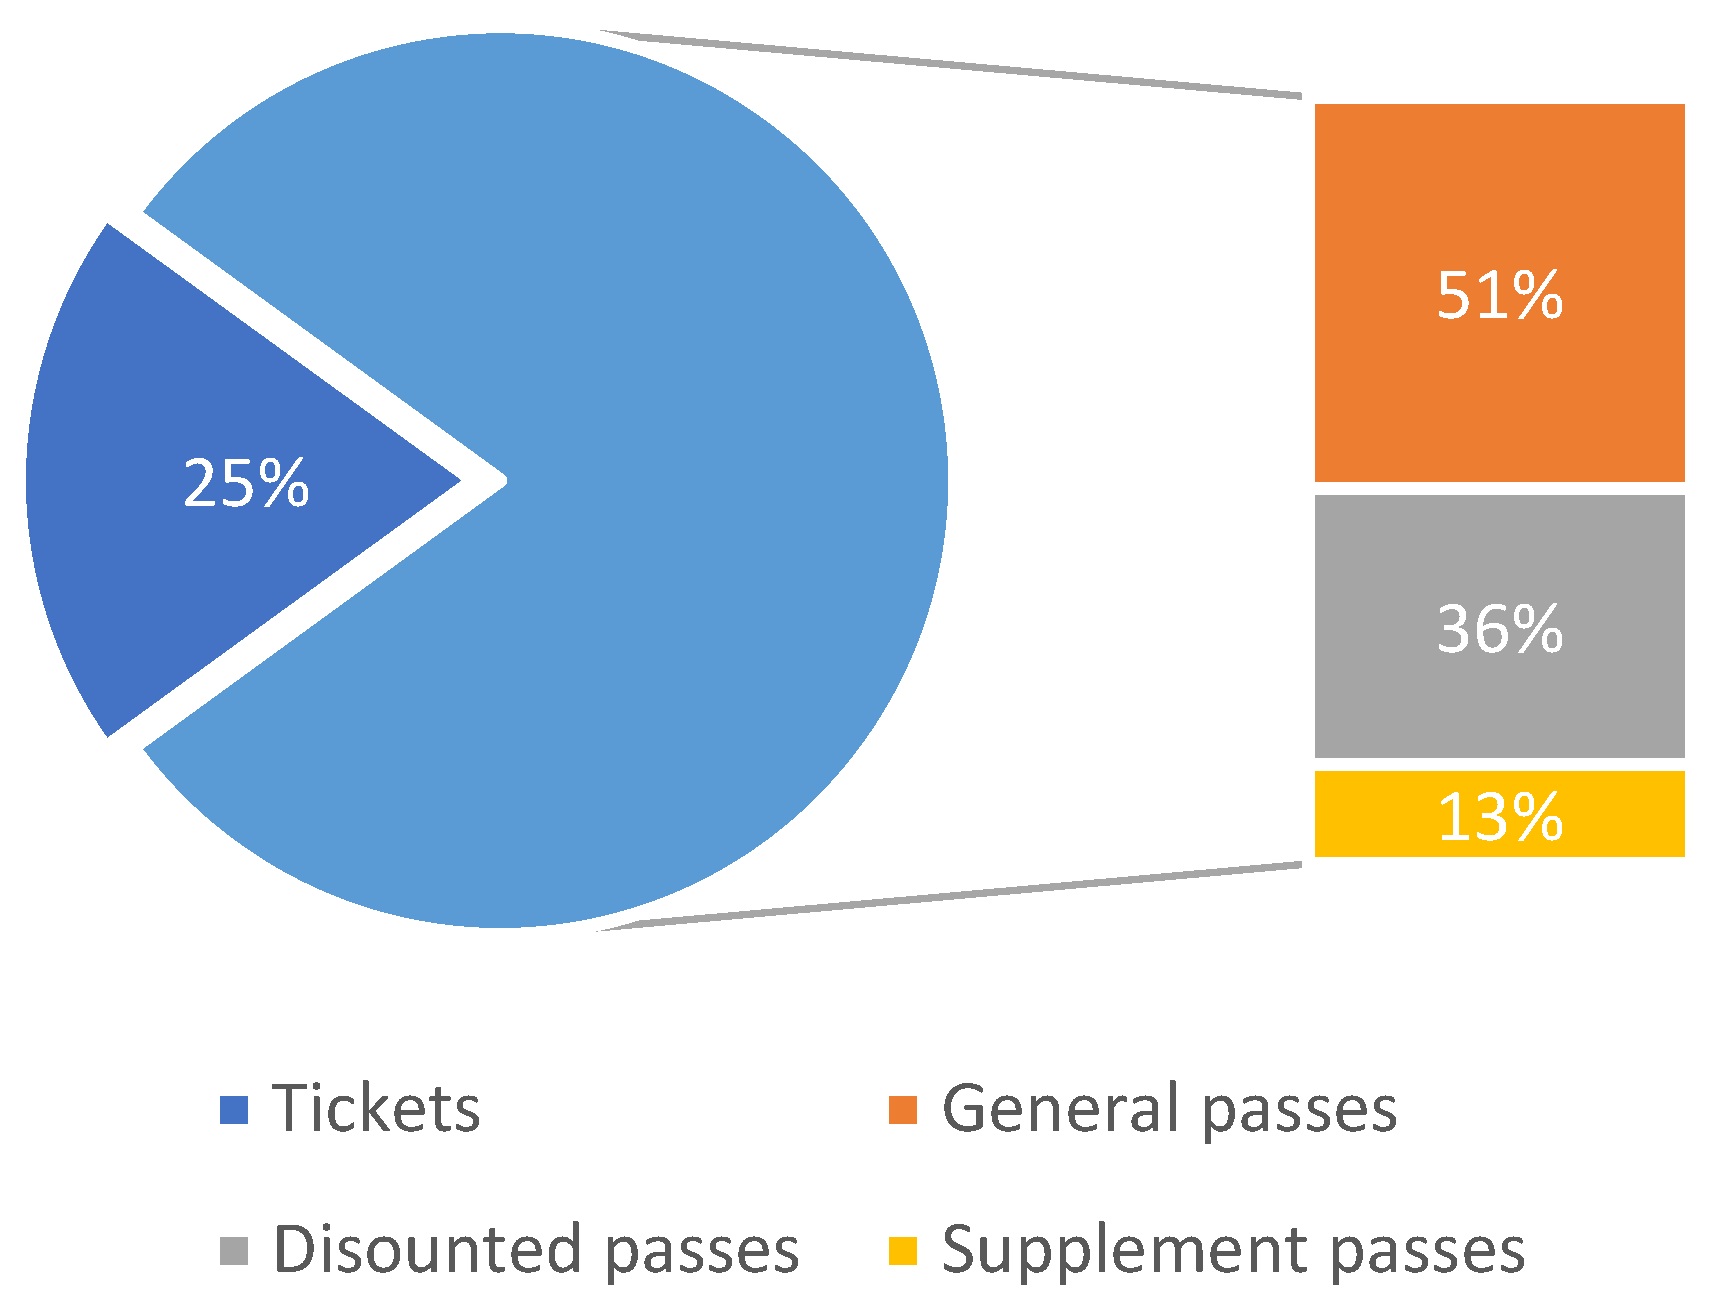
The city’s sales figures show that around 25% of fare revenue comes from travel tickets and 75% from passes. Within passes, combined general passes represent about 51%, discounted passes 36%, and supplement passes 13% (
Figure 2). The most significant number of passengers buying passes comprises workers and students, representing over 90% of the total passes.
In addition to fare revenue, a significant proportion of revenue is represented by social policy fare subsidies, which are the supplementary fares for discounted passes and the subsidy for free travel.
Data from travel ticket and pass sales cannot always be linked to the actual use of the service. While the actual use time can be effectively determined for general passes and travel tickets, this cannot be reported for pre-purchased tickets. Tickets are sold through external partners in addition to service ticket offices, ticket vending machines, and onboard points. These partners tend to stock larger quantities of tickets at a time, which may distort the time series derived from the sales data and the time series characterizing the use of fare products. Typically, they occur at the beginning and end of the year, but also continuously.
Travel tickets are used in local public transport for ad hoc journeys, including tourists arriving in the city, but the less frequent traveler population also buys these fare products. A segment of the population also mainly uses these services in combination with private transport, for example, people who use these means of transport to access the city center less frequently, to do business or for entertainment. Many car users also park their cars in external nonpaying zones and use public transport to reach their destination due to the high parking tariffs in the city center. A slight increase in the consumption of travel tickets is most noticeable in the summer months, which is to a lesser extent linked to school holidays when students no longer travel daily.
However, more frequent, daily travelers will buy longer distance, unlimited-use fare products, e.g., (monthly/yearly) passes, after considering whether the network and the associated timetable service is an appropriate transport alternative to reach their destination. Seasonality can also be observed for these passes, for example, a significant part of annual holidays is spent in the summer and winter months, so fractional months are solved by using a travel ticket for a shorter period or ad hoc travel or even by other means of transport. Discounted passes also show a diverging trend during school and non-school periods, primarily reflecting the travel habits of students. The long-term trend in selling discounted passes for pensioners is affected by the constantly decreasing number of people entitled to purchase these passes, as the number of retirees under 65 is decreasing yearly.
In Hungary, and within it, in Debrecen, public transport has been significantly affected by the government and municipal measures during the emergency. The measures taken in the context of the emergency declared in March 2020 markedly impacted passenger numbers and, thus, the revenue from passengers and the costs incurred to facilitate the protective measures. The measures that have had the most significant impacts on public transport ridership are presented in
Table 1.
The changes in travel patterns brought about by the virus, the measures taken, and the emergence of atypical employment and distance learning have significantly impacted travel demand and the development of paying passenger numbers. The public service operator in the city of Debrecen has also suffered a substantial drop in demand for travel and, thus, a large loss of revenue. In the first months of the pandemic, with the launch of distance learning, sales of student passes fell to 6% of their pre-pandemic level, but sales of general passes also fell to 40% of the pre-pandemic level. Ad hoc travel also dropped sharply, with ticket volumes below 13% in the first month of the pandemic.
Several waves of the COVID-19 epidemic can be distinguished in Hungary, with the various periods being shown in
Table 2. The identification of each wave is based on the current active case numbers.
During the pandemic wave and to adapt to the measures, several timetable changes had to be made while the service remained in operation. Driver ticket sales were suspended, and contactless purchase options were introduced, which also required service improvements in the city. During the second wave, increasing the proportion of articulated vehicles with a higher capacity was necessary to ensure adequate passenger spacing. The continuous daily disinfection of vehicles and public spaces also increased operator costs.
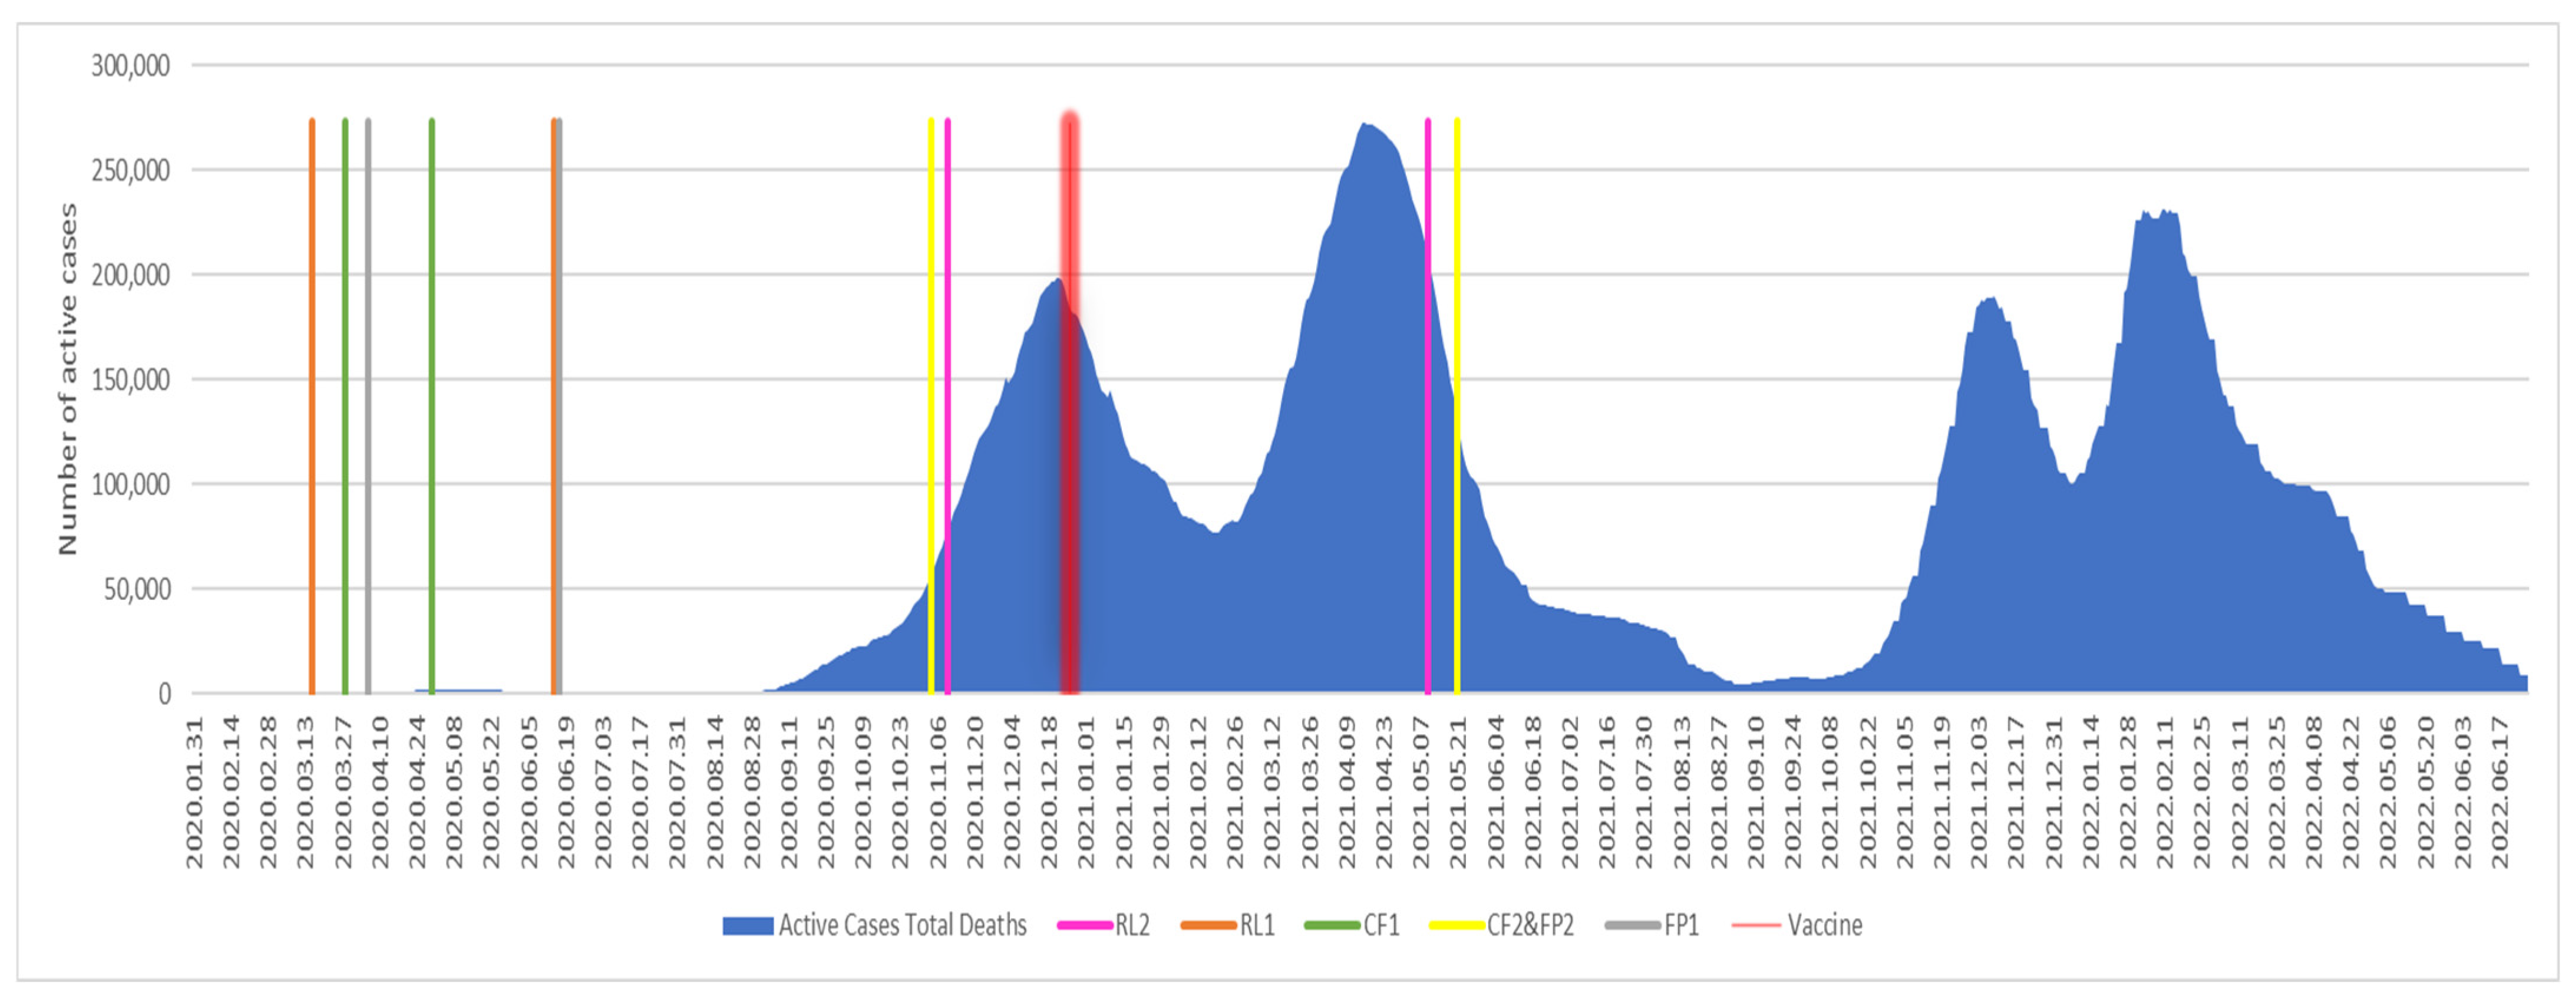
Combining the evolution of the active case numbers and the restrictive measures the government took, we obtained the following illustrative graph (
Figure 3). The first wave of the epidemic is barely noticeable on the graph, but each subsequent wave is much more pronounced. It is also clear that the measures more specific to public transport, such as distance learning, curfew, and parking fees, were introduced almost simultaneously. These measures were repealed before the first wave (17 July 2020), even though the active caseload was no less than when the measures were introduced (
Table 1). The second and third waves are not distinctly different, with curfews, free parking, and distance learning being reintroduced during their duration.
It should be noted that distance learning did not affect all students, only those in secondary and higher education [
39]. The above measures expired in May 2021, well before the end of the third wave (2 September 2021). The fourth and fifth waves were not sharply different, but during this period, the only daily restrictions that public transport users faced were wearing masks.
However, we highlighted a crucial moment in (
Figure 3) 6 December 2020, marking the start of vaccination against COVID-19 uniformly in EU countries. Our graph shows that the start of vaccination in Hungary coincides with the peak of the second wave.
3.1. Correlation Matrix
The correlation analysis aims to determine the extent to which entitlements for each mode of transport change simultaneously. The correlation coefficients are significant in all cases, with positive medium and high relationships between variables. We find higher correlation coefficients between the long-distance and unlimited-use fare products, with a strong relationship (0.795) for the general and discounted passes. A solid dependent relationship is observed for general passes, supplement passes, discounted passes, and supplement passes, with correlation coefficients above 0.9. The correlation coefficient between ticket-type vouchers and any fare product providing unlimited use over a more extended period shows a medium strength, typically between 0.48 and 0.57 (
Table 3). The results of the correlation study in the transport professional context show that no strong relationship exists between the evolution of sales volumes of ad hoc travel tickets and frequent travel passes. The analysis was made for the period between 01 January 2020 and 31 December 2021.
The relationship between general and discounted passes is not correlated as strongly as some of the other categories, primarily because students did not purchase travel entitlements during the period under study because of the multiple distance learning restrictions, while the restrictions for the working population were lower, resulting in less change in their travel habits and options. The dependency between supplement and general passes is because many supplement pass users are commuters from rural areas. Students who bought supplement passes during this period could travel to the county center to access health and other services, despite the introduction of distance learning.
3.2. ARMA Model
We used an ARMA model to investigate how the evolution of different travel entitlements was influenced by the rate/shape of active case numbers during the epidemic. To conduct the study, we examined each travel entitlement separately.
3.2.1. Analysis of the Correlation between Travel Ticket Sales and Active Cases
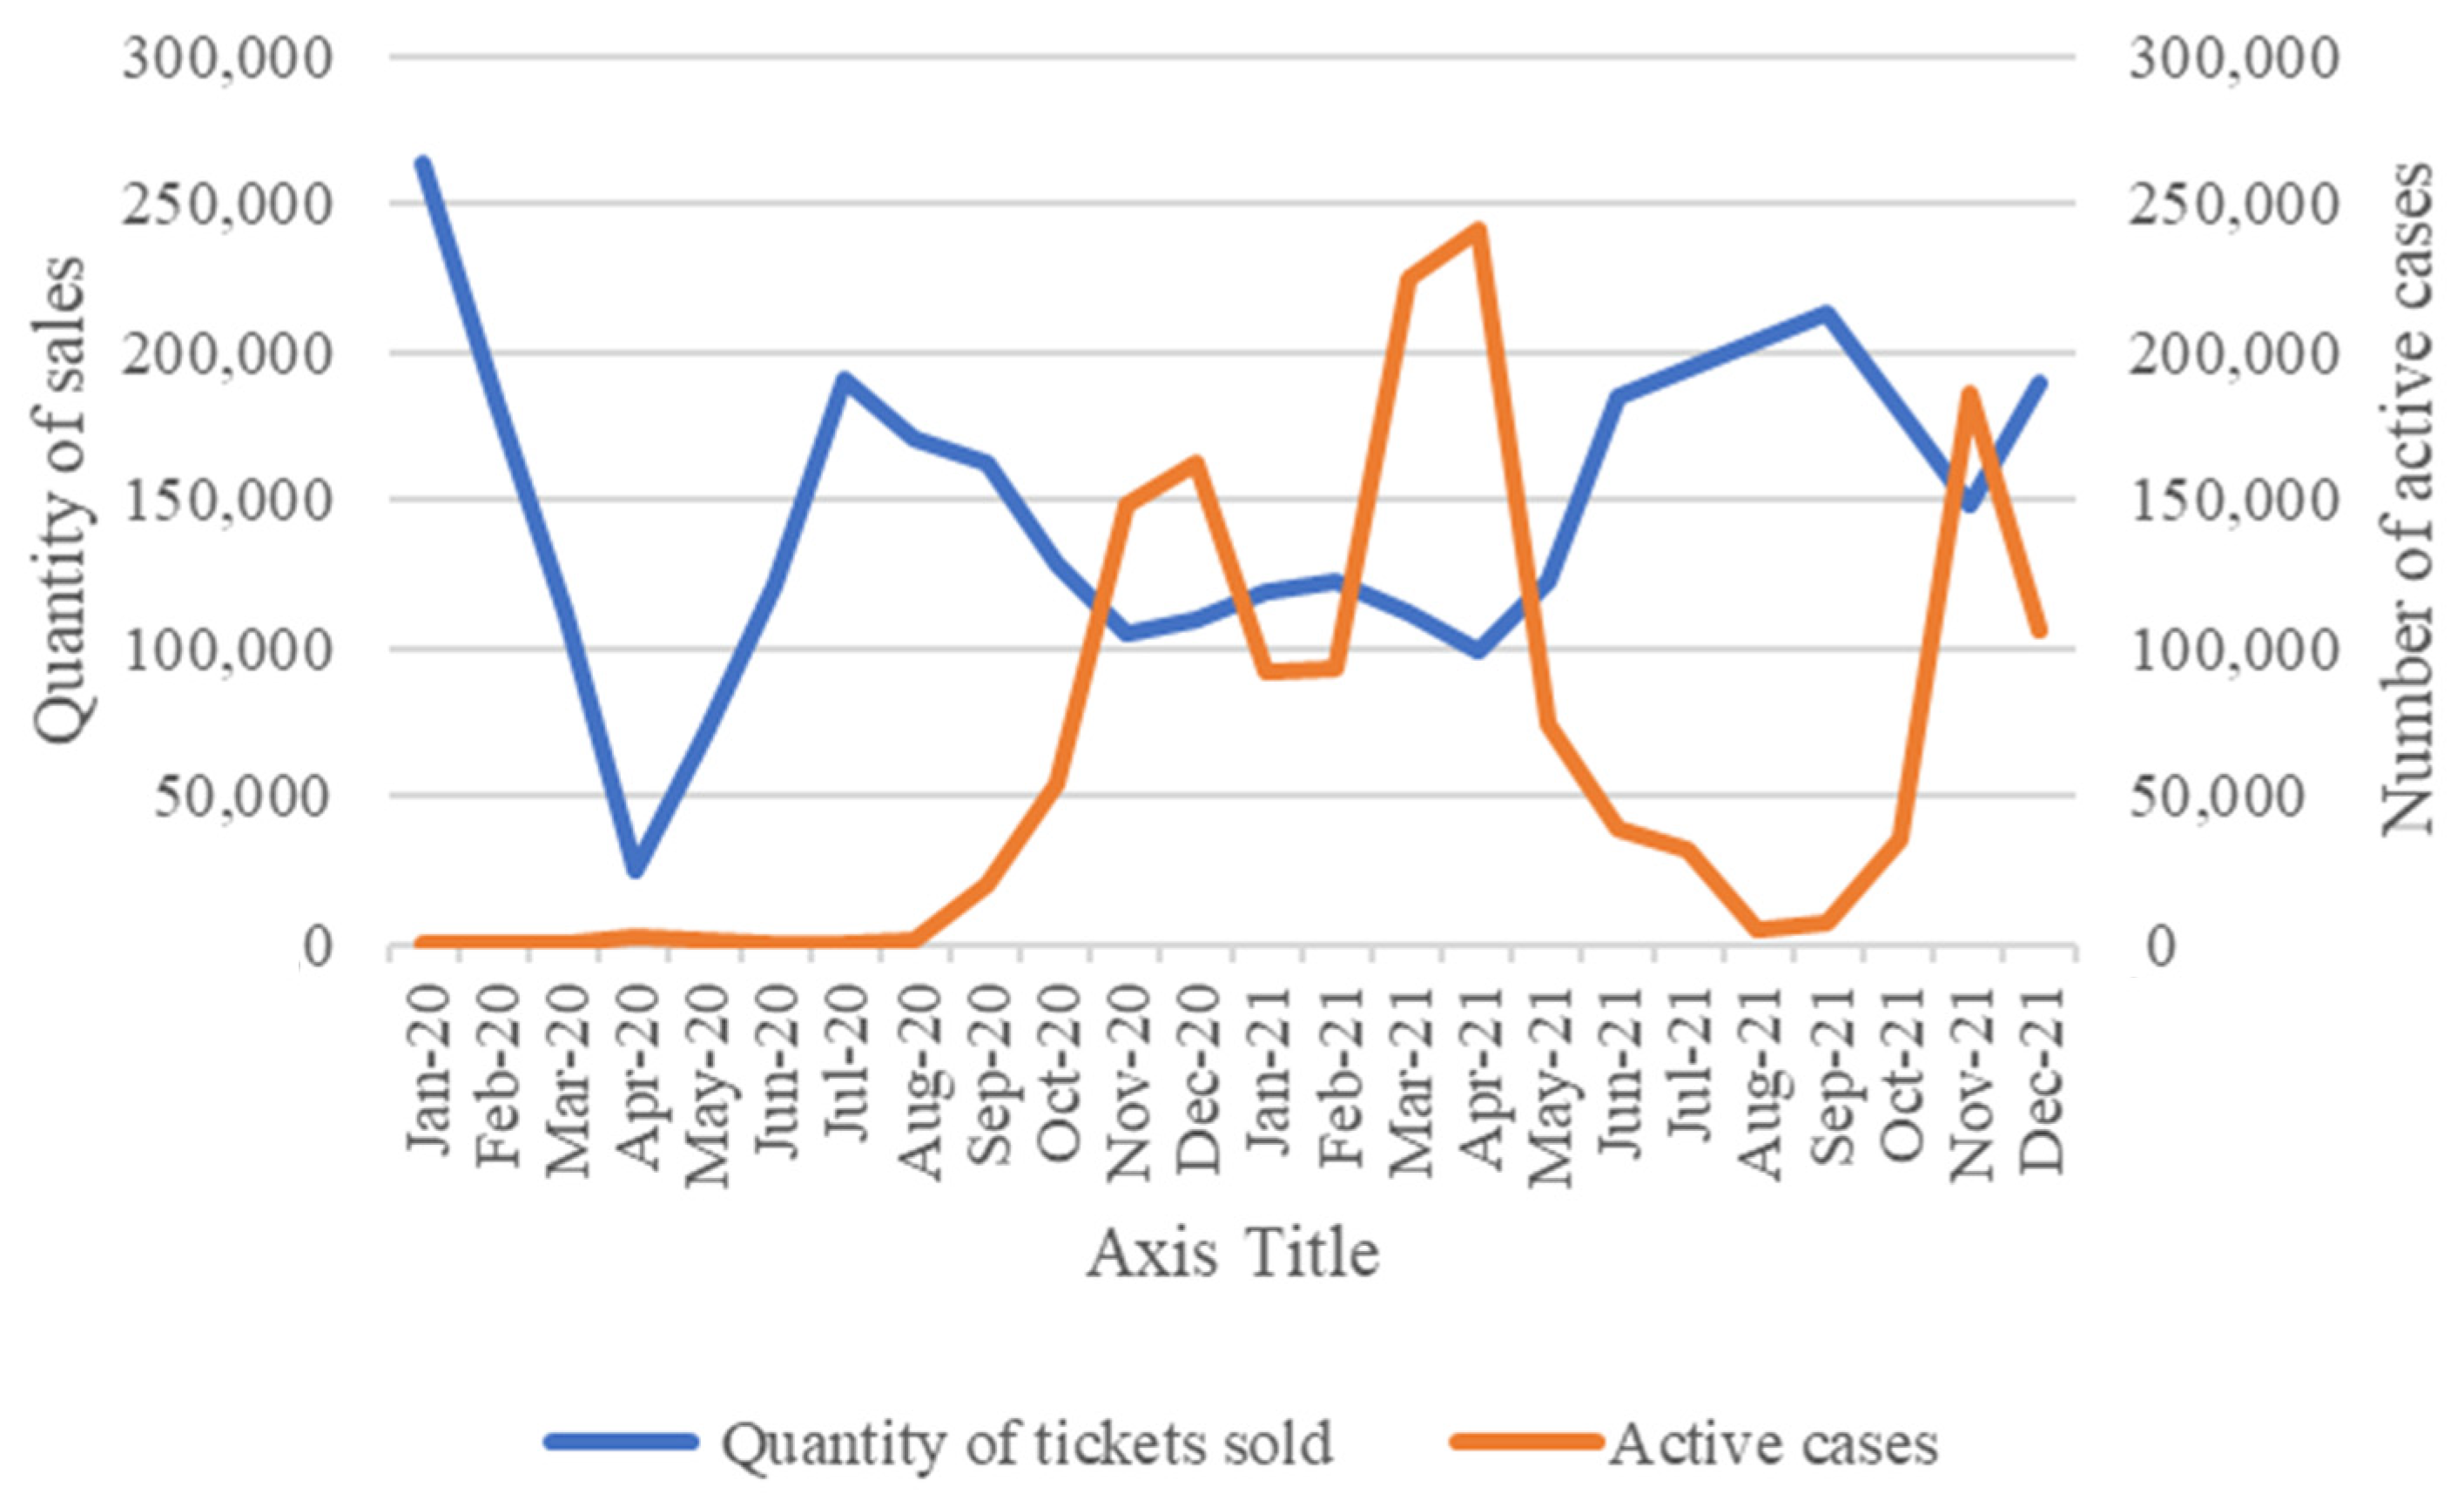
There was a sharp drop in ad hoc travel of almost 90% in the first period of the pandemic. In
Figure 4, we have graphically depicted the evolution of ticket types and active case numbers by month for 2020 to 2021. The graph shows the duration of each COVID-19 wave and the trends in ticket sales over this period. However, it is not suitable to establish a clear correlation between the trend in active caseloads and a decrease in ticket sales, or whether ticket sales were affected by other external influences. In our case, by external influence, we mean the government measures listed in
Table 1.
Applying the first order ARMA(1,1) model to the time series of travel ticket sales and active case numbers, the parameters given in (
Table 4) are obtained.
The most important value is that of the coefficient β1. As shown in
Table 4, the coefficient is negative (β1 = −0.199), indicating an opposite shift in travel ticket sales and active caseload evolution. However, the coefficient is not significant, as Pr is greater than 5%, so the working hypothesis H
1 could not be confirmed. In conclusion, active case numbers did not affect travel ticket sales during the COVID-19 outbreak.
There was a substantial drop in travel ticket sales in the first months of the first wave of the pandemic, which is certainly related to the fact that several government measures during this period resulted in a substantial reduction in the use of community facilities. People feared a greater risk of infection in the confined spaces of public vehicles and preferred to use private transport. With the gradual lifting of restrictions, a more sizable increase in travel ticket volumes was observed after the peak in the first, second, third and fourth waves, which occurred close together in time. The ending of the pandemic has led to a change in travel habits, with a return to greater use of public transport, albeit on an ad hoc basis. With the lifting of restrictions, domestic tourism has also resumed, bringing occasional visitors and passengers to the city.
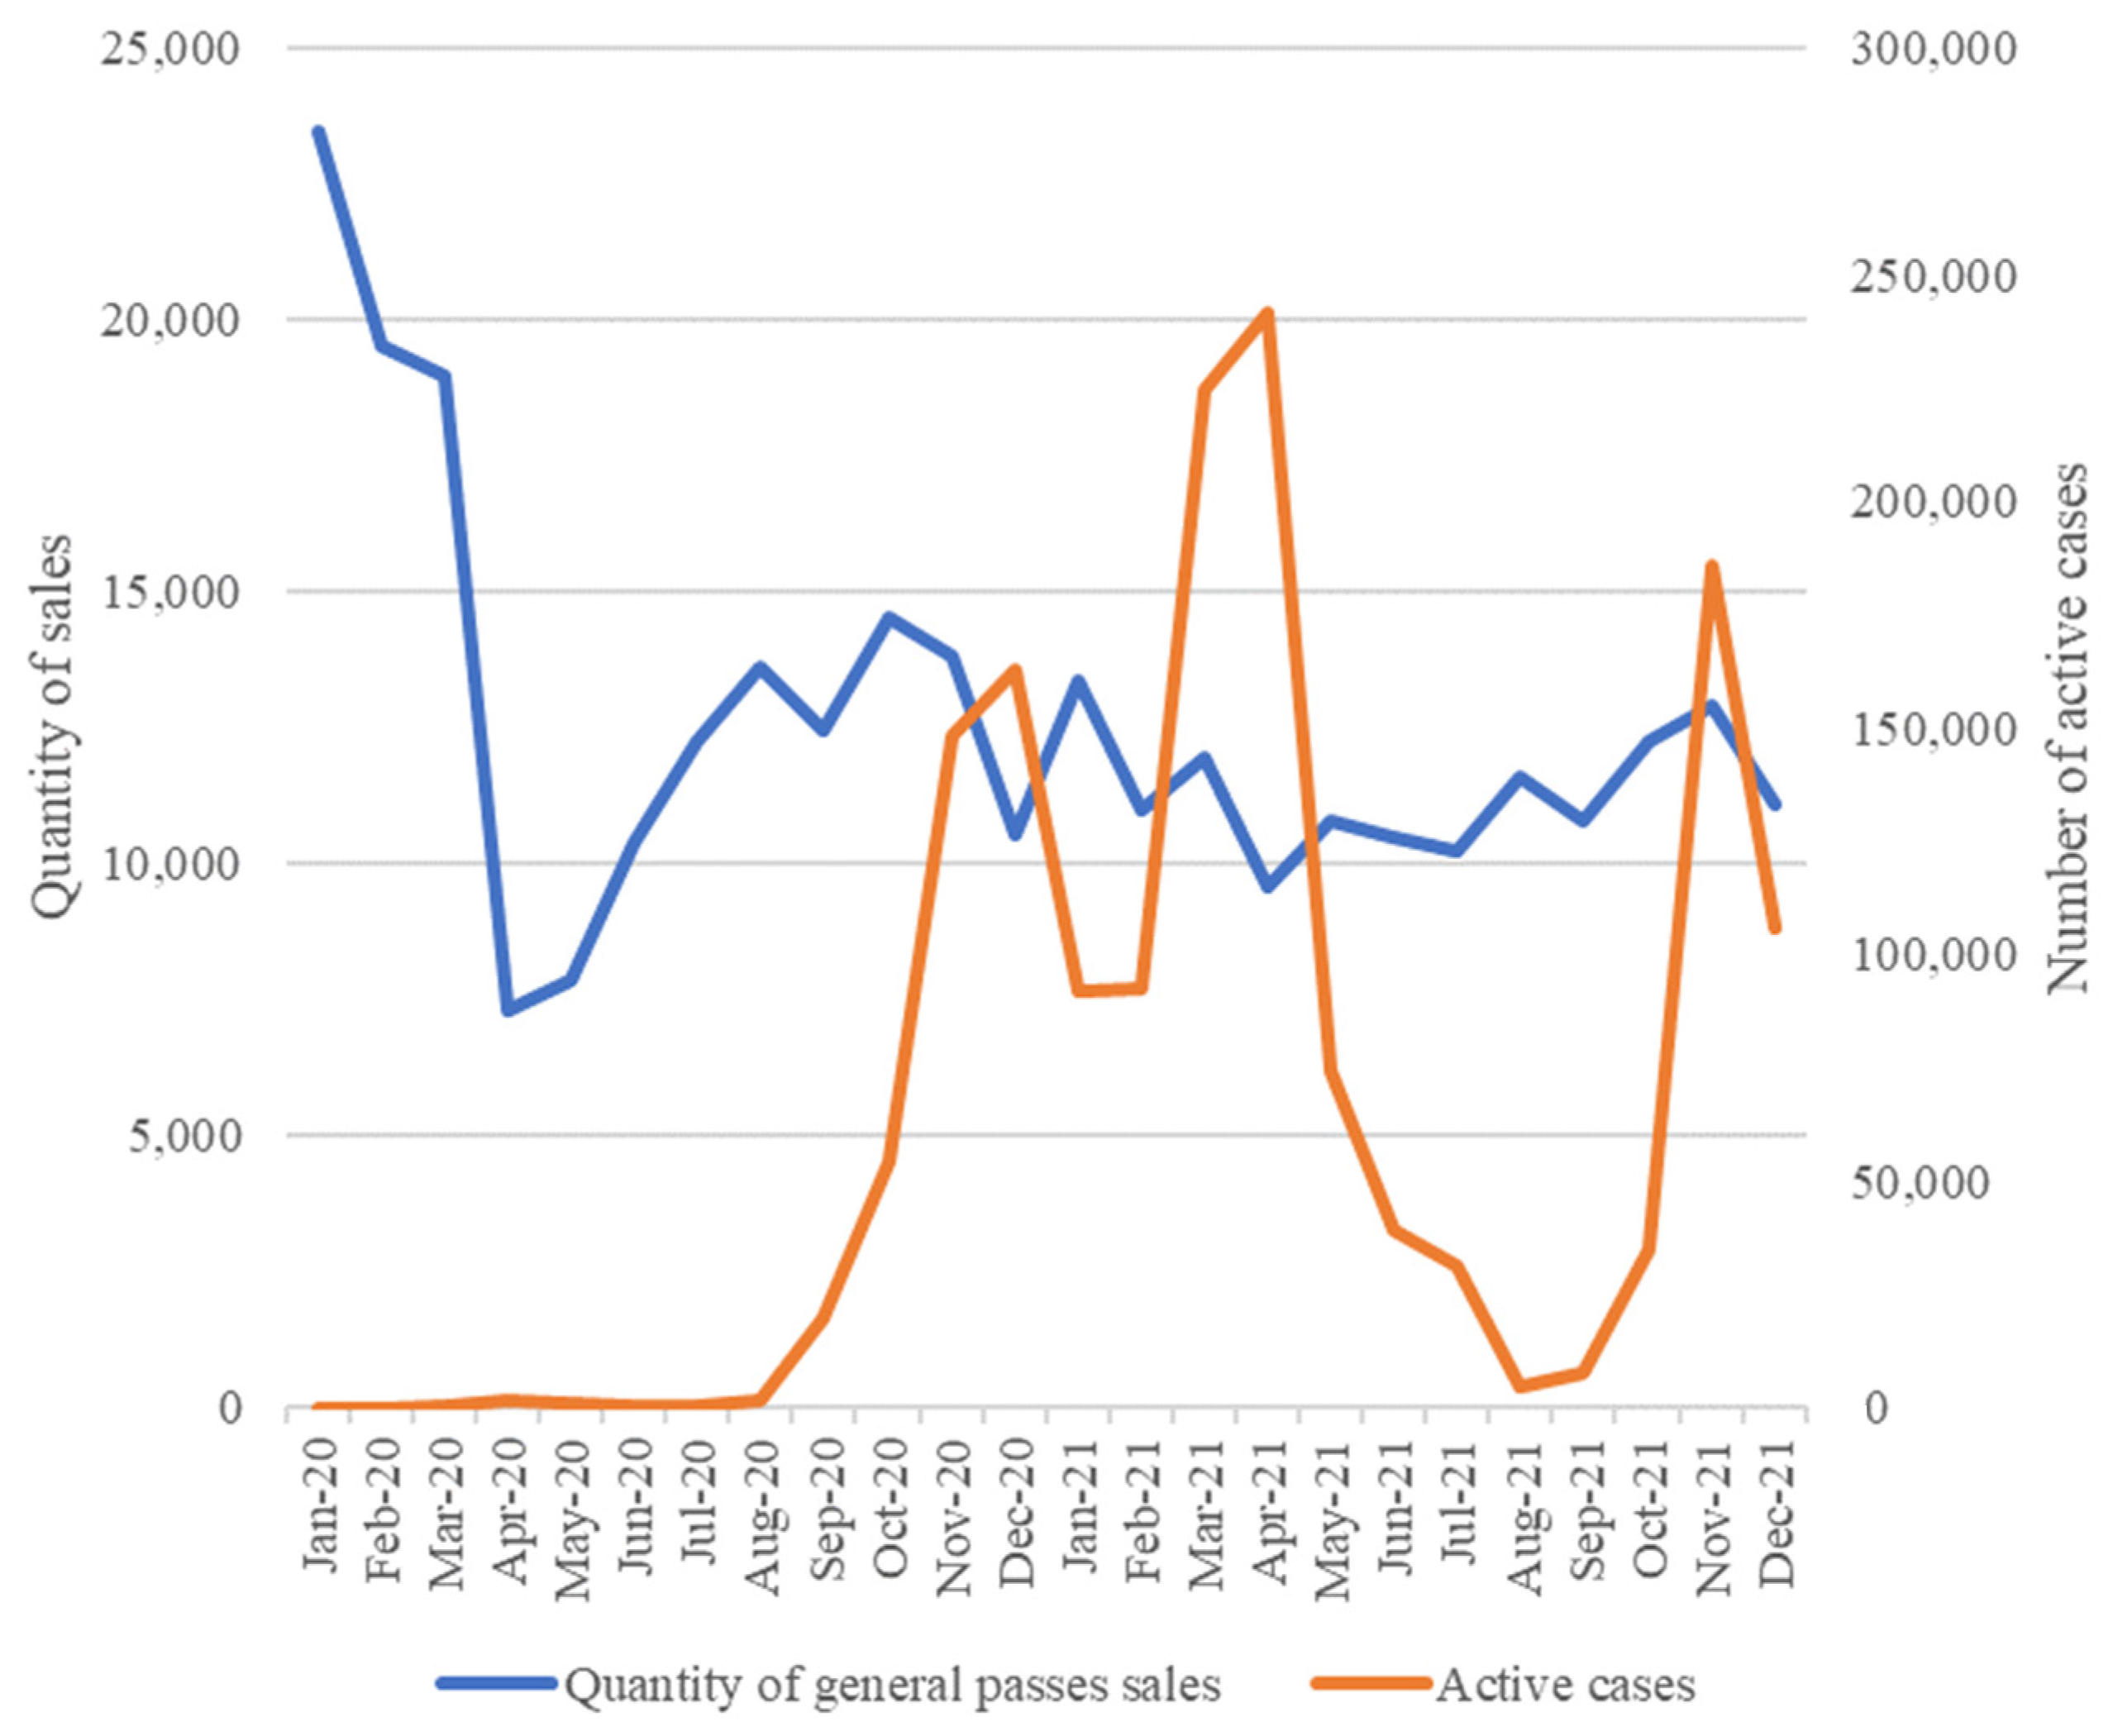
3.2.2. Analysis of the Correlation between General Pass Sales and Active Cases
The pandemic has also brought about significant changes in travel patterns in this segment. The spread of atypical forms of employment has reduced daily commuting, and the lack of comfort for passengers in public transport has led to a preference for individual transport to reach their destination. Similar fluctuations can be observed for the general pass in the first wave, but there are no increases in magnitude after the subsequent waves (
Figure 5). General passes are mainly used by employees who are not eligible for discounted passes, usually for frequent travel, even several times a day. This group is most likely to be able to afford to maintain and even use their vehicle daily, thus more time is needed for them to return to public transport.
Applying the first order ARMA(1,1) model to the time series of general passes and active caseloads, the parameters given in
Table 5 are obtained.
The coefficient β is also negative for general rents. Although it is very low (−0.005), it is not significant in this case, so we cannot confirm working hypothesis H2. In this case, our conclusion is that the number of active cases did not influence the sales of general passes.
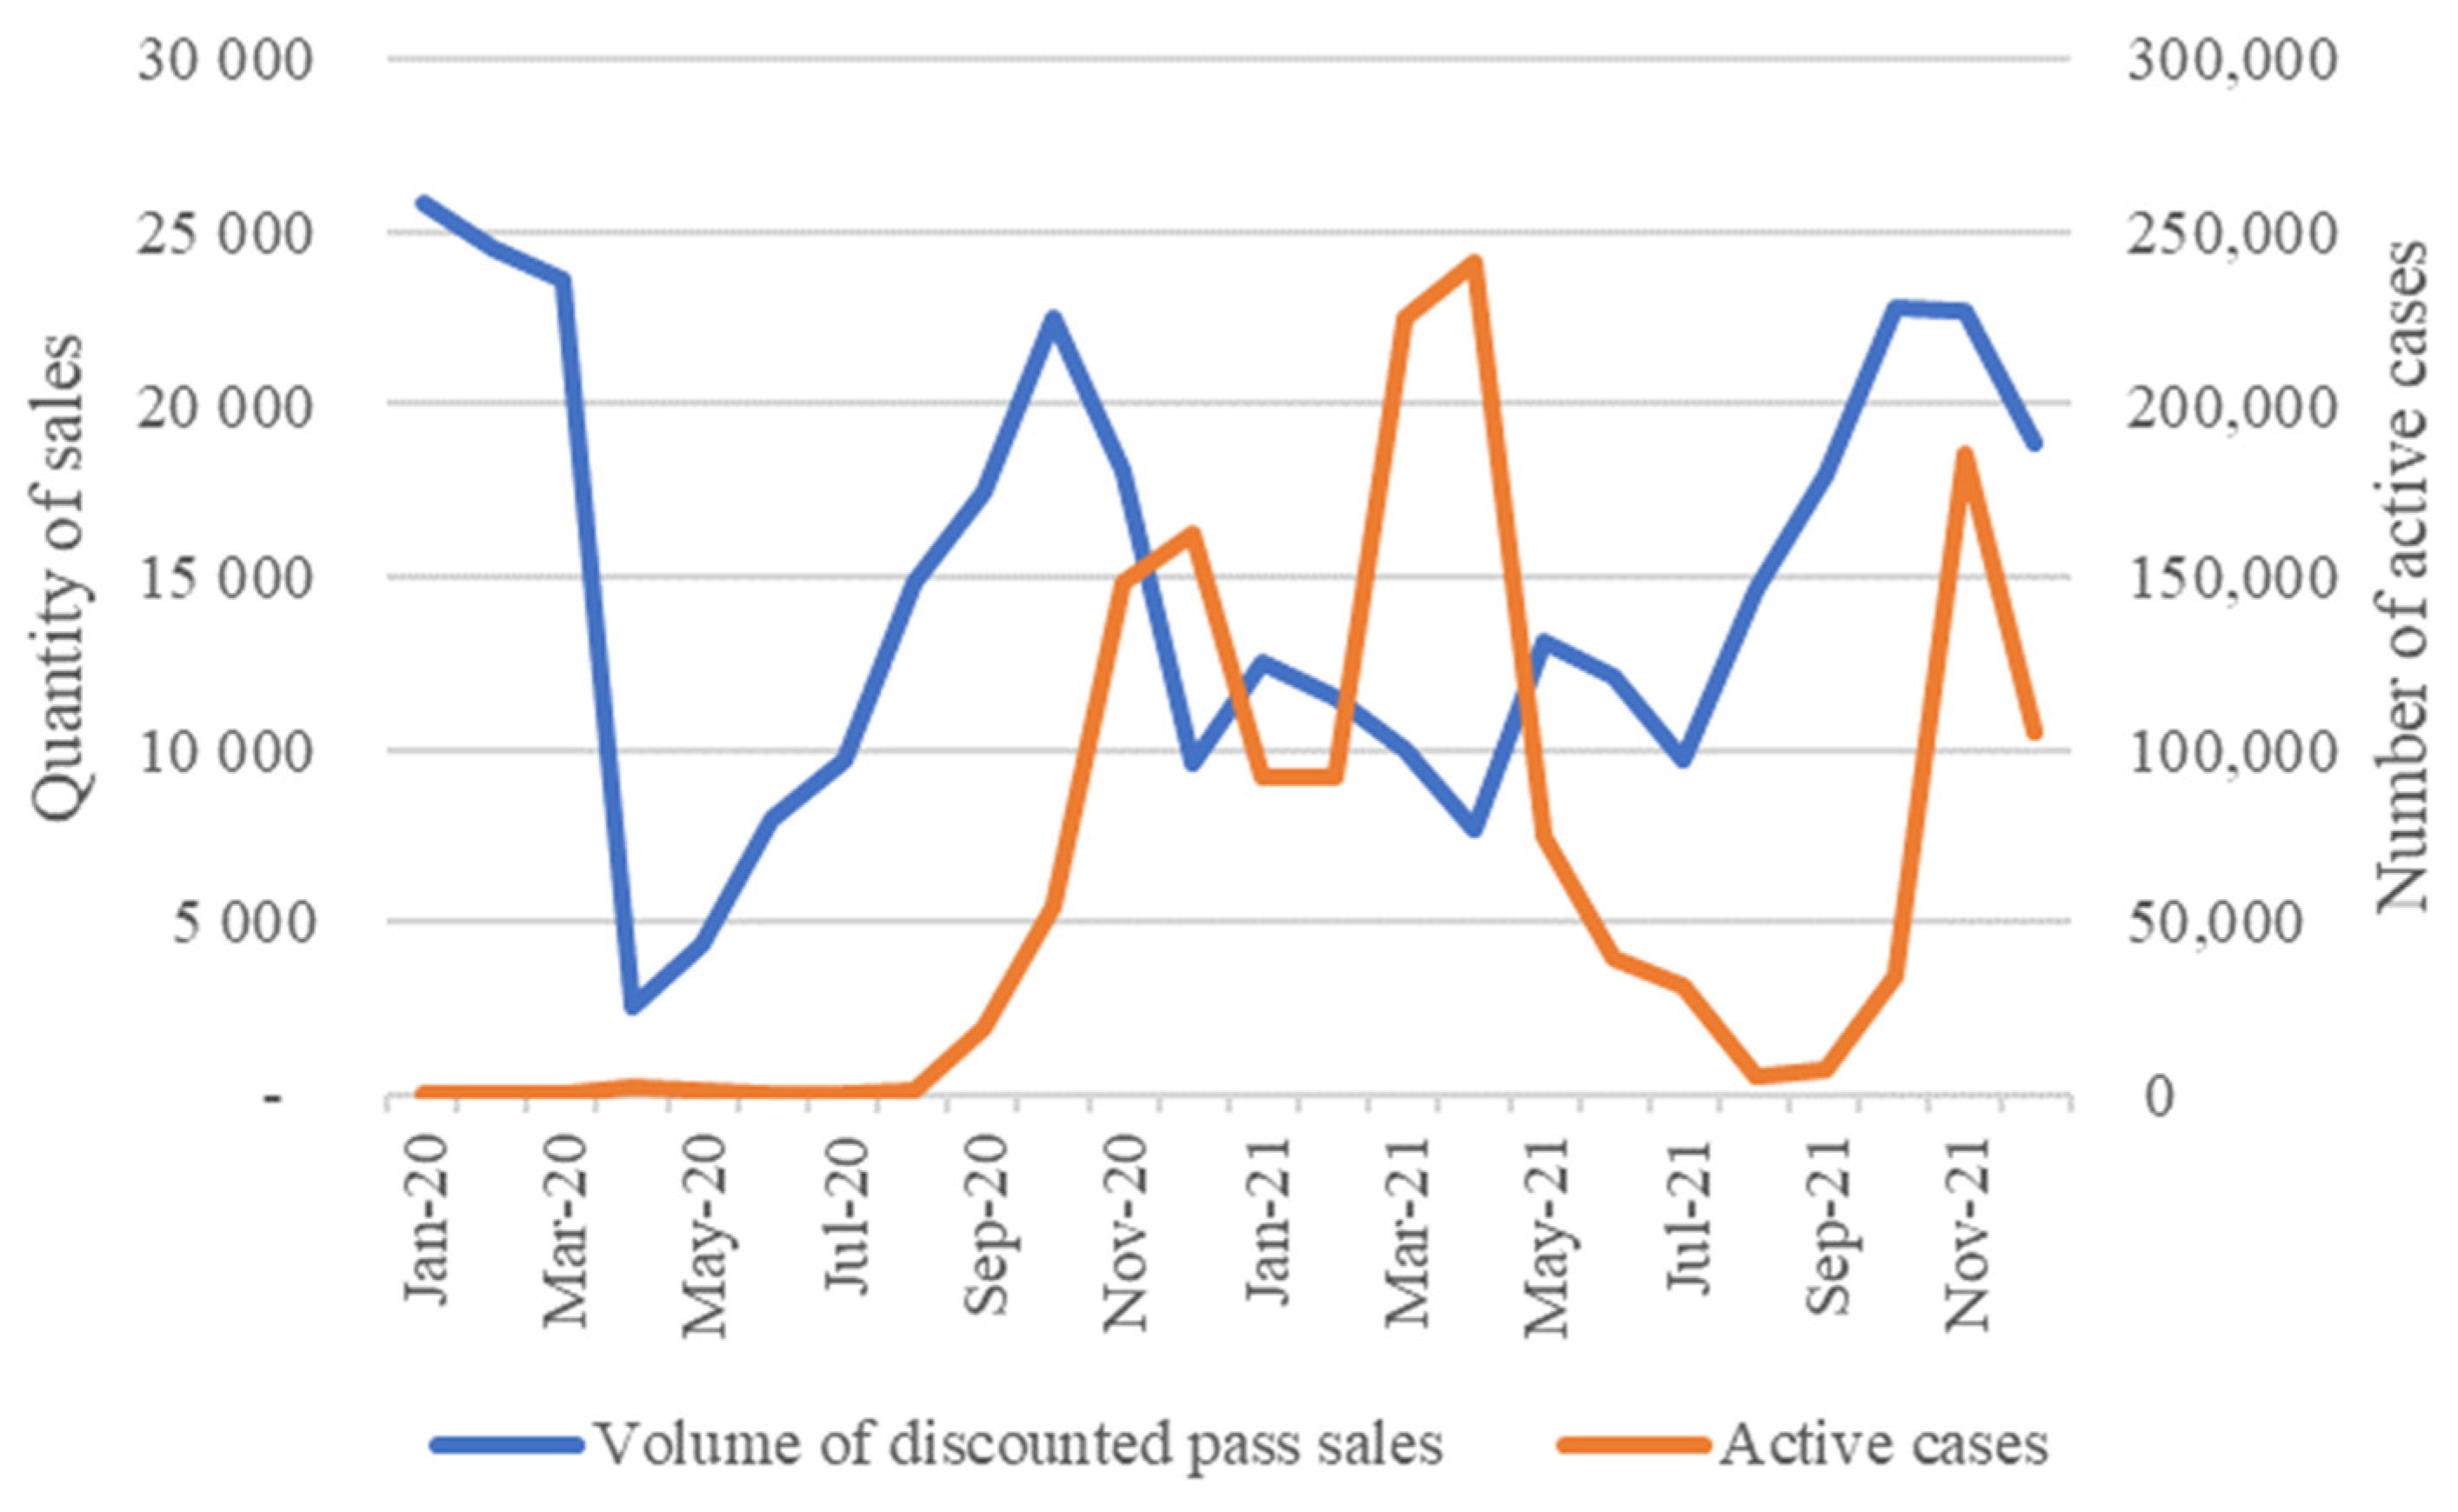
3.2.3. Analysis of the Correlation between Discounted Pass Sales and Active Cases
Several factors also influenced the development of discounted passes. Mandated distance learning is reflected in the declining number of student pass sales, with the biggest drop in this case also being caused by the first wave, with a significant “bounce back” in 2020 at the start of school in September (
Figure 6). The trend was quickly broken by the new measures taken in November, with volumes remaining low until the end of the school year due to distance learning. With the fourth wave, distance learning was not mandated, and sales resumed their upward trend until the winter break. The decline in December is due to the usual seasonal effect which occurs when a large part of the population travels by ticket or other means of transport because of the holidays.
The discounted passes also include passengers under 65 who are already retired. In their case, the fear of viral infection may have been the main factor influencing the change in travel habits.
Applying the first order ARMA(1,1) model to the time series of discounted passes and active caseloads, the parameters in
Table 6 are obtained.
The coefficient β is also negative in the case of concessionary season tickets. Although low (−0.016), it is not significant, so we cannot confirm working hypothesis H3. In this case, we conclude that the active caseload did not influence discounted pass sales.
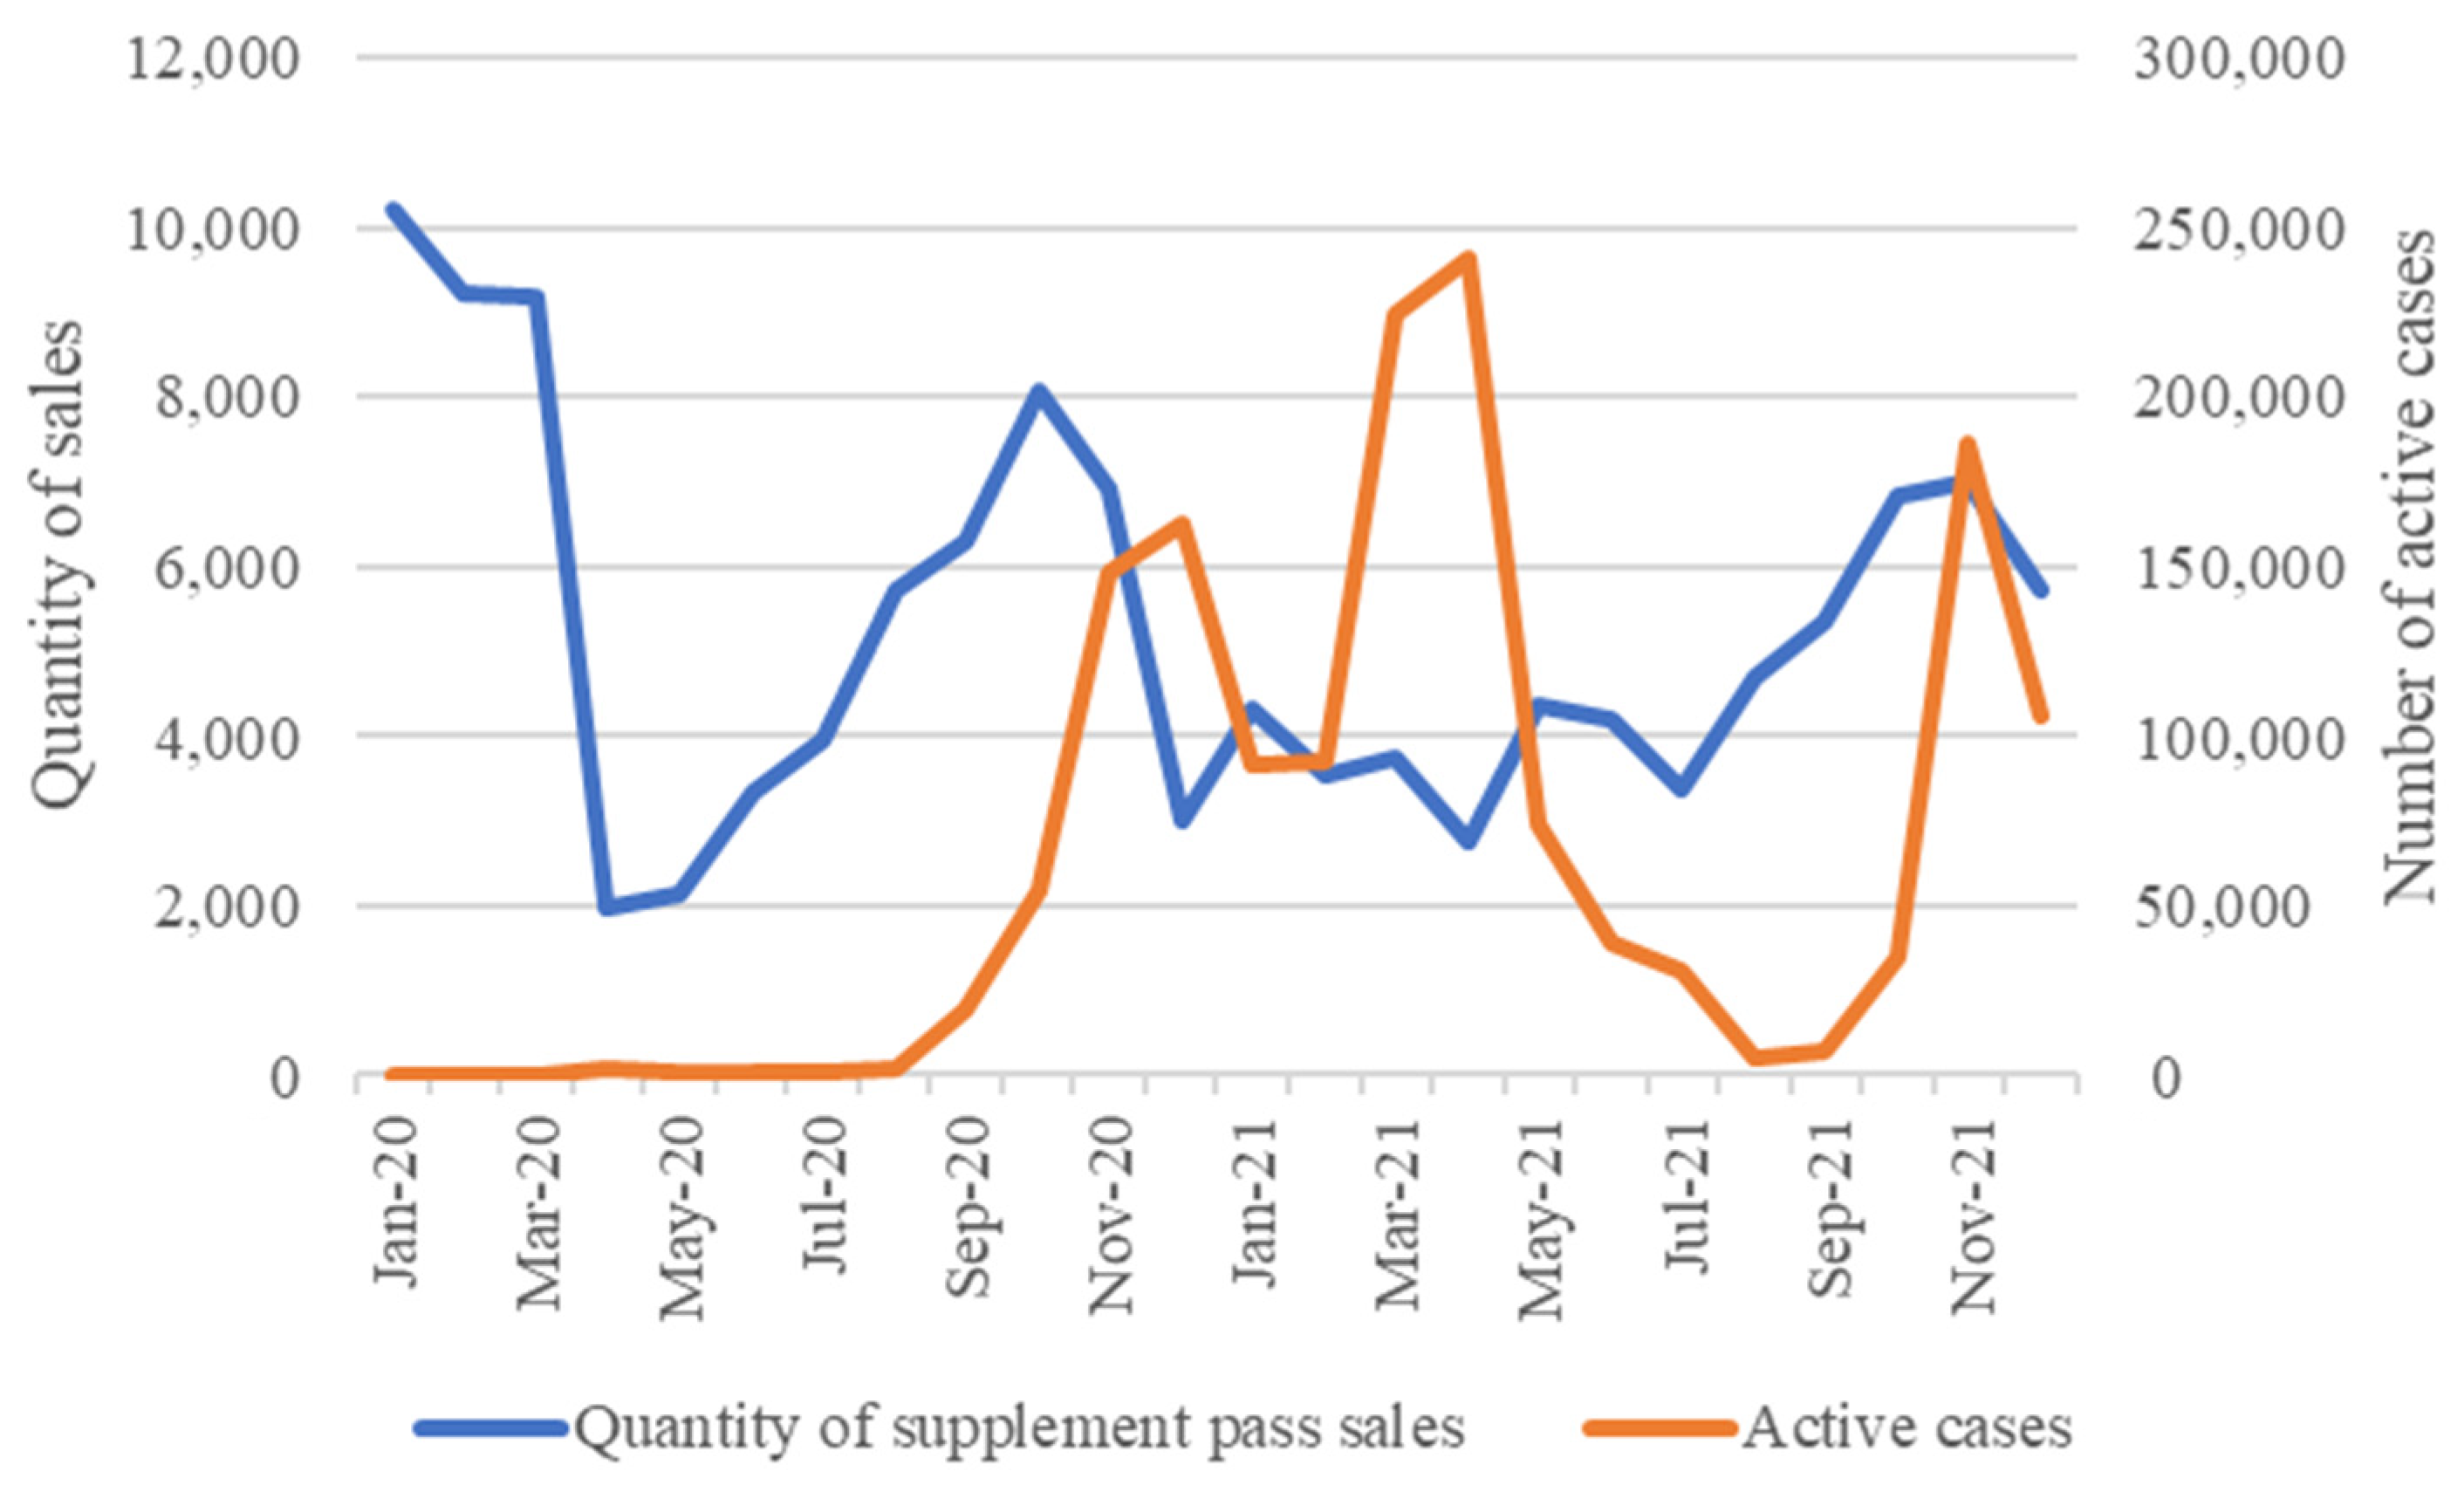
3.2.4. Analysis of the Correlation between Supplement Pass Sales and Active Cases
When examining the trend in the number of supplement passes, it can be seen that the trend is similar to that of discounted passes (
Figure 7). After a significant recovery following the first wave, there is a significant decline during the second and third waves. The decline was also due to the introduction of distance learning. In the fourth wave, as with the discounted pass type, a larger volume increase can be observed due to the normal schooling regime. A smaller increase reduces the spike intensity in sales of supplement passes for employees. The seasonal decline at the end of the year can also be observed for this type of pass.
Applying the first order ARMA(1,1) model to the time series of supplement pass sales and active caseloads, we obtain the parameters in
Table 7.
The coefficient β for the supplement passes is also negative, and very low (−0.054), but not significant, so we cannot confirm working hypothesis H4. In this case, our conclusion is that active caseloads did not influence the sales of supplement passes.
4. Discussion
The emergence and spread of the COVID-19 virus have changed our lives dramatically, affecting our daily lives in several distinct waves of active cases (
Figure 3). In Hungary, government measures to control and slow the spread of the virus affected our mobility patterns in the city of Debrecen. The analysis showed that most measures affecting public transport were taken during the first two waves, regarding their number and restrictive effect. These included the introduction of distance learning, curfews, and free parking. The mandatory use of masks and distance control further increased the minimization of the use of public spaces. Travel habits changed radically during this period, with the fear of contamination by the virus making private transport the preferred form of mobility for the population.
However, the ARMA model results show that the evolution of active caseloads did not influence the evolution of sales volumes. All of our hypotheses, whether logical or evident, had to be rejected.
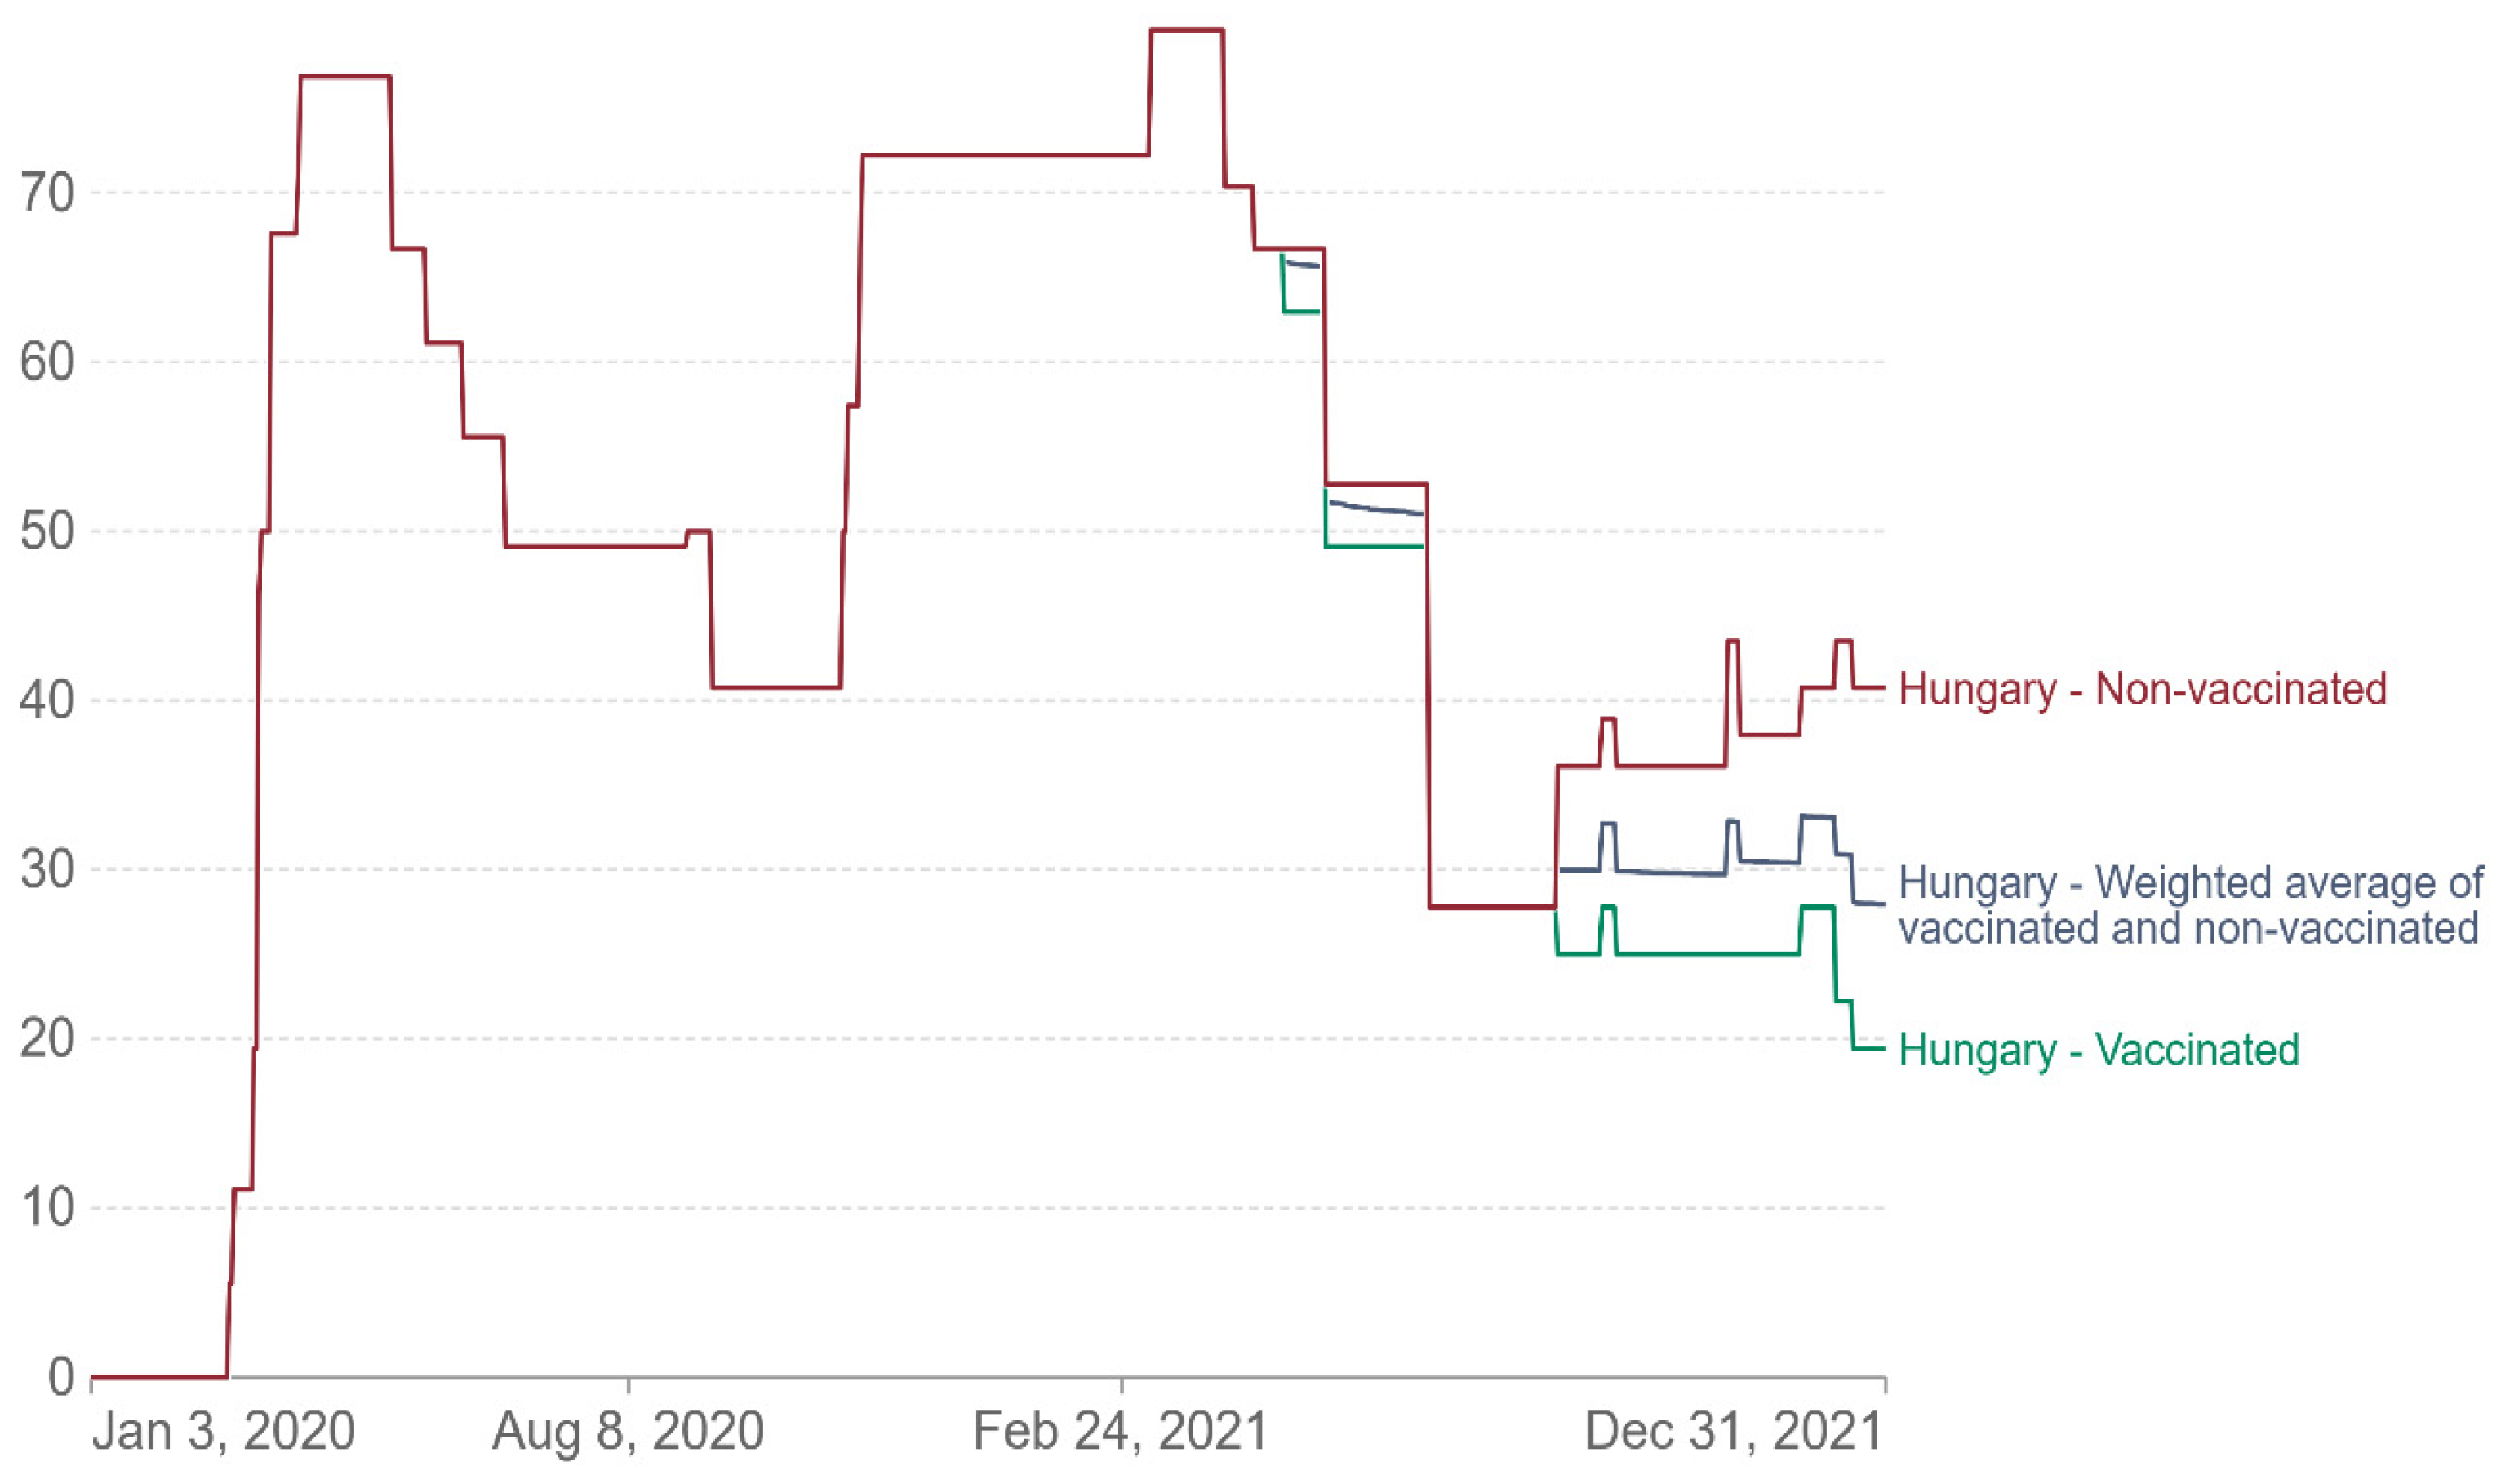
Many factors may have influenced the decline in demand for public transport, but this study only examined government action as an objective factor. The Oxford Coronavirus Government Response Tracker [
40] scored countries based on governmental stringency measures, with Hungary’s stringency (
Figure 8) index ranking among the most stringent throughout the pandemic.
Of the two impact factors examined, the number of active cases had a minor impact on the decline in ticket and pass sales, while government measures had a more significant impact.
5. Conclusions
Our analysis, although different in approach, confirms the studies by Meena and Sharma [
18], as well as Tóth et al. [
19], Fumagalli et al. [
20] and Wang et al. [
22], in which these authors highlight that strict restrictions that severely damage the economy are not essential to control the spread of COVID-19. Stochastic, i.e., probabilistic, systems can be modeled using random walk models, even if these phenomena are not necessarily random. Such, or similar, correlations exist in the field of COVID-19 evolution. The stochastic random walk process leads to the best solution in systems for which we do not know how it works [
41]. We assume that the economic disadvantages of direct intervention are more important for DKV than if there had been no governmental-municipal restrictive actions. In contrast to the sudden and significant negative impact on the transport sector at the onset of the virus, the reversal of travel patterns during the pandemic is likely to be a long process, lasting several years.
The DKV had to take several forced steps to ensure the sustainability of the service. To adapt to changes in travel demand, it had to adjust its capacity, sometimes by reducing the number of timetables and increasing them. Unfortunately, these measures have led to an even more unfortunate shift away from public transport. The effects of these measures can still be felt today in the travel habits of the city of Debrecen and the proportion of people using public transport because travel habits have shifted towards individual modes of transport [
19,
42]. To encourage people to choose public transport again, it is necessary to rationalize timetables and improve service quality. Although the results by Cartenì et al. [
43,
44] showed a high correlation (up to 0.87) between COVID-19 contagion and public transportation trips, the organization of public transportation can reduce the risk.
A huge challenge for public transport operators in the coming period will be to attract people back from private transport to public transport. To achieve this as soon as possible, continuous service improvement is necessary to ensure that public transport offers people a suitable mobility alternative regarding journey time and comfort.

 ,
, 


