1. Introduction
1.1. Purpose of Study
The number of accidents at industrial sites is steadily increasing [
1]. In addition to causing irreparable damage to the individual(s) involved, an accident can also cause reputational damage to the organization and may result in significant time and financial losses for the organization in the aftermath of the accident [
2]. Therefore, continuous safety management efforts to prevent accidents are necessary in all industries. Meanwhile, the construction industry has the highest number of occupational accidents and fatalities in South Korea. The accident rate per thousand people increased from 7.3% in 2014 to 12.6% in 2021, with construction fatalities accounting for 50.4% of all industrial accidents [
3]. Hence, safety management at construction sites is a top priority, and its significance has been recognized by various stakeholders, including the government and enterprises. Many safety management efforts are continually being implemented, with related studies being actively conducted [
4].
Owing to rapid advancements in artificial intelligence (AI) technology, AI is being applied extensively in various industrial fields [
5]. Although the adoption of AI in the construction industry is slower than that in other industries, AI has been introduced into areas such as bidding, design, construction, safety, and maintenance [
6,
7]. Among the various AI technologies, computer vision using deep learning has been experimentally applied to construction safety management.
Object detection AI technology, which recognizes and classifies objects, offers significant versatility as it can serve as the basis for image and video processing technology and can be used in place of human vision for many purposes throughout the construction process [
7]. Several attempts have been made to apply object detection AI to on-site safety management by automating risk factor recognition. However, even with only 2–3 classification target classes, the object detection accuracy still requires improvement compared to that reported by studies in other fields [
8,
9,
10,
11,
12,
13,
14,
15].
This study aims to improve object recognition and classification accuracy using two You Only Look Once (YOLO) versions, namely YOLO v5, which has been acknowledged in several studies for its effectiveness in object detection, and YOLO v8, which is the most recent version. In this method, contents related to the accuracy and the learning environment settings in YOLO are also reviewed. In addition, the results of the accuracy improvement of the two versions are compared. This study with the improved accuracy and related technologies presented could contribute to the introduction and expansion of AI technologies in construction fields.
1.2. Research Methods and Procedure
This study comprises the following steps, as outlined in the remainder of the paper:
- (i)
Previous studies using object detection AI technology are reviewed. The object type to be classified and the deep learning model to be applied are selected.
- (ii)
Background theories related to object detection AI technology are investigated.
- (iii)
Construction-safety-related image data are collected through web crawling and labeled to create a dataset for training, validation, and testing.
- (iv)
The dataset is applied to the two selected YOLO versions. Training and validation are repeatedly conducted while changing the main settings and hyperparameter values to improve the object detection accuracy.
- (v)
The highest accuracy for each YOLO version is identified, and the results are compared.
2. Literature Review
Various computer vision studies have been conducted to improve safety at construction sites. Fang et al. (2018) [
8] propose a method that utilizes a convolutional neural network (CNN), which is a widely used deep learning model for image feature identification, to identify workers and excavators with a 93% mean average precision (mAP). Kim (2019) [
9] classifies the safety risk factors at a construction site that must be managed by law into four types and proposes a management system structure using computer vision. Cho et al. (2021) [
11] present an object detection and tracking method based on CCTV footage to assist in safety management tasks. This study applies a self-developed instance segmentation library with three classes: workers (C1), concrete mixer trucks (C2), and dump trucks (C3). An mAP of 79.2% is achieved, with 74% for C1, 84% for C2, and 80% for C3.
Lee and Kim (2020) [
16] analyze the performance of various CNN-based object detection models, including YOLO and region-based CNN (R-CNN). The results suggest that YOLO is faster and more accurate than other models and that it enables real-time object detection with higher reliability in real-world applications. Nath et al. (2020) [
10] propose a model that detects workers and personal protective equipment (PPE) using a YOLO v3 model for construction safety management. The wearing of PPE by workers is identified with a 72.3% mAP. Kang et al. (2021) [
12] present a vision-based deep learning platform architecture that applies YOLO v3 to support real-time construction site management, such as safety management. In the application example, heavy construction equipment and workers are identified with accuracies of 84.7% and 81.1%, respectively.
Kang et al. (2023) [
15] classify workers into three classes based on their hard hat and harness wearing status and analyze the differences in detection accuracy according to distance and illumination using YOLO v3. The study secures image data with varying illumination levels by changing the shooting time in a 7 m × 10 m experimental environment. The mAP of the three classes according to distance is 87.6%. The highest accuracy is 94.4% for the class of workers who wear hard hats at a 2 m distance, whereas the lowest accuracy is 83.2% for the class of workers who wear both hard hats and harnesses at a 10 m distance. The accuracy increases slightly with illumination. Ferdous and Ahsan (2022) [
17] apply the YOLOX model to eight classes of 1699 images comprising 11,604 instances, resulting in a test accuracy of 89.5% mAP.
Kim and Park (2021) [
18] apply the publicly available Open Image Dataset and a Kaggle dataset to YOLO v5 and identify the three classes of workers, hard hats, and masks with a 91% mAP. Isa et al. (2022) [
13] achieve the best results with YOLO v5 when default configuration options are applied to the YOLO v3, v4, and v5 models for underwater object detection. A 97.7% mAP is achieved for an example dataset consisting of six marine species classes (large fish, small fish, shrimp, crab, jellyfish, and starfish) after adjusting the optimizer and learning rate of YOLO v5. Hayat and Morgado-Dias (2022) [
19] use 5000 photos from an open dataset and apply two classes to YOLO v5 to distinguish between the worker’s head and helmet, achieving an accuracy of 92.4% for mAP. Alateeq et al. (2023) [
20] apply YOLO v5 to a publicly available dataset and self-collected images and obtain an accuracy of mAP 83.7% for three classes consisting of workers and two types of PPE and mAP 93.2% for seven types of heavy construction equipment.
Considering the results of previous works, this study defines three classes: heavy construction equipment, workers, and PPE. Image data were collected through web crawling to reflect various environmental conditions. The YOLO v5 model, which has achieved the best results in image-based object identification in previous studies, and the recently released v8 model are adopted. Through the process of improving the accuracy of object recognition and classification, this study aims to enhance the insufficient accuracy present in previous studies and compare the results between the two YOLO models.
3. Computer Vision Models
3.1. CNN
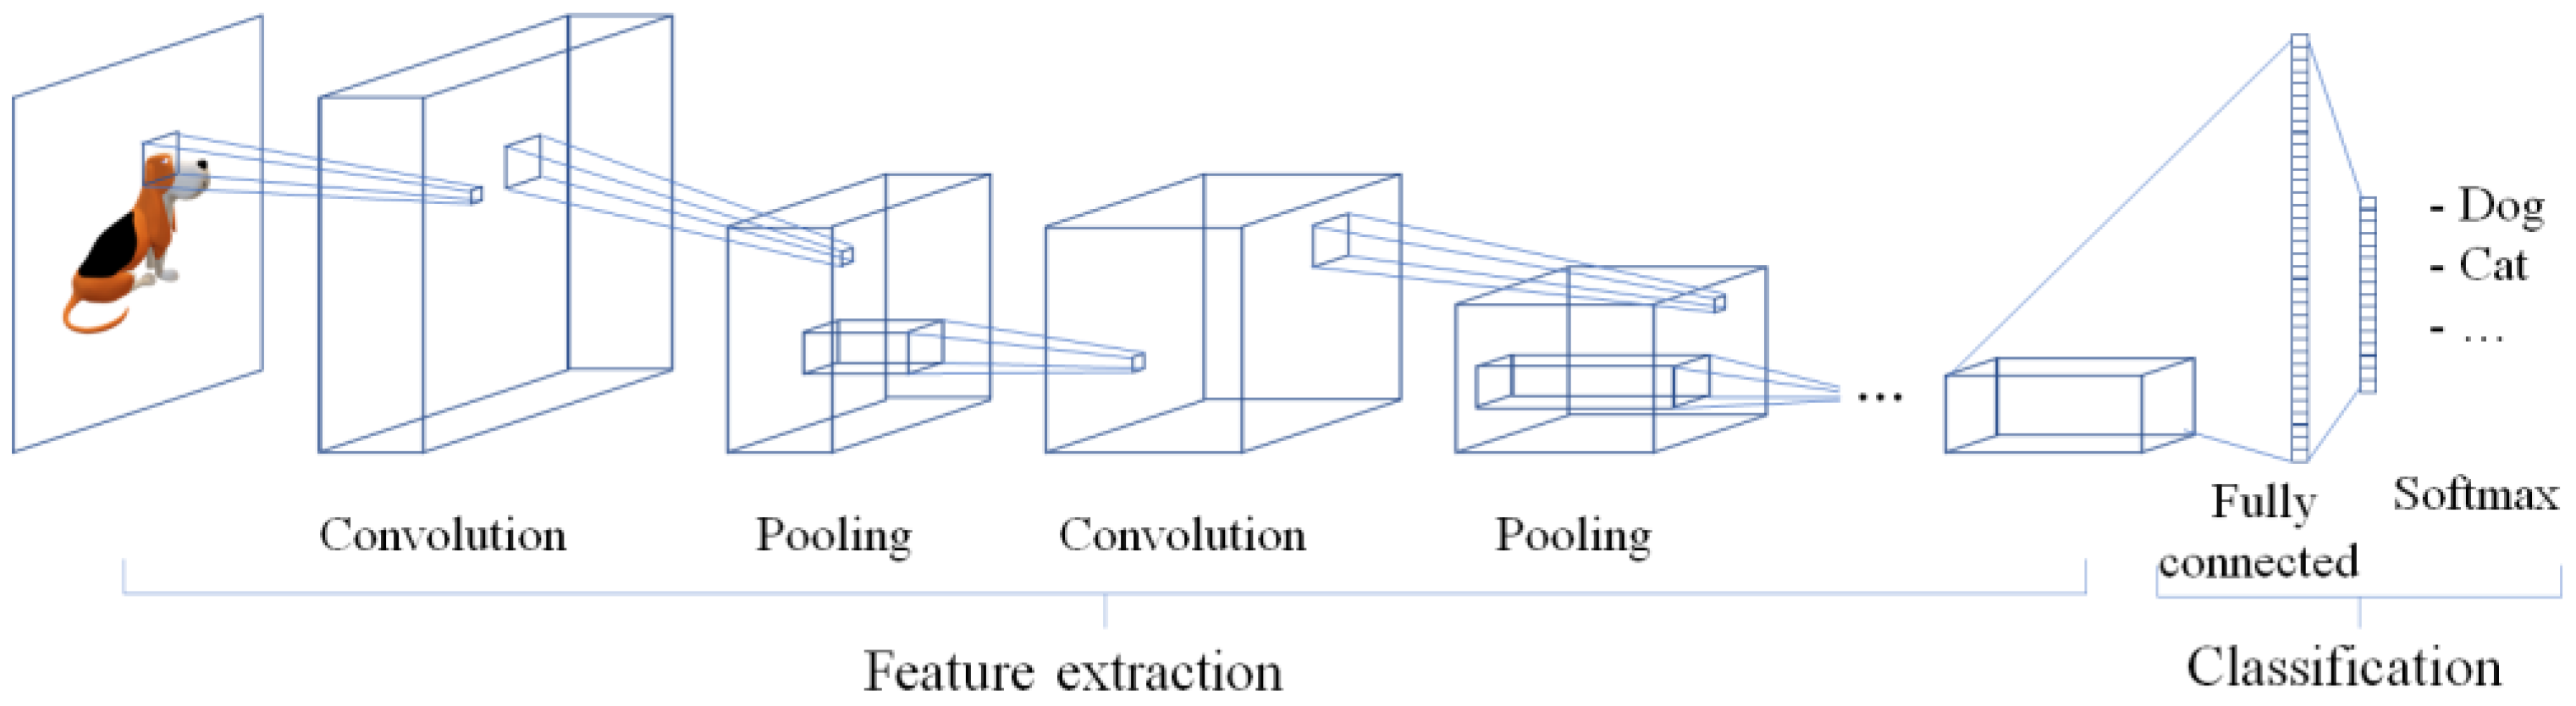
A CNN is a widely used deep learning method in image processing. A typical CNN model consists of feature extraction and classification stages, as illustrated in
Figure 1. The convolution and pooling layers are connected for effective feature extraction, and the results undergo a classification process to determine the type with the highest probability through a fully connected layer [
21].
CNNs can classify images with high accuracy. However, the computation increases significantly during feature extraction, which comprises convolutions and pooling in a sliding manner across the image. Moreover, there is a limit when identifying multiple objects and the location of each object in one image [
16]. Therefore, CNNs are not appropriate for application to safety management at construction sites that may require real-time detection of more than one object in a single image.
3.2. Object Detection Models
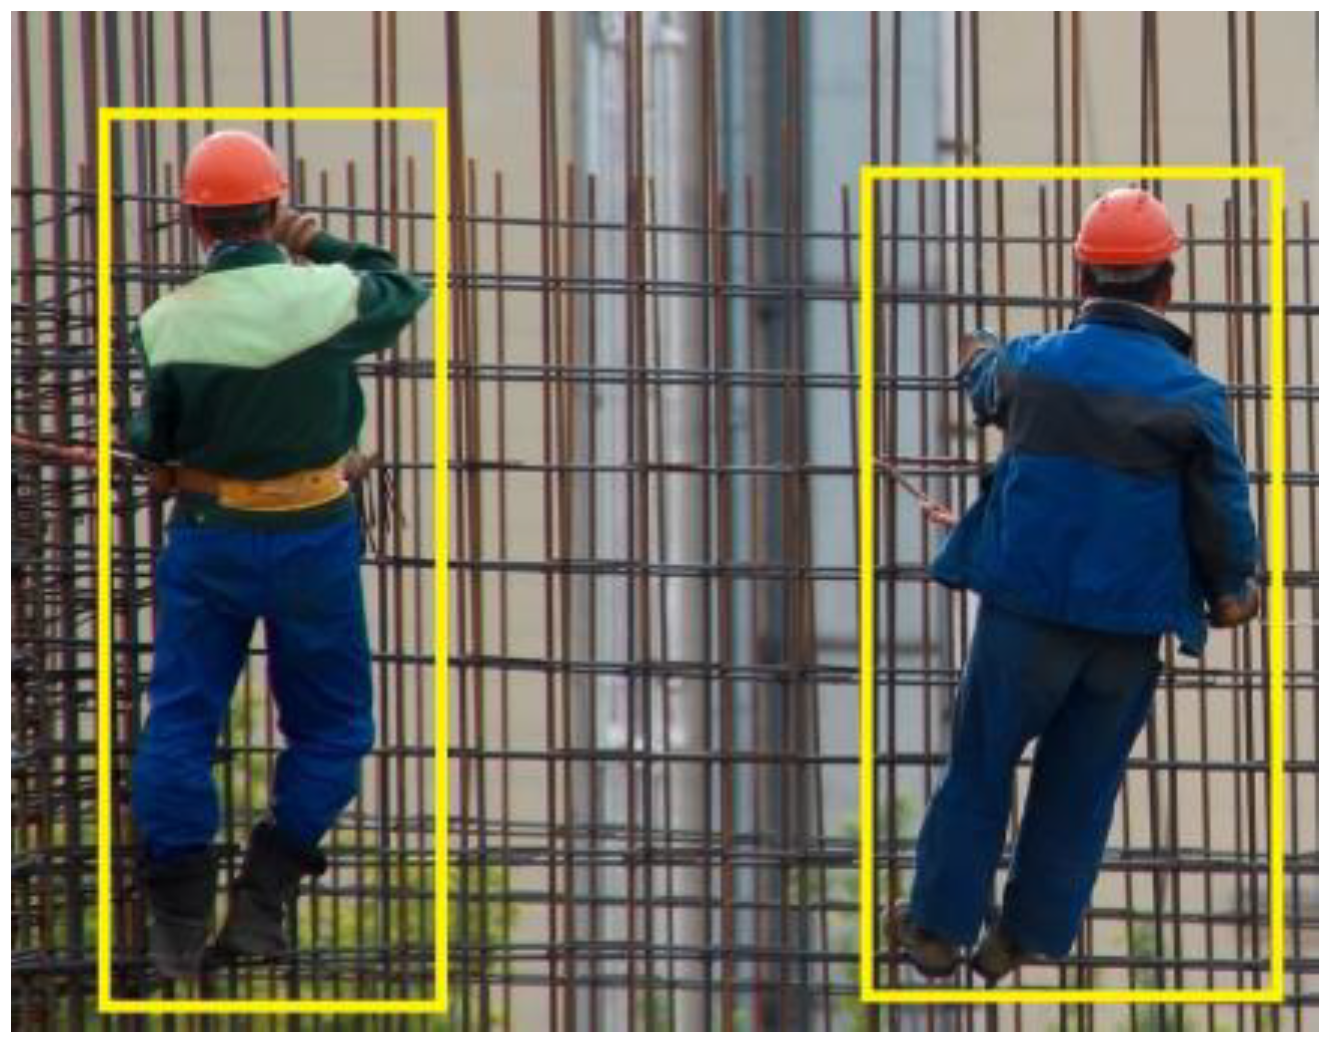
Several object detection models have been developed to overcome the disadvantages of CNNs. In general, a bounding box is set around the area in which the target object is expected to be located, as indicated in
Figure 2, and the object in each bounding box is identified as the type with the highest probability among several candidates. In this process, the setting of the bounding box is known as localization, and the identification of the type of object inside the bounding box is known as classification. Object detection is the application of both processes to identify multiple objects within a single image. Two object detection methods are available: two-stage and one-stage methods [
22].
The two-stage method, which was proposed earlier than the one-stage method, performs location identification using a CNN to identify candidate bounding boxes and then applies another CNN to identify the object in each bounding box. This method has evolved into R-CNN, Fast R-CNN, Faster R-CNN, and Mask R-CNN, with improvements in detection speed and accuracy [
23,
24,
25,
26].
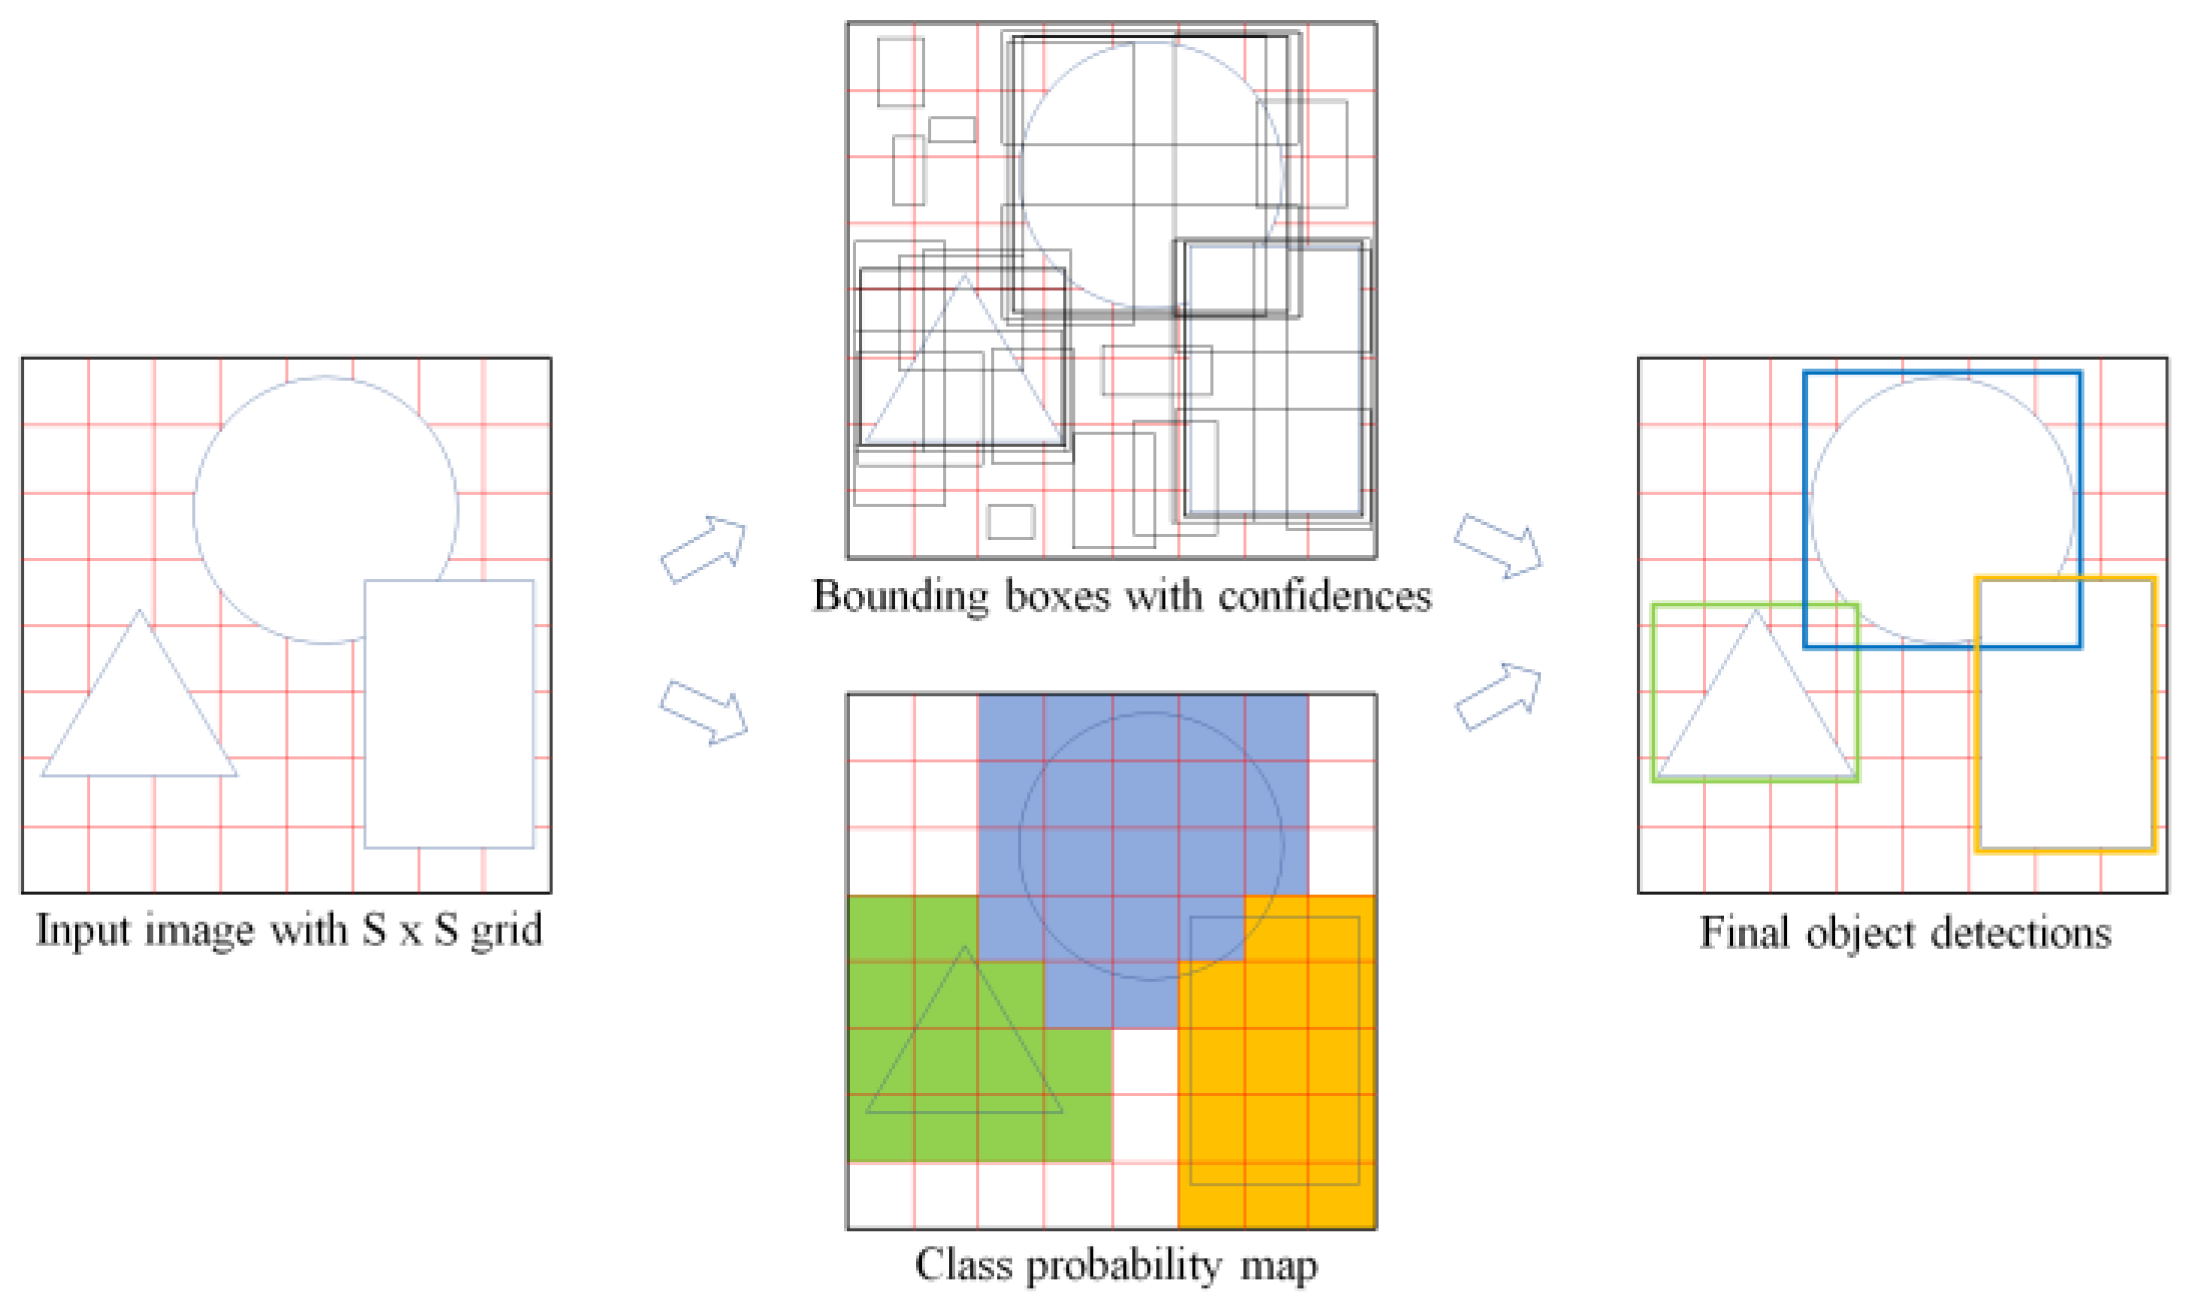
The one-stage method performs localization and classification simultaneously by applying a CNN once. YOLO is the representative one-stage method. As illustrated in
Figure 3, an S × S grid is formed on the image, which creates S
2 cells. A CNN is applied to perform localization and classification for each cell, thereby generating many candidate bounding boxes while assessing their confidence levels. Multiple objects and their respective positions within a single image are identified by retaining only the bounding boxes with the highest confidence for each object type while removing the remainder using a technique known as non-maximum suppression [
27].
Since the first YOLO model was proposed by Redmon (2016) [
27], the eighth version has been released without a predominant responsible organization, through papers, reports, or website code disclosure [
28,
29,
30,
31,
32,
33,
34,
35]. This study uses YOLO v5, which has frequently been applied and discussed owing to its high performance [
13,
36], as well as the recently released YOLO v8.
It must be noted that YOLO v8 was released during the early stages of writing this paper and is still being upgraded on the website that publishes the code; therefore, it is difficult to guarantee the stability of the results. However, we consider it meaningful to compare the stable v5, which has been previously released by the same institution, and the latest v8, which is claimed to exhibit superior performance.
4. Object Detection Accuracy
The prediction accuracy of a deep learning model is evaluated at each training step based on the given dataset. The model learning level can be improved, and better prediction can be achieved by updating the parameter values of the model to yield higher accuracy than that of the current training step. In cases in which a specific index value (e.g., stock price) or category (e.g., distinguishing between dogs and cats) is assessed, the accuracy of the predicted value can be determined by comparing it to a single corresponding real value [
37]. On the other hand, in the object detection model, the average precision (AP) is used to reflect both localization and classification. Key concepts related to AP include the prediction status, intersection over union (IoU), precision, recall, and mAP. Padilla et al. (2020) [
38] provide detailed explanations and examples of these concepts, which are summarized in the following sections.
4.1. IoU
Images that are used for learning in the object detection model contain ground-truth bounding boxes, as illustrated in
Figure 2. Predicted bounding boxes are generated during the learning process. In the example shown in
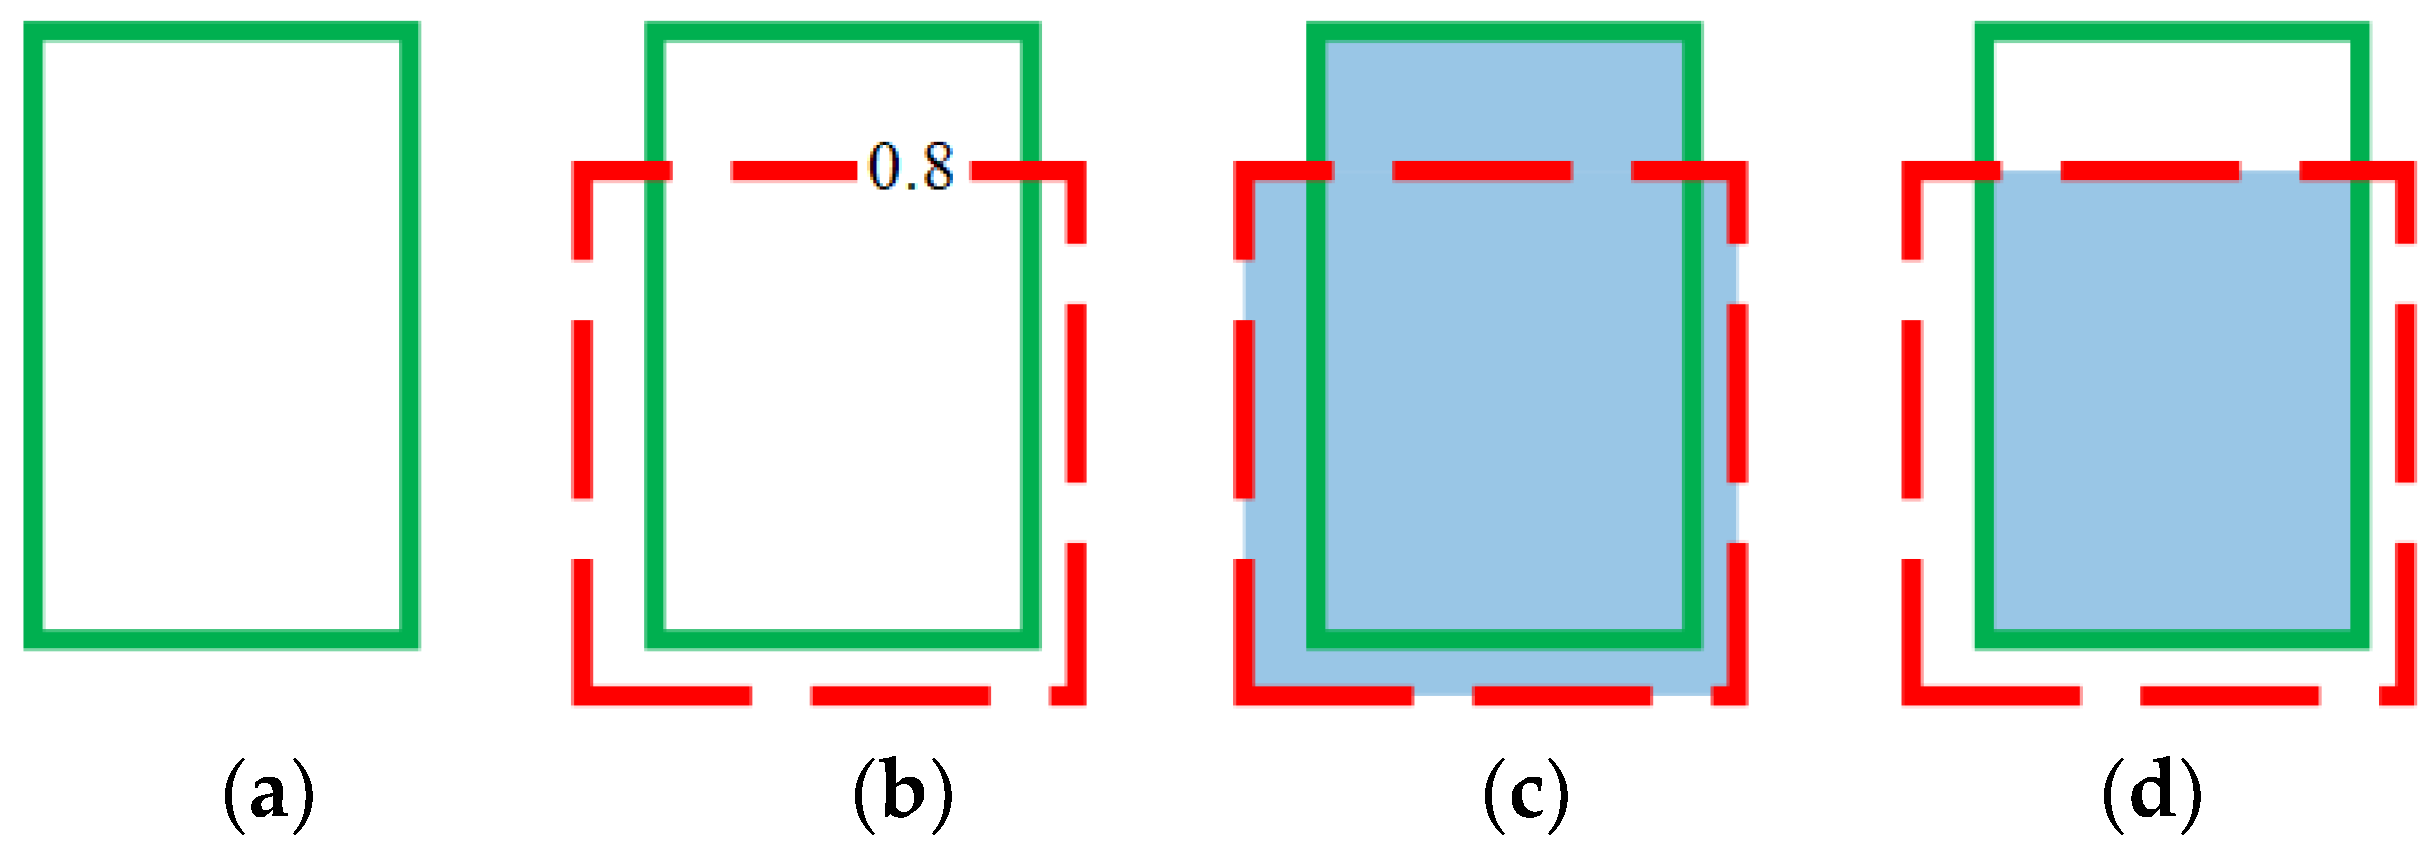
Figure 4, when a ground-truth bounding box (green solid line) contains an object, as shown in (a), the location of the object is assumed to be predicted as the box with the red dashed line, as shown in (b), and the confidence, namely the probability of it being that object, is 80%. In this case, the union area of the two boxes is shown in (c), and the intersection area is shown in (d). The intersection over union (IoU) is the ratio of the intersection area to the union area.
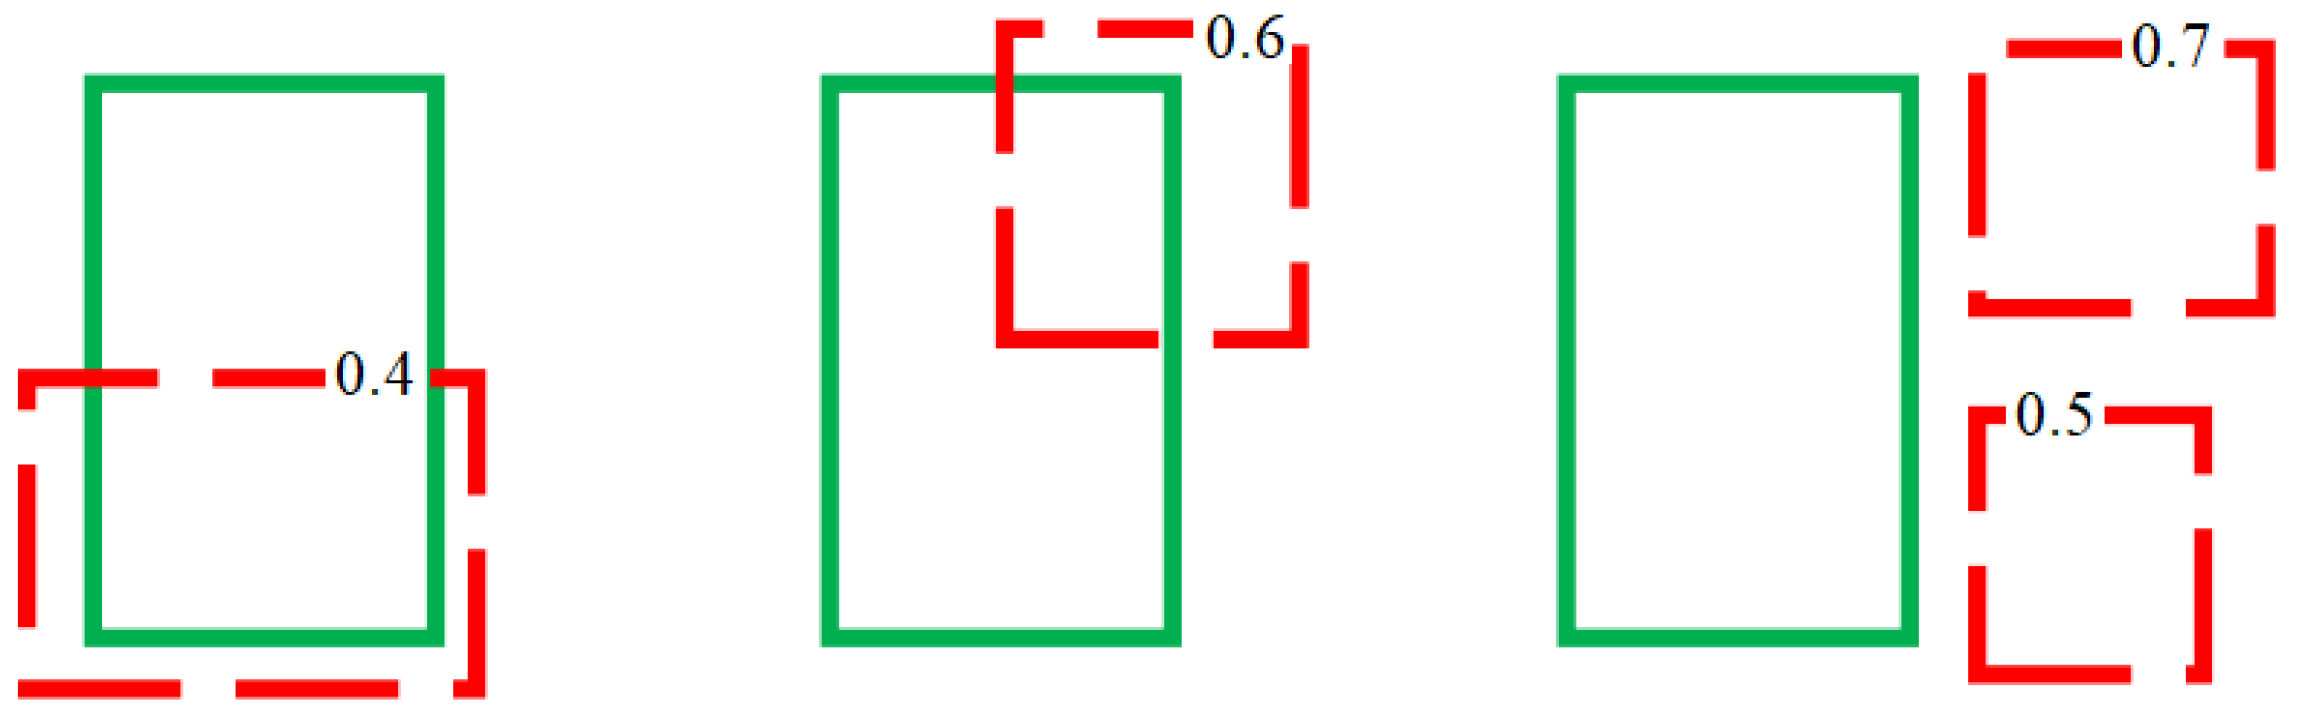
An IoU threshold is set to determine whether the prediction is correct during the learning process. For example, if the IoU is set to 0.5 in the example of detecting one type of class, as shown in
Figure 4, because the intersection area relative to the total union area is 0.5 or greater, the object is considered to be detected correctly, which is referred to as a true positive (TP). However, if the IoU is lower than the threshold of 0.5, as in the examples shown in
Figure 5, the object is considered to be detected incorrectly, which is referred to as a false positive (FP). In
Figure 5, the two boxes that are located outside the ground-truth bounding box on the far right also correspond to FPs. The numbers indicated on the predicted boxes in this figure are the confidence values. Thus, TP and FP are distinguished based on the IoU, regardless of the probability of being that class. Meanwhile, as indicated in
Figure 5, the model fails to detect the actual existing object, which is known as a false negative (FN). Therefore, three FNs and four FPs are identified in this example.
4.2. Precision and Recall
In machine learning, the performance is generally evaluated using a single value for classification or value prediction. In object detection, two metrics are used simultaneously: precision and recall [
39]. As shown in Equation (1), precision is the ratio of correctly identified objects to the total number of objects that are identified as positive. As indicated in Equation (2), recall is the ratio of correctly identified objects to the total number of actual objects.
Precision and recall have an inverse relationship. For example, if the model is trained to achieve a high precision, the number of detected objects will decrease, resulting in a lower recall. Conversely, if the model is trained to increase the recall, more objects will be detected, which will decrease the precision. Therefore, a precision–recall (P–R) curve, which simultaneously reflects the precision and recall values based on the detected confidence, is applied in object detection. The area under the curve, which is obtained by applying interpolation, is used as the accuracy metric known as AP [
40].
When multiple classes are used, the mAP is calculated by averaging the AP values of the classes. The mAP50 denotes the P–R curve applied with an IoU of 50%. The average value applied with an IoU from 50% to 95% in 5% increments is denoted as mAP50–95. As the IoU increases, the number of TPs decreases, whereas the number of FPs and FNs increases, resulting in a lower mAP50–95 value than the mAP50 value.
5. Dataset Configuration
Three classes were used in this study: heavy construction equipment (Heavy), PPE, and workers (Worker). Images for each class were collected through web crawling. The images were automatically searched in both English and Korean and downloaded from Google (
www.google.com) and Naver (
www.naver.com) using a Python-based code. The following keywords were used for the three classes: (1) Heavy: bulldozer, excavator, grader, tower crane, and heavy construction equipment; (2) PPE: hard hat, harness, and dust mask; and (3) Worker: construction worker. Approximately 18,000 images were collected. Images unrelated to the keywords and blurry or indistinguishable images were excluded, and finally, a total of 4844 images were used in the study.
The Roboflow platform (
https://roboflow.com) was employed for image preprocessing. The researcher manually drew bounding boxes in the relevant areas of each image and assigned the corresponding class. Among the 4844 images, 3391 (70%) were allocated to the training, 727 (15%) to the validation, and 726 (15%) to the test datasets. Some images contain multiple class types, resulting in a total of 10,181 instances being applied across all classes, as indicated in
Table 1.
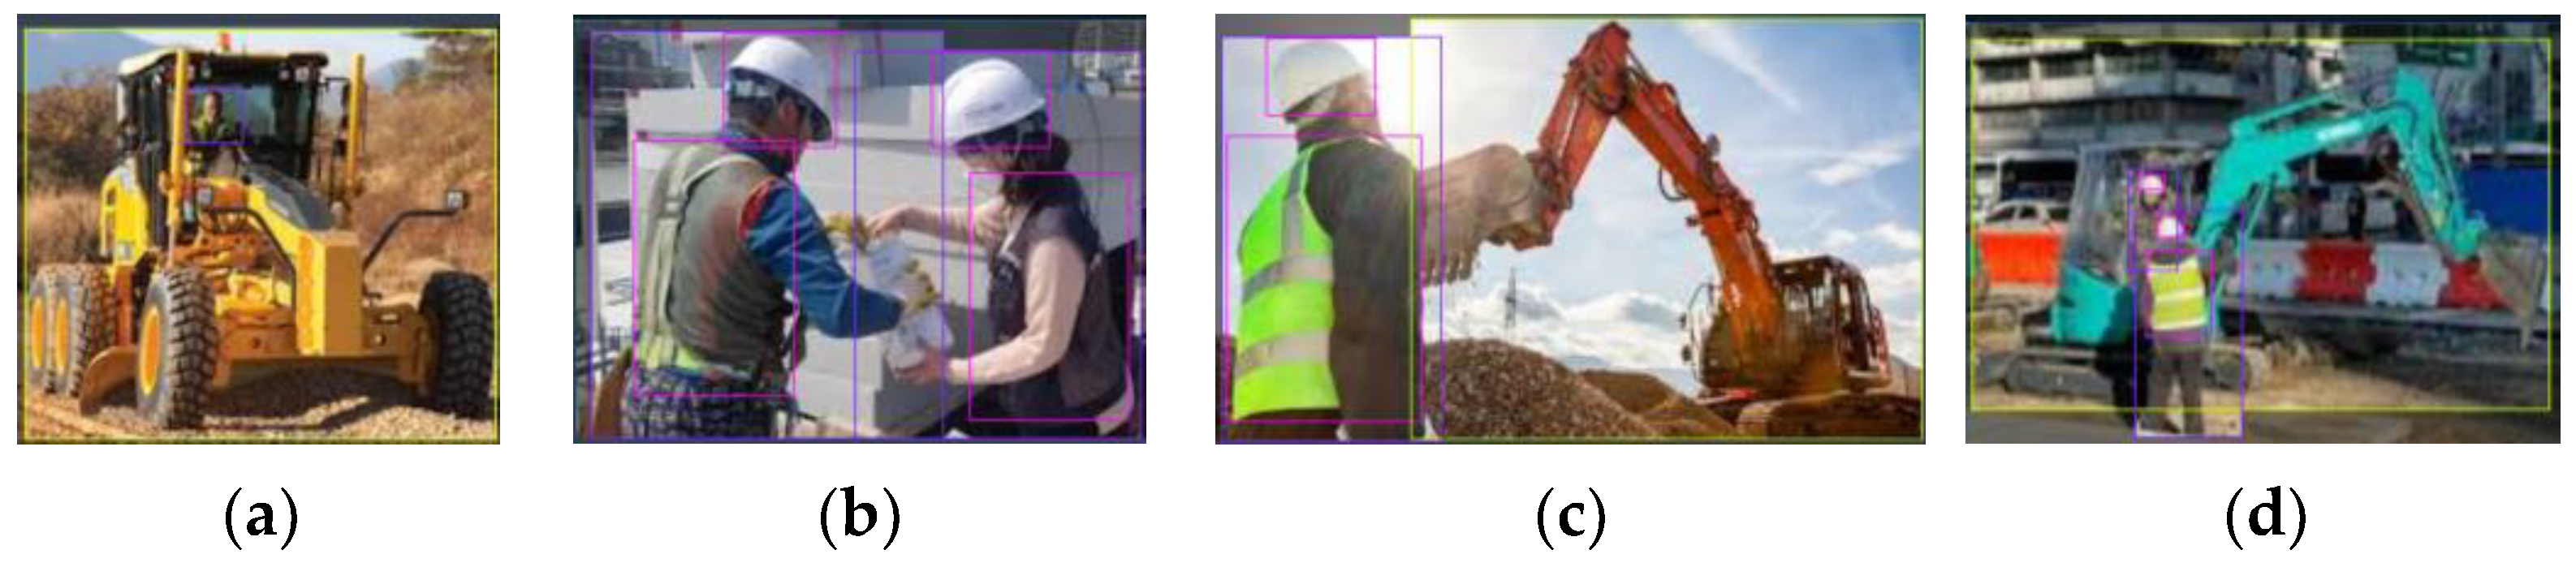
Figure 6 depicts the bounding boxes that are set in the images with multiple classes in the training, validation, and test datasets. In this figure, H, P, and W represent the Heavy, PPE, and Worker classes, respectively, and the number following each initial indicates the number of instances for that class.
6. YOLO Model Implementation
6.1. YOLO Model
The YOLO model applied in this study is available in five different sizes, as listed in
Table 2: nano (N), small (S), medium (M), large (L), and extra-large (xL). The light models have become heavier, whereas the heavy models have become lighter, from YOLO v5 to v8. Heavier models comprise more layers and parameters and can achieve more precise learning with sufficient data; however, they require longer computation times for both training and prediction. The YOLO model tutorial provided by the developers recommends the S and M models for mobile use and the L and xL models for cloud use [
41]. More specific differences between the two YOLO versions and detailed model architecture and features can be found in the relevant websites and literature [
35,
42,
43].
6.2. Key Hyperparameters
Approximately 30 user-configurable options are available for YOLO model training, and the training results vary with the option values. These options are known as hyperparameters. The hyperparameters investigated in this study are described as follows.
6.2.1. Epoch
An epoch refers to a single pass of the entire training dataset for learning. If the number of epochs is too small, underfitting occurs owing to insufficient learning. If the number of epochs is too large, the time required for training increases accordingly, and overfitting to the training data may occur, which will cause the test results with new, unused data to deteriorate [
44]. Therefore, an appropriate epoch value needs to be set to achieve sufficient training while obtaining the best test results. However, this value cannot be known until the dataset has been applied. Thus, the YOLO tutorial recommends an initial 300-epoch. If overfitting occurs, the suggestion is to reduce the number of epochs; otherwise, increase it to 600, 1200, and so forth, while evaluating the learning level to determine the appropriate epoch value [
41].
6.2.2. Learning Rate
The learning rate (Lr) sets the adjustment ratio for improving the parameter values based on the degree of loss in a single learning session. If this value is too high, the loss increases with each learning iteration, which results in divergence with no learning. If the value is too small, the learning proceeds too slowly. Therefore, an appropriate Lr should be set according to the data characteristics [
45]. In YOLO, the default initial Lr is 0.01; however, the recommended initial Lr varies depending on the applied optimizer: 0.01 for stochastic gradient descent (SGD, the default optimizer in YOLO) and 0.001 for Adam, AdamW, and RMSProp.
6.2.3. Lr Scheduler
In deep learning, the initial Lr may no longer result in a loss improvement as the number of epochs increases and training continues. This is because the initial Lr becomes too large for the millions of parameters of the updated or loss-improved training model, which leads to a state in which no further loss improvement can be achieved. In this situation, although changes in some parameters can reduce the loss, changes in others may be too large and increase the loss, resulting in a lower overall accuracy than that of the previous epoch. To overcome this problem, various decaying methods have been developed to adjust the Lr value as the epochs progress [
46].
In YOLO, a linear method is applied by default; the final Lr (lrf) is set to reduce the Lr by a fixed amount in each epoch so that the Lr in the final epoch becomes “initial Lr (lr0)” × “final Lr (lrf)”. Thus, with the same lr0 and lrf settings, if the epoch value is relatively large, the Lr decreases less in each epoch, and conversely, if the epoch value is relatively small, the Lr decreases more in each epoch. In this manner, the accuracy of the learning results is determined by the mutual influence of the epochs and the lr0 and lrf values. No extant method can predict the results in advance because of variability depending on the dataset; therefore, a considerable amount of time and effort is required to determine and apply suitable values through many attempts [
47].
6.2.4. Early Stop Patience
As the number of epochs increases for the training data, the accuracy of the training data continues to improve; however, the accuracy of the validation data, which are not considered in the learning (loss improvement) process, may not improve after a certain epoch. In this case, the overall time required for deep learning can be significantly reduced by applying the early stop condition [
48]. The early stop patience is an integer that is set by the user. The training stops if the accuracy of the validation data in each epoch does not improve for consecutive times equal to this number. In YOLO, the default patience value is 100 for v5 and 50 for v8. If the early stop condition is met during training, the weight values of all parameters in the last epoch and the epoch with the best validation accuracy are saved separately, which can be used for testing or prediction by applying other data.
6.2.5. Hyperparameter Settings
The hyperparameter values are set in the training function of YOLO. The user can set a specific value directly as an argument. If no value is set, the default value of the function is applied. The hyperparameter setting methods differ slightly between YOLO v5 and v8. All hyperparameters of v8 and more than half of the hyperparameters of v5 are set individually; however, the remaining values of v5 are set by a specific designated file that contains various hyperparameter values including the learning rates of lr0 and lrf. In YOLO v5, there are three default files: “hyp.scratch-low.yaml” (Hyp-low), “hyp.scratch-med.yaml” (Hyp-med), and “hyp.scratch-high.yaml” (Hyp-high). Each file has a total of 29 variables, 23 of which have the same values in all three files. The variables with different values are listed in
Table 3. The tutorial provides a description of each variable as listed in
Table 3. It can be observed that Hyp-low and Hyp-med differ in five variables, whereas Hyp-med and Hyp-high differ in only one variable. In YOLO v5, the Hyp-low file is applied by default; however, the user can enter another file name as an argument of the training function. Each value can also be modified within the file. However, in YOLO v8, all parameters are set individually as an argument in the training function without any file format. If training is executed with the default option in v8, the same default values as those in the Hyp-low file of v5 are applied.
6.3. YOLO Experimental Settings
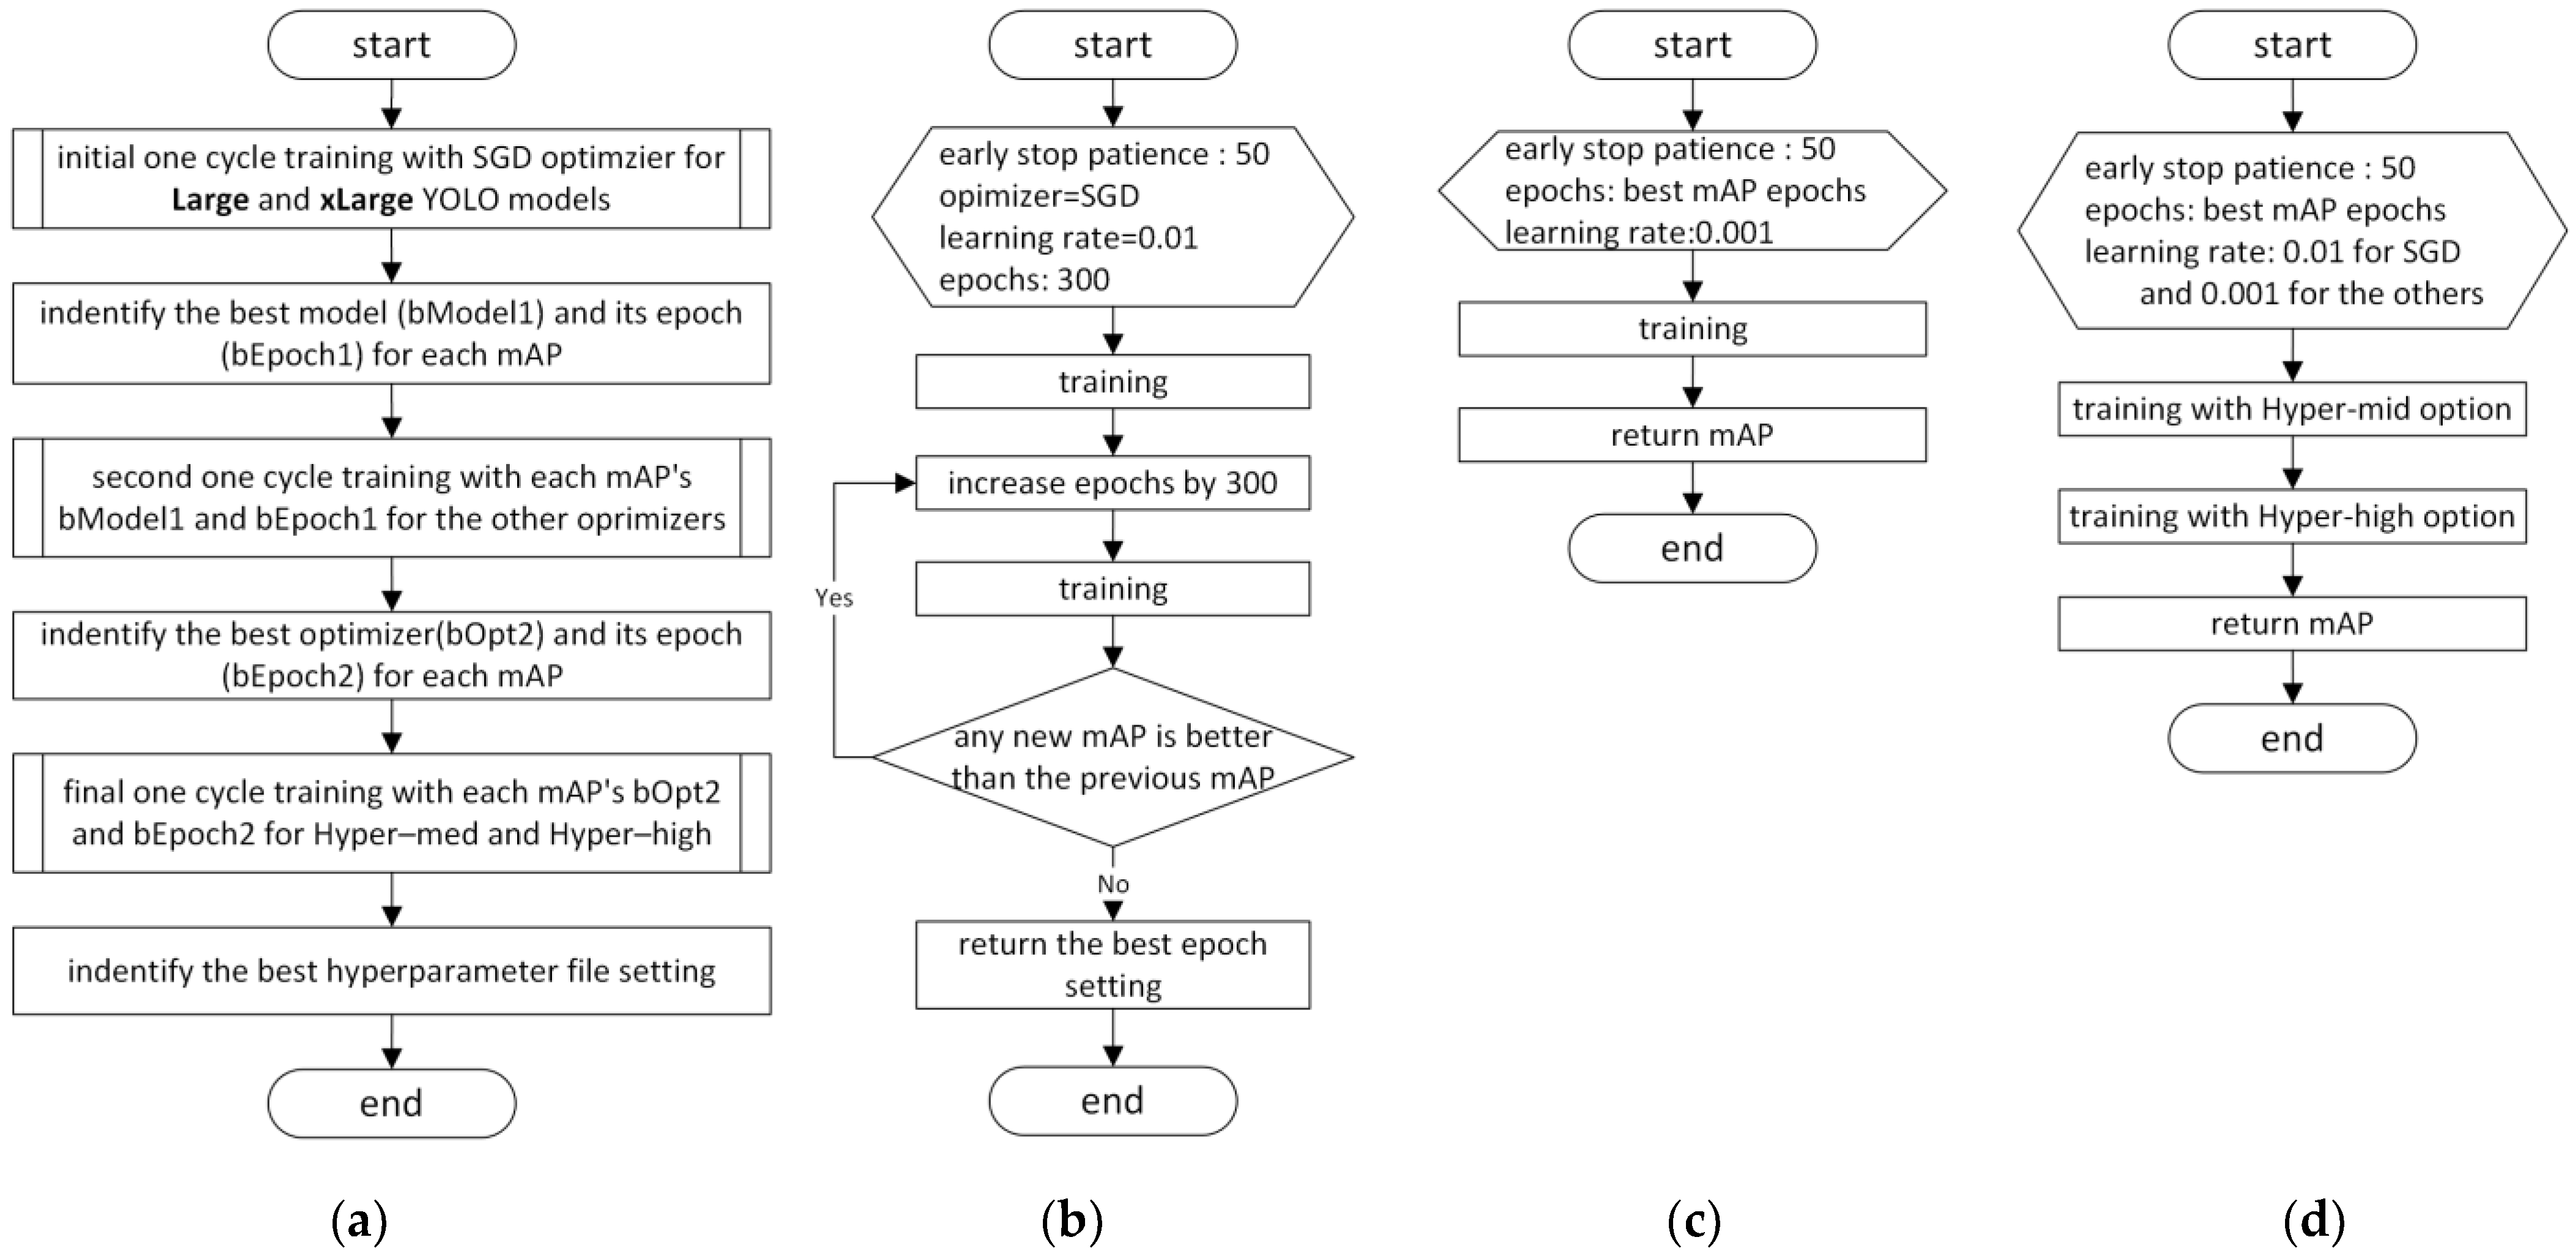
In this study, YOLO v5 and v8 were initially trained under identical conditions, and subsequently, the validation accuracy was improved by altering the learning environment settings with the same procedure for each version. As numerous hyperparameter combinations and other learning environment settings can determine the accuracy of the learning results, the default values and those recommended in the tutorial were applied for the initial training. The main settings and accuracy improvement procedure are illustrated in
Figure 7 and described as follows.
The L and xL YOLO models are used to obtain higher accuracy through more refined learning. The Lr scheduler is a linear method with LambdaLR of PyTorch, which is the default for v5 and v8. For the early stop patience, 50 is selected from the default values of 100 in v5 and 50 in v8, considering the computer running time.
The optimizer initially applied is SGD, which is the default for v5 and v8. The learning rate is set to the recommended value of 0.01. The hyperparameter file in v5 is the default Hyp-low file, the condition of which is identical to the default in v8. The initial epoch value is set to 300, and it increases by 300 until no further improvement in accuracy is observed. The accuracy is compared using both mAP50 and mAP50–95; if either value improves, the epoch increase continues. Following this process, the setting conditions with the highest accuracy for mAP50 and mAP50–95 in both v5 and v8 are identified, yielding a total of four conditions (two for each YOLO version).
These identified conditions are further assessed by applying different optimizers. Adam and AdamW are used in both versions, and RMSProp is additionally applied in v8. The learning rates for the Adam, AdamW, and RMSProp optimizers are all set to the recommended value of 0.001. The results of all optimizers including SGD are compared to determine the best optimizers for mAP50 and mAP50–95 in each YOLO version.
Finally, the default Hyp-med and Hyp-high files in v5 are applied to the models with the best optimizers. In v8, the same variable values as those applied in v5 are assigned as parameters. In this manner, the best setting condition of the optimizer, epochs, and hyperparameter file could be identified under the default and recommended environments.
The above procedure was determined through multiple preliminary experiments. A more systematic approach and higher accuracy may be derived from other methods because many possible combinations of learning condition settings exist.
7. Learning Results and Analysis
The results of the first training, which were mainly based on the default values with epoch changes, are summarized in
Table 4. Training was performed in a CUDA environment using an NVIDIA 40 GB GPU on Google Colab Pro+. The batch size was determined within the maximum range allowed by the memory, which is 32 only for the xL in v5 that has the largest number of parameters as shown in
Table 2 and 64 for the remainder.
Table 4 displays the best epoch value and computer running time for each training according to the initial epochs; a larger best epoch in each YOLO model indicates that more computing time was required.
The accuracy for each dataset is highest in the training dataset that was directly used for learning, followed by the validation dataset that was used as the early stop criterion during the training process, and lowest in the test dataset that was not considered at all during the learning process. The less stringent mAP50 is higher than mAP50–95 in all cases. Moreover, the computing time of the xL model is longer than that of the L model with the same initial epochs in both YOLO versions; however, the accuracy is generally higher in most cases. YOLO v8 required more computing time than v5 in most cases but yielded higher accuracies in all cases.
A comparison of the validation results, which provides the accuracy indicators of the model learning, reveals that the highest accuracy of the two YOLO versions was achieved when using the xL model. In v5, the highest mAP50 and mAP50–95 values were achieved at 900 and 1200 epochs, respectively. In v8, the highest mAP50 and mAP50–95 values were achieved at 600 and 900 epochs, respectively. These four conditions (two for each version) were further applied to the other optimizers, and the results are presented in
Table 5. Although slightly better results are achieved for AdamW in v5, the results of the other optimizers are lower than those of the default SGD in v8.
Table 6 shows the results of reflecting the conditions of the Hyp-med and Hyp-high files in the two models for each YOLO version: epochs of 900 and 1200 with AdamW in v5 and epochs of 600 and 900 with SDG in v8. The results of Hyp-med and Hyp-high are the same in both versions, likely because “copy_paste,” which is the only variable with a different value among the 29 variables as described in
Table 3, did not affect the learning. Compared to the default Hyp-low, the accuracies of mAP50 and mAP50–95 improved in v5, and only the mAP50 improved in v8.
Based on the applied dataset, the highest validation accuracies for mAP50 are 94.7% with AdamW-xL-900-hyp_med in v5 and 95.4% with SGD-xL-600-hyp_med in v8, and the highest accuracies for mAP50–95 are 82.6% with AdamW-xL-1200-hyp_med in v5 and 85.3% with SGD-xL-900-hyp_low in v8. According to the comparison of the two versions, v8 yields higher accuracy than v5. Furthermore, the average of all validation results demonstrates that the mAP50 and mAP50–90 of v8 are 1.4% and 5.3% higher, respectively. The average accuracies of all test data are 1.6% and 5.3% higher in mAP50 and mAP50–90, respectively, for v8.
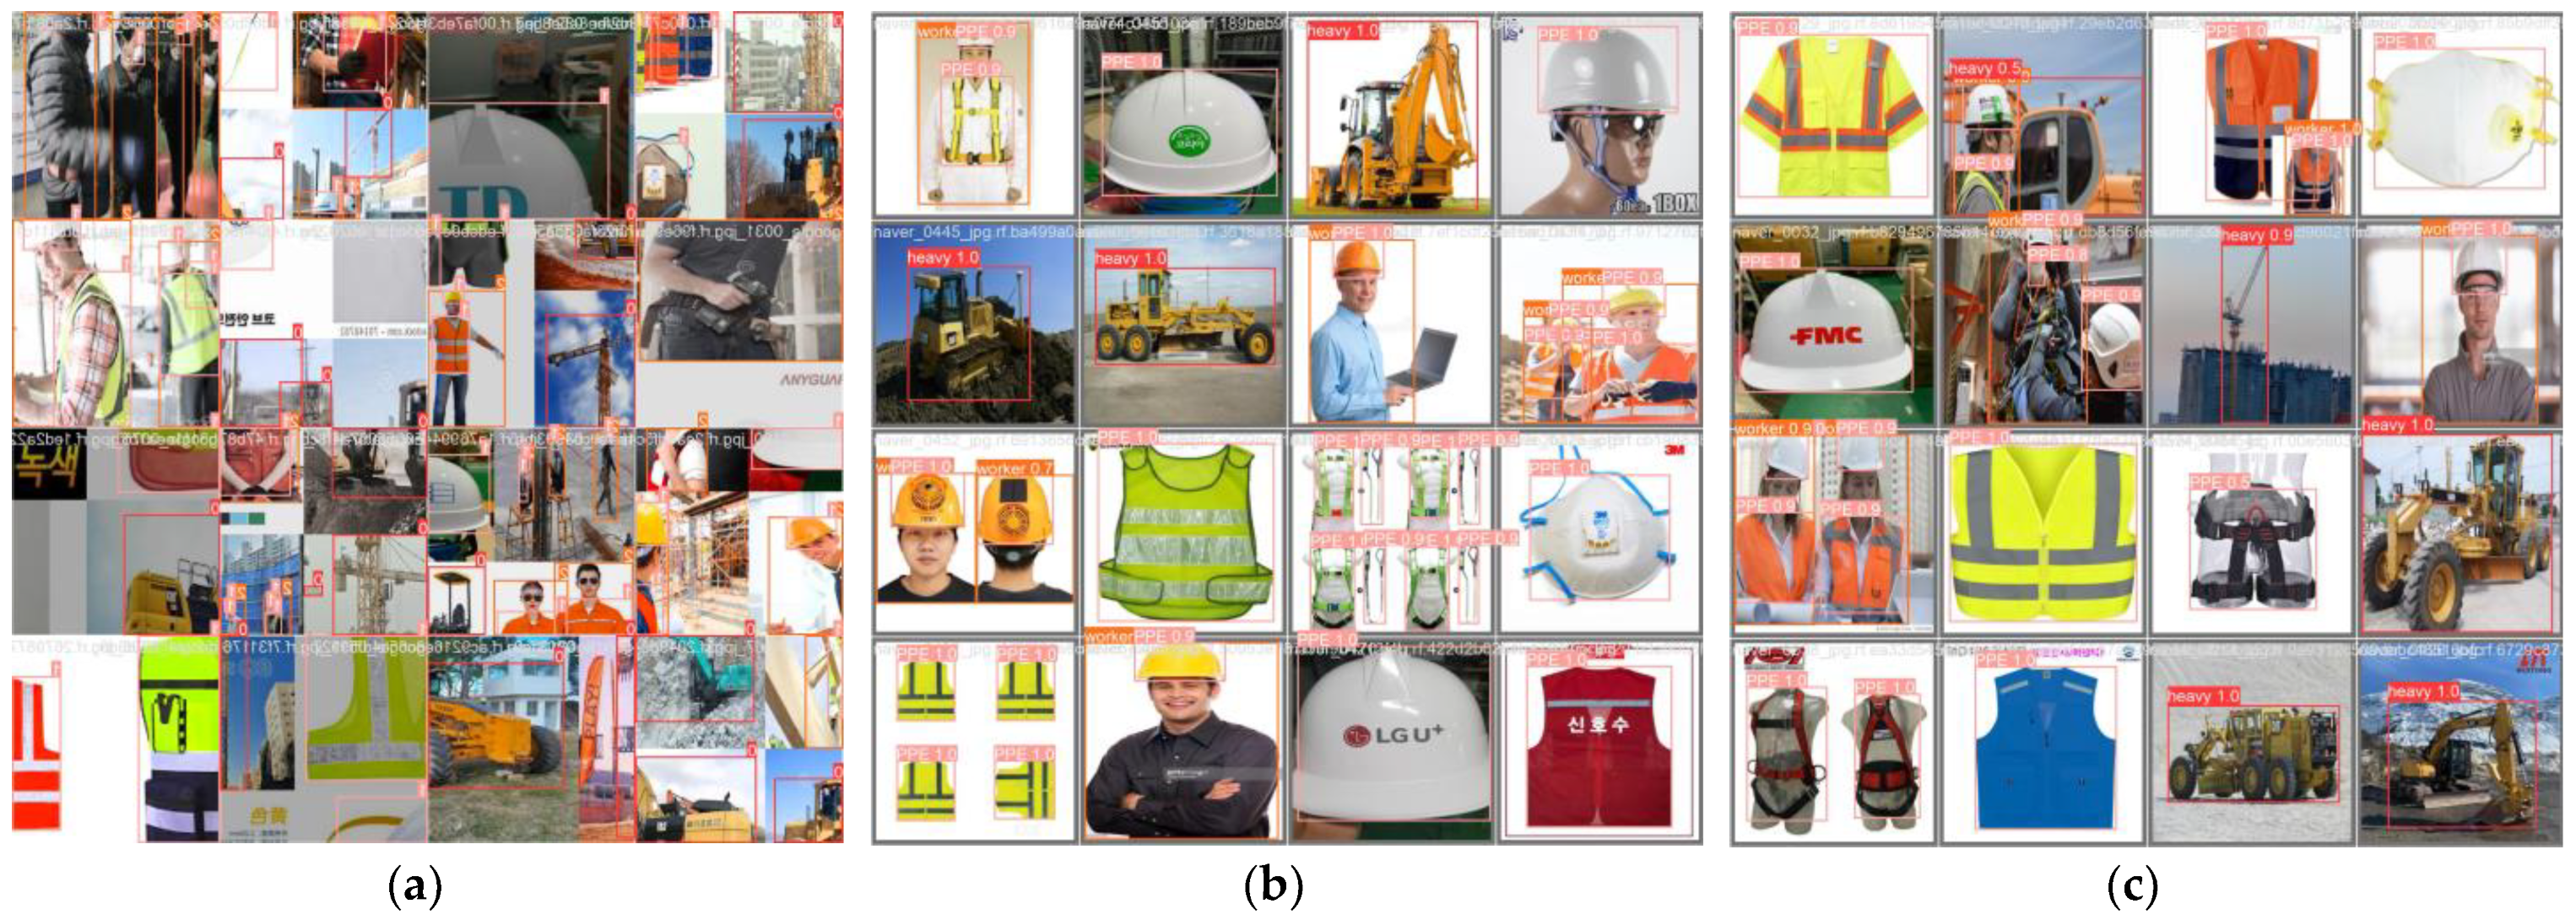
Figure 8 depicts the labeled images that were used in the training and the prediction results of the validation and the test images with SGD-xL-600-hyp_med in v8, which produced the best results for mAP50. Higher confidence results are obtained in simple images with clear shapes, such as hard hats and safety suits, whereas lower confidence results are obtained in images of partial shapes, such as heavy equipment or harnesses.
8. Discussion
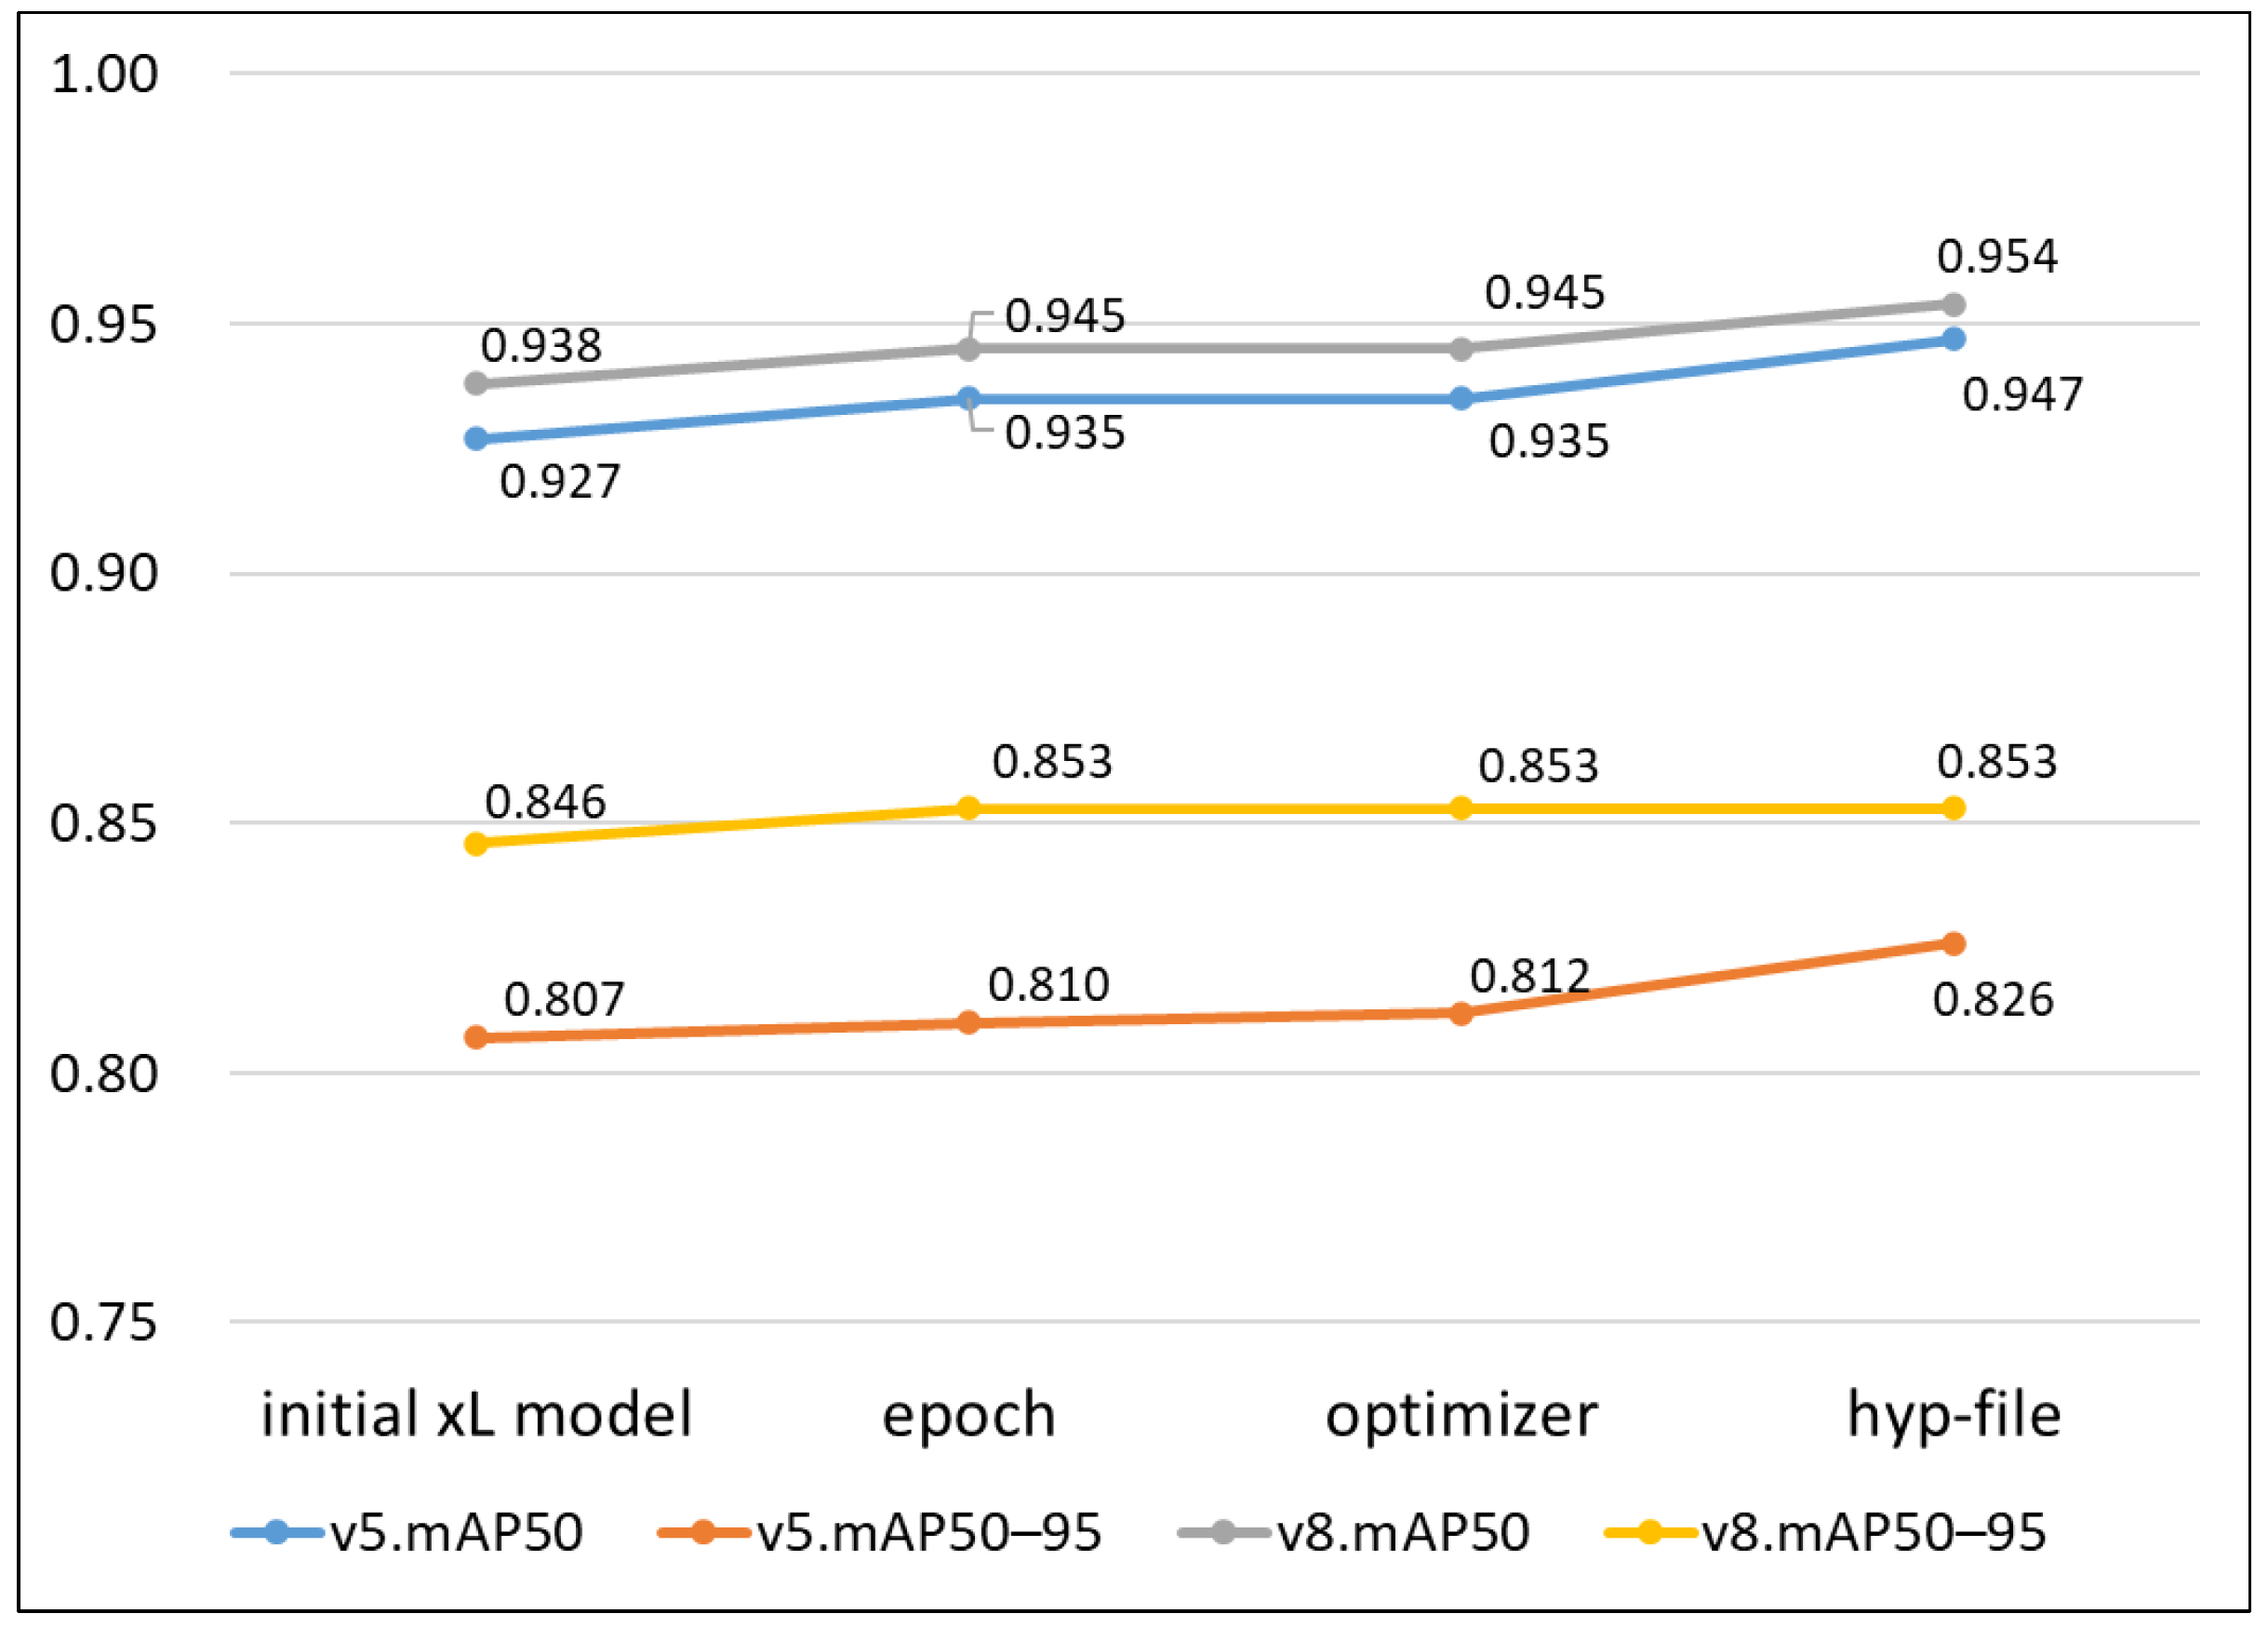
The accuracy improvement achieved by the proposed method on application to the xL models of YOLO v5 and v8 to determine the optimal epoch number, optimizer, and hyperparameter file condition is shown in
Figure 9. Compared to the initial accuracy, mAP50 improved by 2.2% and mAP50–95 by 2.4% in v5, and mAP50 improved by 1.7% and mAP50–95 by 0.8% in v8. It can be seen that more improvement is obtained in v5, which has a lower initial accuracy. Although the changed accuracy itself is not a significant improvement, in learning based on the complicated images used in this study, the change can be a meaningful improvement obtained by adjusting YOLO default conditions and recommended options. In particular, compared to previous studies, the degree of the best accuracy in this study is notable.
Although it is impossible to directly compare the results of this study with those of previous studies due to the different datasets applied, a general comparison of the test results between this study and major previous studies related to construction safety is shown in
Table 7. These previous studies provide mAP50 or precision and recall values as test results. Shen et al. (2021) [
49], who distinguished whether a worker is wearing a helmet or not, which is a relatively simple condition, obtained the highest precision and recall values. This study has the second-highest precision value. For the recall value, the cases of applying Faster R-CNN and YOLO-EfficientNet in Lee et al. (2023) [
50], who distinguish the safety helmet, head, and hat, are followed by the result of this study.
In the case of mAP50, which is calculated by combining precision and recall, it can be seen that recent YOLO models have generally higher accuracy values in detecting construction-safety-related objects than the studies applying other models such as Single Shot Multi-box Detector (SSD) and Faster R-CNN. Among the YOLO models, overall, the newer the YOLO version and the clearer the difference in object shape, the higher the accuracy. Raja (2023) [
51], who reports the highest accuracy, presents the result of a relatively easy learning environment owing to the distinct shape difference between helmets and human heads. Zhang et al. (2023) [
52], who present the next highest accuracy, reflect four classes but classify them by helmets and masks, which can also be easily compared. The accuracy of this study is the third highest, but this can be considered a substantial result considering the relative complexity of the image data considered. Meanwhile, most current studies do not reflect sufficient types of classes needed for construction site safety management, so future research should expand the scope to reflect more types of classes.
Table 7.
General comparison between test results of related studies.
Table 7.
General comparison between test results of related studies.
| Reference | Model | Precision | Recall | mAP50 | Number of
Images | Number of
Classes | Class Type |
|---|
| Wu et al. (2019) [53] | SSD | - | - | 0.839 | 3714 | 5 | four colored safety helmets, none |
| Wang et al. (2019) [54] | Faster R-CNN | - | - | 0.926 | 2410 | 6 | dump truck, excavator, loader, mixer truck, roller, worker |
| Li et al. (2020) [55] | SSD-MobileNet | 0.95 | 0.77 | - | 3261 | 2 | safety helmet wearing |
| Nath et al. (2020) [10] | YOLO v3 | - | - | 0.723 | 1372 | 4 | worker with safety helmet, vest, both, none |
| Shen et al. (2021) [49] | a self-developed model | 0.962 | 0.962 | - | 18,800 | 2 | safety helmet wearing |
| Cho et al. (2021) [11] | a self-developed model | - | - | 0.792 | 2592 | 3 | worker, concrete mixer truck, dump truck |
| Han et al. (2021) [56] | a self-developed model based on SSD | - | - | 0.881 | 3174 | 2 | safety helmet wearing |
| Kang et al. (2021) [12] | YOLO v3 | - | - | 0.829 | 896 | 2 | heavy construction equipment, worker |
| Ferdous and Ahsan (2022) [17] | YOLOX | - | - | 0.898 | 1699 | 8 | four colored safety helmets, vest, safety glass, worker body, worker head |
| Kim and Park (2021) [18] | YOLO v5 | - | - | 0.913 | 45,354 | 3 | worker, safety helmet, mask |
| Wang et al. (2021) [57] | YOLO v5 | | | 0.866 | 1330 | 6 | four colored safety helmets, person, vest |
| Hayat and Morgado-Dias (2022) [19] | YOLO v5 | - | - | 0.924 | 5000 | 2 | safety helmet, worker head |
| Alateeq et al. (2023) [20] | YOLO v5 | 0.906 | 0.767 | 0.831 | 826 | 3 | worker, safety helmet, vest |
| 0.879 | 0.882 | 0.920 | 6338 | 7 | bulldozer, dump truck, excavator, grader, loader, mobile crane, roller |
| Lee et al. (2023) [50] | Faster R-CNN | 0.849 | 0.935 | 0.918 | 21,568 | 3 | safety helmet, head, hat |
| YOLO v5 | 0.955 | 0.858 | 0.917 |
| RetinaNet | 0.264 | 0.138 | 0.201 |
| YOLO-EfficientNet | 0.942 | 0.933 | 0.914 |
| Lung et al. (2023) [58] | SSD | 0.937 | 0.360 | - | 421 | 3 | heavy construction equipment, worker, rebar |
| Raja (2023) [51] | YOLO v8 | - | - | 0.956 | 5000 | 2 | safety helmet, worker head |
| Zhang et al. (2023) [52] | Faster R-CNN | - | - | 0.706 | 12,000 | 4 | worker with safety helmet, mask, both, none |
| YOLO v5 | - | - | 0.905 |
| YOLO v4 | - | - | 0.932 |
| a self-developed model based on YOLO v4 | - | - | 0.955 |
| This study | YOLO v5 | 0.961 | 0.884 | 0.941 | 4844 | 3 | heavy construction equipment, worker, PPE |
| YOLO v8 | 0.959 | 0.889 | 0.951 |
9. Conclusions
Safety at construction sites is a top priority for project managers, and extensive investments have been made in management and technology to reduce accidents. However, the construction industry has higher accident and fatality rates than other industries owing to time and cost pressures as well as hazardous working environments. This study was conducted as a preliminary attempt to apply computer vision technology, a subset of AI, to reduce accidents at construction sites. The main research achievements are as follows:
- (i)
Images collected through web crawling are labeled by the researchers to construct a dataset comprising 10,181 objects from 4844 images, including 2212 heavy equipment, 5614 PPE, and 2355 workers images.
- (ii)
A consistent process for improving the prediction accuracy through changes in the epochs, optimizers, and hyperparameters is proposed by applying the constructed dataset to YOLO v5 and v8.
- (iii)
The final validation and test accuracies obtained are sufficiently competitive compared to those reported by previous studies that have applied computer vision in construction safety management.
- (iv)
Based on the applied dataset, the results for both YOLO v5 and v8 consistently demonstrate that the xL model, which is the heaviest, requires more computing time than the L model but provides higher accuracy.
- (v)
When the same procedure is applied to v5, which has exhibited high accuracies in various works, and the recently released v8, the results of v8 are superior based on the dataset used in this study.
This study preliminarily verified the feasibility of using computer vision at construction sites by setting three classes on the basis of the findings of similar prior studies. In the future, additional images should be collected and accurately labeled to construct a high-quality dataset that reflects various classes at construction sites. Moreover, higher-performance automatic optimization methods should be developed for the accuracy improvement process, which requires extensive manual work to set the values, verify the results, and change the codes. Advancements in these computer vision techniques can be used for various sophisticated management tools at construction sites to improve the work process, quality control, and progress management in addition to safety management, in combination with BIM, robotics, drones, and other technologies.
Author Contributions
Methodology, K.K. (Kyunghwan Kim); validation, K.K. (Kyunghwan Kim); investigation, K.K. (Kyunghwan Kim), K.K. (Kangeun Kim) and S.J.; data curation, K.K. (Kyunghwan Kim), K.K. (Kangeun Kim) and S.J.; writing—original draft, K.K. (Kyunghwan Kim), K.K. (Kangeun Kim) and S.J.; supervision, K.K. (Kyunghwan Kim). All authors have read and agreed to the published version of the manuscript.
Funding
This work was supported by the National Research Foundation of Korea (NRF) grant funded by the Korean government (MSIT) (No. 2021R1F1A1063286).
Institutional Review Board Statement
Not applicable.
Informed Consent Statement
Not applicable.
Data Availability Statement
Not applicable.
Conflicts of Interest
The authors declare no conflict of interest.
References
- Wadsworth, E.; Walters, D. Safety and Health at the Heart of the Future of Work: Building on 100 Years of Experience; International Labour Office: Geneva, Switzerland, 2019. [Google Scholar]
- Patel, V.; Chesmore, A.; Legner, C.M.; Pandey, S. Trends in workplace wearable technologies and connected-worker solutions for next-generation occupational safety, health, and productivity. Adv. Intell. Syst. 2022, 4, 2100099. [Google Scholar] [CrossRef]
- Ministry of Employment and Labor. Analysis of Industrial Accident Status in 2021; Ministry of Employment and Labor: Sejoing-si, Republic of Korea, 2022; pp. 9–35. [Google Scholar]
- Maliha, M.N.; Abu Aisheh, Y.I.; Tayeh, B.A.; Almalki, A. Safety barriers identification, classification, and ways to improve safety performance in the architecture, engineering, and construction (AEC) industry: Review study. Sustainability 2021, 13, 3316. [Google Scholar] [CrossRef]
- Lee, H. Artificial Intelligence Trends in 2022; The Export-Import Bank of Korea: Seoul, Republic of Korea, 2022. [Google Scholar]
- Kim, J.; Noh, H.; Lee, Y.; Kim, K. Analysis of Artificial Intelligence Technology in the Construction Industry and Suggestion of Future Direction. In Proceedings of the KICEM Annual Conference 2021, Seoul, Republic of Korea, 16–19 November 2021; Volume 20, pp. 175–176. [Google Scholar]
- Lee, D. Artificial Intelligence in Construction Industry and Future Research Direction. Build. Constr. 2021, 21, 14–20. [Google Scholar]
- Fang, W.; Ding, L.; Zhong, B.; Love, P.E.; Luo, H. Automated detection of workers and heavy equipment on construction sites: A convolutional neural network approach. Adv. Eng. Inform. 2018, 37, 139–149. [Google Scholar] [CrossRef]
- Kim, J. A Study on the Classification of Risk Factors for Image Recognition Technology Application in Construction. Master’s Thesis, The Graduate School of Chung-Ang University, Seoul, Republic of Korea, 2019. [Google Scholar]
- Nath, N.D.; Behzadan, A.H.; Paal, S.G. Deep learning for site safety: Real-time detection of personal protective equipment. Autom. Constr. 2020, 112, 103085. [Google Scholar] [CrossRef]
- Cho, Y.; Kang, K.; Son, B.; Ryu, H. Extraction of Workers and Heavy Equipment and Multi-Object Tracking using Surveillance System in Construction Sites. J. Korea Inst. Build. Constr. 2021, 21, 397–408. [Google Scholar] [CrossRef]
- Kang, T.; Kim, B.; Jung, Y. Deep learning platform architecture for monitoring image-based real-time construction site equipment and worker. KIBIM Mag. 2021, 11, 24–32. [Google Scholar] [CrossRef]
- Isa, I.; Rosli, M.; Yusof, U.; Maruzuki, M.; Sulaiman, S. Optimizing the Hyperparameter Tuning of YOLOv5 for Underwater Detection. IEEE Access 2022, 10, 52818–52831. [Google Scholar] [CrossRef]
- Lei, F.; Tang, F.; Li, S. Underwater Target Detection Algorithm Based on Improved YOLOv5. J. Mar. Sci. Eng. 2022, 10, 310. [Google Scholar] [CrossRef]
- Kang, S.; Lee, K.; Yoo, W.; Shin, Y.; Lee, M. Accuracy Analysis of Construction Worker’s Protective Equipment Detection Using Computer Vision Technology. J. Korea Inst. Build. Constr. 2023, 23, 81–91. [Google Scholar] [CrossRef]
- Lee, Y.; Kim, Y. Comparison of CNN and YOLO for Object Detection. J. Semicond. Disp. Technol. 2020, 19, 85–92. [Google Scholar]
- Ferdous, M.; Ahsan, S.M.M. PPE detector: A YOLO-based architecture to detect personal protective equipment (PPE) for construction sites. PeerJ Comput. Sci. 2022, 8, e999. [Google Scholar] [CrossRef]
- Kim, H.; Park, T. Detection of Wearing a Protective Gear and Entering Hazardous Areas of Worker in Construction Site using YOLO. In Proceedings of the Conference on Information and Control Systems 2021, Yeosu, Republic of Korea, 20–23 October 2021; pp. 458–459. [Google Scholar]
- Hayat, A.; Morgado-Dias, F. Deep learning-based automatic safety helmet detection system for construction safety. Appl. Sci. 2022, 12, 8268. [Google Scholar] [CrossRef]
- Alateeq, M.M.; Rajeena, F.P.P.; Ali, M.A.S. Construction Site Hazards Identification Using Deep Learning and Computer Vision. Sustainability 2023, 15, 2358. [Google Scholar] [CrossRef]
- Tabian, I.; Fu, H.; Sharif, K. A Convolutional Neural Network for Impact Detection and Characterization of Complex Composite Structures. Sensors 2019, 19, 4933. [Google Scholar] [CrossRef]
- Zou, Z.; Chen, K.; Shi, Z.; Guo, Y.; Ye, J. Object detection in 20 years: A survey. arXiv 2023, arXiv:1905.05055. [Google Scholar] [CrossRef]
- Girshick, R.; Donahue, J.; Darrell, T.; Malik, J. Rich feature hierarchies for accurate object detection and semantic segmentation. In Proceedings of the 2014 IEEE Conference on Computer Vision and Pattern Recognition, Columbus, OH, USA, 23–28 June 2014; pp. 580–587. [Google Scholar]
- Girshick, R. Fast R-CNN. In Proceedings of the 2015 IEEE International Conference on Computer Vision, Santiago, Chile, 7–13 December 2015; pp. 1440–1448. [Google Scholar]
- Ren, S.; He, K.; Girshick, R.; Sun, J. Faster R-CNN: Towards real-time object detection with region proposal networks. Adv. Neural Inf. Process. Syst. 2015, 28. [Google Scholar] [CrossRef] [PubMed]
- He, K.; Gkioxari, G.; Dollar, P.; Girshick, R. Mask r-cnn. In Proceedings of the 2017 IEEE International Conference on Computer Vision, Venice, Italy, 22–29 October 2017; pp. 2961–2969. [Google Scholar]
- Redmon, J.; Divvala, S.; Girshick, R.; Farhadi, A. You only look once: Unified, real-time object detection. In Proceedings of the 2016 IEEE Conference on Computer Vision and Pattern Recognition, Las Vegas, NV, USA, 27–30 June 2016; pp. 779–788. [Google Scholar]
- Redmon, J.; Farhadi, A. YOLO9000: Better, faster, stronger. In Proceedings of the 2017 IEEE Conference on Computer Vision and Pattern Recognition, Honolulu, HI, USA, 21–26 July 2017; pp. 7263–7271. [Google Scholar]
- Redmon, J.; Farhadi, A. Yolov3: An incremental improvement. arXiv 2018, arXiv:1804.02767. [Google Scholar]
- Bochkovskiy, A.; Wang, C.Y.; Liao HY, M. Yolov4: Optimal speed and accuracy of object detection. arXiv 2020, arXiv:2004.10934. [Google Scholar]
- YOLOv5: The Friendliest AI Architecture You’ll Ever Use. Available online: https://ultralytics.com/yolov5 (accessed on 21 September 2023).
- Li, C.; Li, L.; Jiang, H.; Weng, K.; Geng, Y.; Li, L.; Ke, Z.; Li, Q.; Cheng, M.; Nie, W.; et al. YOLOv6: A single-stage object detection framework for industrial applications. arXiv 2022, arXiv:2209.02976. [Google Scholar]
- Wang, C.Y.; Bochkovskiy, A.; Liao, H.Y.M. YOLOv7: Trainable bag-of-freebies sets new state-of-the-art for real-time object detectors. arXiv 2022, arXiv:2207.02696. [Google Scholar]
- Ultralytics YOLOv8: The State-of-the-Art YOLO Model. Available online: https://ultralytics.com/yolov8 (accessed on 21 September 2023).
- Hussain, M. YOLO-v1 to YOLO-v8, the Rise of YOLO and Its Complementary Nature toward Digital Manufacturing and Industrial Defect Detection. Machines 2023, 11, 677. [Google Scholar] [CrossRef]
- Zhang, H.; Tian, M.; Shao, G.; Cheng, J.; Liu, J. Target Detection of Forward-Looking Sonar Image Based on Improved YOLOv5. IEEE Access 2022, 10, 18023–18034. [Google Scholar] [CrossRef]
- Wang, C.; Chen, Y.; Zhang, S.; Zhang, Q. Stock market index prediction using deep Transformer model. Expert Syst. Appl. 2022, 208, 118128. [Google Scholar] [CrossRef]
- Padilla, R.; Netto, S.L.; Da Silva, E.A. A survey on performance metrics for object-detection algorithms. In Proceedings of the 2020 International Conference on Systems, Signals and Image Processing (IWSSIP), Niterói, Brazil, 1–3 July 2020; pp. 237–242. [Google Scholar]
- Zhu, H.; Wei, H.; Li, B.; Yuan, X.; Kehtarnavaz, N. A review of video object detection: Datasets, metrics and methods. Appl. Sci. 2020, 10, 7834. [Google Scholar] [CrossRef]
- Padilla, R.; Passos, W.L.; Dias, T.L.; Netto, S.L.; Da Silva, E.A. A comparative analysis of object detection metrics with a companion open-source toolkit. Electronics 2021, 10, 279. [Google Scholar] [CrossRef]
- Tips for Best Training Results. Available online: https://docs.ultralytics.com/yolov5/tutorials/tips_for_best_training_results/ (accessed on 20 April 2023).
- Comprehensive Guide to Ultralytics YOLOv5. Available online: https://docs.ultralytics.com/yolov5/ (accessed on 21 September 2023).
- What is YOLOv8? The Ultimate Guide. Available online: https://blog.roboflow.com/whats-new-in-yolov8/ (accessed on 21 September 2023).
- Nam, D.; Cho, J. Deep neural network design for modeling individual-level travel mode choice behavior. Sustainability 2020, 12, 7481. [Google Scholar] [CrossRef]
- Géron, A. Hands-on Machine Learning with Scikit-Learn, Keras, and TensorFlow; O’Reilly Media, Inc.: Sebastopol, CA, USA, 2022. [Google Scholar]
- Konar, J.; Khandelwal, P.; Tripathi, R. Comparison of various learning rate scheduling techniques on convolutional neural network. In Proceedings of the 2020 IEEE International Students’ Conference on Electrical, Electronics and Computer Science (SCEECS), Bhopal, India, 22–23 February 2020; pp. 1–5. [Google Scholar]
- Zahedi, L.; Mohammadi, F.G.; Rezapour, S.; Ohland, M.W.; Amini, M.H. Search algorithms for automated hyper-parameter tuning. arXiv 2021, arXiv:2104.14677. [Google Scholar]
- Muhammad, A.R.; Utomo, H.P.; Hidayatullah, P.; Syakrani, N. Early Stopping Effectiveness for YOLOv4. J. Inf. Syst. Eng. Bus. Intell. 2022, 8, 11–20. [Google Scholar] [CrossRef]
- Shen, J.; Xiong, X.; Li, Y.; He, W.; Li, P.; Zheng, X. Detecting safety helmet wearing on construction sites with bounding-box regression and deep transfer learning. Comput. Aided Civ. Infrastruct. Eng. 2021, 36, 180–196. [Google Scholar] [CrossRef]
- Lee, J.Y.; Choi, W.S.; Choi, S.H. Verification and performance comparison of CNN-based algorithms for two-step helmet-wearing detection. Expert Syst. Appl. 2023, 225, 120096. [Google Scholar] [CrossRef]
- Raja, M.C. Utilizing YOLO 8x Models, Deep Learning-Based Head protector Detection for Construction Workers. Res. Sq. 2023. under review. [Google Scholar] [CrossRef]
- Zhang, Z.; Tang, Y.; Yang, Y.; Yan, C. Safety Helmet and Mask Detection at Construction Site Based on Deep Learning. In Proceedings of the 2023 IEEE 3rd International Conference on Information Technology, Big Data and Artificial Intelligence (ICIBA), Chongqing, China, 26–28 May 2023; Volume 3, pp. 990–995. [Google Scholar]
- Wu, J.; Cai, N.; Chen, W.; Wang, H.; Wang, G. Automatic detection of hardhats worn by construction personnel: A deep learning approach and benchmark dataset. Autom. Constr. 2019, 106, 102894. [Google Scholar] [CrossRef]
- Wang, M.; Wong, P.; Luo, H.; Kumar, S.; Delhi, V.; Cheng, J. Predicting safety hazards among construction workers and equipment using computer vision and deep learning techniques. In Proceedings of the ISARC International Symposium on Automation and Robotics in Construction, Banff, AL, Canada, 21–24 May 2019; ISARC Publications: Mumbai, India; Volume 36, pp. 399–406. [Google Scholar]
- Li, Y.; Wei, H.; Han, Z.; Huang, J.; Wang, W. Deep learning-based safety helmet detection in engineering management based on convolutional neural networks. Adv. Civ. Eng. 2020, 2020, 9703560. [Google Scholar] [CrossRef]
- Han, G.; Zhu, M.; Zhao, X.; Gao, H. Method based on the cross-layer attention mechanism and multiscale perception for safety helmet-wearing detection. Comput. Electr. Eng. 2021, 95, 107458. [Google Scholar] [CrossRef]
- Wang, Z.; Wu, Y.; Yang, L.; Thirunavukarasu, A.; Evison, C.; Zhao, Y. Fast personal protective equipment detection for real construction sites using deep learning approaches. Sensors 2021, 21, 3478. [Google Scholar] [CrossRef]
- Lung, L.W.; Wang, Y.R. Applying Deep Learning and Single Shot Detection in Construction Site Image Recognition. Buildings 2023, 13, 1074. [Google Scholar] [CrossRef]
| Disclaimer/Publisher’s Note: The statements, opinions and data contained in all publications are solely those of the individual author(s) and contributor(s) and not of MDPI and/or the editor(s). MDPI and/or the editor(s) disclaim responsibility for any injury to people or property resulting from any ideas, methods, instructions or products referred to in the content. |
© 2023 by the authors. Licensee MDPI, Basel, Switzerland. This article is an open access article distributed under the terms and conditions of the Creative Commons Attribution (CC BY) license (https://creativecommons.org/licenses/by/4.0/).


