1. Introduction
Sustainable development is considered a key focus of the contemporary built environment industry [
1,
2,
3,
4,
5]. Evidence-based design and decision making are widely promoted as tools for achieving sustainable development goals. However, a key challenge that environmental design practitioners and policymakers are facing in practice is a lack of evidence [
6]. This poses difficulties in making informed design decisions and developing effective policies. It is argued that the environmental design profession and industry need a greater amount of and more robust evidence to support their design and planning decisions, and thereby make sure the built environments can function as they were expected [
7,
8,
9,
10]. Despite some progress, many of the design and planning decisions made today are still not sufficiently supported by empirical evidence [
6,
11]. This means that, as a profession, our collective understanding of how built environments and planning projects actually perform in reality is still limited [
12,
13,
14,
15]. In order to achieve a deeper understanding of the actual performance of built projects, it has been argued that the performance of completed projects should be evaluated to provide empirical evidence, thereby informing future design and planning practice [
8,
9,
15,
16,
17,
18,
19,
20,
21,
22,
23].
However, even if the performance evaluation of built projects is considered highly important, it remains rare in practice [
11,
12,
13,
15,
24,
25]. One of the key barriers preventing the implementation of such evaluations is a lack of knowledge and skills in conducting an evaluation. It is argued that environmental design and planning practitioners often lack the capability to conduct an evaluation [
22,
25]. Similar ideas are also expressed in detail by others. Vischer [
23] states that inadequate skills in conducting evaluations are a core barrier preventing its implementation. Zimmerman and Martin [
26] note that a lack of agreed and reliable evaluation approaches is a major stumbling block to evaluation implementation. It is further commented by other scholars that evaluation skills are often excluded from the professional curricula of environmental designers and planners, which may lead to a low capability of conducting an evaluation [
26,
27,
28]. As a landscape architecture practitioner, Hardy [
29] similarly commented that there are very limited resources available for landscape architects regarding evaluation methodology, making it challenging for them to conduct evaluations and assess the actual performance of their past design projects.
In order to make landscape performance evaluation practices more accessible to a broader range of audiences and to make future evaluations more rigorous, the Landscape Architecture Foundation (LAF) commissioned a study to map the methodological terrain of 148 evaluation studies conducted under the Case Study Investigation (CSI) programme, an LAF-funded and managed research initiative that specifically focuses on landscape performance evaluation [
16]. The LAF study analysed the methodology documents of the 148 CSI cases and developed a guidebook, in which a wide range of performance indicators and evaluation methods were documented to help future evaluators plan and conduct their evaluations. The CSI initiative is the most influential research programme in the field of landscape performance evaluation and was a representative example of one of the two most viable evaluation mechanisms identified by Chen et al. [
30].
As reported by Chen, Bowring, and Davis [
30], apart from the evaluation cases that were undertaken under the CSI’s benefits-oriented evaluation mechanism, there are also a wide range of cases that were evaluated under a different mechanism, adopting a financially and institutionally independent approach. However, there is no similar study mapping the methodological terrain of the cases conducted beyond the CSI mechanism. As the CSI evaluation cases were all undertaken in a very standardised way, the methodological terrain mapped for the CSI studies may not be able to represent the wide spectrum of evaluation practices. Therefore, it would also be useful to carry out a study similar to the “terrain mapping” study commissioned by the LAF but investigate a larger variety of evaluation cases. Based on a previous study undertaken by Chen, Bowring, and Davis [
30], which analysed the funding sources and evaluator types of a representative set of New Zealand evaluation cases, this research further investigated the same set of cases to examine how “success” is defined and evaluated in practice.
2. Methods and Results
As explained in the introduction, this study is based on a representative range of cases collected in a 2021 study carried out by Chen, Bowring, and Davis [
30]. The methods adopted in this research, therefore, are the same as those used in the previous study, as outlined below.
This study employed a “sequential” case study approach [
31,
32] to explore the breadth of the methodological terrain of evaluation practices. The goal of adopting a “sequential” approach was to gradually build an overall understanding of the methodological diversity by studying a manageable number of cases. The size of the case sample was determined by following a “data saturation” approach [
31,
32,
33] to maximise the range of studied cases while minimising the effort. Data saturation, indicating the point where few new findings emerge, was determined by coding the final 10% of collected cases without using new codes (i.e., the case-collecting process continued until no new findings appeared). Materials containing case information were collected from various sources including both the academic and grey literature to ensure the representativeness and diversity of the cases collected. The case-collecting procedure commenced with a database search, employing a combination of synonyms or pertinent terms of “performance evaluation”, “landscape architecture”, and “New Zealand”. As the analysis of the initially identified cases unfolded, new themes, keywords, and avenues for acquiring new cases emerged, thereby informing the subsequent case-collecting process. Every case uncovered during this process was deemed eligible for inclusion in the case collection, provided it pertained to performance evaluation in the context of New Zealand, specifically within the domains of landscape architecture or closely related fields, and concurrently possessed researchable information. The collected case materials were then first open-coded to identify key themes and ideas related to the evaluation models, methods, and results of the cases. This open coding process resulted in 152 initial codes, which were later examined for relationships and hierarchical connections through axial coding. In this process, 152 initial codes were grouped, edited, merged, and structured into 109 final codes. During the coding process, some information gaps in the originally collected materials were identified, leading to further case investigations through various channels, such as academic databases, libraries, and email communications.
This research collected a total of 41 cases, which are diverse in terms of their locations, project types, the time of project completion, and the time of evaluation. By achieving data saturation, these cases provide a comprehensive overview of the landscape performance evaluation practices in New Zealand. The key characteristics associated with the way “success” was defined and evaluated include the models and methods of the evaluations, the objects being assessed, as well as the “sentiment” of the evaluation results.
2.1. Evaluation Models
Evaluation models, serving as the foundation of the evaluation methodology, are often a determinant indicator of how “success” is defined and assessed in an evaluation. According to Bowring [
24] and Deming and Swaffield [
34], practices assessing landscape performance, which normally serve a normative purpose, often involve comparing the actual performance of a project with the performance of an “ideal” project, or in other words, requires specific standards or criteria for comparison. In a previous study conducted by Chen et al. [
35], the authors examined the commonly regarded benchmarks that scholars and practitioners typically considered as the “ideal condition”, “standards”, or “criteria” when conducting performance evaluations. Through their investigation, Chen, Bowring, and Davis [
35] identified four distinct types of benchmarks that emerged in performance evaluations: satisfaction, goals, norms, and performance. The satisfaction model determines the “success” by assessing the satisfaction level of the interested parties. The goal model examines whether the built projects meet their design intentions. The norm model adopts pre-established external norms without considering the project’s goals and the satisfaction of specific groups. In comparison with the other models, the performance model tends to be more holistic and general in terms of the way of defining “success” and may take into account multiple factors including satisfaction, design intentions, as well as certain norms. This paper adopts this categorising framework to examine the evaluation models of the collected cases.
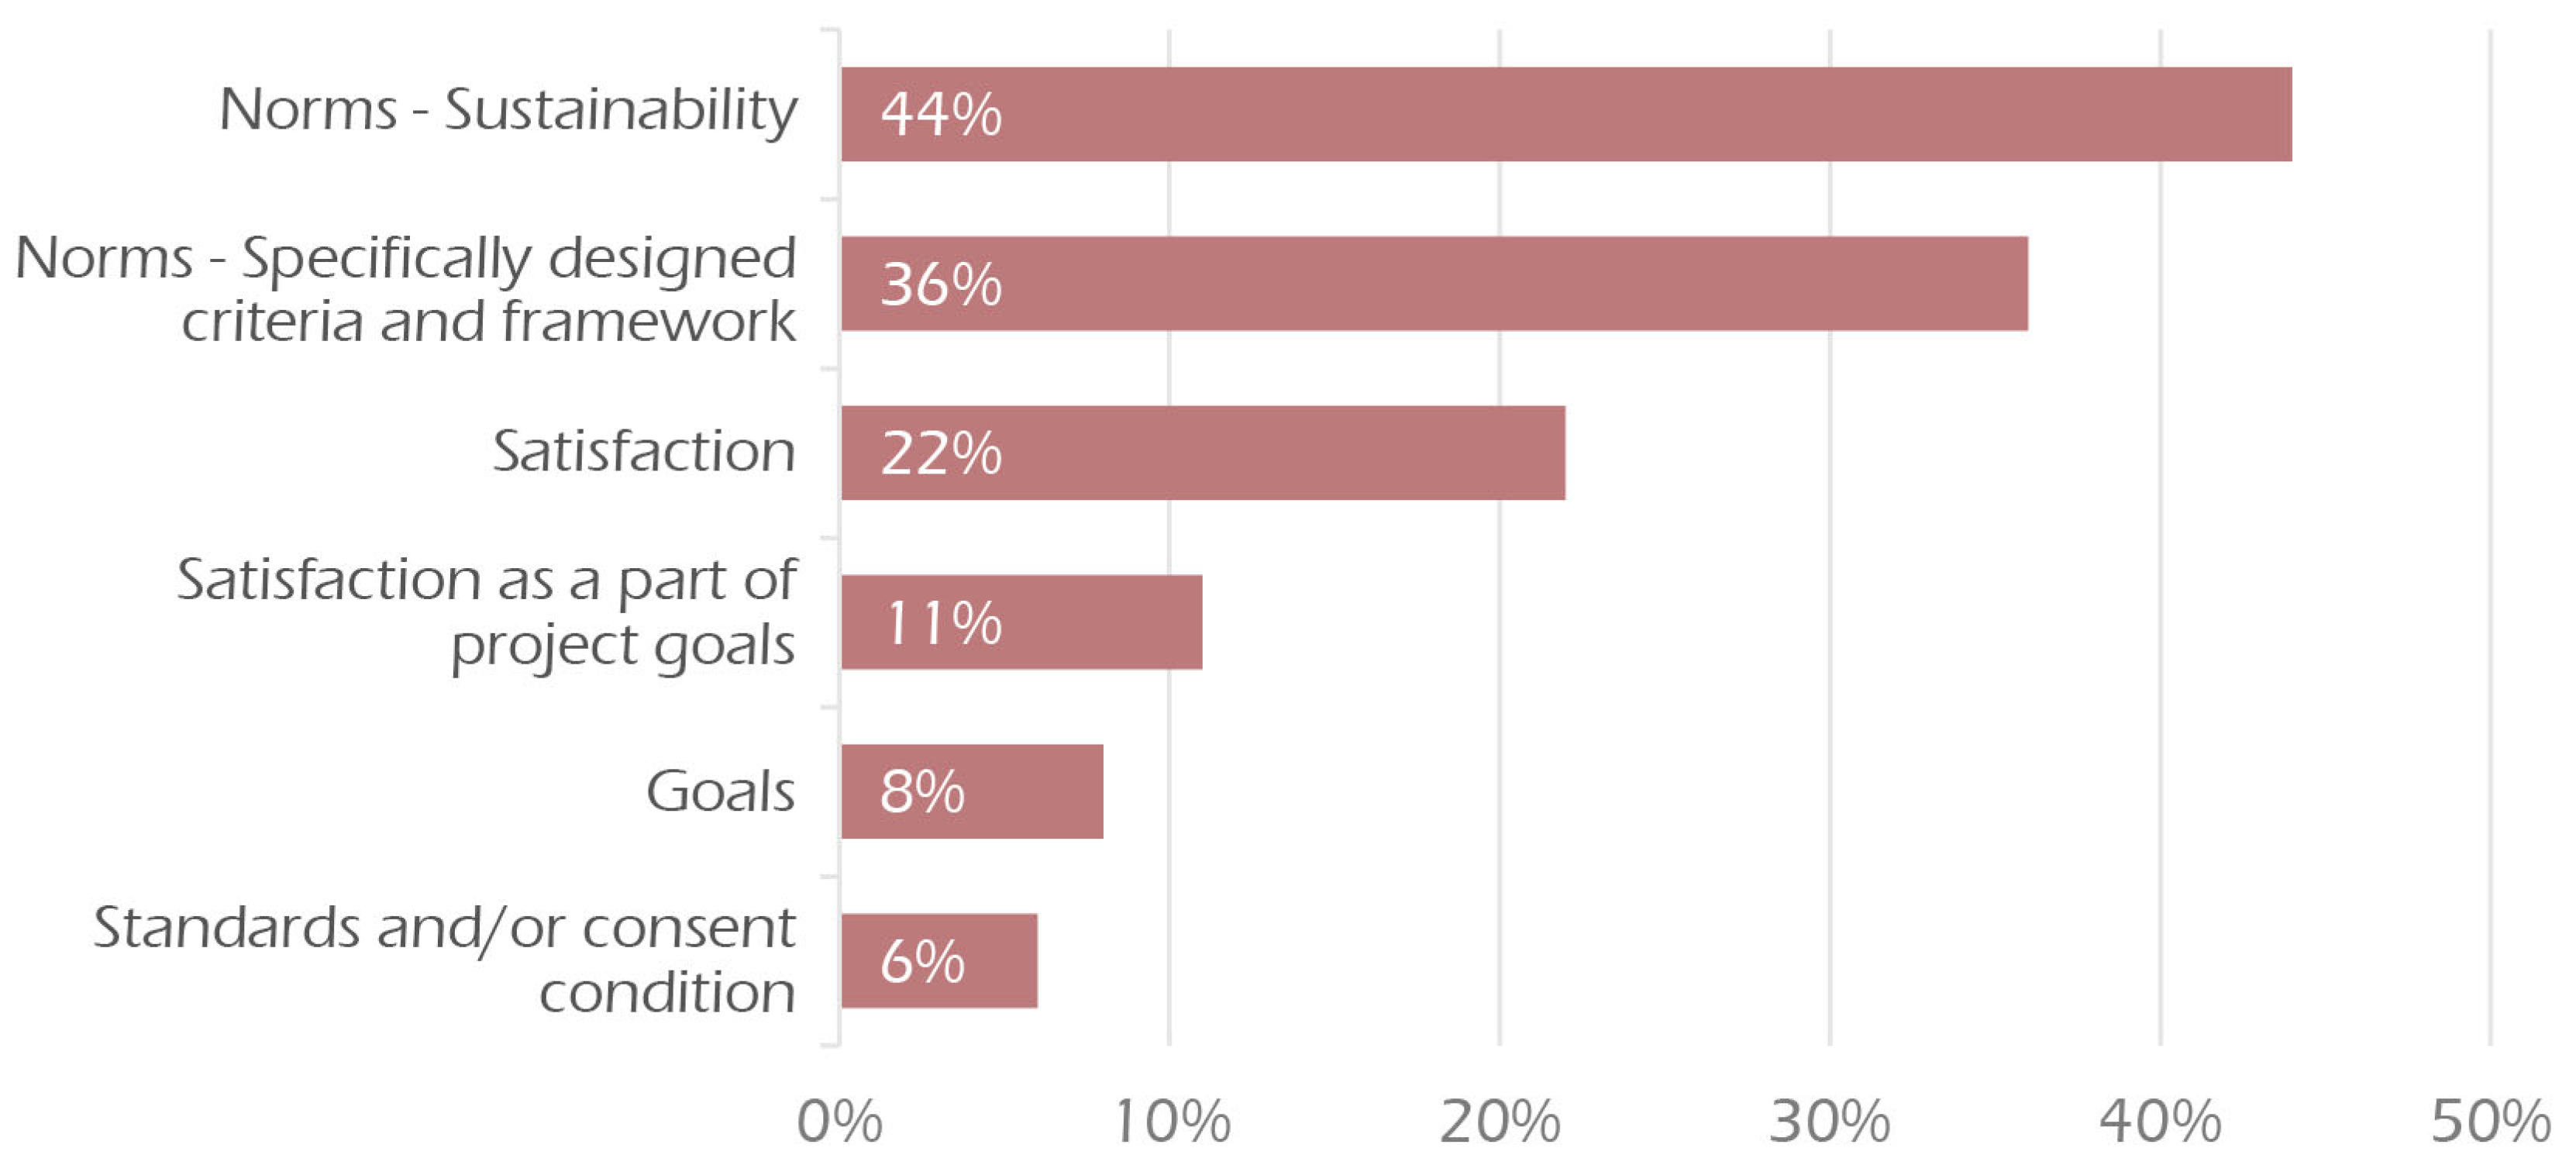
As shown in
Figure 1, among the collected cases, the most commonly adopted benchmark is the model of norms. Almost half of the collected cases were evaluated against the norms of sustainability by adopting well-developed sustainability frameworks. More than one third of the evaluations developed their specific evaluation criteria or framework by concretising the norms they adopted. A series of evaluations funded by the New Zealand Ministry for the Environment (MfE)-led cross-government committee, for example, were evaluated under the guidance of specifically developed frameworks, which concretised the norms about “a good urban landscape”. About one fifth of the collected cases were evaluated against the satisfaction of the interested parties, such as users, owners, and facility managers. A further 8% of the cases were evaluated against the original project goals. While satisfaction was acknowledged as a part of the development goals, 11% of cases were evaluated based on project goals that explicitly considered satisfaction levels. The final 6% of cases were evaluated against industry standards or the conditions specified in their resource consents or building consents (a resource consent is a formal approval required under the New Zealand Resource Management Act 1991 when a proposed building or activity does not entirely comply with all of the relevant rules in a New Zealand city or district plan) (a building consent is a formal approval mandated by the New Zealand Building Act 2004 to undertake building work in accordance with approved plans and specifications).
2.2. Evaluation Methods
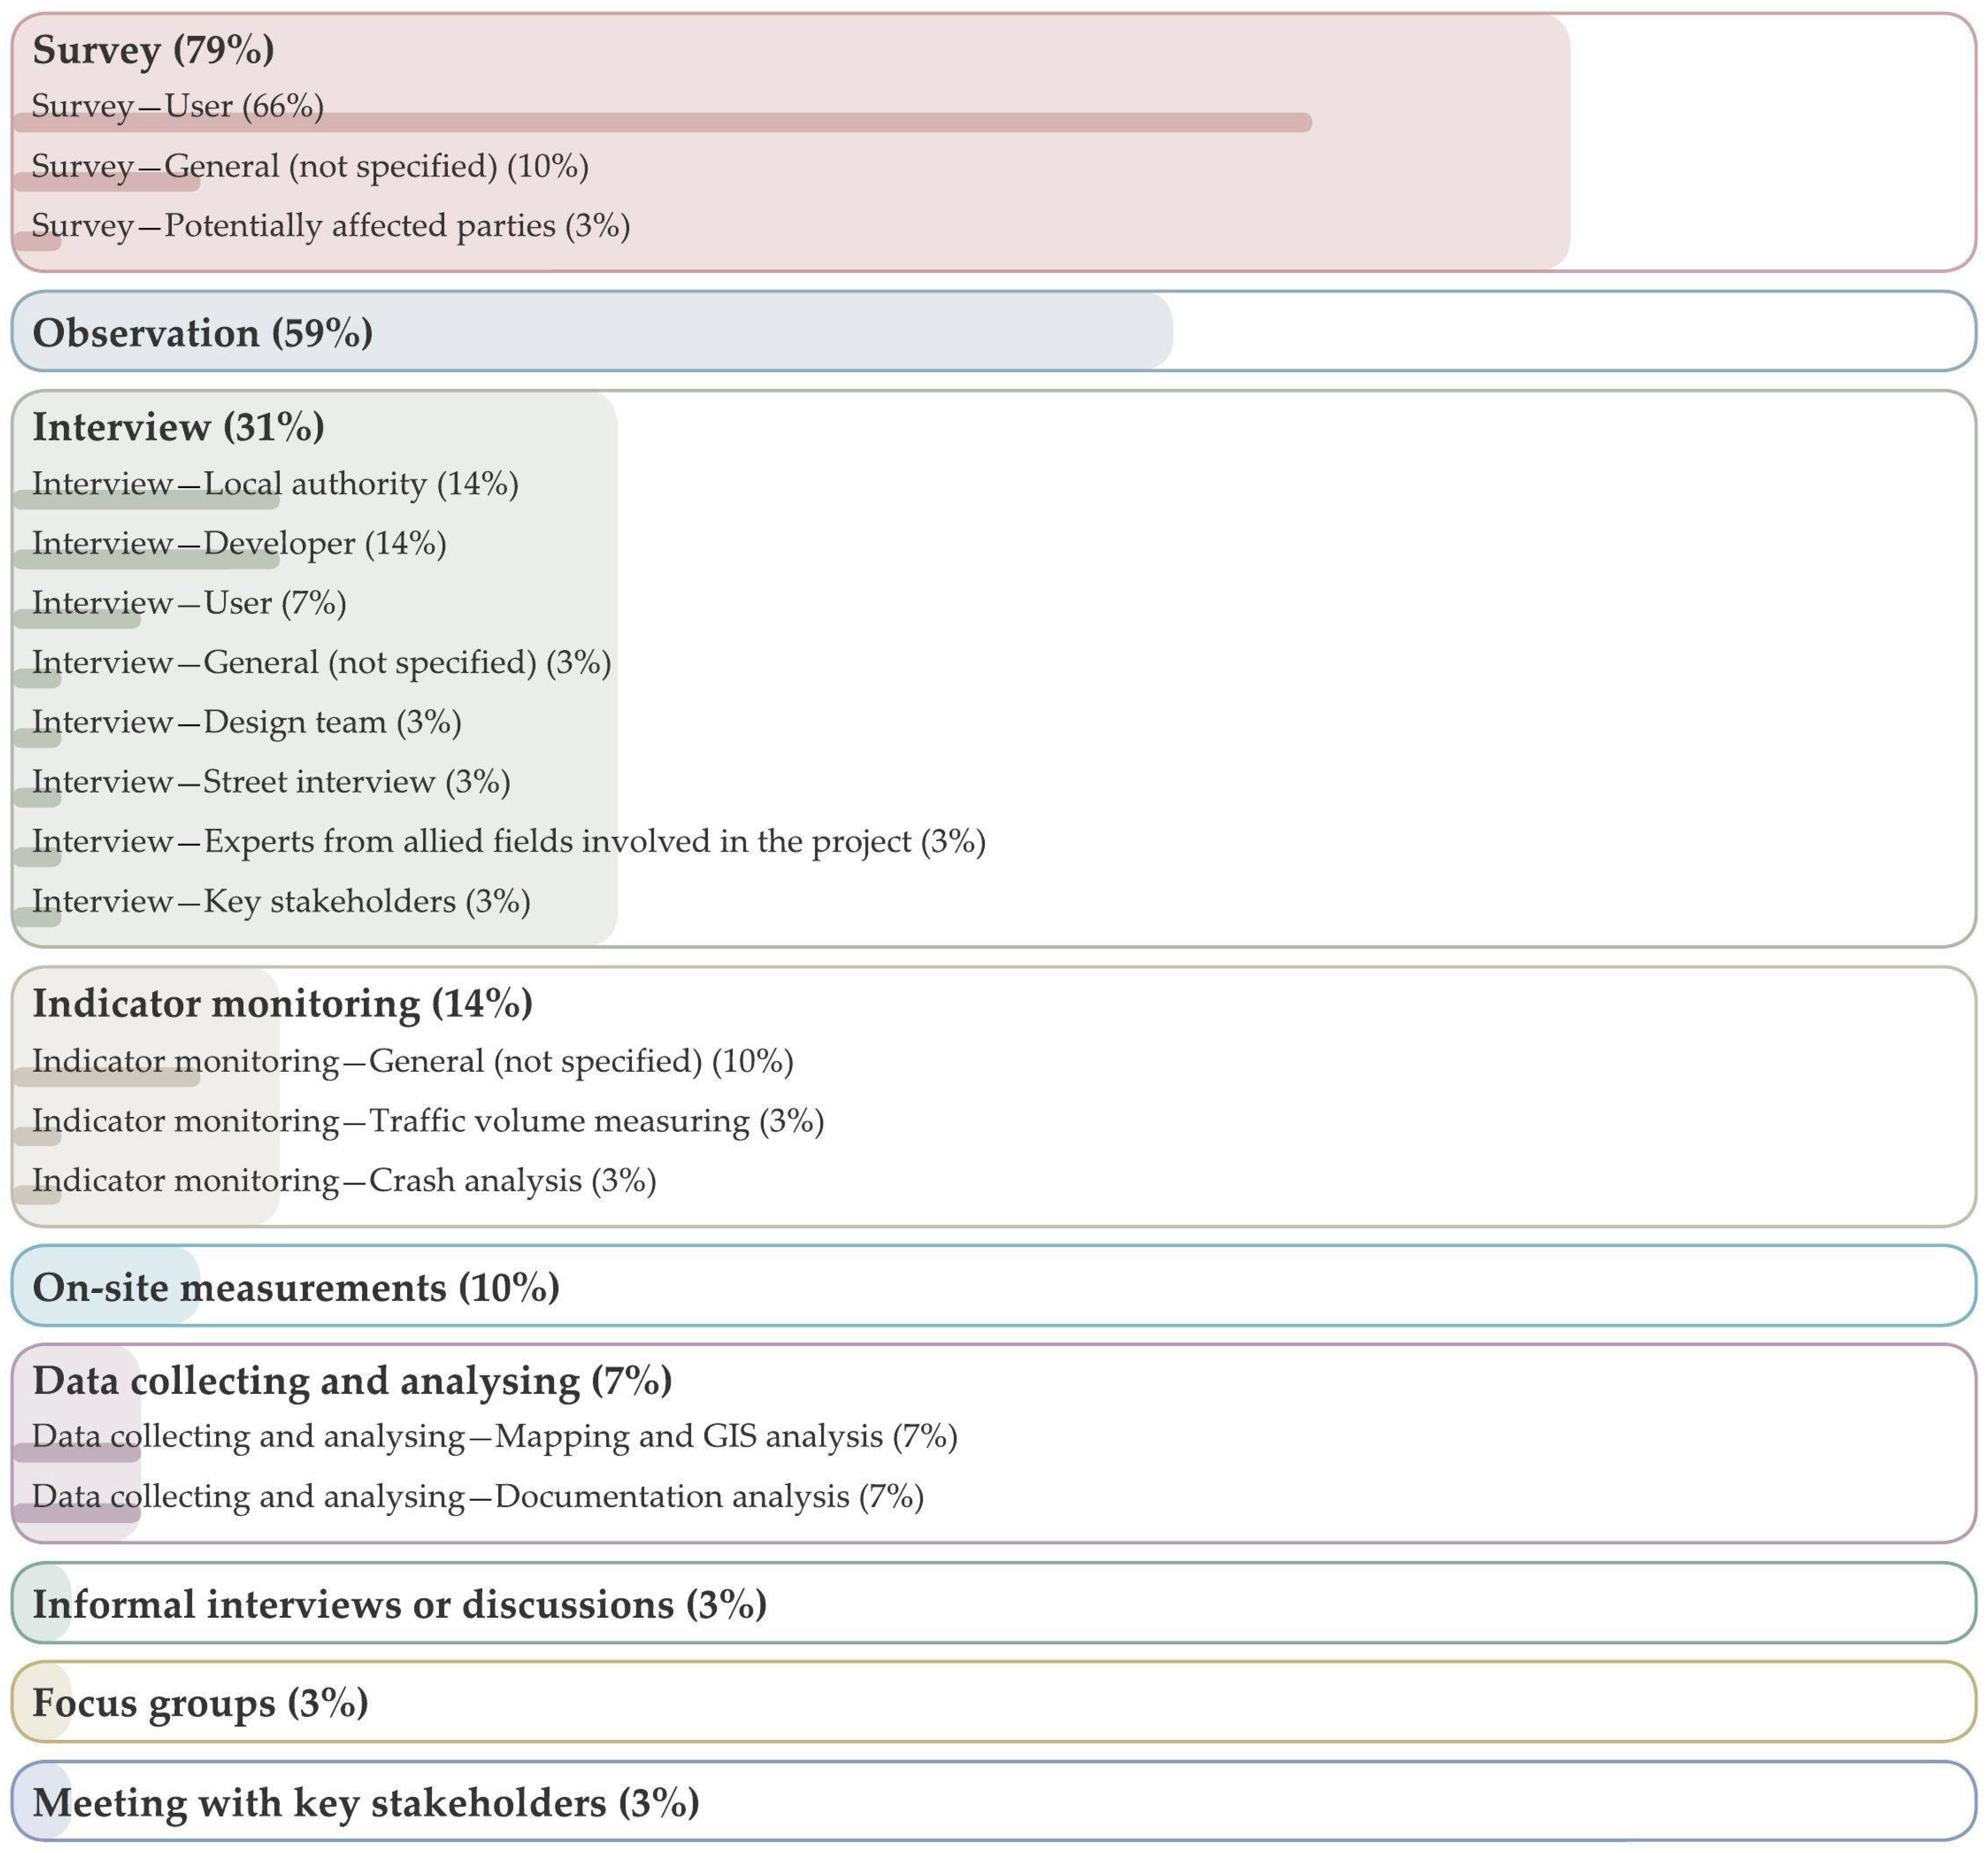
By analysing the collected cases, a great variety of methods for evaluation were identified. The case distribution by evaluation method is illustrated in
Figure 2. As shown in the figure, the three most frequently adopted evaluation methods are survey, observation, and interview, which account for 79%, 59%, and 31% of the overall proportion, respectively. With regard to the methods of survey and interview, it is noteworthy that there is a difference in the groups being studied. A majority of surveys were focused on users, while only a small proportion of the interviews involved users. Other parties that are often interviewed include local authorities and the property developers of the evaluated projects. In addition to the three major methods undertaken, some other methods such as indicator monitoring, on-site measuring, and data collecting and analysing are also identified from the collected cases.
2.3. Objects of Evaluation
Another key aspect regarding how “success” is assessed is what the objects of the evaluations are, which is to say, what aspects of the environmental design workflow stage the evaluations focus on. Chen, Bowring, and Davis [
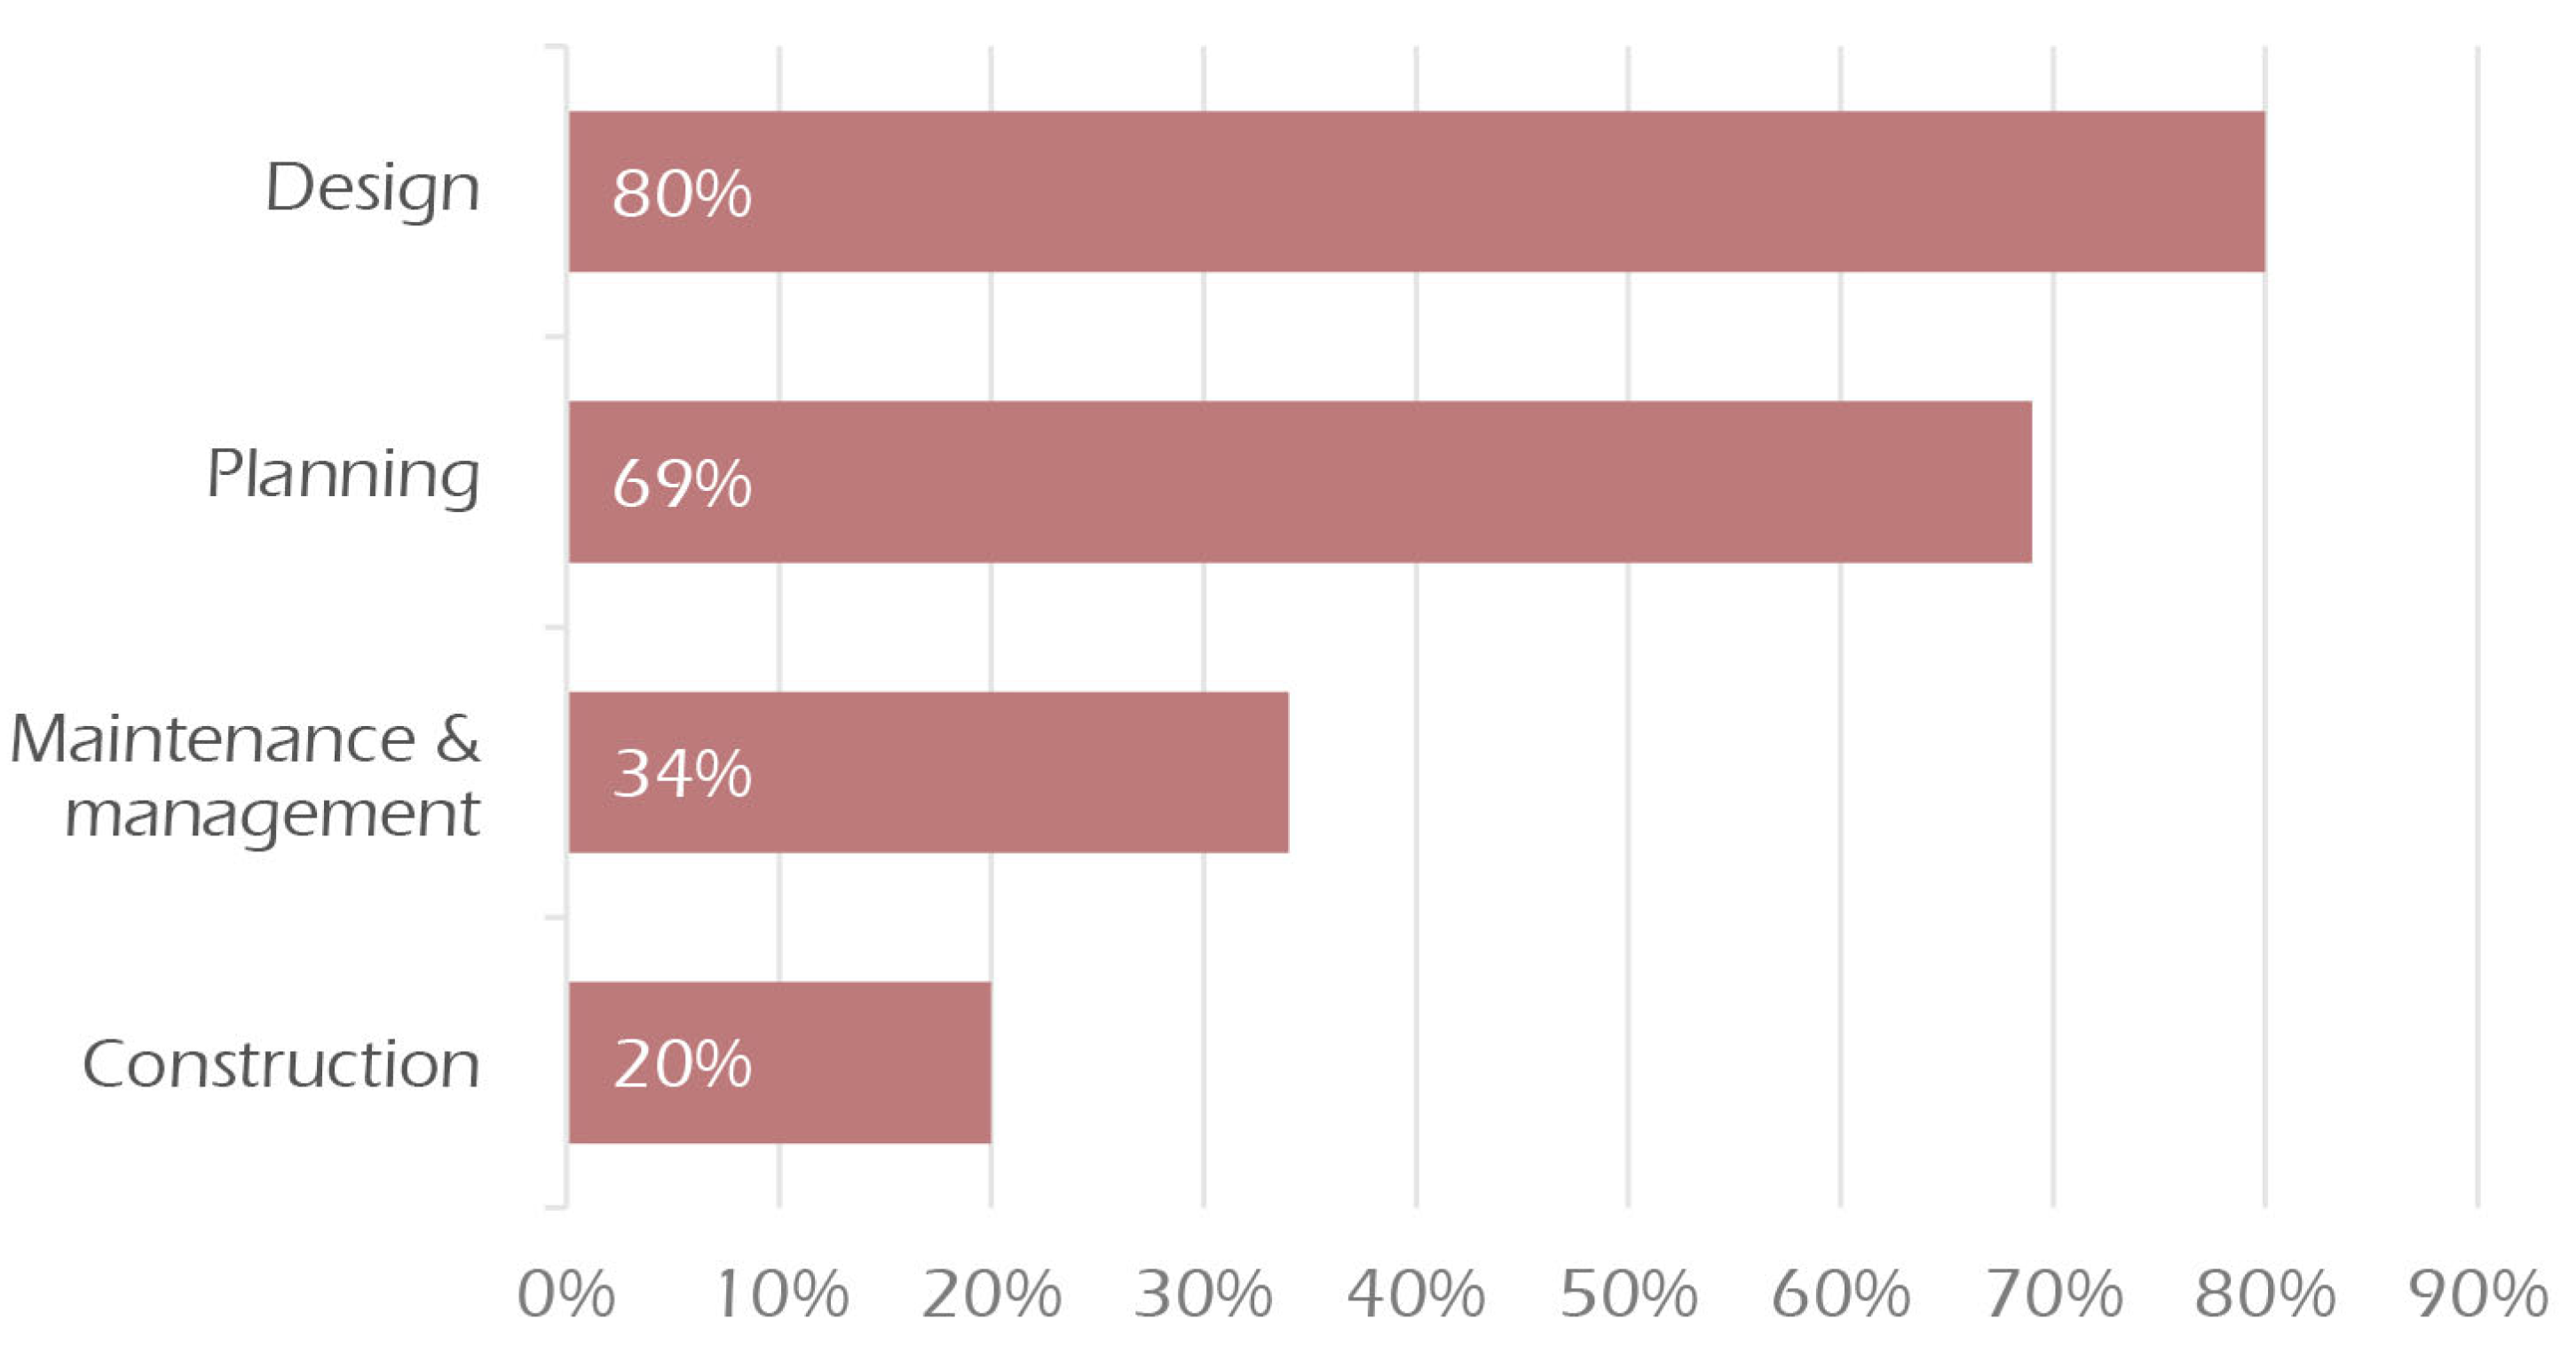
35] suggest that apart from design, other workflow stages such as construction, operation/management, and maintenance are sometimes considered as the objects of evaluations as well. This paper examined the workflow stages of the collected evaluation cases. As shown in
Figure 3, the most commonly evaluated workflow stage is “design”, which was included in 80% of the evaluations (it is worth noting that some of the evaluation cases took more than one object into account). This means that these evaluations considered the quality and effectiveness of the design interventions, while the other one fifth of cases were not set out to assess design-related performance. In addition, two thirds of the cases took the “planning” phase as the object of their evaluation, while a smaller percentage of cases included maintenance and management (34%) and construction (20%) as objects in their evaluations.
2.4. Tendency of the Evaluation Results
The evaluation results of the collected cases were also coded according to their sentiment or tendency by using a 5-point Likert scale consisting of “positive”, “generally positive”, “generally balanced”, “generally negative”, and “negative”. In addition to the researcher who conducted the coding, there were also two independent coders who coded a sample group of the collected case materials to test the objectivity of the codes; high inter-coder agreement rates (91.4% and 94.1%) were achieved by the coding results; therefore, these tendency codes can be considered to have a relatively high objectivity. The grades “positive” and “negative” refer to the evaluation results that contain only positive content and only negative content (i.e., suggesting a clear “success” or “failure” of the aspects being evaluated), respectively. “Generally positive” refers to the results where there was more positive content than negative content, and vice versa for the category “generally negative”. “Generally balanced” refers to the results in which no obvious difference was perceived between the positive and negative content in terms of their quantity and importance. A further category, neutral, is introduced to accommodate the “descriptive” evaluation result, which indicates no tendency.
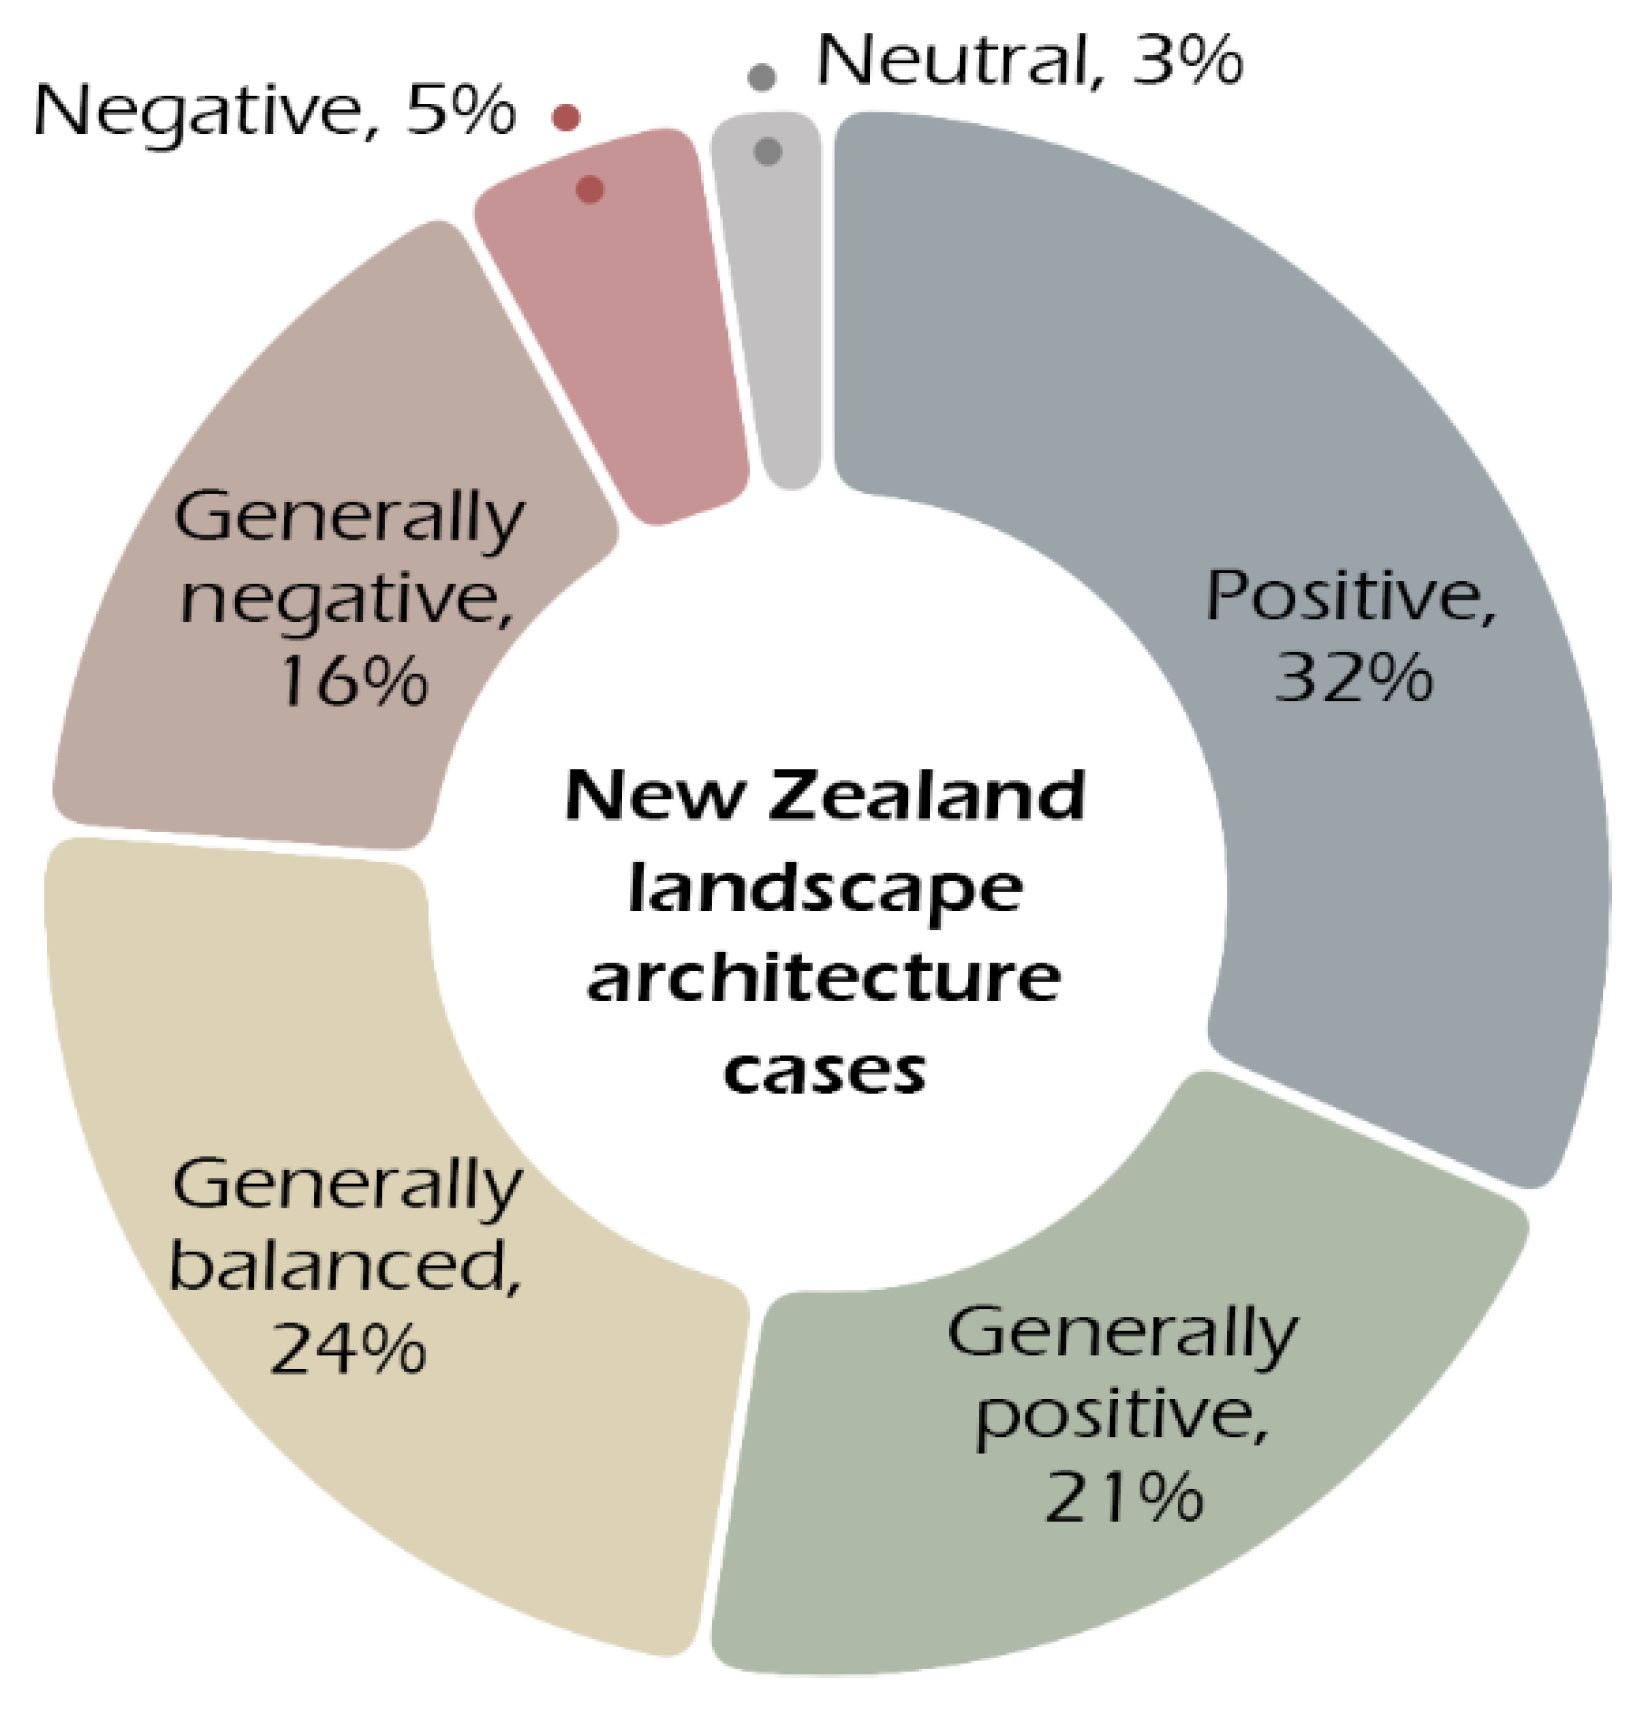
As shown in
Figure 4, approximately one third of the evaluation results are positive, while only 5% of the evaluation results were considered negative. The proportions of the results categorised as generally positive and generally negative are similar, at around 20%. “Generally balanced” results account for around a quarter of the total number of the collected evaluations.
Theoretically, the tendency of an evaluation’s result can be affected by a range of factors. By correlating the sentiments of the evaluation results with a series of independent variables within the evaluation, the researchers found that the tendency of the evaluation results is strongly correlated with the funding source types (and the financial independency decided by it), as well as the evaluator type (and the institutional independence decided by it). The following two sections report these two types of correlations.
2.5. Correlation between the Funding Source Type and the Evaluation Results
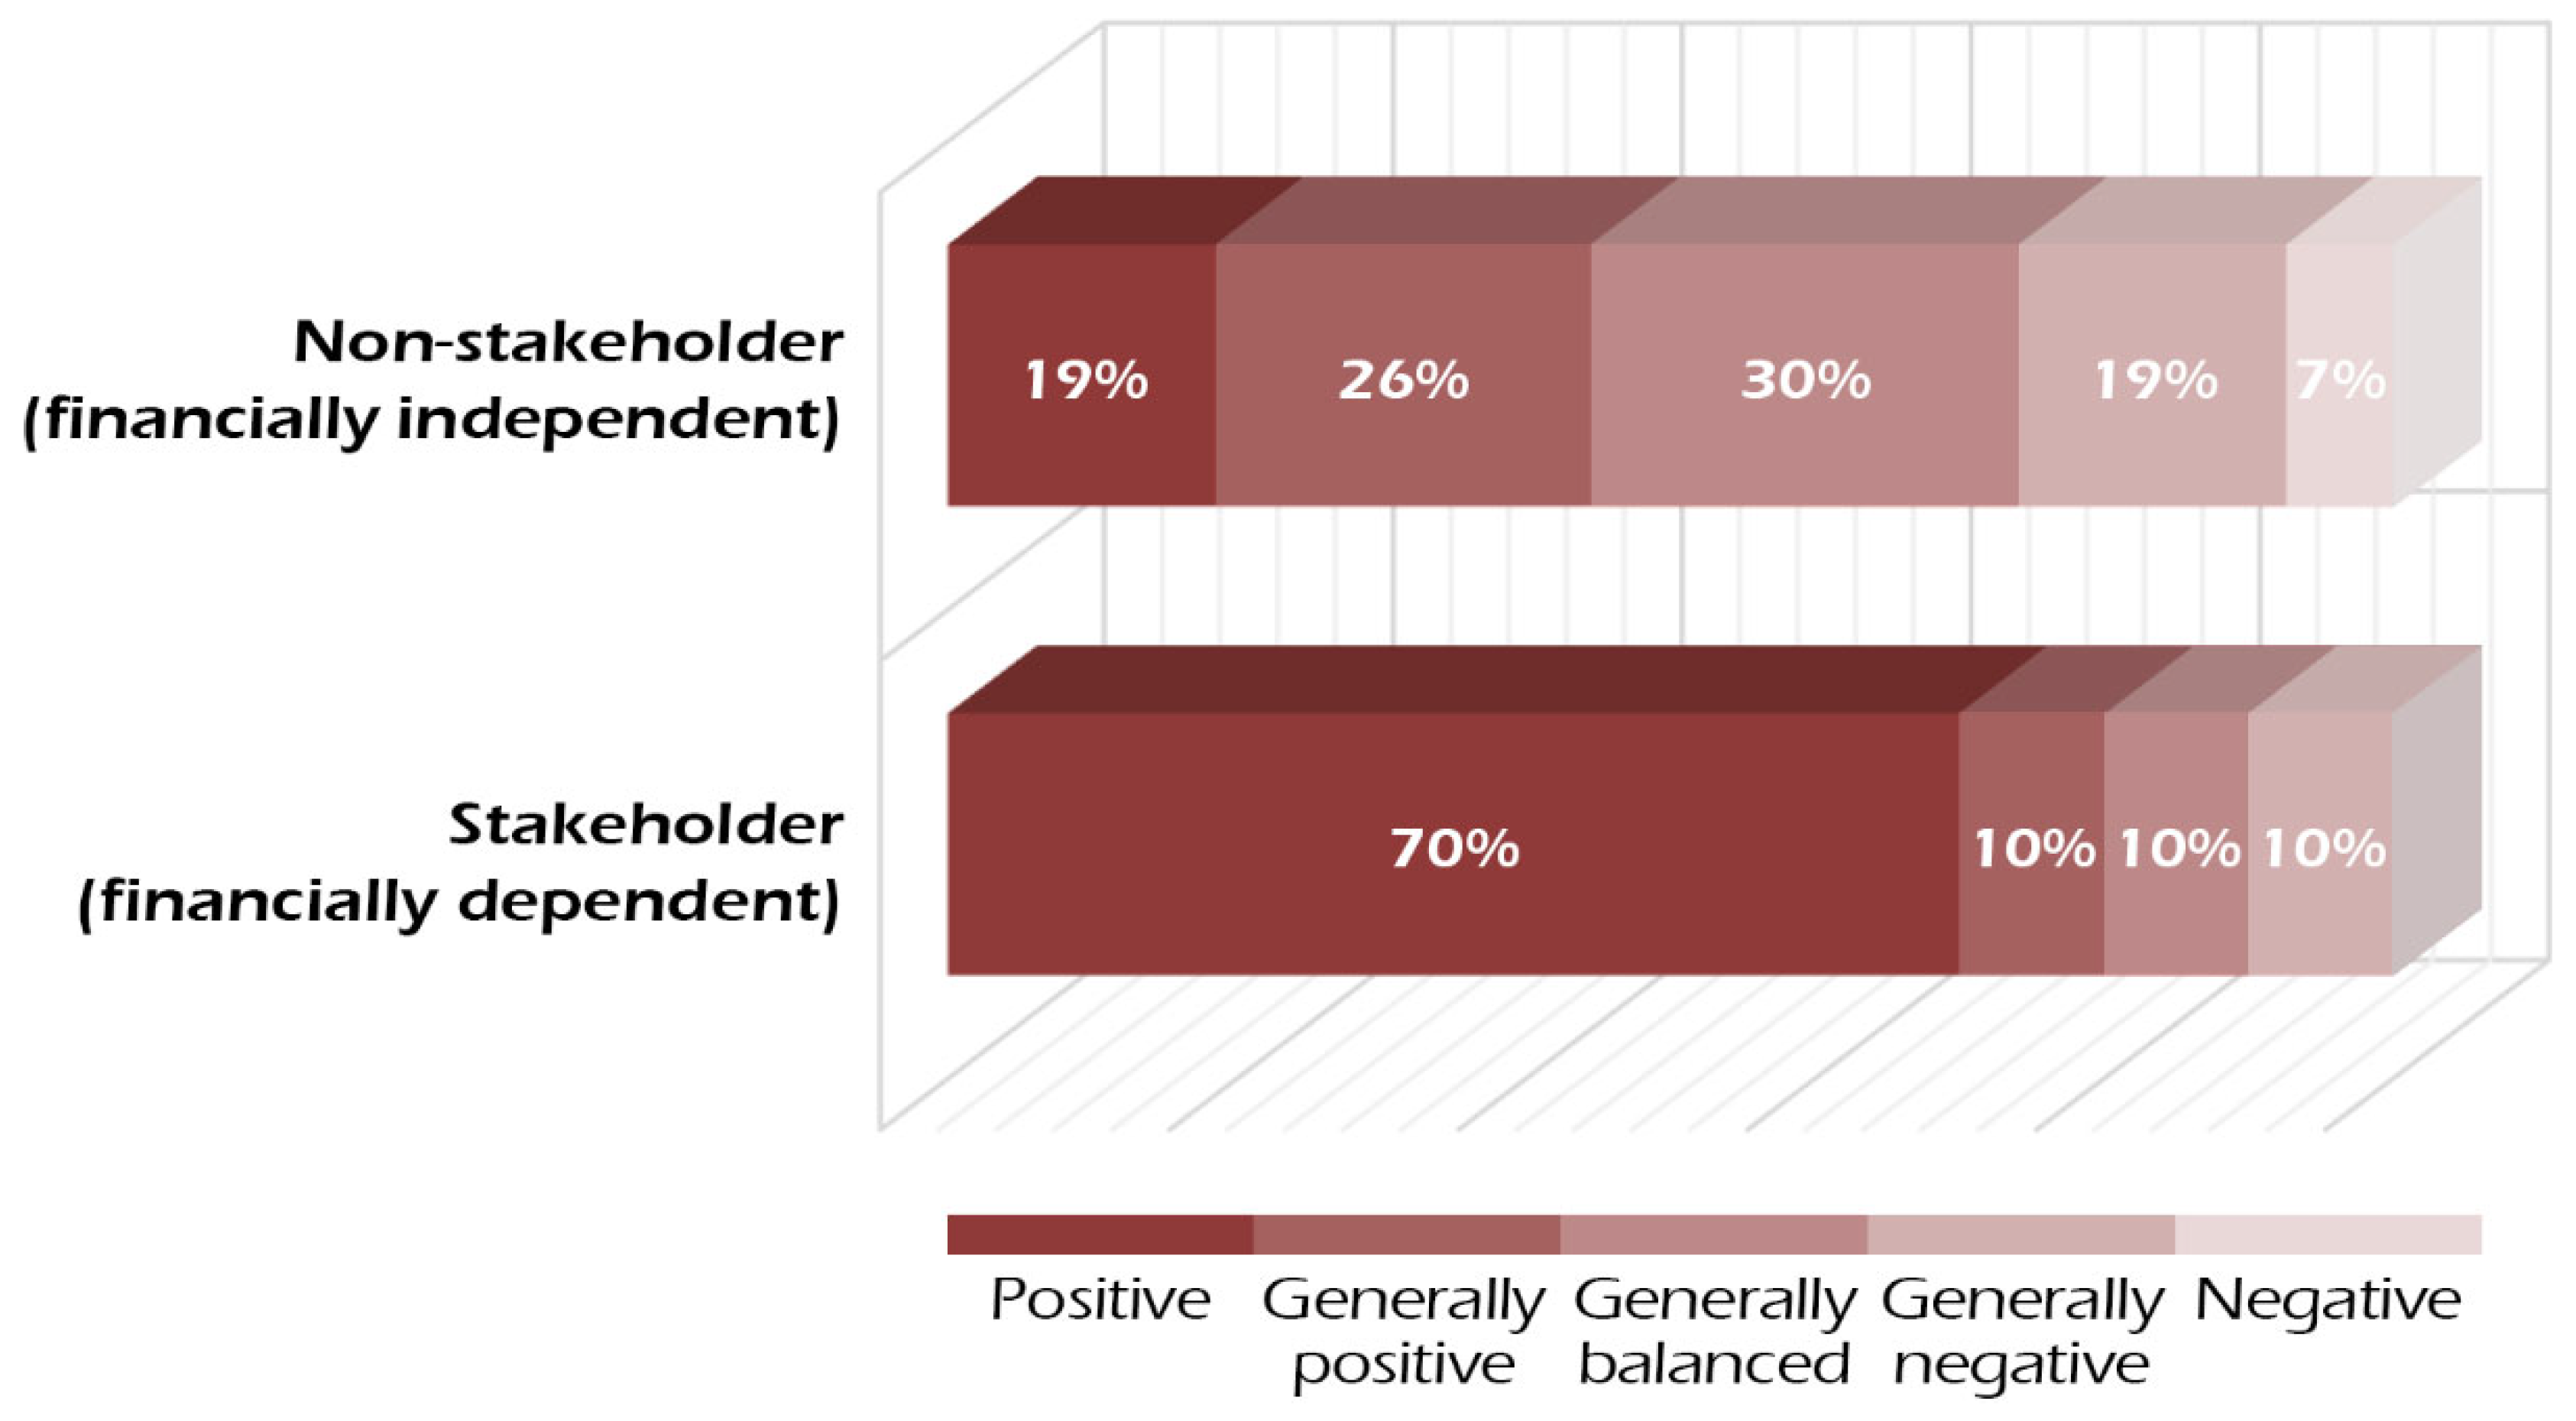
The tendency of the evaluation results of the collected cases is found to be significantly correlated with the financial independency determined by the type of funding source. As illustrated in
Figure 5, while 70% of the evaluation results of the stakeholder-funded cases are positive, only 19% of the results of non-stakeholder-funded cases are positive. Furthermore, while 7% of the results of the non-stakeholder-financed evaluations were negative, no stakeholder-funded evaluations were found, with entirely negative results. In terms of the results categorised as generally negative, the proportion of non-stakeholder-funded projects (19%) is almost double that of stakeholder-funded ones (10%). In general, the evaluations funded by non-stakeholders (e.g., higher education institutes, non-profit research organisations, and governments who were not involved in the project decision making) can be considered financially independent since there is no conflict of interest between those funders and the evaluation results. On the contrary, the evaluations funded by the stakeholders of an evaluated project (e.g., developer, designer, client, and construction contractor) were considered financially dependent by this research. Overall, as illustrated by
Figure 5, financial independency has a strong correlation with the tendency of the evaluation results. Financially dependent evaluations have a significantly higher possibility of achieving a more positive result than financially independent ones.
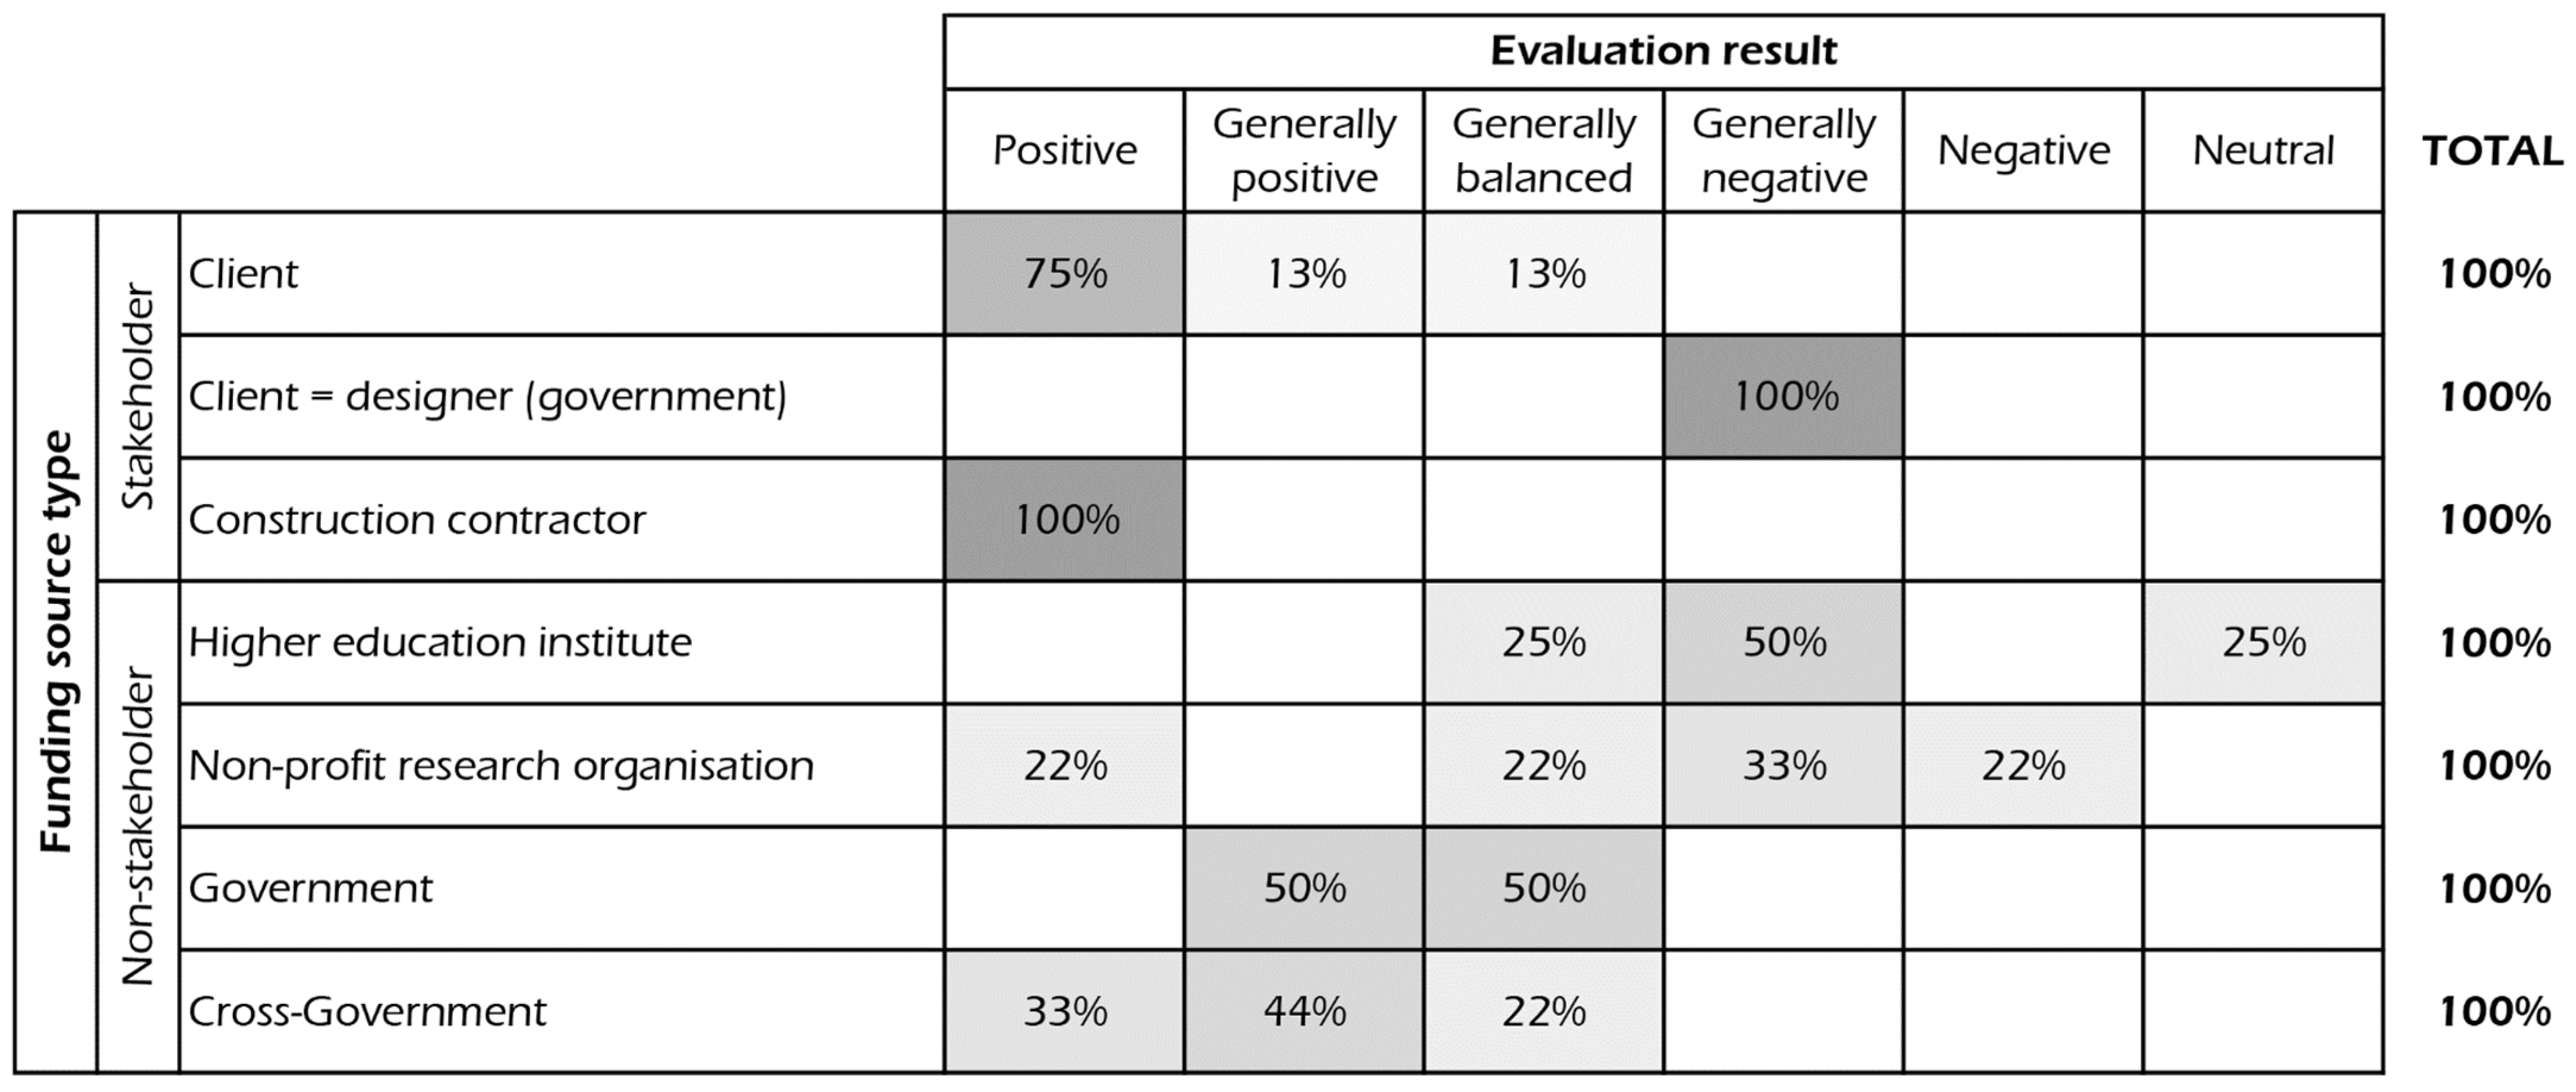
Within each funding source category, there are also noticeable sentiment differences between the results of the evaluations funded by different types of funders, as shown in
Figure 6.
Among the seven types of funders, clients and construction contractors, as two types of stakeholders, have a high tendency for achieving a positive outcome from the evaluations they financed. By contrast, the evaluations funded by higher education institutes and non-profit research organisations generally achieved more negative results than positive results. A deviation from the overall pattern is observed for the evaluations funded by in-house government designers (who acted as a client and a designer at the same time), which achieved generally negative results. This may be relevant to the non-profit nature of this type of stakeholder as well as the transparency required for spending government funding.
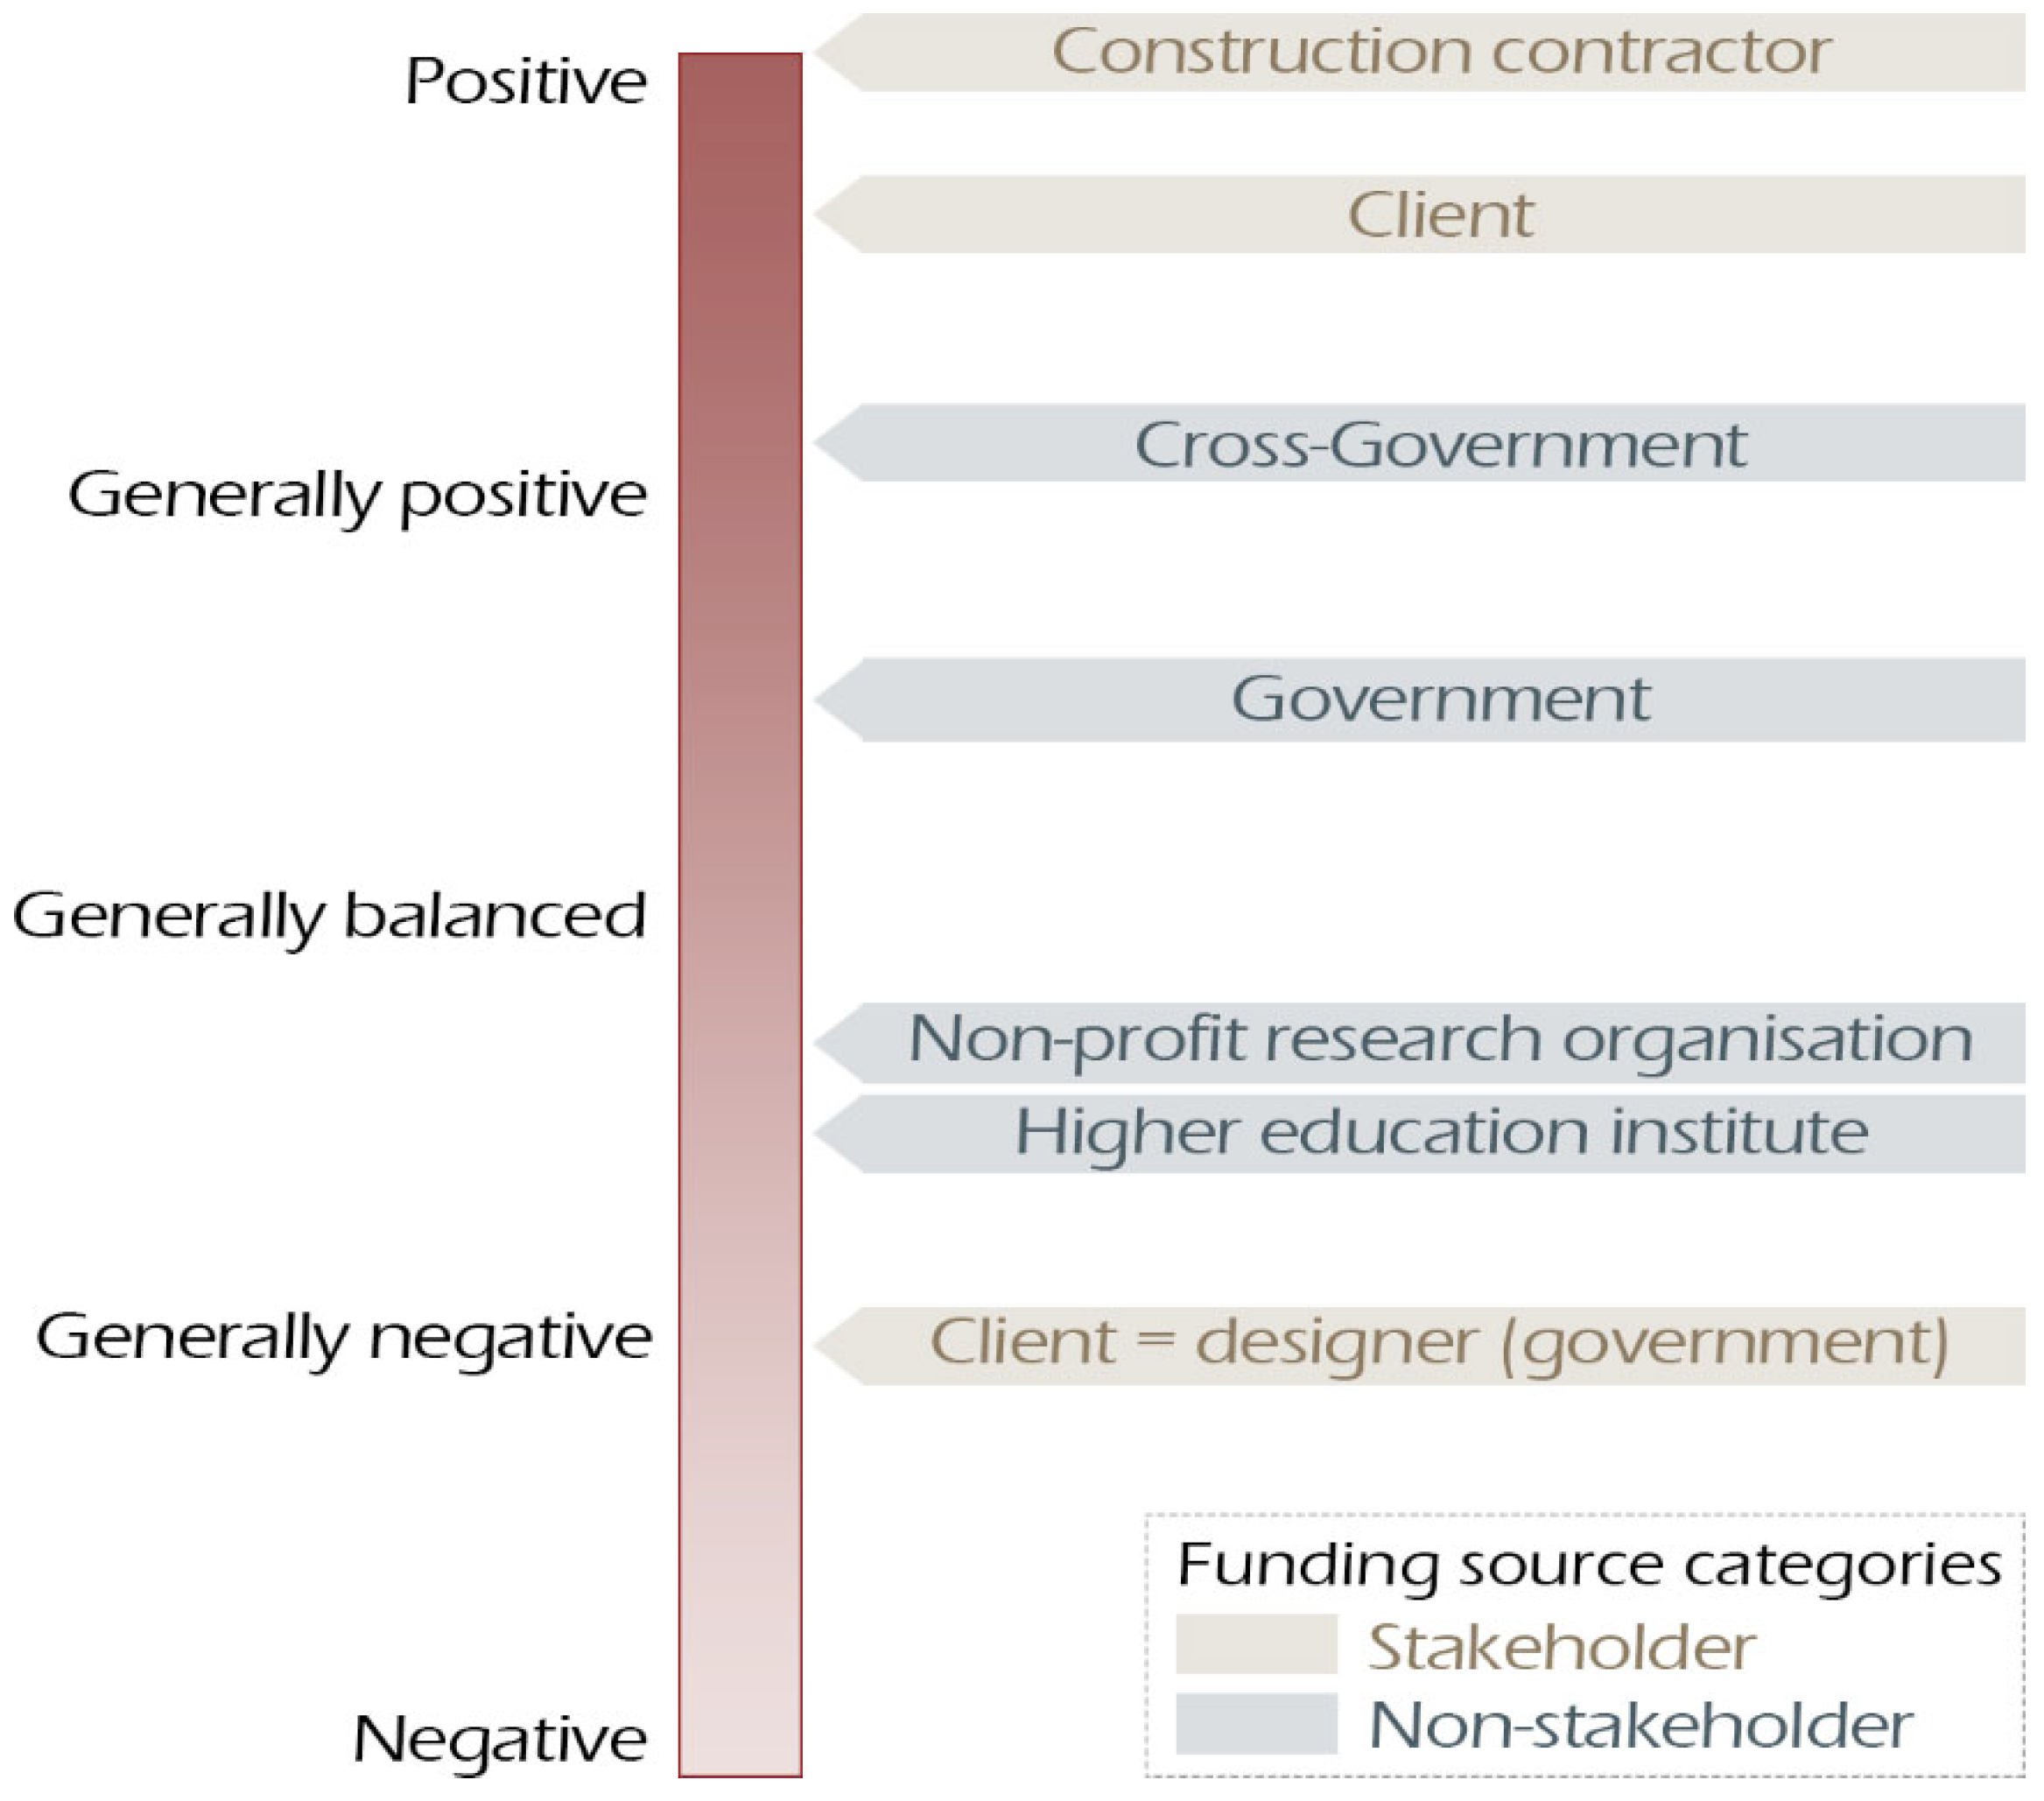
By converting the proportion of the Likert scores of the evaluations financed by different types of funders, an average tendency level was obtained for each type of funder. The average Likert scores are illustrated in
Figure 7. The result of construction contractor-funded cases is positive, while client and cross-government committees are situated between positive and generally positive. Following that, governments are situated between generally positive and generally balanced. The average tendency levels of the results of cases financed by non-profit research organisations and higher education institutes are in-between generally balanced and generally negative. In-house government design teams, as a type of stakeholder, are situated at the point of generally negative, showing a strong contrast to the other types of stakeholders.
2.6. Correlation between the Evaluator Types and the Evaluation Results
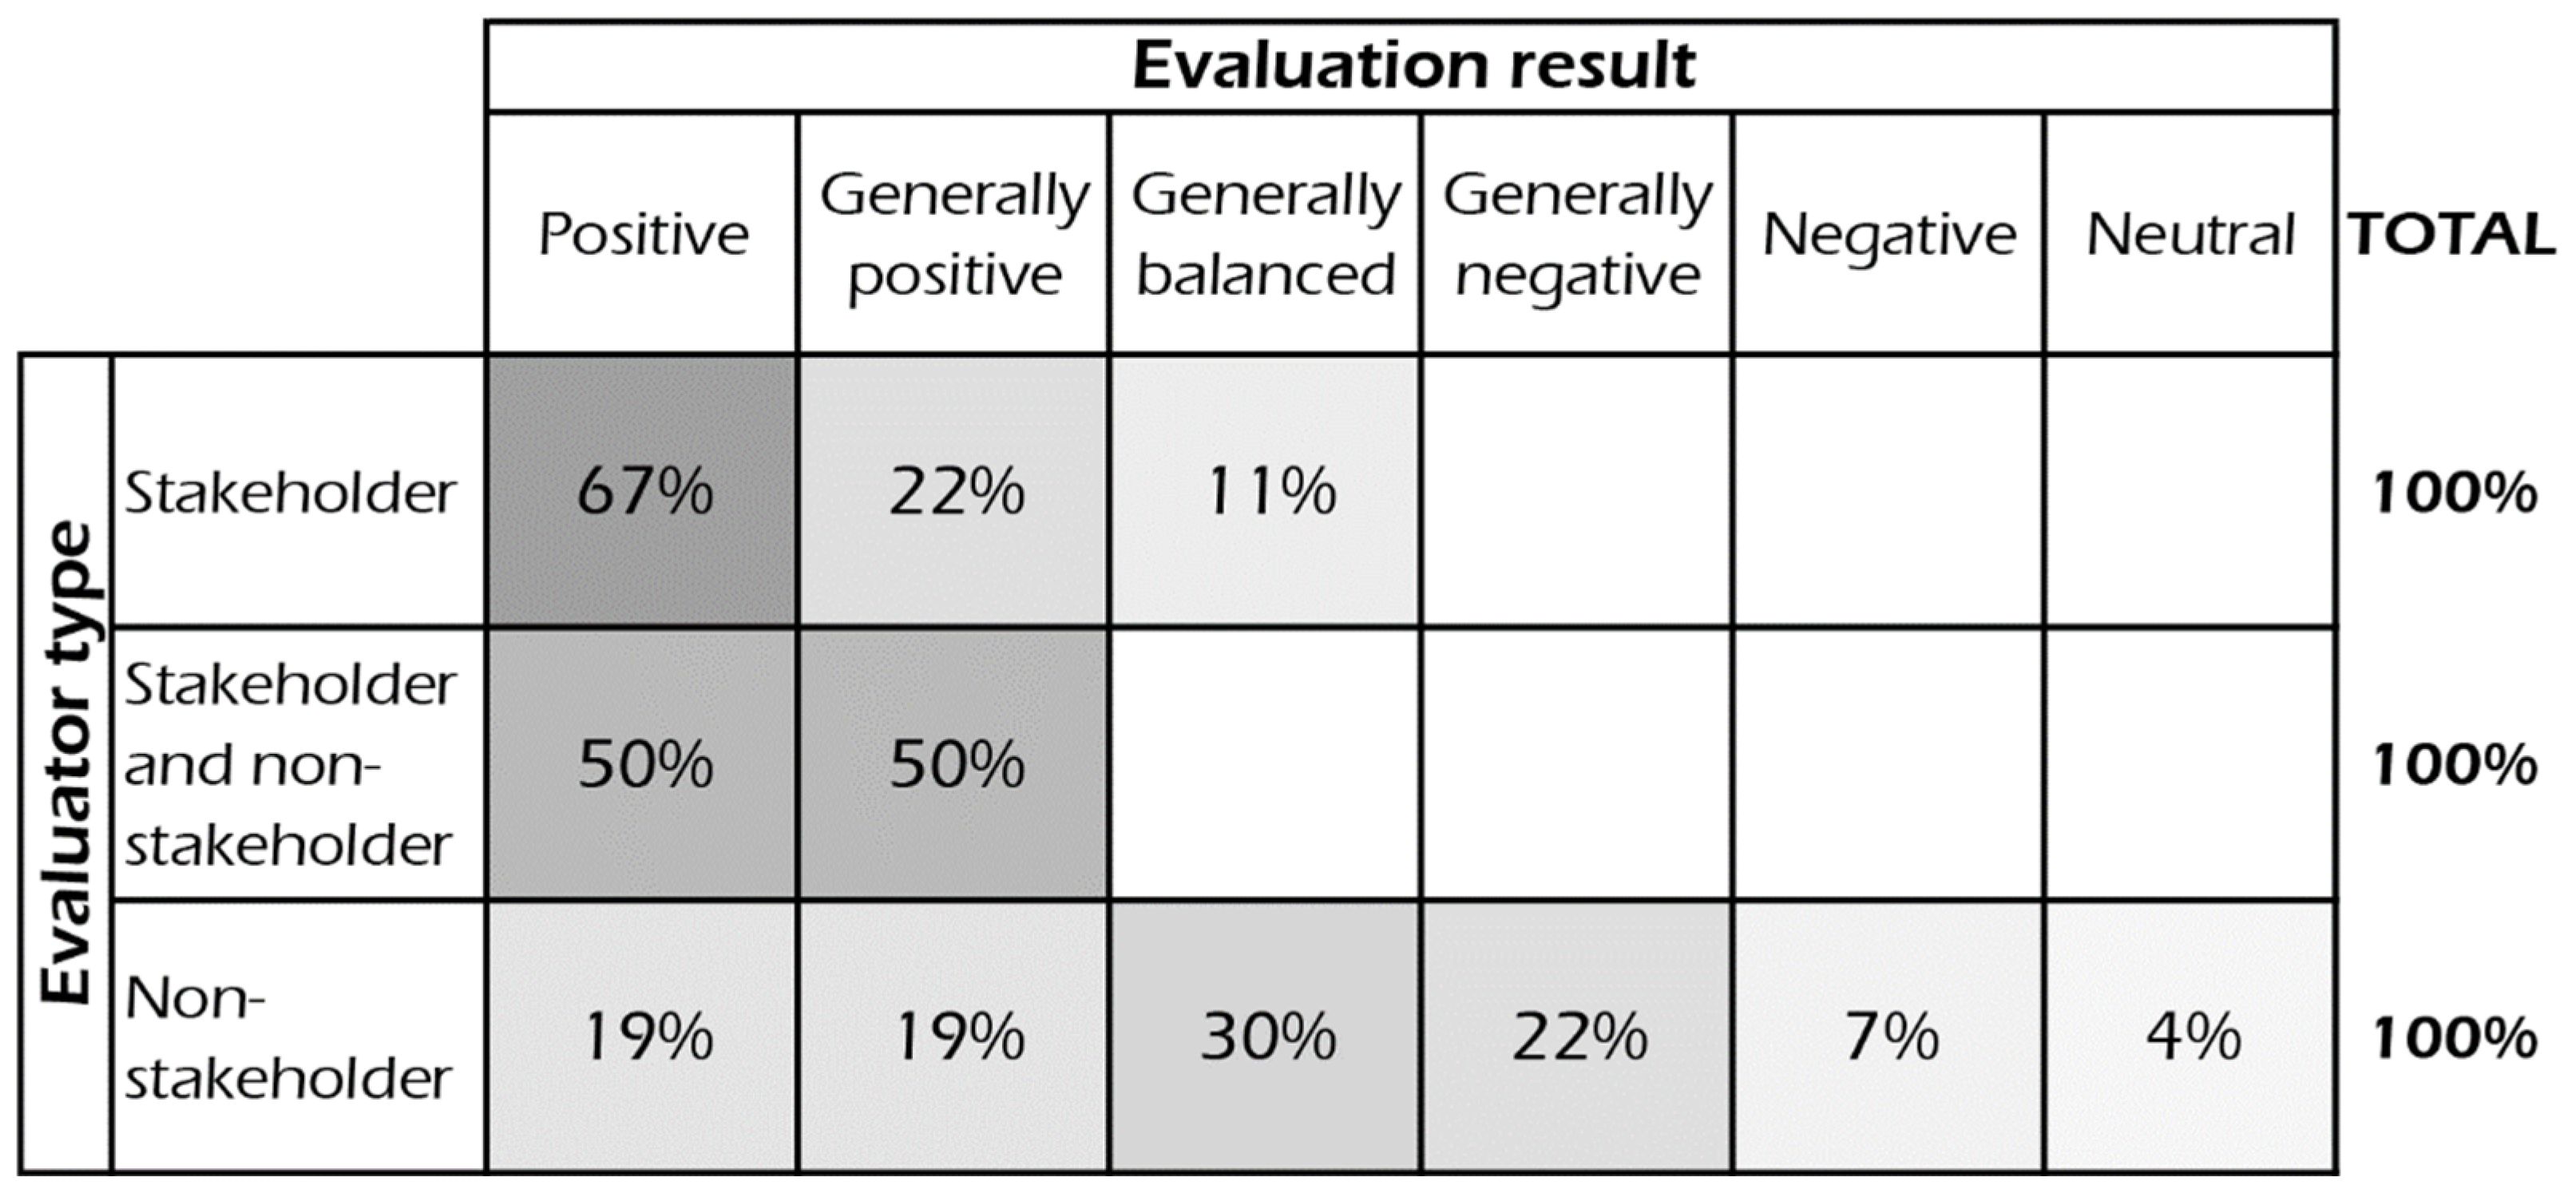
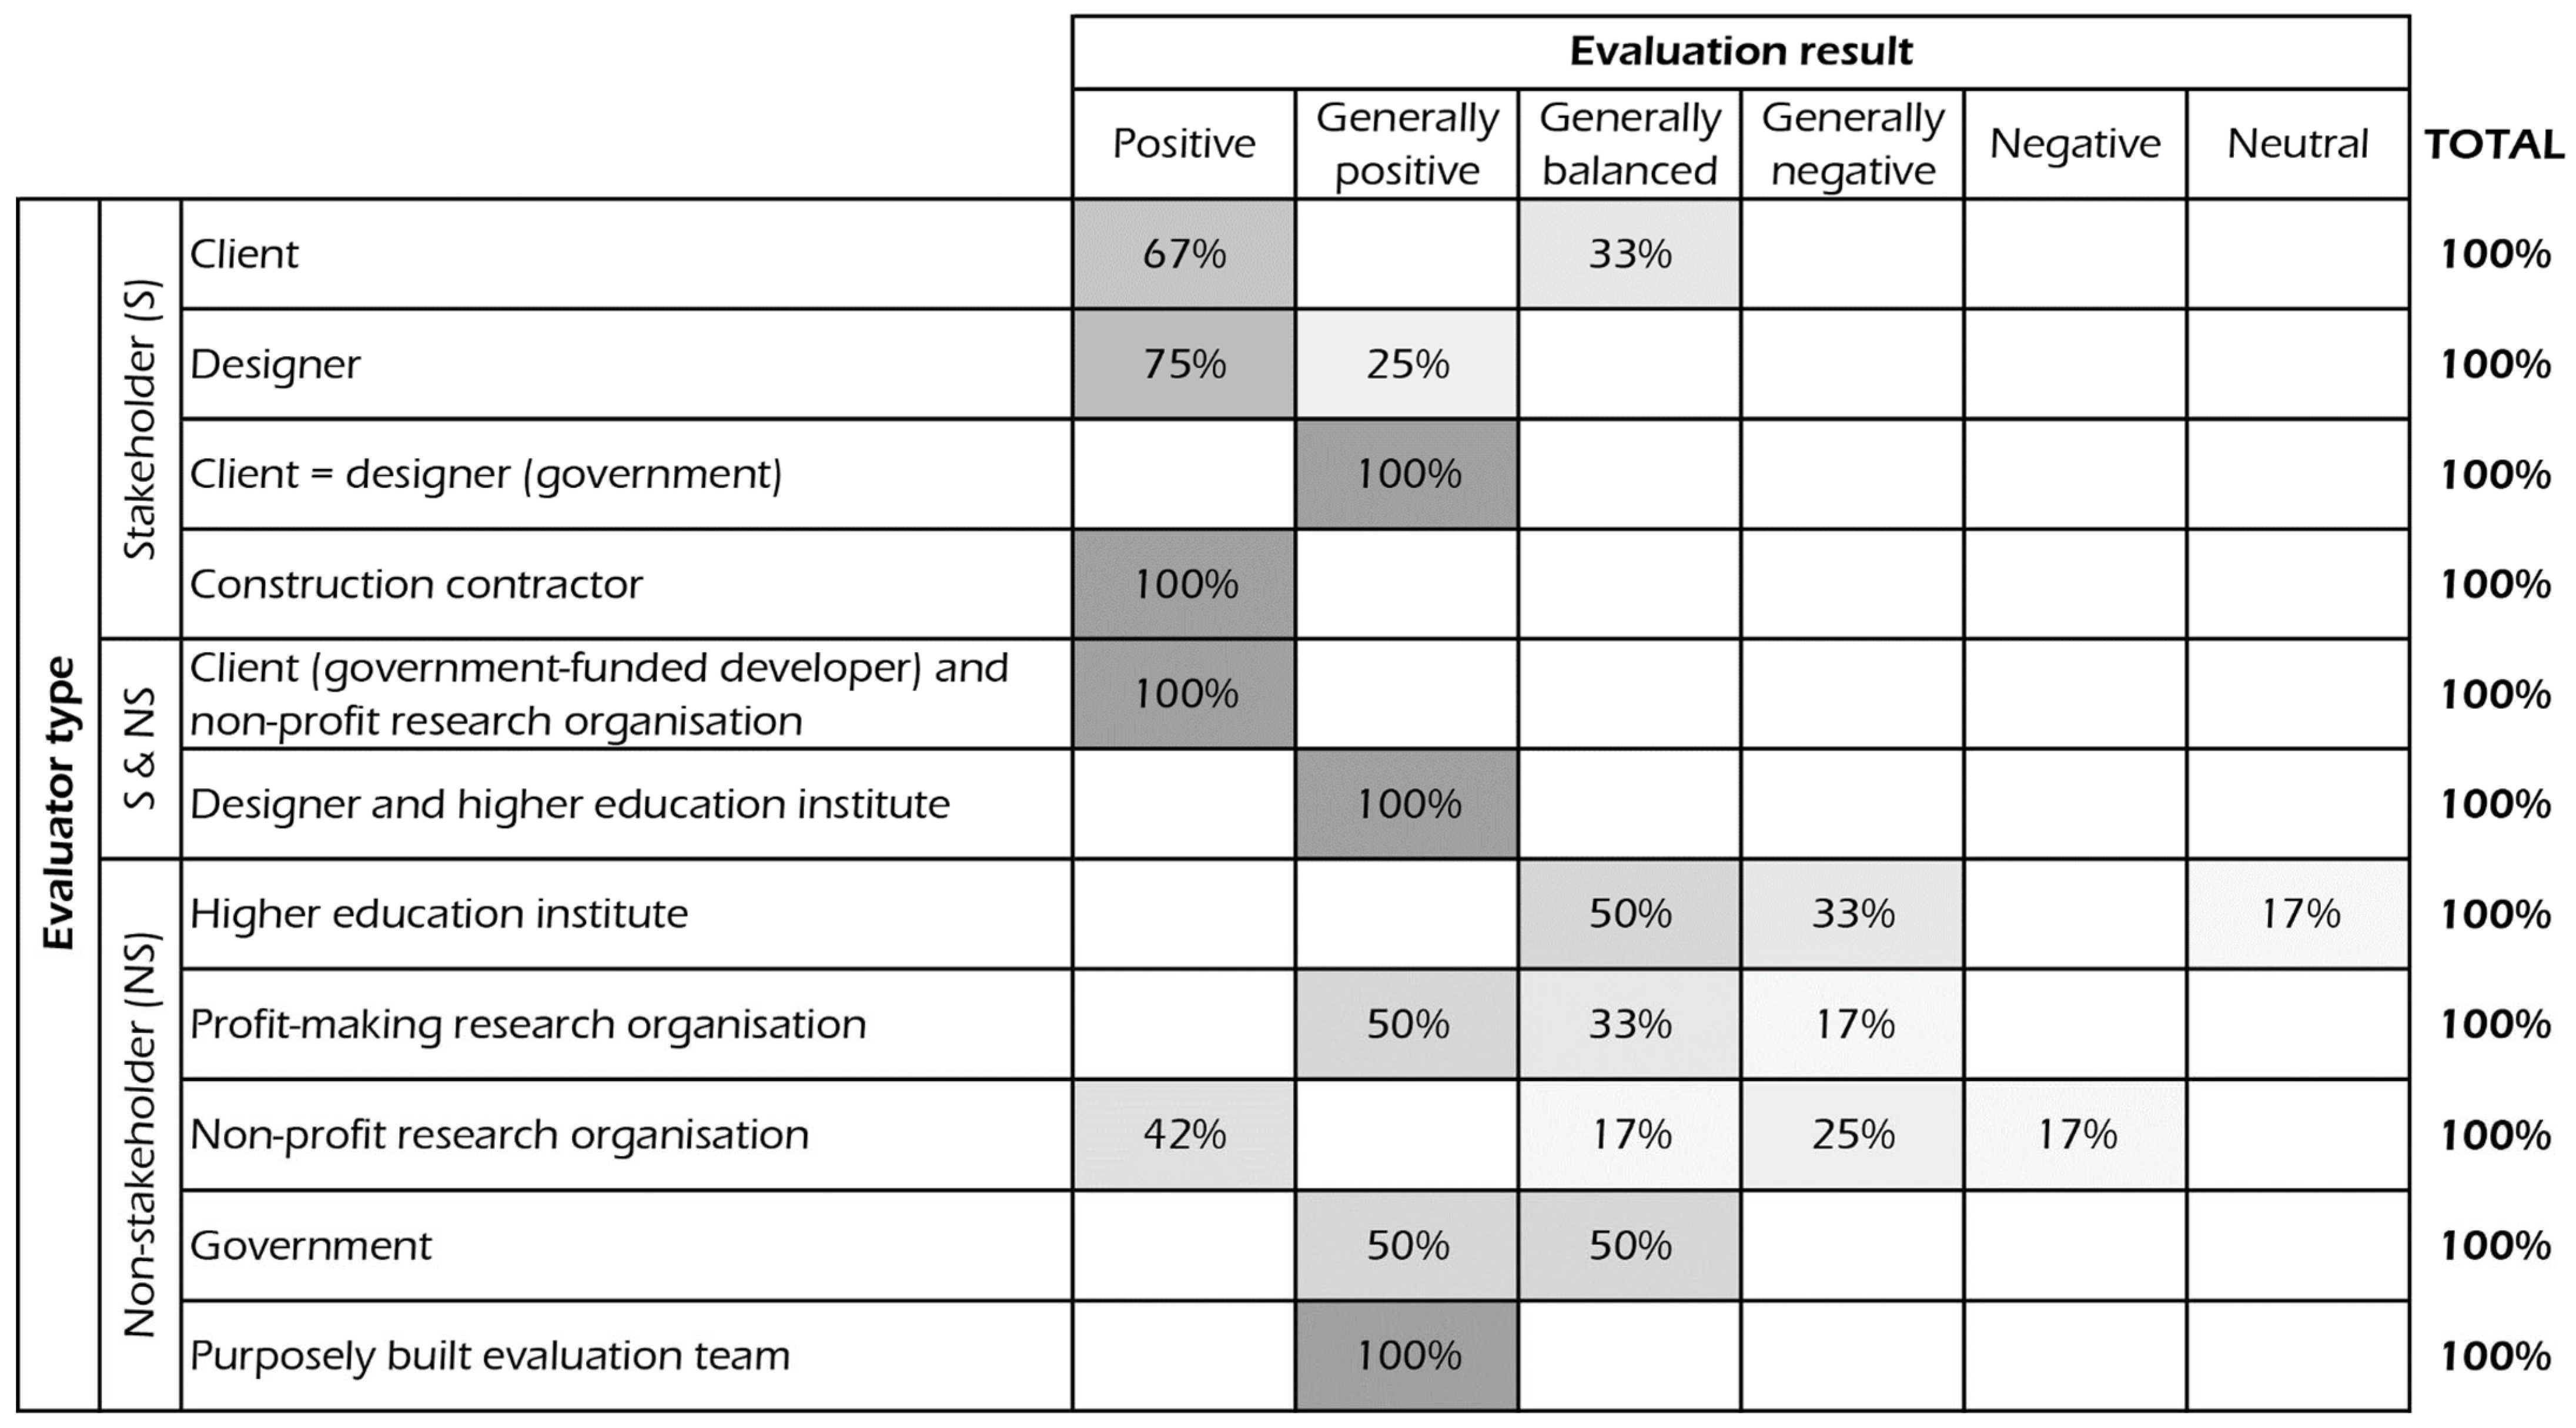
The distribution of the sentiment levels of the evaluation results by evaluator category (as shown in
Figure 8) demonstrates a similar pattern with the sentiment level distribution by funder categories. Generally, an overall higher percentage of positive results was achieved by the stakeholder-conducted evaluations. The evaluations jointly conducted by both stakeholders and non-stakeholders achieved positive and generally positive results. The result sentiments of the evaluations conducted by non-stakeholders show a relatively balanced distribution, with one third of cases achieving generally balanced results.
Within each evaluator category, there are also different types of evaluators, whose evaluation results distribute differently in terms of their tendency. As shown in
Figure 9, the evaluations that have the participation of stakeholders as evaluators or at least a part of the evaluator groups achieved a positive or generally positive result. Only one third of the client-evaluated projects received a generally balanced result. No stakeholder-conducted evaluations produced a negative or generally negative evaluation result.
The sentiment levels of the evaluations carried out by the majority types of non-stakeholder evaluators, on the other hand, were distributed more broadly with both positive-dominant and negative-dominant results achieved (as shown in
Figure 9). Another noticeable characteristic presented by
Figure 9 is that the evaluations conducted by higher education organisations are the only type of evaluations that achieved no positive or generally positive results.
By converting the proportion of the Likert scores of the evaluations conducted by different types of evaluators, an average tendency level was obtained for each type of evaluator. The average Likert scales are illustrated in
Figure 10, which clearly demonstrates that the evaluations carried out by all types of stakeholder evaluators and mixed evaluator groups achieved an average score between positive and generally positive, while all those completed by non-stakeholders achieved an average score between generally positive and generally negative.
3. Discussion
3.1. How Is “Success” Defined in an Evaluation?
According to Chen, Bowring, and Davis [
35], different scholars and practitioners perceive the evaluation practices in the environmental design fields differently. While some of them believe that a project achieving high user satisfaction is successful, others believe that a project that is sustainable is successful. A further perspective comes from those who suggest that a project can be considered “successful” if it can meet its original development/design goals. Through analysing the collected cases, the researchers found that these examples were also evaluated under different models and each type of model has its advantages and disadvantages.
3.1.1. Goal Model
A major advantage of the “goal model” is its ability to specifically target evaluations towards the original goals of a project. This targeted approach holds the potential to minimise the workload and cost associated with evaluations. Additionally, baseline data are readily accessible for these evaluations since the original condition of a site is typically specifically investigated during the process of determining the development goals. Therefore, goal-related data are often available to serve as baseline data for evaluations.
However, it is important to acknowledge the potential risks associated with this evaluation approach. First, from a sustainability perspective, there is no assurance that the original goals of the project provide a baseline that is meaningful in sustainability terms. Further, by solely focusing on the intended function and performance of the evaluated projects, there is a possibility of neglecting any unforeseen consequences or outcomes that may arise. These unintended effects may arise due to an exclusive focus on the project goals and a lack of attention to broader contextual factors.
3.1.2. Satisfaction Model
The satisfaction model recognises that designed environments are generally human-focused. Asking the users of a project or other relevant individuals to determine the success of a project, therefore, is the most direct way of evaluating a project. However, there are also some disadvantages and challenges associated with the satisfaction model.
Firstly, the externality of environmental design projects (especially landscape-focused projects) determines that users’ satisfaction cannot always stand for the maximised collective human well-being in most cases. There are a wide range of examples that demonstrate this. For example, large backyards might contribute to high levels of users’ satisfaction but can result in unsustainable urban sprawl and ultimately lower the level of collective well-being of the community. Lush lawns, similarly, may be preferred by many, but their maintenance often requires significant amounts of water and chemical fertilisers, posing environmental sustainability concerns. Therefore, in such cases, it is worth questioning whether “satisfaction” is a suitable model for evaluation.
Secondly, the “user” of a landscape-focused project is often not as easy to be defined as the “user” of a building, since there are often no boundaries between a landscape project and its adjacent context. As an extreme example, for a wind farm development, identifying the “user” can be very challenging. Should it be the occasional visitors who briefly occupy the landscape, the hundreds of thousands of people constantly benefiting from the generated power without physically visiting the site, or the residents living half a kilometre away who are visually impacted by the wind farm? This ambiguity in defining the user, in some cases, poses difficulties in employing the satisfaction model.
3.1.3. Norm Model
The norm model is another important model adopted in many evaluation cases. The evaluations conducted with this model are often more comprehensive than both the goal model and the satisfaction model in terms of the factors that are taken into account (i.e., the norm-based evaluations adopt established frameworks, such as sustainability, productivity, resource consumption, ecosystem service etc.). Consequently, the norm model can better evaluate the unintended consequences that may occur in a project and is less susceptible to being influenced by external factors.
However, such evaluations, if conducted comprehensively, often require greater funding and labour resources, since more factors are likely to be considered and evaluated. For instance, the evaluations funded by the Landscape Architecture Foundation’s Case Study Investigation programme, as outlined in the CSI funding application instructions [
36,
37], typically require around 300 working hours to complete.
3.1.4. Multi-Model Evaluation
In analysing the collected cases, it is worth noting that around one third of the cases employed more than one model in their evaluations. The mixed use of models has the potential to be a good practice approach, as it helps minimise the potential drawbacks associated with each individual model. By incorporating multiple models, evaluations can benefit from a more balanced and comprehensive perspective, thus enhancing the effectiveness of the evaluation process.
3.2. Towards a More Comprehensive Evaluation
The results of this study indicated that the most commonly evaluated workflow stage was “design”, followed by “planning”, with fewer evaluations focusing on “maintenance” and “construction”. The emphasis on evaluating design and planning stages reflects the importance of these early phases in influencing project outcomes. However, the lower emphasis on evaluating construction and maintenance stages may limit our understanding of how well projects perform under real-world conditions and in the long term. Construction and maintenance can significantly impact a project’s functionality, sustainability, and longevity. Therefore, considering these stages in evaluations offers a means for obtaining a comprehensive understanding of project performance.
In the realm of environmental performance evaluation, the majority of methods employed are satisfaction-based approaches, such as surveys, interviews, and focus groups, which aim to gauge users’ satisfaction and perceptions of a project’s success. As discussed in
Section 3.1, while these approaches are efficient and straightforward, it is also essential to understand their associated limitations including the impacts of externality and the challenge of defining the “user” of a project. In some cases, these limitations raise the question of whether solely relying on user satisfaction is sufficient to comprehensively evaluate landscape performance.
It is also worth noting that due to a broad disciplinary spectrum, landscape architects, as well as some of their allied professionals, often have limited knowledge and skills in conducting in-depth data collection and analysis. Their evaluations, therefore, tend to heavily rely on second-hand data, which may limit the potential of their evaluations. While employing second-hand data offers many benefits, environmental performance evaluations can also benefit from a closer collaboration with professionals from various disciplines, such as environmental sciences and engineering. By leveraging the expertise of relevant specialists, landscape architects and other environmental design professionals can access a broader range of methodologies and ensure a more robust evaluation process.
3.3. Towards a More Diverse Spectrum of Evaluations
The analysis of evaluation results revealed a strong correlation between the funding source types and the evaluation outcomes. Evaluations funded by stakeholders, such as clients and construction contractors, had a higher tendency for positive results compared to evaluations funded by non-stakeholders, such as government or research organisations. Similarly, evaluations conducted by stakeholders or involving stakeholder participation showed a higher likelihood of positive results, while non-stakeholder-conducted evaluations exhibited a broader distribution of sentiments. A possible explanation is that stakeholders may have a vested interest in demonstrating the success of their projects, potentially influencing evaluation outcomes. However, it is more likely that the different tendencies arise from the varying emphases determined by different evaluation mechanisms. This echoes the observations of Chen, Bowring, and Davis [
30]’s previous study. According to their study, concerns over potential negative evaluations are one of the main barriers preventing the implementation of evaluation practices in the environmental design field. In order to overcome this barrier, there are two viable strategies: the “stand-alone” strategy that seeks contributions from independent non-stakeholder funders and evaluators, and the “benefits-oriented” strategy that seeks insights from stakeholders while purposely focusing more on the “benefits” of the projects being evaluated, rather than the “lessons” of the projects. The stakeholder-funded/conducted evaluation may have followed this “benefits-oriented” mechanism, explaining the higher tendency for positive evaluations due to intentional emphasis on project benefits or stakeholders’ participation only when confident about their project’s outcome. In this case, the in-house evaluations may indicate a better project performance.
As a representative example identified by Chen, Bowring, and Davis [
30], the CSI programme serves as a parallel to the stakeholder-involved evaluations examined in this study. The CSI programme selects only high-performing projects for evaluations, which ensured the positive results of the evaluation. While this strategy may place less focus on lessons, it significantly increases the involvement and support of designers and other stakeholders, who are normally crucial for a deeper understanding of the performance of the projects being evaluated. Furthermore, the well-researched benefits resulting from CSI evaluations can enhance communication of the value of environmental design practices.
However, evaluations conducted under the “stand-alone” mechanism are also necessary to better comprehend the “lesson” aspect of our built environments. The in-house or stakeholder-involved evaluations studied in this research exhibit a naturally distributed sentiment/tendency of their evaluation results, which illustrate their value in deepening the profession’s understanding of the “lesson” side of performance. Studying these cases, therefore, also provides a methodology overview of the practices conducted beyond the “benefits-oriented” mechanism, serving as a complementary parallel to the LAF’s methodology guidebook.
4. Conclusions
This study sheds light on landscape performance evaluation practices in New Zealand and provides an overview of how “success” is defined and assessed in these evaluations. The analysis identifies a range of evaluation models, each with its advantages and limitations. While the goal model enables targeted evaluations based on project goals, the satisfaction model gauges user perceptions, and the norm model provides comprehensive assessments. However, it is essential to acknowledge the potential risks and challenges associated with each model, such as neglecting unintended consequences or the externality of the satisfaction-based approaches.
This study emphasises the need to broaden the scope of evaluation to encompass all project stages, including construction and maintenance, which have a significant impact on project performance. By considering these stages, a more comprehensive understanding of project success can be achieved. Further, a broader and more comprehensive frame for evaluations also contributes to a more robust understanding of how projects perform in sustainability terms, rather than simply focusing on design.
Furthermore, the correlation between funding sources and evaluation outcomes highlights the influence of stakeholders’ interests on evaluation results. Stakeholder-funded evaluations tend to yield more positive results. Although it is possible that the different tendencies arise from the stakeholders’ vested interest in demonstrating project success, it is more likely that the tendency results from varying emphases determined by different evaluation mechanisms. This observation echoes a previous study emphasising the values of both evaluation mechanisms. It is worth noting that due to the methodological limitation of the non-probability sampling approach adopted by this study, the intensity of the observed correlation is only to be taken as being indicative. Although this study was not specifically designed to be quantitative and statistical, the effects that funding sources and evaluator types can have on the evaluation results are still noteworthy. The purpose of sharing this observation is to draw future researchers’ attention to this interesting phenomenon, thereby catalysing further conversations and quantitative/statistical studies on this observed tendency.
To enhance evaluation practices, collaboration with professionals from diverse disciplines, such as environmental sciences and engineering, is crucial. Leveraging their expertise can ensure a robust evaluation process and access to a wider range of methodologies.
By achieving a better understanding of how “success” is defined and evaluated in practice, this study intends to advance landscape performance evaluation approaches and further promote evidence-based decision making, thereby helping the built environment industry move closer to achieving sustainable development goals.
Author Contributions
Conceptualization, G.C., J.B. and S.D.; methodology, G.C., J.B. and S.D.; software, G.C.; formal analysis, G.C.; investigation, G.C.; writing—original draft preparation, G.C.; writing—review and editing, G.C., J.B. and S.D.; visualization, G.C.; supervision, J.B. and S.D. All authors have read and agreed to the published version of the manuscript.
Funding
This publication has been partially financed by the Lincoln University Open Access Fund.
Institutional Review Board Statement
Not applicable.
Informed Consent Statement
Not applicable.
Data Availability Statement
Some data presented in this study are available from the corresponding author, upon reasonable request.
Conflicts of Interest
The authors declare no conflict of interest.
References
- United Nations Environment Programme. 2020 Global Status Report for Buildings and Construction: Towards a Zero-Emission, Efficient and Resilient Buildings and Construction Sector; United Nations: Nairobi, Kenya, 2020. [Google Scholar]
- Organisation for Economic Co-operation and Development. Development. Interim Report of the Green Growth Strategy: Implementing Our Commitment for a Sustainable Future; OECD Publishing: Paris, France, 2010. [Google Scholar]
- United Nations Environment Programme. A Guidance Manual for Green Economy Policy Assessment; United Nations: New York, NY, USA, 2014. [Google Scholar]
- Söderholm, P. The green economy transition: The challenges of technological change for sustainability. Sustain. Earth 2020, 3, 6. [Google Scholar] [CrossRef]
- Yu, R.; Gu, N.; Ostwald, M.J. Architects’ Perceptions about Sustainable Design Practice and the Support Provided for This by Digital Tools: A Study in Australia. Sustainability 2022, 14, 13849. [Google Scholar] [CrossRef]
- Hosey, L. Going beyond the Punchlist: Why Architects Should Embrace Post-Occupancy Evaluations. Available online: https://www.metropolismag.com/architecture/architecture-post-occupancy-evaluations/ (accessed on 29 April 2023).
- Ozdil, T.R. Social value of urban landscapes: Performance study lessons from two iconic Texas projects. Landsc. Archit. Front. 2016, 4, 12–30. [Google Scholar]
- Preiser, W.F.E.; Rabinowitz, H.Z.; White, E.T. Post-Occupancy Evaluation; Van Nostrand Reinhold Company: New York, NY, USA, 1988. [Google Scholar]
- Preiser, W.F.E.; Vischer, J.C. Assessing Building Performance; Routledge: Abingdon, UK, 2005. [Google Scholar]
- Preiser, W.F.E.; Nasar, J.L. Assessing building performance: Its evolution from post-occupancy evaluation. Int. J. Archit. Res. 2008, 2, 84–99. [Google Scholar] [CrossRef]
- Hiromoto, J. Architect & Design Sustainable Design Leaders: Post Occupancy Evaluation Survey Report; SOM: New York, NY, USA, 2015. [Google Scholar]
- Carmona, M.; Sieh, L. Performance measurement in planning—Towards a holistic view. Environ. Plan. C Gov. Policy 2008, 26, 428–454. [Google Scholar] [CrossRef]
- Carmona, M.; Sieh, L. Performance measurement innovation in English planning authorities. Plan. Theory Pract. 2005, 6, 303–333. [Google Scholar] [CrossRef]
- Seasons, M. Monitoring and evaluation in municipal planning: Considering the realities. J. Am. Plan. Assoc. 2003, 69, 430–440. [Google Scholar] [CrossRef]
- Arnold, P. Best of both worlds with POE. Build 2011, 123, 38–39. [Google Scholar]
- Canfield, J.; Yang, B.; Whitlow, H. Evaluating Landscape Performance—A Guidebook for Metrics and Methods Selection; Landscape Architecture Foundation: Washington, DC, USA, 2018. [Google Scholar]
- Ozdil, T.R. Economic Value of Urban Design; VDM Publishing: Munich, Germany, 2008. [Google Scholar]
- Lang, J. Urban Design: A Typology of Procedures and Products; Routledge: Jordan Hill, LA, USA, 2005. [Google Scholar]
- Marcus, C.C.; Francis, C. People Places: Design Guidelines for Urban Open Space; John Wiley & Sons: Hoboken, NJ, USA, 1997. [Google Scholar]
- Francis, M. A Case Study Method For Landscape Architecture. Landsc. J. 1999, 20, 15–29. [Google Scholar] [CrossRef]
- Preiser, W.F.E.; Davis, A.T.; Salama, A.M.; Hardy, A. Architecture Beyond Criticism: Expert Judgment and Performance Evaluation; Routledge: Abingdon, UK, 2014. [Google Scholar]
- Marcus, C.C.; Tacha, A.; Drum, R.; Artuso, S.; Dockham, K. Why don’t landscape architects perform more POEs? Landsc. Archit. 2008, 98, 16–21. [Google Scholar]
- Vischer, J. Post-occupancy evaluation: A multifaceted tool for building improvement. In Learning from out Buildings: A State-of-the-Practice Summary of Post-Occupancy Evaluation; The National Academies Press: Washington DC, USA, 2001; pp. 23–34. [Google Scholar]
- Bowring, J. Landscape Architecture Criticism; Routledge: London, UK, 2020. [Google Scholar]
- Laurian, L.; Crawford, J.; Day, M.; Kouwenhoven, P.; Mason, G.; Ericksen, N.; Beattie, L. Evaluating the Outcomes of Plans: Theory, Practice, and Methodology. Environ. Plan. B Plan. Des. 2010, 37, 740–757. [Google Scholar] [CrossRef]
- Zimmerman, A.; Martin, M. Post-occupancy evaluation: Benefits and barriers. Build. Res. Inf. 2001, 29, 168–174. [Google Scholar] [CrossRef]
- Cooper, I. Post-occupancy evaluation-where are you? Build. Res. Inf. 2001, 29, 158–163. [Google Scholar] [CrossRef]
- Hadjri, K.; Crozier, C. Post-occupancy evaluation: Purpose, benefits and barriers. Facilities 2009, 27, 21–33. [Google Scholar] [CrossRef]
- Hardy, C. SWA: The post-occupancy initiative. Landsc. Archit. Front. 2015, 3, 112–123. [Google Scholar]
- Chen, G.; Bowring, J.; Davis, S. Performance Evaluation: Identifying Barriers and Enablers for Landscape Architecture Practice. Architecture 2021, 1, 140–160. [Google Scholar] [CrossRef]
- Yin, R.K. Case Study Research: Design and Methods, 5th ed.; Sage: Thousand Oaks, CA, USA, 2014; p. 282. [Google Scholar]
- Small, M.L. ‘How many cases do I need?’: On science and the logic of case selection in field-based research. Ethnography 2009, 10, 5–38. [Google Scholar] [CrossRef]
- Fusch, P.I.; Ness, L.R. Are we there yet? Data saturation in qualitative research. Qual. Rep. 2015, 20, 1408. [Google Scholar] [CrossRef]
- Deming, M.E.; Swaffield, S. Landscape Architecture Research: Inquiry, Strategy, Design; John Wiley & Sons, Inc.: Hoboken, NJ, USA, 2011. [Google Scholar]
- Chen, G.; Bowring, J.; Davis, S. Exploring the Terminology, Definitions, and Forms of Post-Occupancy Evaluation (POE) in Landscape Architecture. Land 2023, 12, 882. [Google Scholar] [CrossRef]
- Landscape Architecture Foundation. LAF Case Study Investigation Program Application Instructions: CSI Research Fellows. Available online: https://www.lafoundation.org/sites/default/files/2019-09/CSI-2020-Research-Fellow-Application-Instructions.pdf (accessed on 1 April 2022).
- Landscape Architecture Foundation. LAF Case Study Investigation Program Application Instructions: Project Proposal for Firms. Available online: https://www.lafoundation.org/sites/default/files/2019-09/CSI-2020-Firm-Project-Proposal-Instructions.pdf (accessed on 1 April 2022).
| Disclaimer/Publisher’s Note: The statements, opinions and data contained in all publications are solely those of the individual author(s) and contributor(s) and not of MDPI and/or the editor(s). MDPI and/or the editor(s) disclaim responsibility for any injury to people or property resulting from any ideas, methods, instructions or products referred to in the content. |
© 2023 by the authors. Licensee MDPI, Basel, Switzerland. This article is an open access article distributed under the terms and conditions of the Creative Commons Attribution (CC BY) license (https://creativecommons.org/licenses/by/4.0/).

_Chen.jpg)

