

Investigation of Indoor Thermal Environment and Heat-Using Behavior for Heat-Metering Households in Northern China

Abstract
:1. Introduction

| Year | Content | Regulations and Technical Standards |
|---|---|---|
| 1995 | Plan for the installation of heat meters | The 9th Five-year Plan and 2010 Plan for Building Energy Conservation of the Ministry of Construction |
| 1999 | Room temperature regulation suggested during the design phase | Code for Residential Building Design GB50096-1999 [15] |
| 1999 | Implementation of temperature regulation and heat-metering devices for new buildings | Provisions on the administration of energy conservation in civil buildings |
| 2003 | Gradual implementation of charging by heat metering | Guidance on the Pilot Work of Urban Heating System Reform |
| 2007 | Indoor temperature control devices and thermal control metering devices installed mandatorily | Code for Acceptance of Energy Efficient Building Construction |
| 2008 | Requirement for the energy-saving retrofit of a heating system carried out synchronously with the retrofit of heat metering | Technical Guidelines for Heating Metering and Energy Saving Renovation of Existing Residential Buildings in Northern Heating Area |
| 2008 | Formulation of measures for the administration of heating metering in civil buildings | Measures for the Administration of Heating Metering in Civil Buildings |
| 2009 | Stipulations for the heat-metering design of new buildings and the retrofit of existing buildings | Technical Guidelines for Heating Metering [16] |
| 2013 | Heating system assessment, retrofitting on energy efficiency, installation, and acceptance | Technical code for retrofitting of heating system on energy efficiency [17] |
| 2017 | Evaluation method of energy consumption | Evaluation method of energy consumption for district heating system [18] |
| 2018 | Functional requirements, physical layer, data link layer, data security, and application layer of household metering data transmission | Technical requirements of utility meters data transmission [19] |
| 2020 | Manufacture and testing of heat meters | Heat meters [20] |
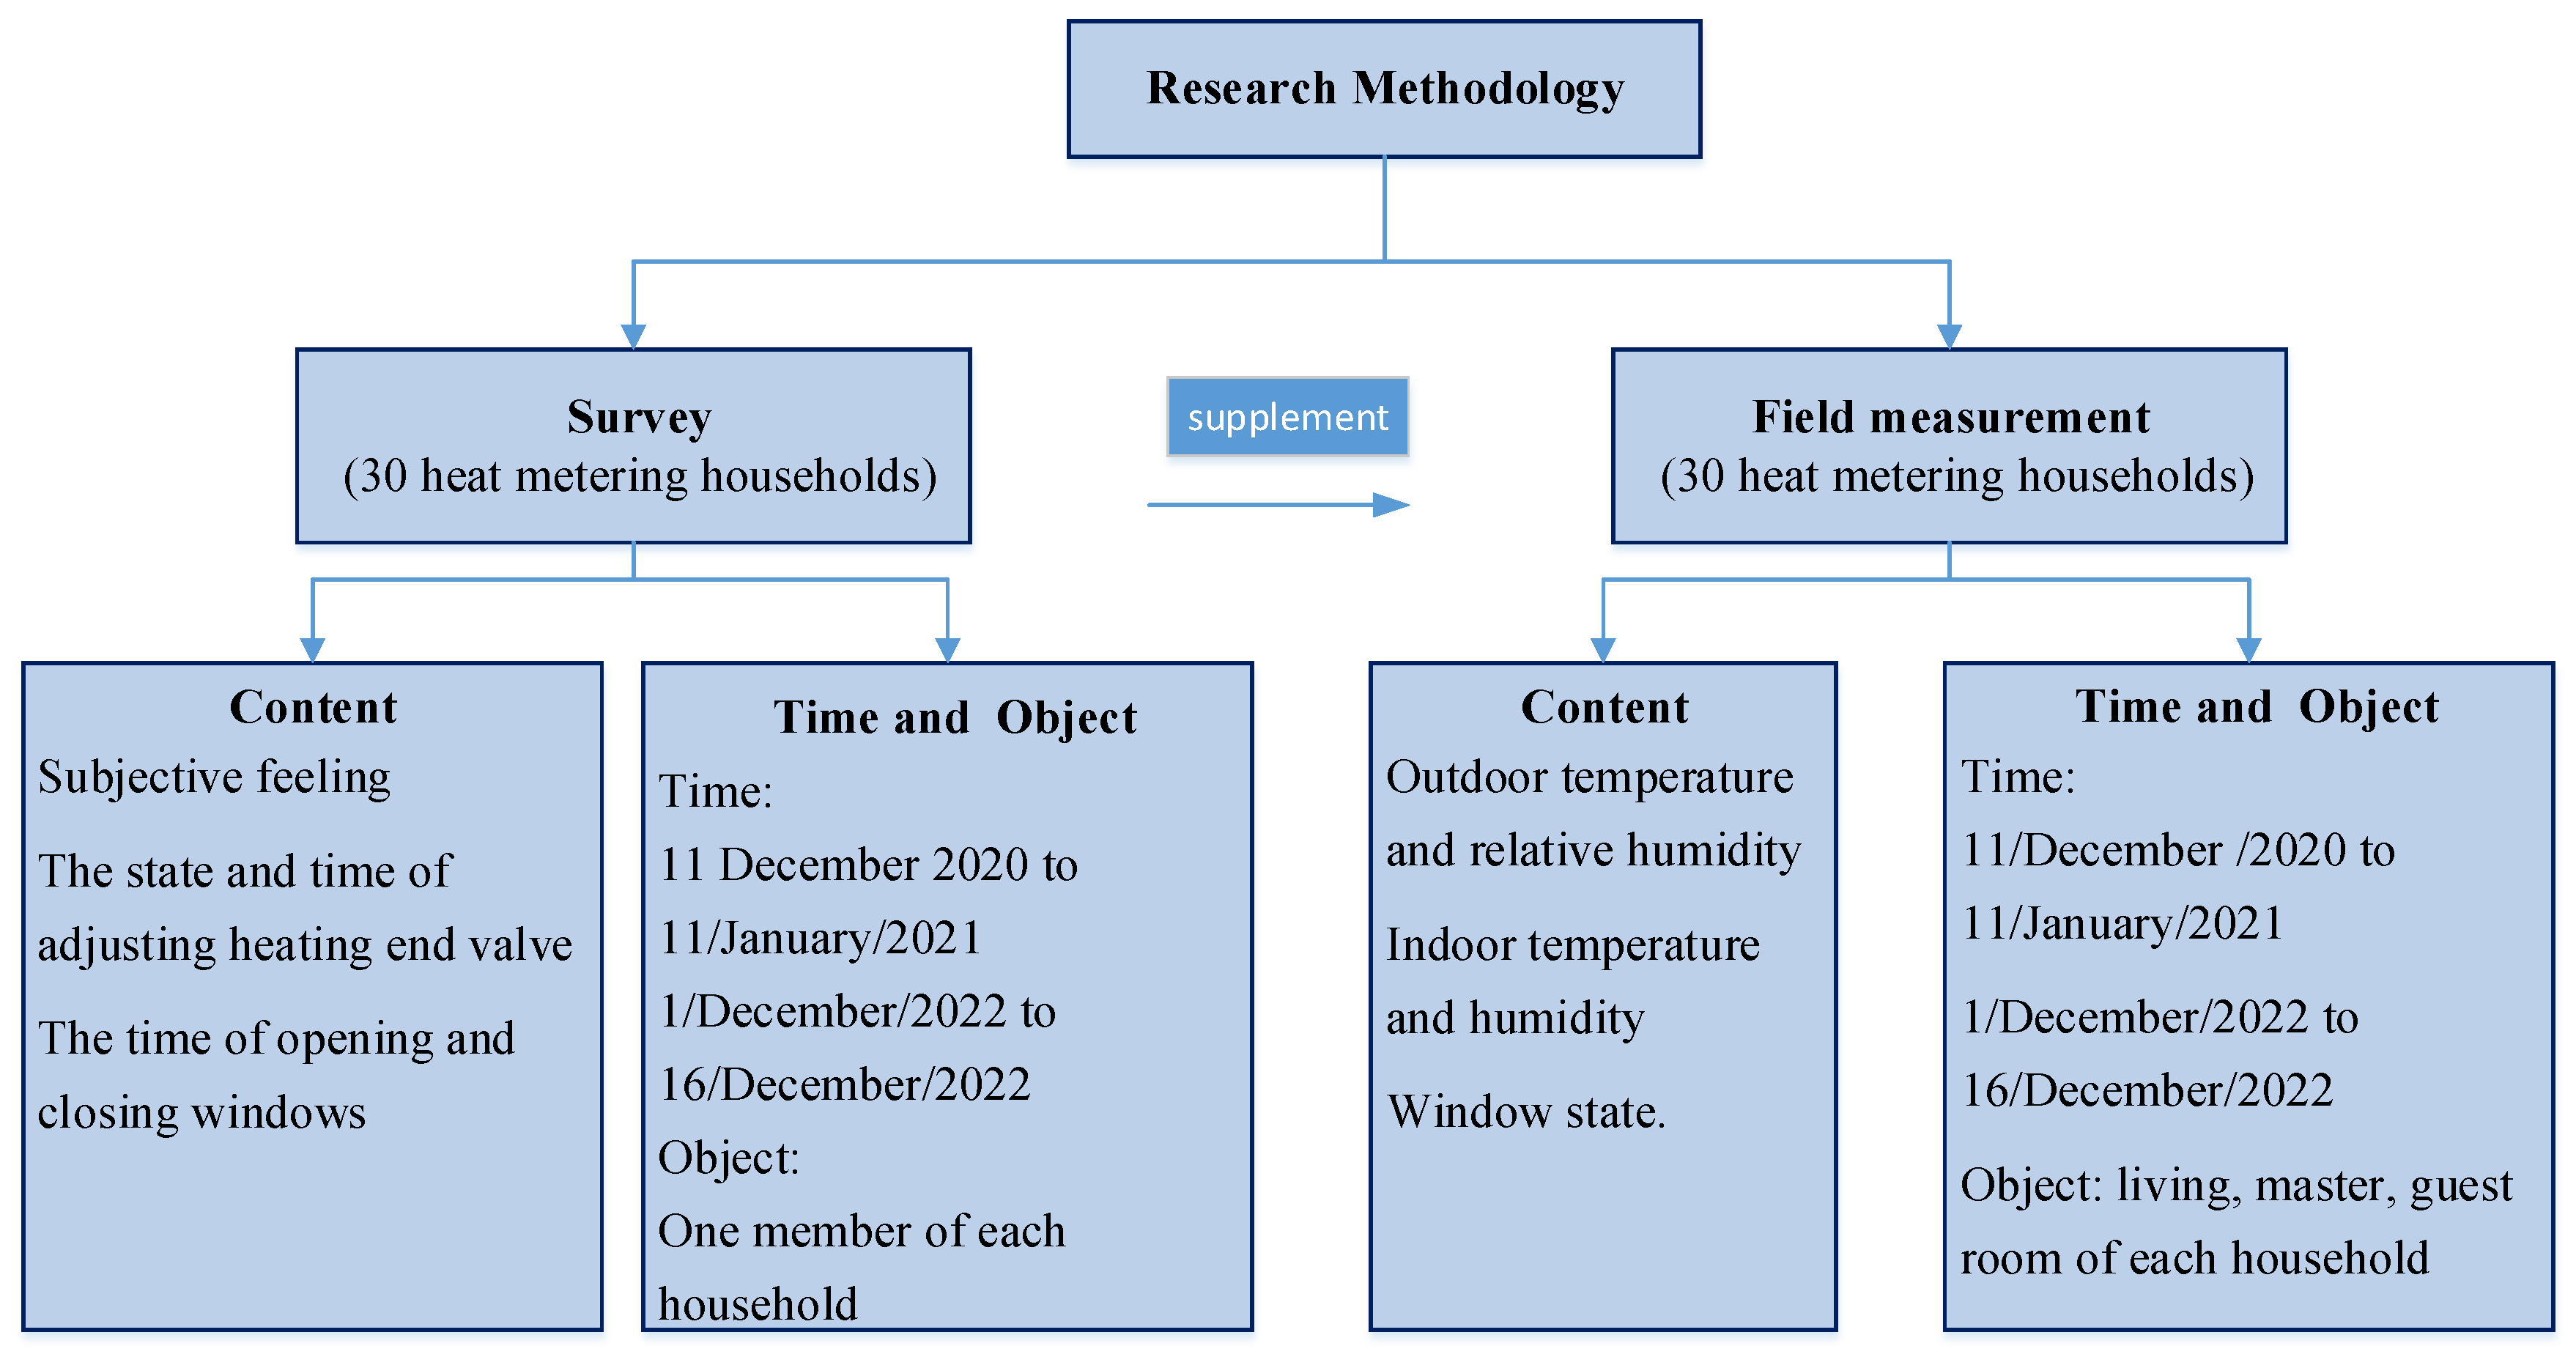
2. Research Methodology
2.1. Field Measurement
2.2. Survey
2.3. Data Analysis Methodology
3. Results and Analysis
3.1. Indoor Thermal Environment
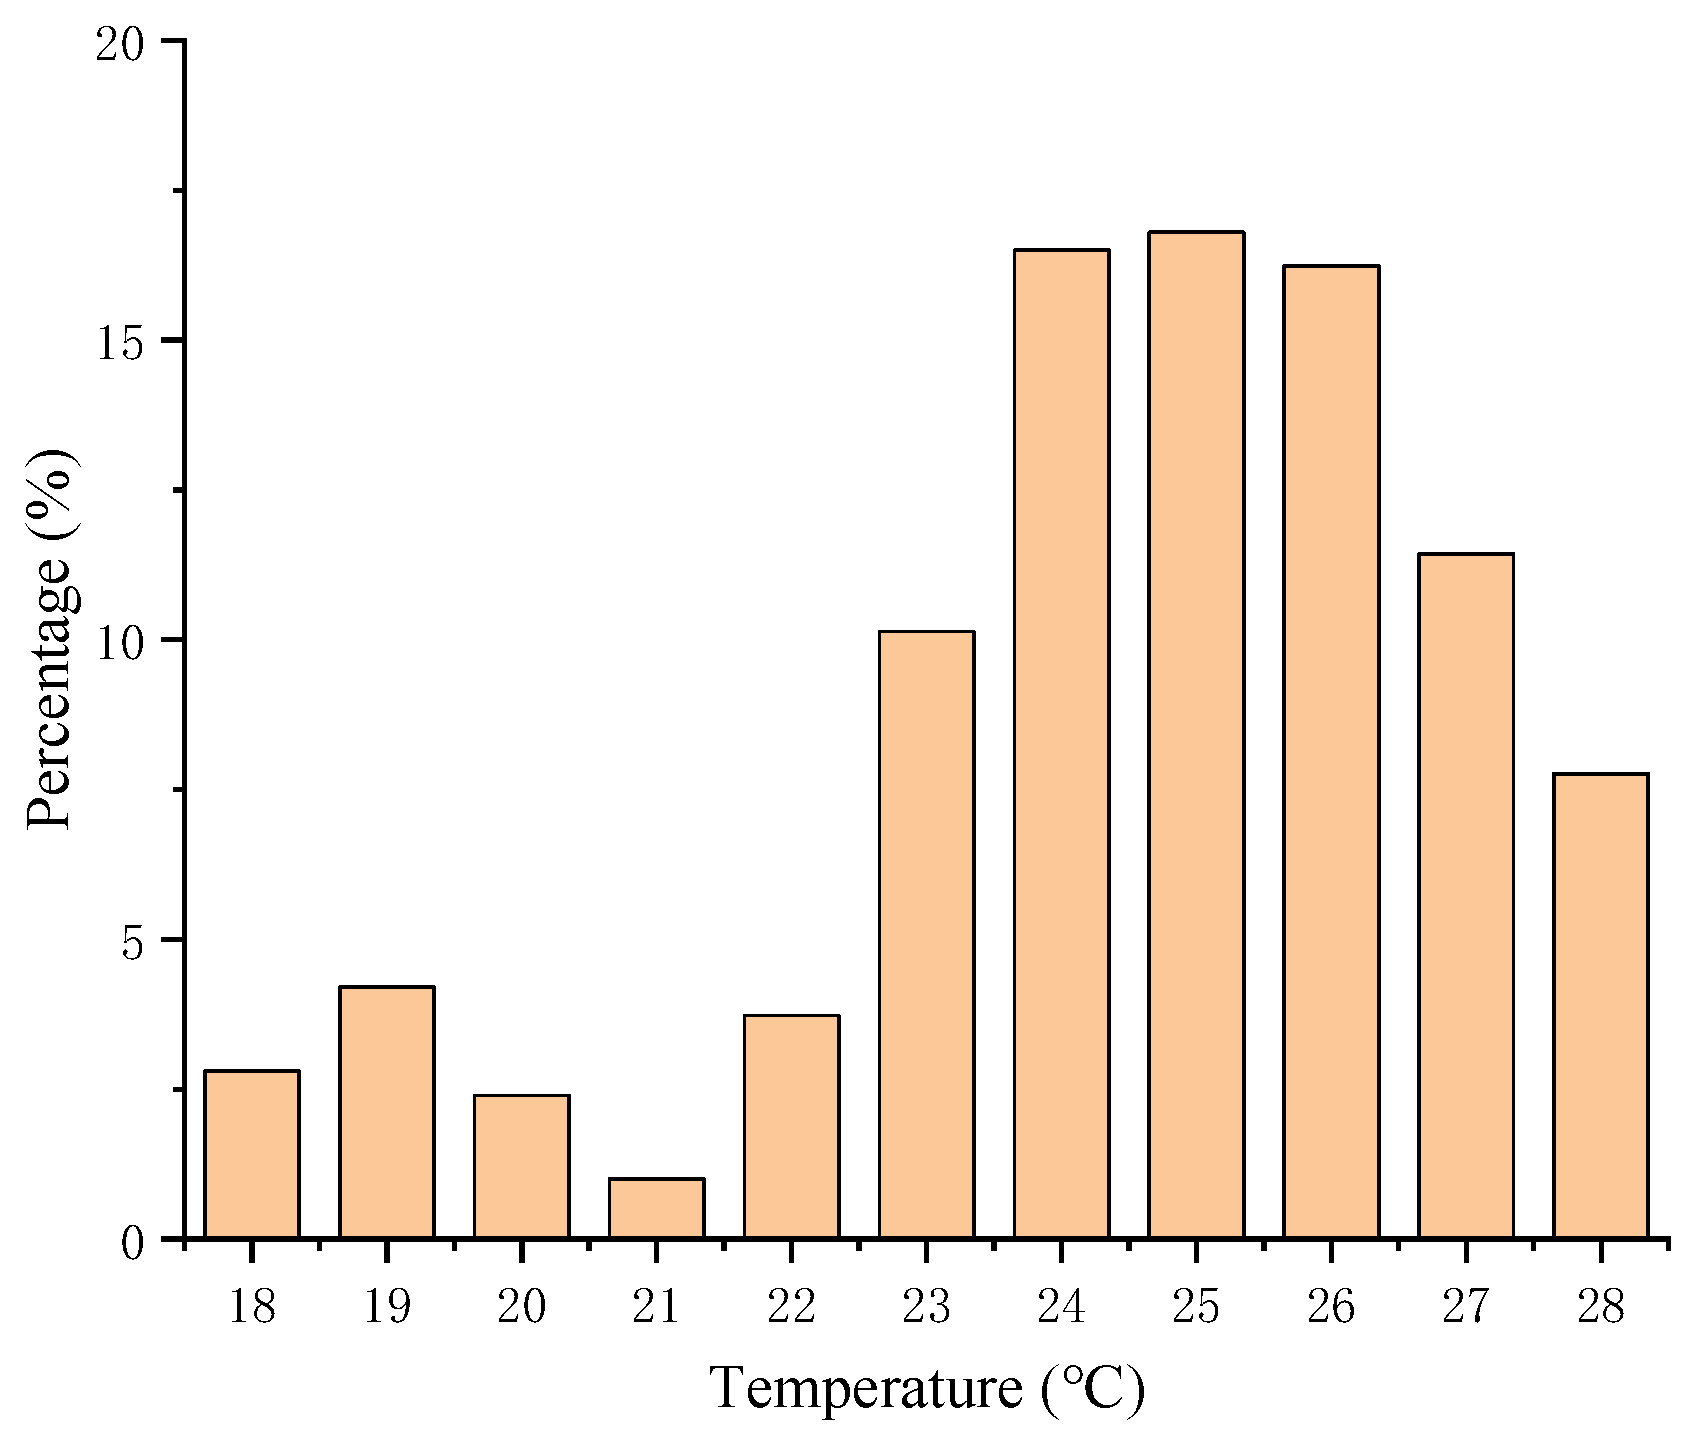
3.1.1. Indoor Thermal Environment Distribution
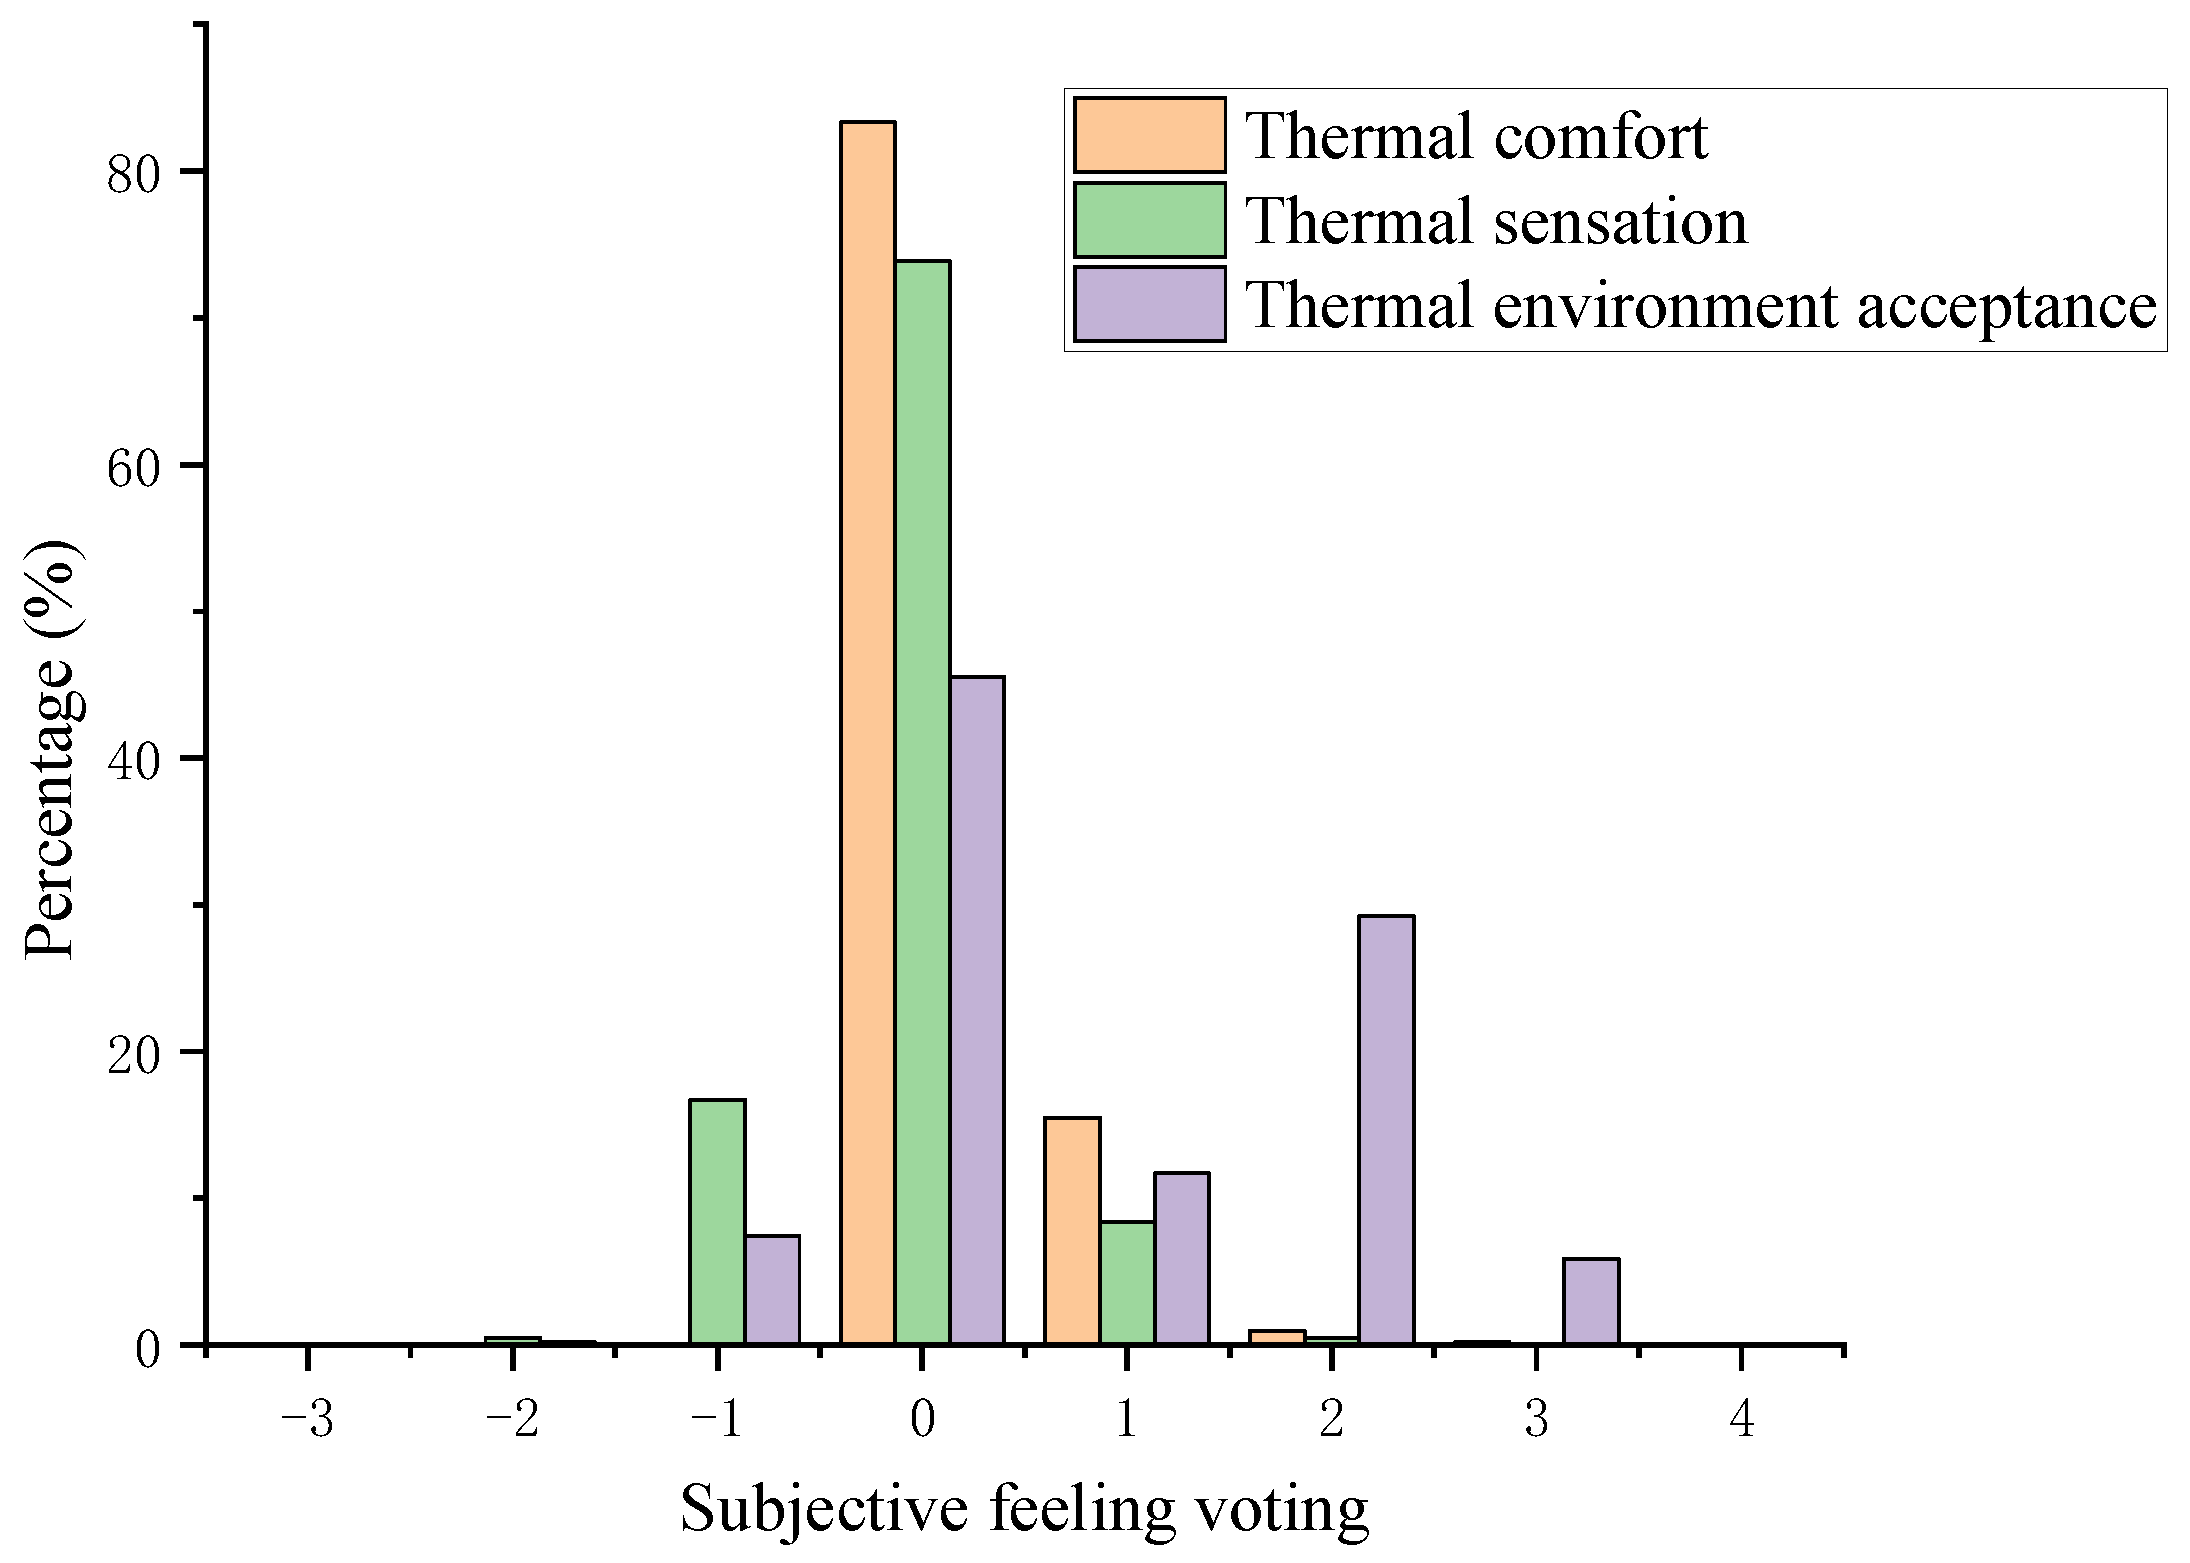
3.1.2. Satisfaction with Thermal Comfort
3.1.3. Acceptable Temperature Range
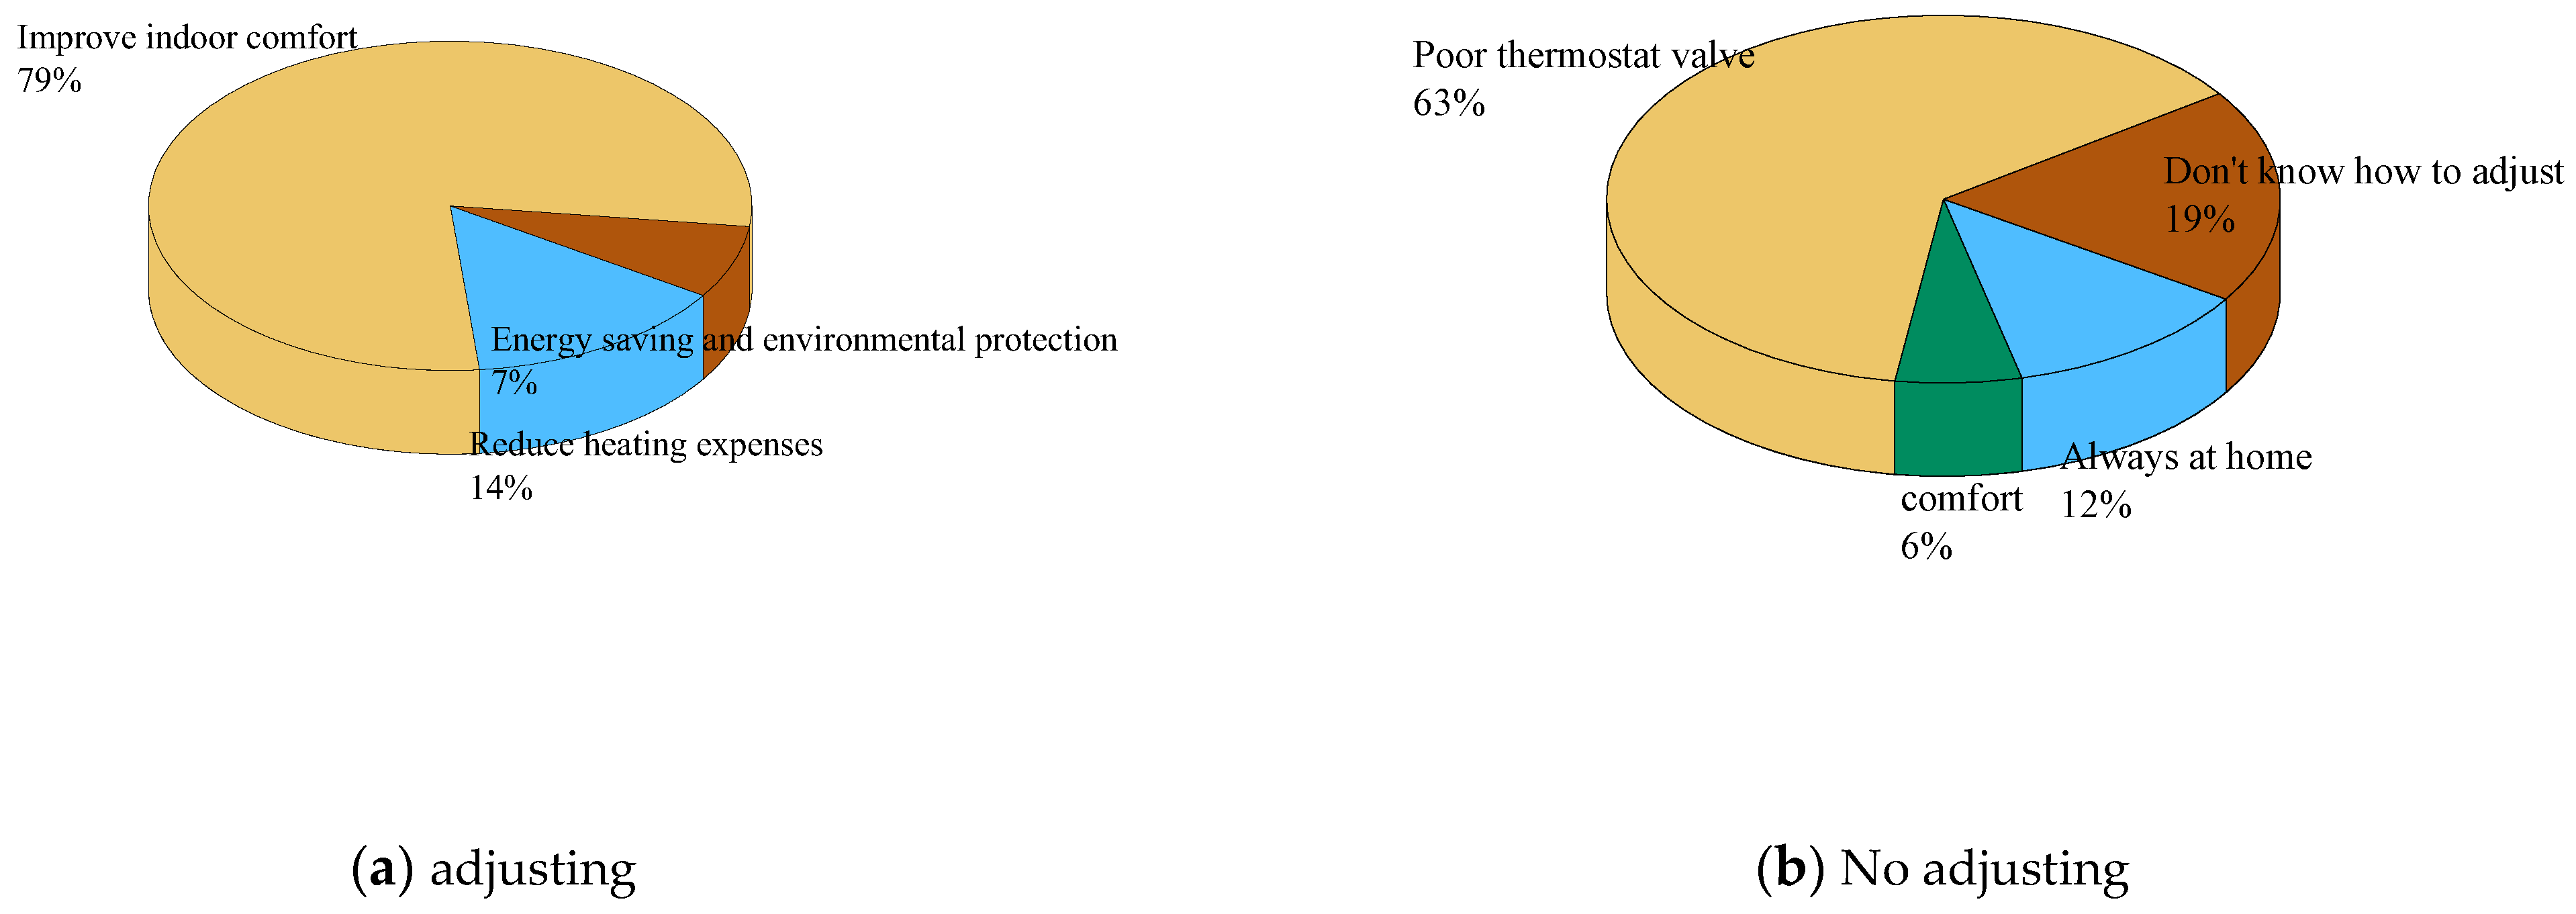
3.2. Adjusting Heating End Valve
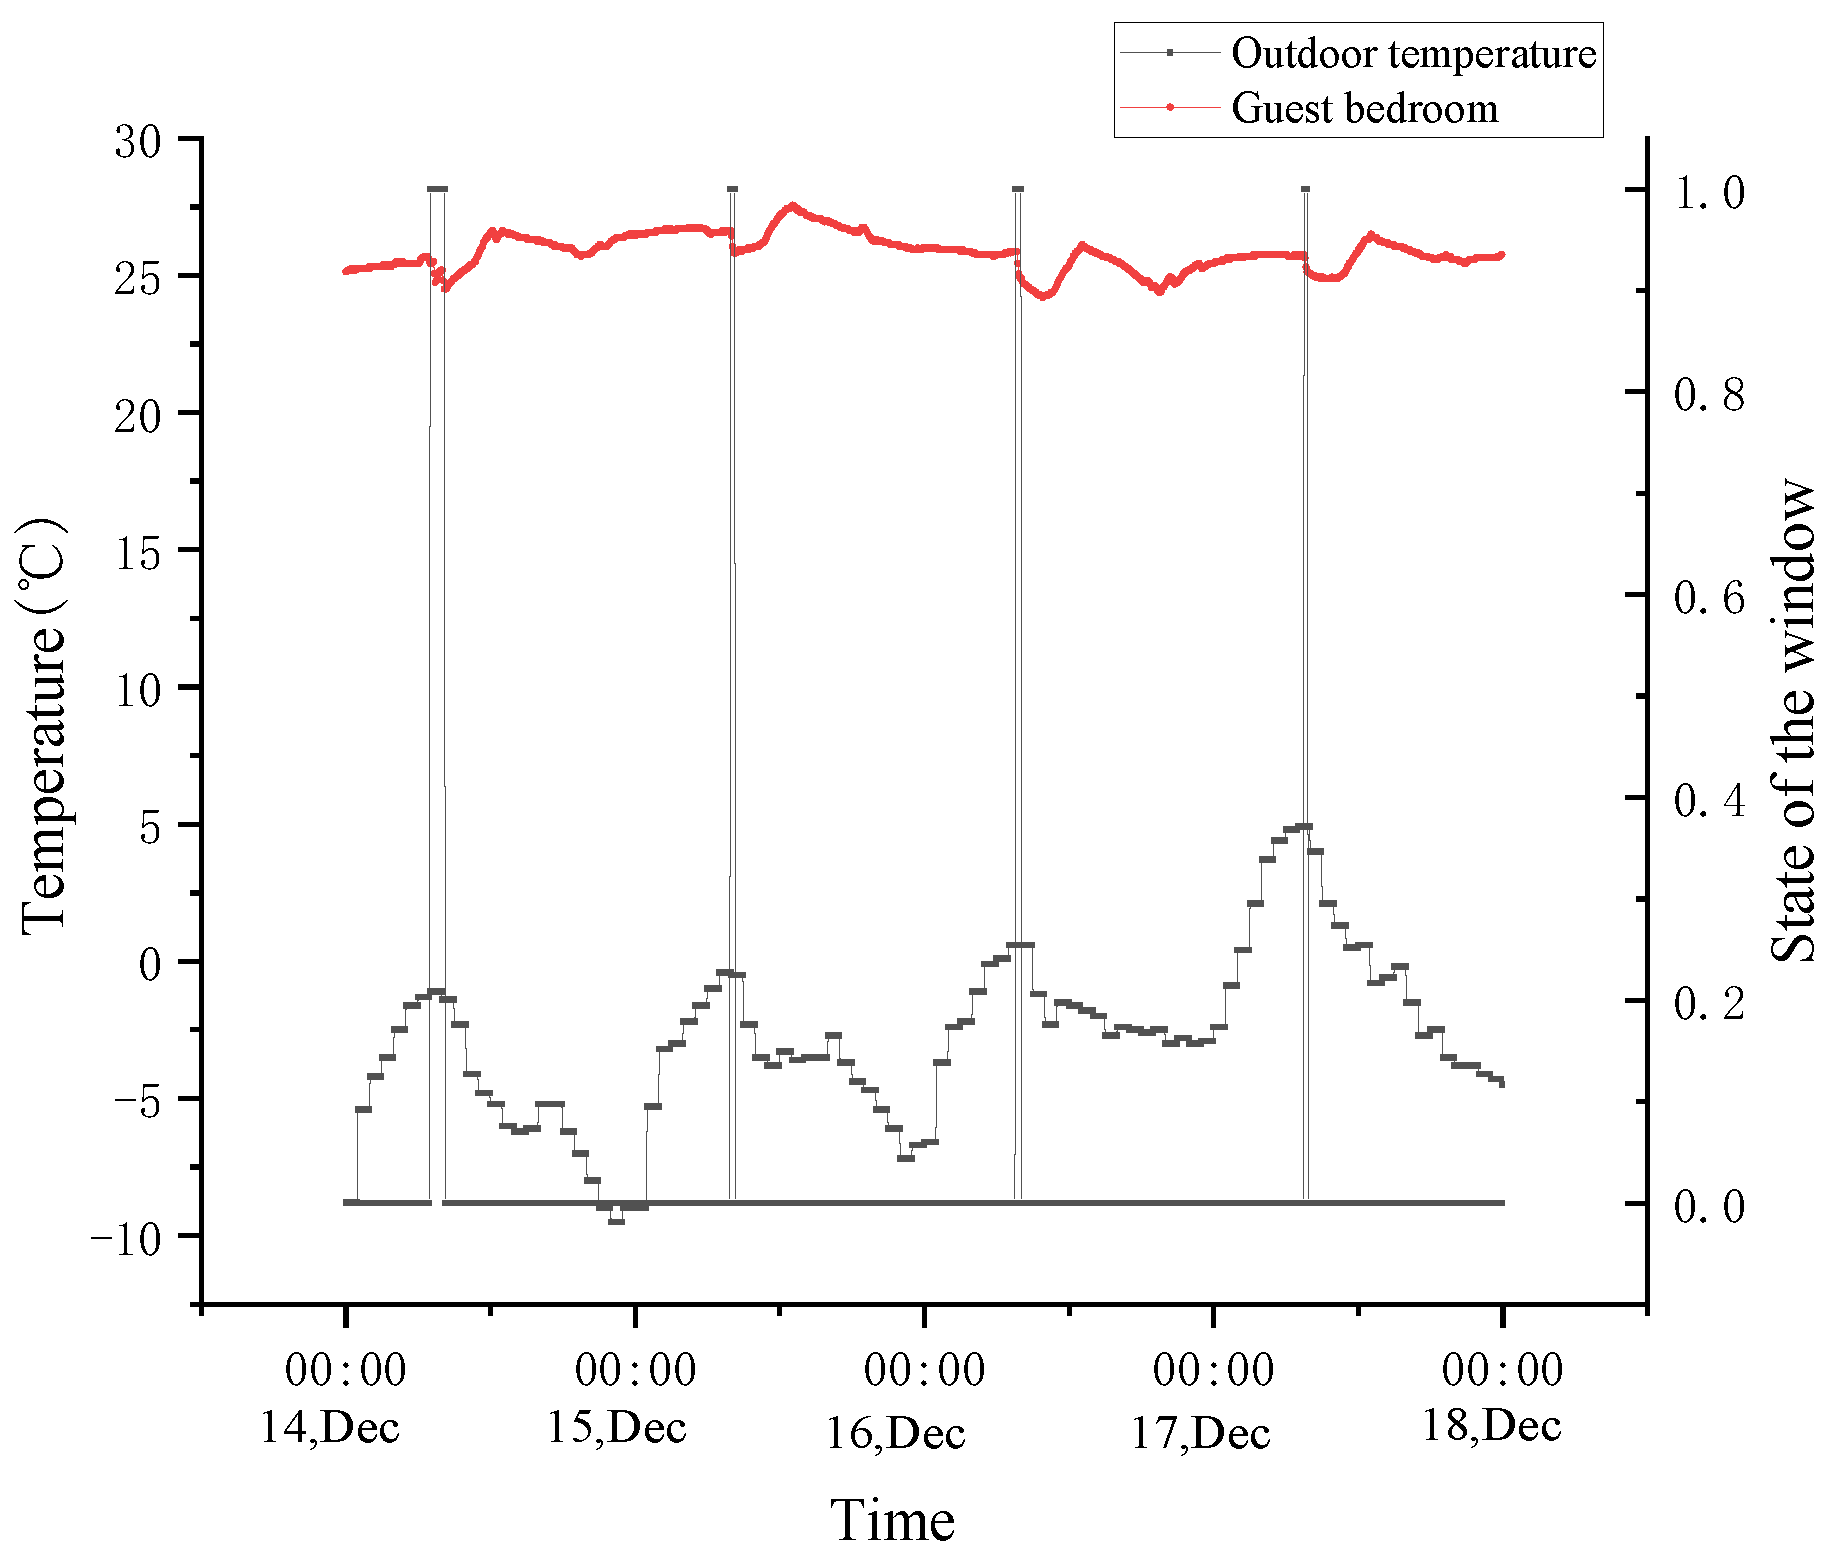
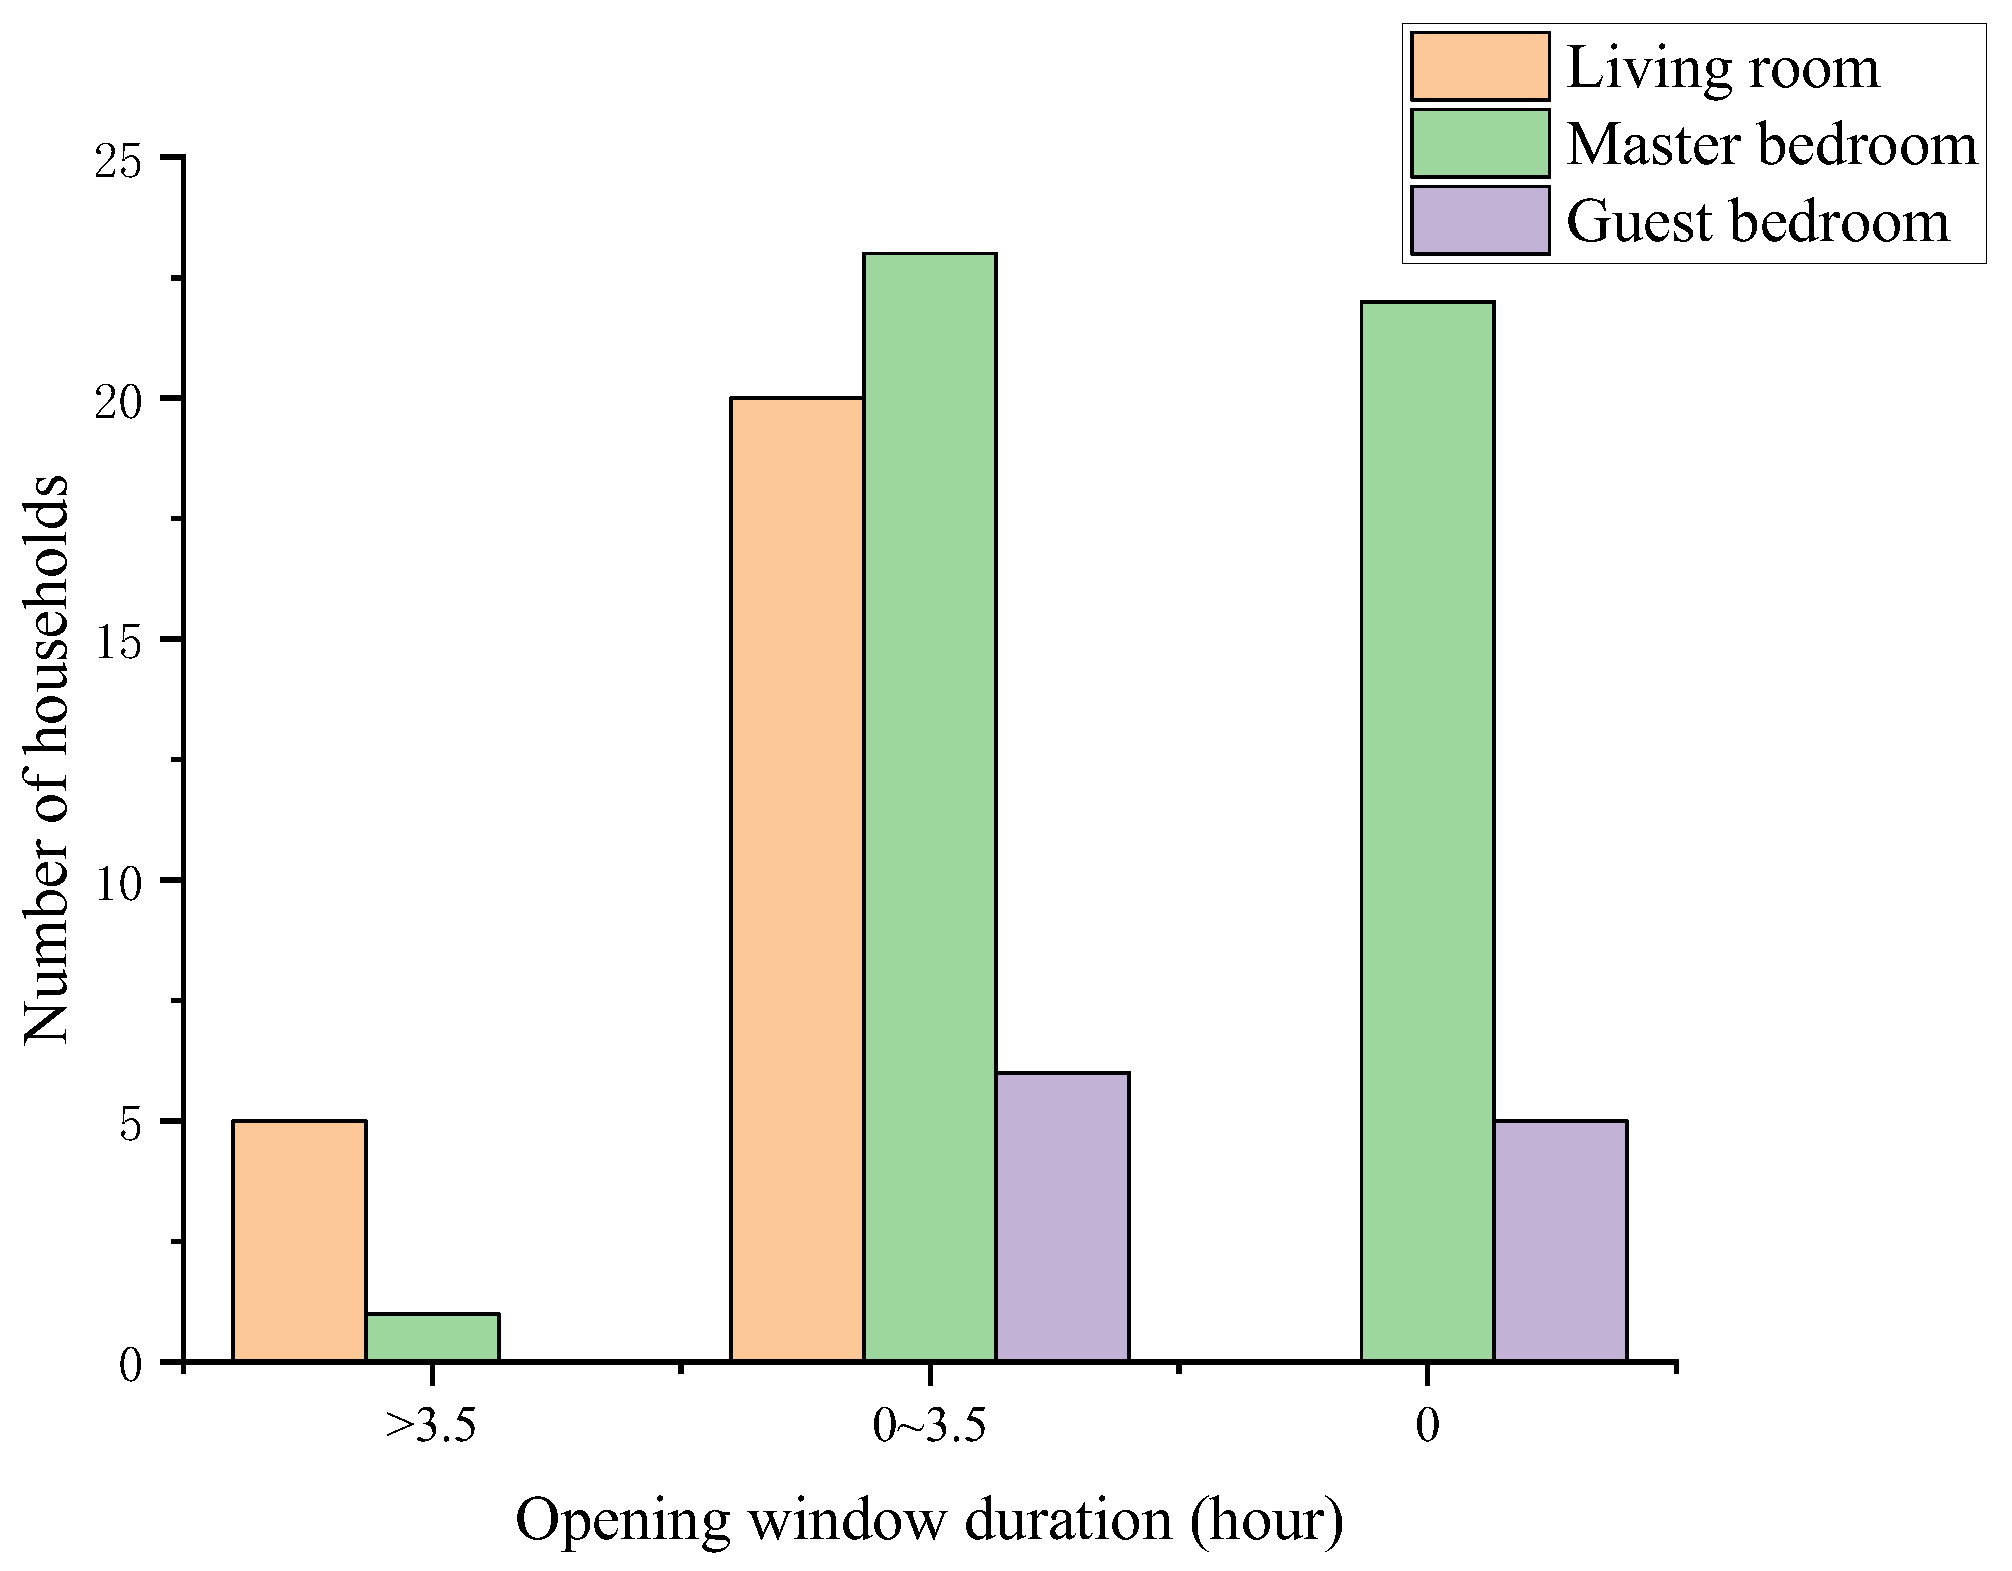
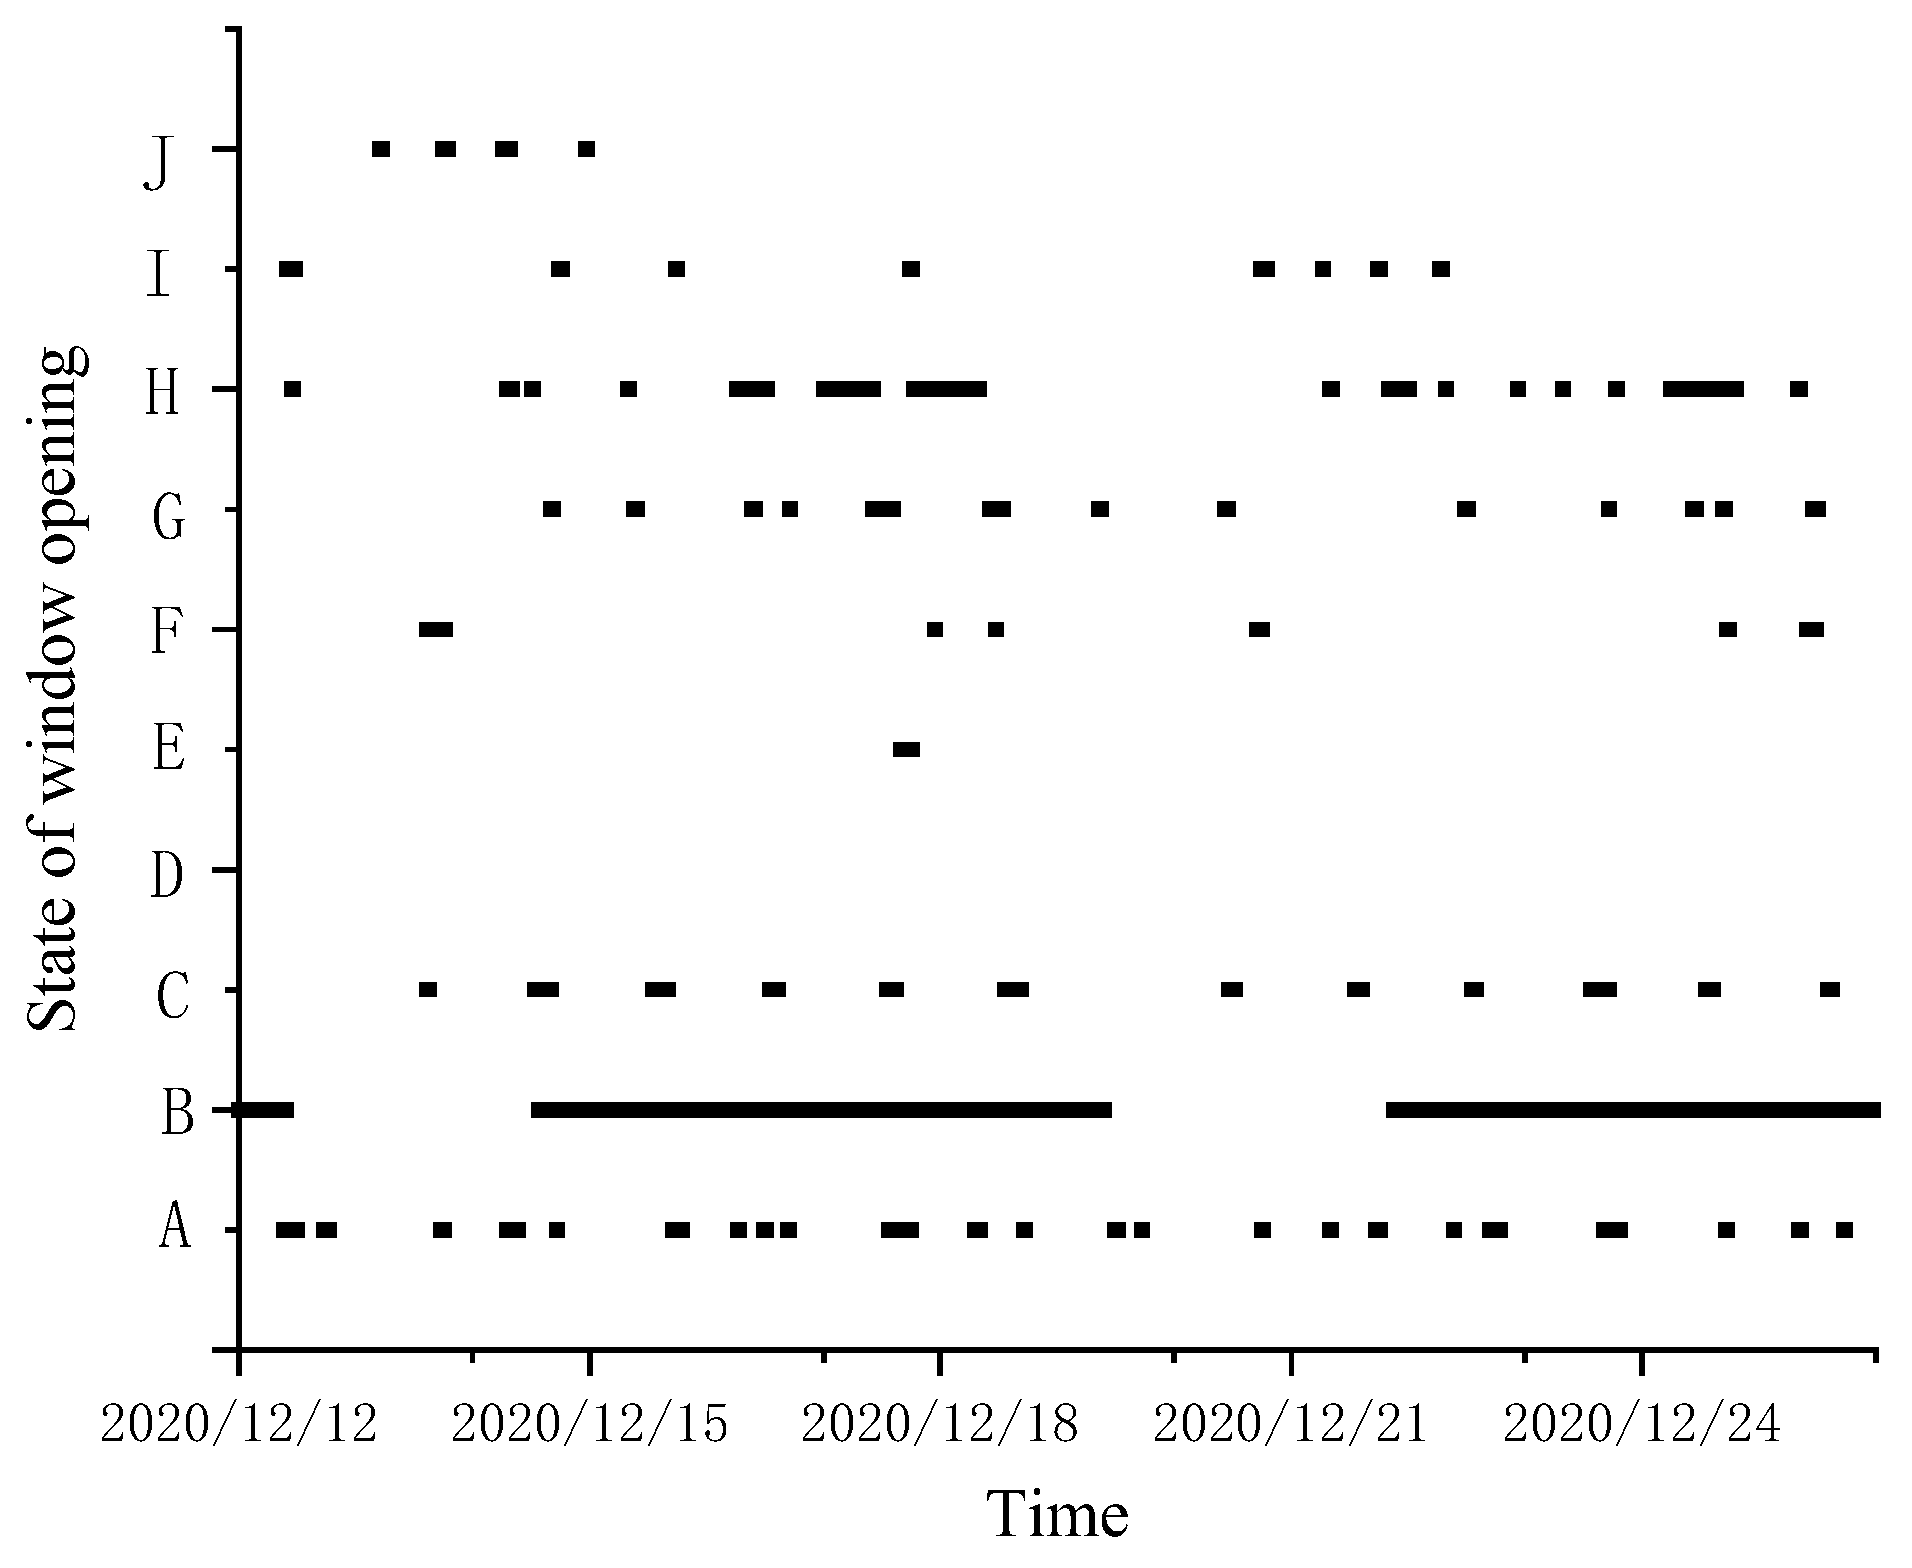
3.3. Operating Windows
4. Discussion
4.1. Indoor Thermal Environment
4.2. Heat-Using Behavior
4.3. Heating Meters Propaganda
4.4. Thermostat Valve
5. Conclusions
- (1)
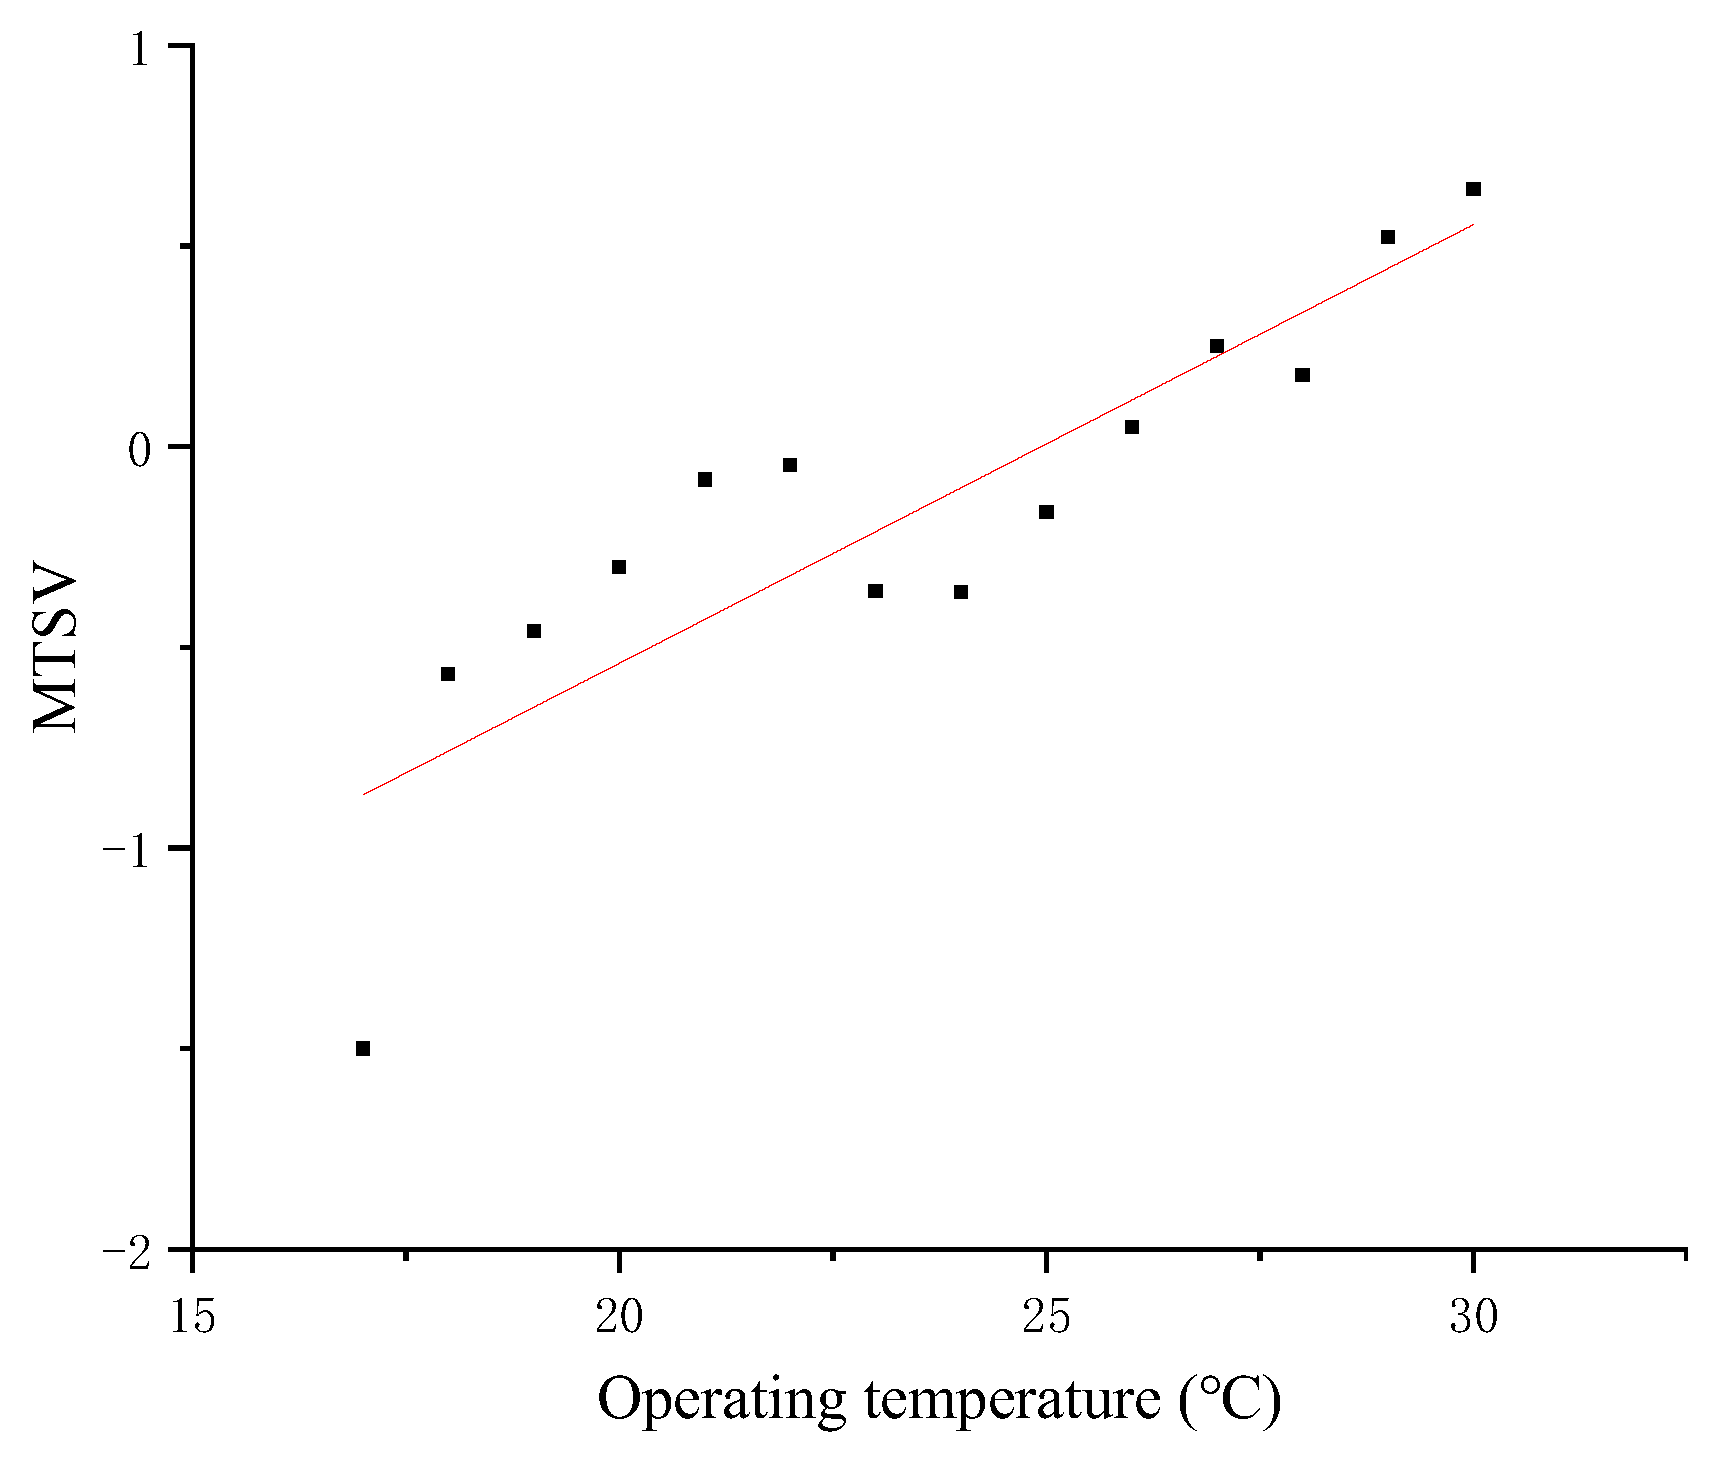
- The 95% confidence interval of the indoor temperature for heat-metering households is 24–25 °C. This is higher than the design temperature of 20 °C. The thermal neutral temperature for heat-metering households was high, up to 24.8 °C. The acceptable temperature range was 20.3–29.4 °C.
- (2)
- The heat-using behavior had a lack of rationality. The proportion of adjusted heating end valves for households was low. Indoor temperature was set high for active households. The window-opening phenomenon of households was obvious during the heating period; 75% (95% confidence interval, CI: 66–83%) of households measured opened their windows.
- (3)
- Active households with high indoor temperatures have a high probability of adjusting end valves. At times between 6:00 and 8:30, active households were willing to adjust the valve. High indoor and outdoor temperatures caused window-opening behavior in households. The probability of window opening is high between 6:00 and 8:30.
Author Contributions
Funding
Data Availability Statement
Conflicts of Interest
References
- Ürge-Vorsatz, D.; Cabeza, L.F.; Serrano, S.; Barreneche, C.; Petrichenko, K. Heating and cooling energy trends and drivers in buildings. Renew. Sustain. Energy Rev. 2015, 41, 85–98. [Google Scholar] [CrossRef]
- Yang, T.; Pan, Y.; Yang, Y.; Lin, M.; Qin, B.; Xu, P.; Huang, Z. CO2 emissions in China’s building sector through 2050: A scenario analysis based on a bottom-up model. Energy 2017, 128, 208–223. [Google Scholar] [CrossRef]
- Al-Mumin, A.; Khattab, O.; Sridhar, G. Occupants’ behavior and activity patterns influencing the energy consumption in the Kuwaiti residences. Energy Build. 2003, 35, 549–559. [Google Scholar] [CrossRef]
- Fabi, V.; Andersen, R.V.; Corgnati, S.P. Influence of occupant’s heating set-point preferences on indoor environmental quality and heating demand in residential buildings. HVACR Res. 2013, 19, 635–645. [Google Scholar]
- European Parliament. Directive 2006/32/EC. Off. J. Eur. Union 2006, 114, 64–85. [Google Scholar]
- European Parliament. Directive 2012/27/EU. Off. J. Eur. Union 2012, 315, 1–56. [Google Scholar]
- Yuan, S.; Xu, W.; Liu, Y. Research of heat metering development situation and application effect evaluation model in China. Energy Policy 2016, 88, 329–342. [Google Scholar] [CrossRef]
- GB 50411-2007; The Code for Acceptance of Energy Efficient Building Construction. China Building Industry Press: Beijing, China, 2007.
- Andersen, R.V.; Toftum, J.; Andersen, K.K.; Olesen, B.W. Survey of occupant behaviour and control of indoor environment in Danish dwellings. Energy Build. 2009, 41, 11–16. [Google Scholar] [CrossRef]
- Cholewa, T.; Siuta-Olcha, A.; Balaras, C.A. Actual energy savings from the use of thermostatic radiator valves in residential buildings—Long term field evaluation. Energy Build. 2017, 151, 487–493. [Google Scholar] [CrossRef]
- Seligman, C.; Darly, J.M.; Becker, L.J. Behavioral approaches to residential energy conservation. Energy Build. 1978, 1, 325–337. [Google Scholar] [CrossRef]
- Terés-Zubiaga, J.; Pérez-Iribarren, E.; González-Pino, I.; Sala, J.M. Effects of individual metering and charging of heating and domestic hot water on energy consumption of buildings in temperate climates. Energy Convers. Manag. 2018, 171, 491–506. [Google Scholar] [CrossRef]
- Calise, F.; Cappiello, F.; D’Agostino, D.; Vicidomini, M. Heat metering for residential buildings: A novel approach through dynamic simulations for the calculation of energy and economic savings. Energy 2021, 234, 121204. [Google Scholar] [CrossRef]
- Shipworth, M.; Firth, S.K.; Gentry, M.I.; Wright, A.J.; Shipworth, D.T.; Lomas, K.J. Central heating thermostat settings and timing: Building demographics. Build. Res. Inf. 2010, 38, 50–69. [Google Scholar] [CrossRef]
- GB50096-1999; Code for Residential Building Design. China Building Industry Press: Beijing, China, 1999.
- JGJ 173-2009; Technical Guidelines for Heating Metering. China Building Industry Press: Beijing, China, 2009.
- GB/T 50893-2013; Technical Code for Retrofitting of Heating System on Energy Efficiency. China Building Industry Press: Beijing, China, 2013.
- GB/T 34617-2017; Evaluation Method of Energy Consumption for District Heating System. China Building Industry Press: Beijing, China, 2017.
- CJ/T 188-2018; Technical Requirements of Utility Meters Data Transmission. China Building Industry Press: Beijing, China, 2018.
- GB/T 32224-2020; Heat Meter. China Building Industry Press: Beijing, China, 2020.
- Wei, S.; Jones, R.; De Wilde, P. Driving factors for occupant-controlled space heating in residential buildings. Energy Build. 2014, 70, 36–44. [Google Scholar] [CrossRef]
- French, L.J.; Camilleri, M.J.; Isaacs, N.P.; Pollard, A.R. Temperatures and heating energy in New Zealand houses from a nationally representative study—HEEP. Energy Build. 2007, 39, 770–782. [Google Scholar] [CrossRef]
- Fabi, V.; Andersen, R.V.; Corgnati, S.; Olesen, B.W. Occupants’ window opening behaviour: A literature review of factors influencing occupant behaviour and models. Build. Environ. 2012, 58, 188–198. [Google Scholar] [CrossRef]
- Nesbakken, R. Energy Consumption for Space Heating: A Discrete-Continuous Approach. Scand. J. Econ. 2001, 103, 165–184. [Google Scholar] [CrossRef]
- Schuler, A.; Weber, C.; Fahl, U. Energy consumption for space heating of West-German households: Empirical evidence, scenario projections and policy implications. Energy Policy 2000, 28, 877–894. [Google Scholar] [CrossRef]
- Oreszczyn, T.; Hong, S.H.; Ridley, I.; Wilkinson, P. Determinants of winter indoor temperatures in low income households in England. Energy Build. 2006, 38, 245–252. [Google Scholar] [CrossRef]
- Karjalainen, S. Gender differences in thermal comfort and use of thermostats in everyday thermal environments. Build. Environ. 2007, 42, 1594–1603. [Google Scholar] [CrossRef]
- Xu, B.; Fu, L.; Di, H. Field investigation on consumer behavior and hydraulic performance of a district heating system in Tianjin, China. Build. Environ. 2009, 44, 249–259. [Google Scholar] [CrossRef]
- Kelly, S.; Shipworth, M.; Shipworth, D.; Gentry, M.; Wright, A.; Pollitt, M.; Crawford-Brown, D.; Lomas, K. Predicting the diversity of internal temperatures from the English residential sector using panel methods. Appl. Energy 2013, 102, 601–621. [Google Scholar] [CrossRef]
- Karatasou, S.; Laskari, M.; Santamouris, M. Determinants of high electricity use and high energy consumption for space and water heating in European social housing: Socio-demographic and building characteristics. Energy Build. 2018, 170, 107–114. [Google Scholar] [CrossRef]
- Wilhite, H.; Nakagami, H.; Masuda, T.; Yamaga, Y.; Haneda, H. A cross-cultural analysis of household energy use behaviour in Japan and Norway. Energy Policy 1996, 24, 795–803. [Google Scholar] [CrossRef]
- Ficco, G.; Celenza, L.; Dell’Isola, M.; Vigo, P. Experimental comparison of residential heat accounting systems at critical conditions. Energy Build. 2016, 130, 477–487. [Google Scholar] [CrossRef]
- Dell’Isola, M.; Ficco, G.; Arpino, F.; Cortellessa, G.; Canale, L. A novel model for the evaluation of heat accounting systems reliability in residential buildings. Energy Build. 2017, 150, 281–293. [Google Scholar] [CrossRef]
- Hansen, A.R.; Gram-Hanssen, K.; Knudsen, H.N. How building design and technologies influence heat-related habits. Build. Res. Inf. 2018, 46, 83–98. [Google Scholar] [CrossRef]
- Summerfield, A.J.; Lowe, R.J.; Bruhns, H.R.; Caeiro, J.A.; Steadman, J.P.; Oreszczyn, T. Milton Keynes Energy Park revisited: Changes in internal temperatures and energy usage. Energy Build. 2007, 39, 783–791. [Google Scholar] [CrossRef]
- Bao, X.U.; Lin, F.U.; Hong, D.I. Investigation and Analysis on Consumers Dynamic Behavior in Heat-Metering System. Build. Sci. 2007, 10, 94–96+108. [Google Scholar]
- GB50736-2012; The Design Standard for Heating, Ventilation and Air Conditioning of Civil Buildings. China Building Industry Press: Beijing, China, 2012.
- Teng, S. Study on Energy Saving Optimization of Rural Dwellings in Cold Region of Northeast China; Harbin Institute of Technology: Harbin, China, 2018. [Google Scholar]
- ASHRAE Standard 55-2017; Thermal Enviromental Condition for Human Occupancy. ASHRAE Inc.: Atlanta, GA, USA, 2017; pp. 4–25.
- Yang, J.; Ye, T.; Li, K. Research on occupant window opening behavior based on Logistic regression and Average Bayesian network. HVAC 2020, 50, 135–140+121. [Google Scholar]
- Zhao, W.; Le, L. Field study on thermal comfort of residents in Harbin city in winter 2002. J. Harbin Inst. Technol. 2002, 2002, 500–504. [Google Scholar]
- Sardianou, E. Estimating space heating determinants: An analysis of Greek households. Energy Build. 2008, 40, 1084–1093. [Google Scholar] [CrossRef]


| Instrument Name | Measurement Accuracy | Measurement Range | Measurement Frequency |
|---|---|---|---|
| Magnetic switching recorder | ---- | Maximum magnetic sensing distance 30 mm | 2 min |
| Temperature recorder | ±0.3 °C | −20 °C–+80 °C | 2 min |
| Temperature and humidity recorder | Temperature 0.1 °C Humidity 0.1% RH | Temperature −40–100 °C Humidity 0–100% RH | 5 min |
| No. | Variable | Descriptive | Scales | |
|---|---|---|---|---|
| 1 | Behavior regarding heating end valve adjustment | The indoor temperature setpoint this morning | ||
| 2 | The time for adjusting heating end valve | |||
| 3 | Indoor temperature after adjusting heating end valve | |||
| 4 | Behavior regarding window operation | Time of opening window in master bedroom | ||
| 5 | Time of opening window in living room | |||
| 6 | Time of opening window in guest bedroom | |||
| 7 | Thermal comfort | |||
| 8 | Thermal sensation | Very cold | −3 | |
| 9 | Cold | −2 | ||
| 10 | Slightly cold | −1 | ||
| 11 | Moderate | 0 | ||
| 12 | Slightly hot | 1 | ||
| 13 | Hot | 2 | ||
| 14 | Very hot | 3 | ||
| 15 | Thermal comfort | Comfortable | 0 | |
| 16 | Slightly uncomfortable | 1 | ||
| 17 | Uncomfortable | 2 | ||
| Very uncomfortable | 3 | |||
| 18 | Intolerable | 4 | ||
| 19 | Thermal environment acceptance | Very unreceptive | −3 | |
| 20 | Unreceptive | −2 | ||
| Slightly unreceptive | −1 | |||
| 21 | Moderate | 0 | ||
| 22 | Just acceptive | 1 | ||
| 23 | acceptive | 2 | ||
| 24 | Very acceptive | 3 |
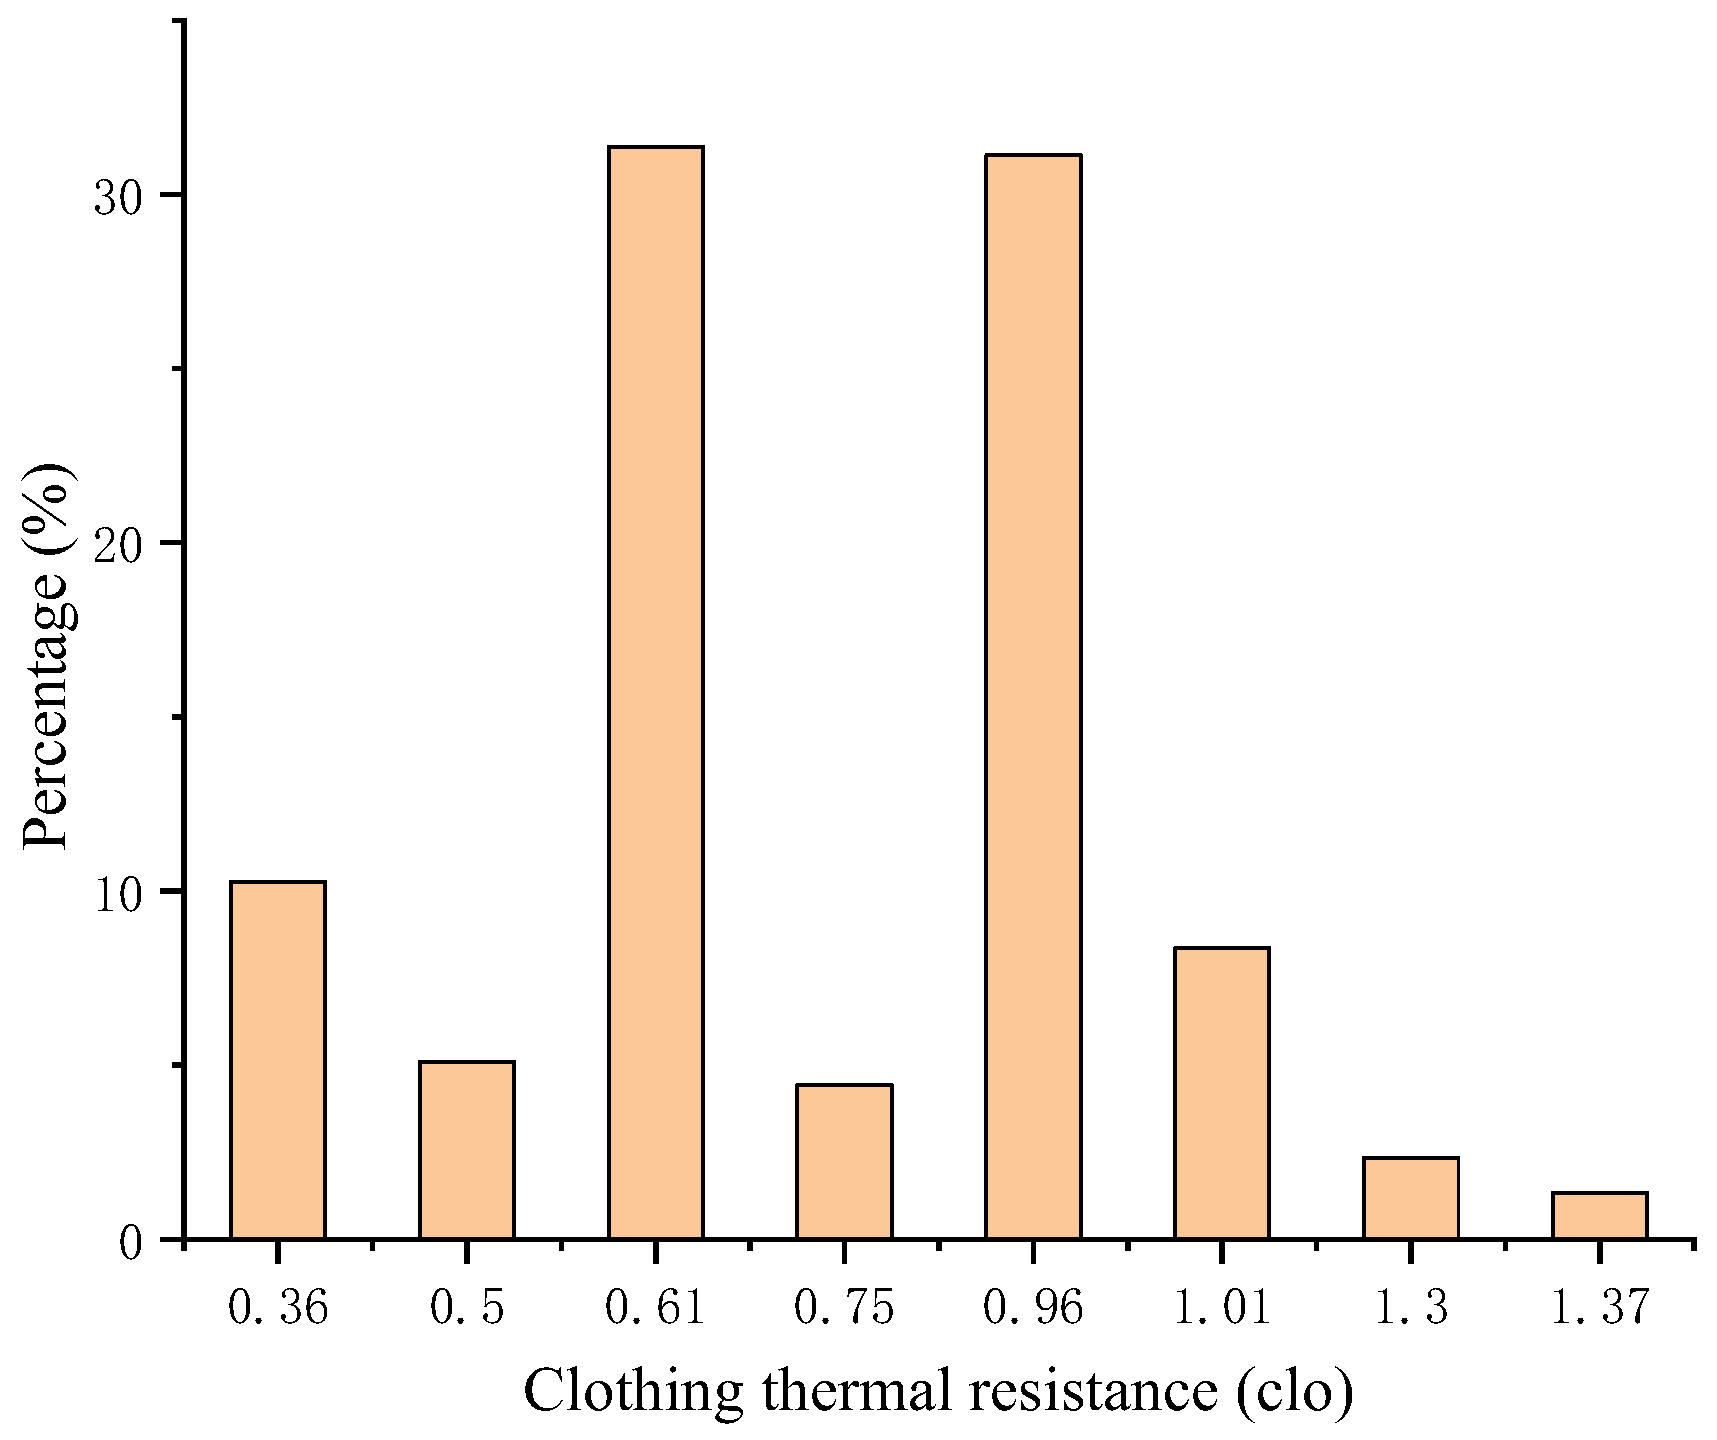
| Clothing | Thermal Resistance (clo) | Clothing | Thermal Resistance (clo) |
|---|---|---|---|
| Pants, short-sleeved shirts, socks, shoes | 0.57 | Shorts, short-sleeved shirts, shoes, and socks | 0.36 |
| Pants, long-sleeved shirts, shoes, and socks | 0.61 | Long-sleeved overalls, T-shirts, shoes, and socks | 0.72 |
| Jackets, pants, long-sleeved shirts, and socks | 0.96 | Long-sleeved overalls, long-sleeved shirts, shoes, and socks | 0.89 |
| Jackets, vests, trousers, long-sleeved shirts, and socks | 1.14 | Insulated work clothes, long Johns, shoes, and socks | 1.37 |
| Trousers, long-sleeved shirts, long-sleeved sweaters, shoes, and socks | 1.30 | Long-sleeved sweatshirts, sweatpants, shoes, and socks | 0.74 |
| Knee-length skirt, short-sleeved shirt, and sandals | 0.54 | Full pajamas, slippers, and no socks | 0.96 |
| Long skirts, long-sleeved shirts, and jackets | 1.1 |
| Factors | B | Beta | t | Sig. |
|---|---|---|---|---|
| Constant | −4.46 | −7.34 | 0.00 | |
| Indoor temperature before adjustment | 0.19 | 0.61 | 7.06 | 0.00 |
| Time period | 0.13 | 0.26 | 2.97 | 0.00 |
| Outdoor temperature | - | 0.05 | 0.43 | 0.67 |
| Outdoor wind speed | - | 0.11 | 1.08 | 0.28 |
| Indoor relative humidity | - | −0.10 | −1.24 | 0.22 |
| Variable | B | Beta | t | Sig. |
|---|---|---|---|---|
| Constant | 0.03 | 3.41 | 0.00 | |
| Outdoor temperature | 0.02 | 0.15 | 14.08 | 0.00 |
| Time period | 0.19 | 0.39 | 35.70 | 0.00 |
| Indoor temperature before opening window | 0.03 | 3.41 | 0.00 | |
| Indoor relative humidity | - | −0.01 | −0.76 | 0.34 |
Disclaimer/Publisher’s Note: The statements, opinions and data contained in all publications are solely those of the individual author(s) and contributor(s) and not of MDPI and/or the editor(s). MDPI and/or the editor(s) disclaim responsibility for any injury to people or property resulting from any ideas, methods, instructions or products referred to in the content. |
© 2023 by the authors. Licensee MDPI, Basel, Switzerland. This article is an open access article distributed under the terms and conditions of the Creative Commons Attribution (CC BY) license (https://creativecommons.org/licenses/by/4.0/).
Share and Cite
Yang, X.; Ji, W.; Wang, C.; Wu, H. Investigation of Indoor Thermal Environment and Heat-Using Behavior for Heat-Metering Households in Northern China. Sustainability 2023, 15, 15149. https://doi.org/10.3390/su152015149
Yang X, Ji W, Wang C, Wu H. Investigation of Indoor Thermal Environment and Heat-Using Behavior for Heat-Metering Households in Northern China. Sustainability. 2023; 15(20):15149. https://doi.org/10.3390/su152015149
Chicago/Turabian StyleYang, Xiu’e, Wenjie Ji, Chunhui Wang, and Haidong Wu. 2023. "Investigation of Indoor Thermal Environment and Heat-Using Behavior for Heat-Metering Households in Northern China" Sustainability 15, no. 20: 15149. https://doi.org/10.3390/su152015149
APA StyleYang, X., Ji, W., Wang, C., & Wu, H. (2023). Investigation of Indoor Thermal Environment and Heat-Using Behavior for Heat-Metering Households in Northern China. Sustainability, 15(20), 15149. https://doi.org/10.3390/su152015149