
A Scenario-Based Multi-Criteria Decision-Making Approach for Allocation of Pistachio Processing Facilities: A Case Study of Zarand, Iran

 , ,
, , 
Abstract
:1. Introduction
2. Study Area
3. Data and Methods
3.1. Data
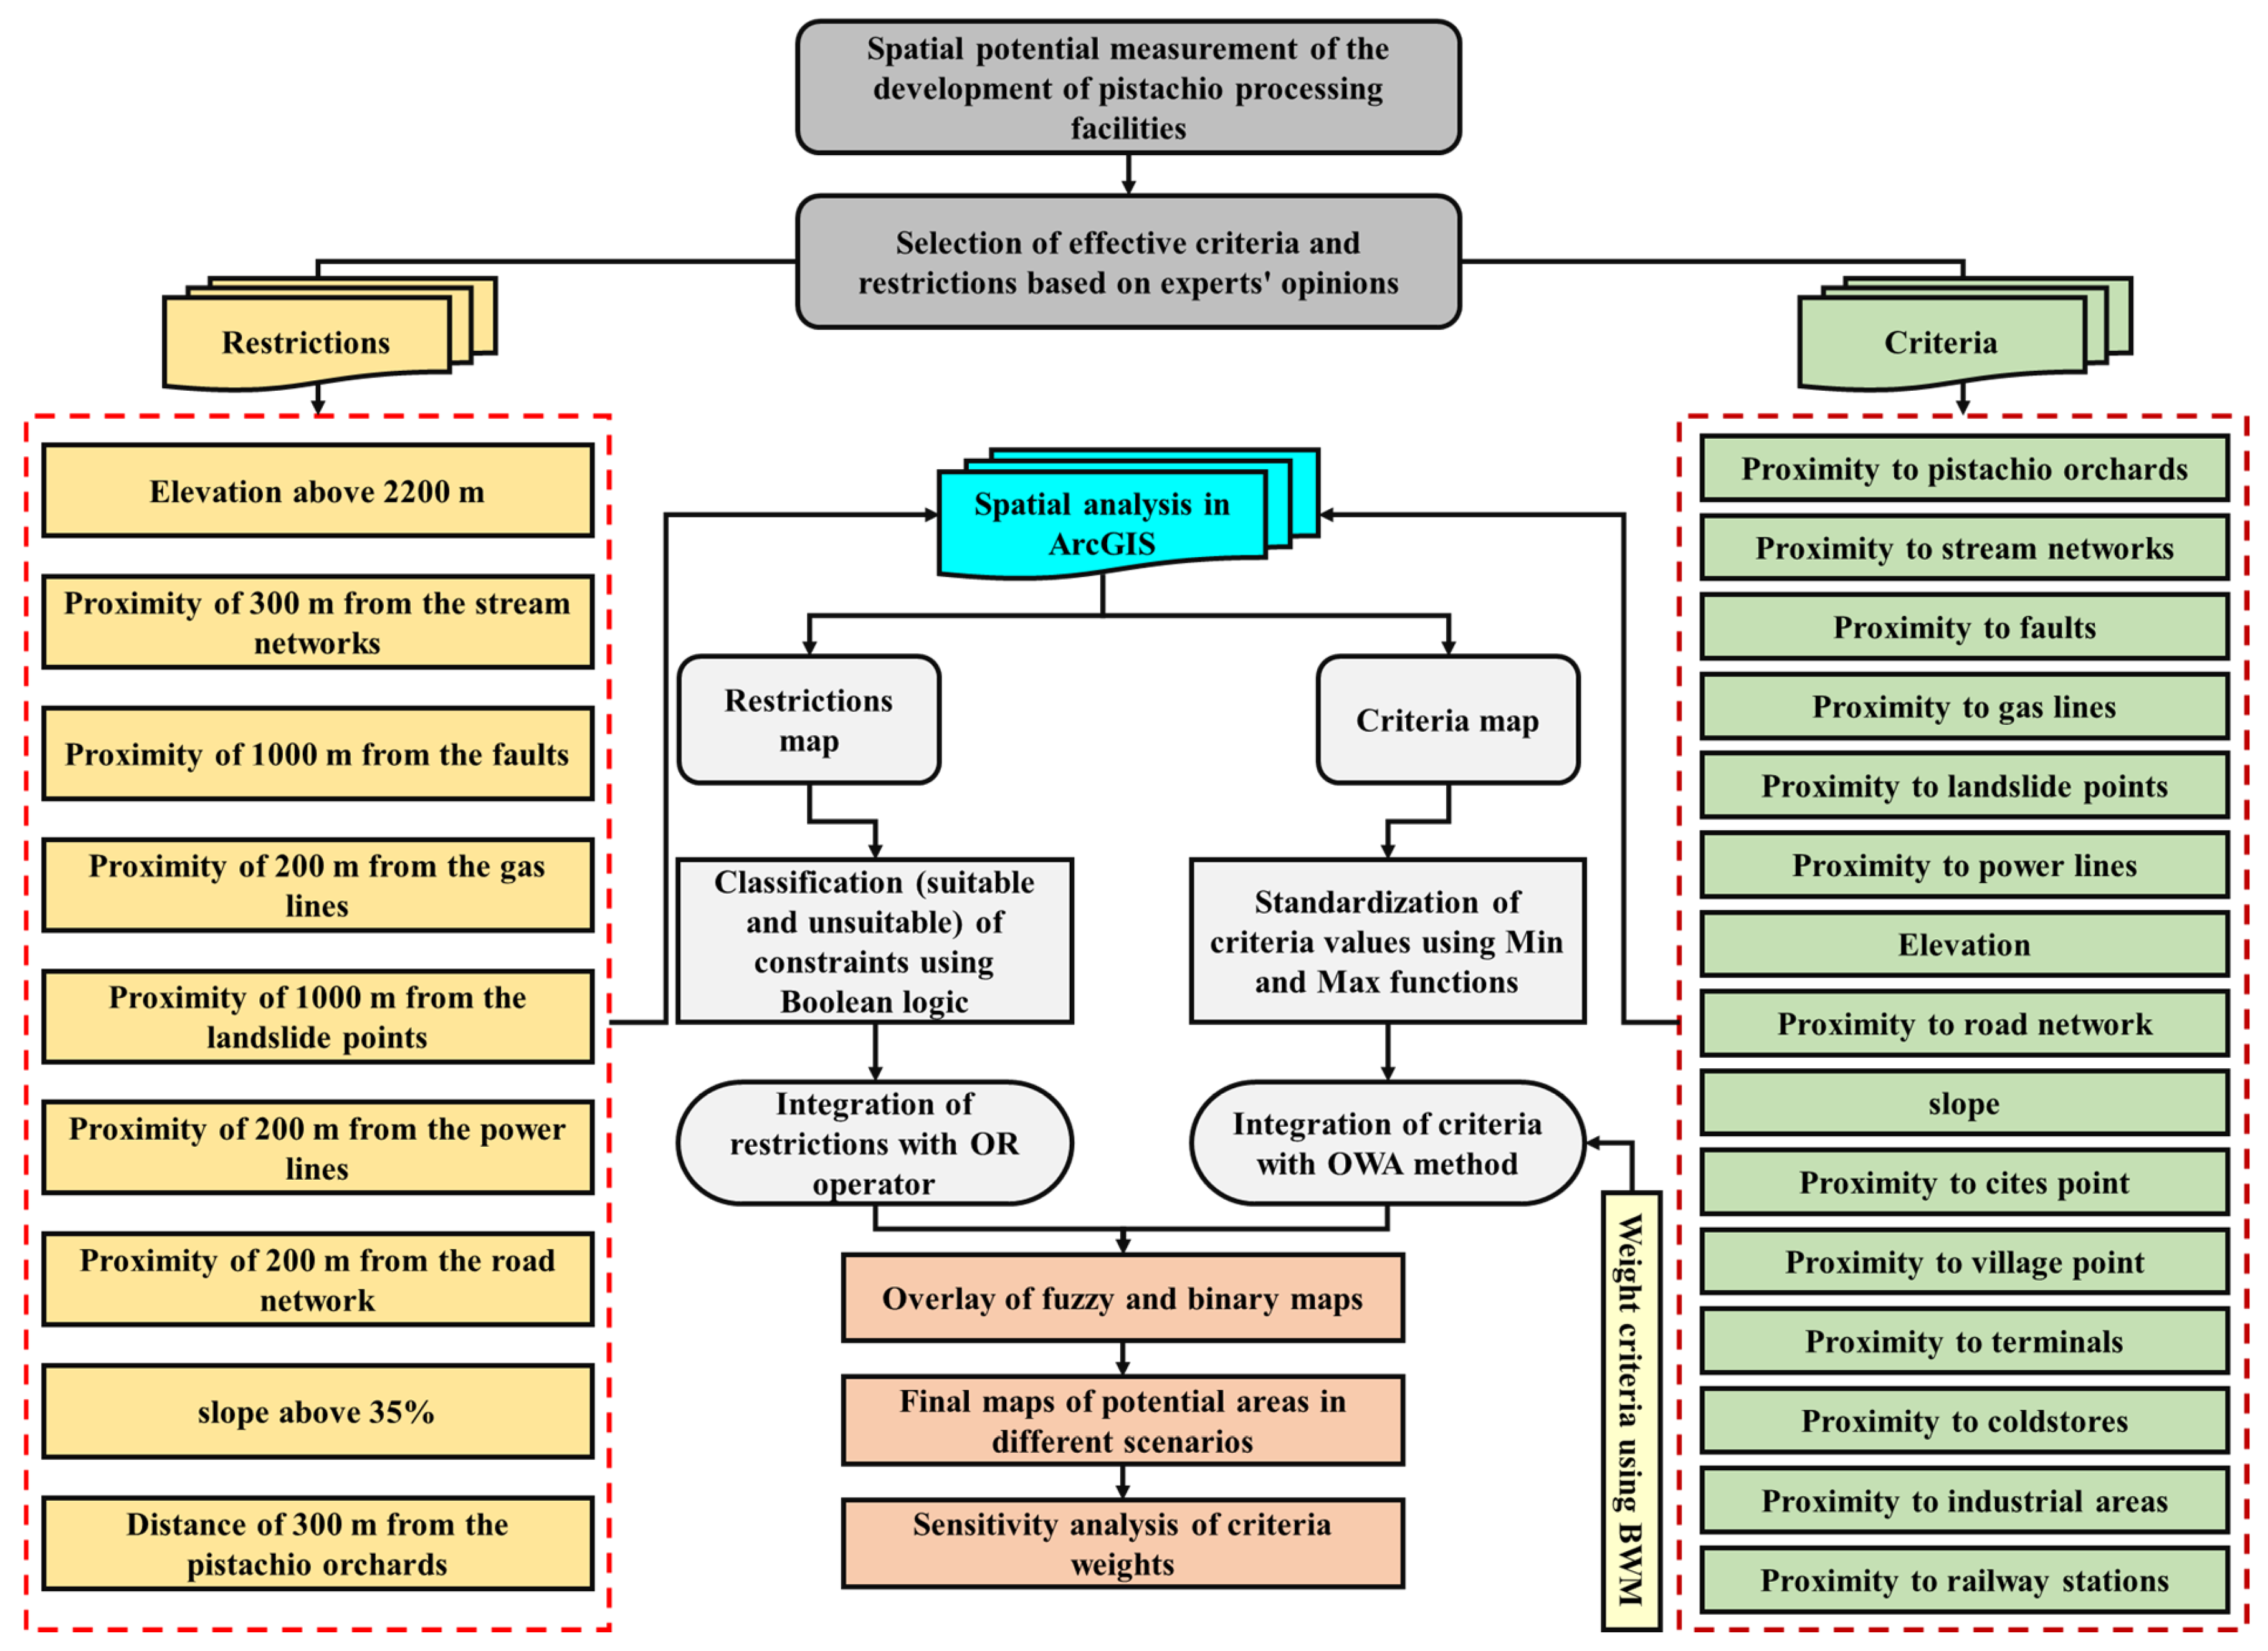
3.2. Methods
3.2.1. Criteria and Restrictions
3.2.2. Standardization of Criteria Values
3.2.3. Criteria Weight Calculation
- Step 1: Specify the set of decision criteria.
- Step 2: Determine the best (most preferred or most important) and worst (least important or weakest) criteria.
- Step 3: The preference of the best criteria over other criteria and also the preference of other criteria over the worst criteria are determined by assigning numbers 1 to 9. This best-to-others vector can be written as Equation (3):where represents the preference degree of the criterion compared to the worst criterion , and is equal to one. This others-to-worst vector can be written as Equation (4):where represents the preference degree of the criterion compared to the worst criterion , and is equal to one.
- Step 4: Calculating optimal criteria weights.
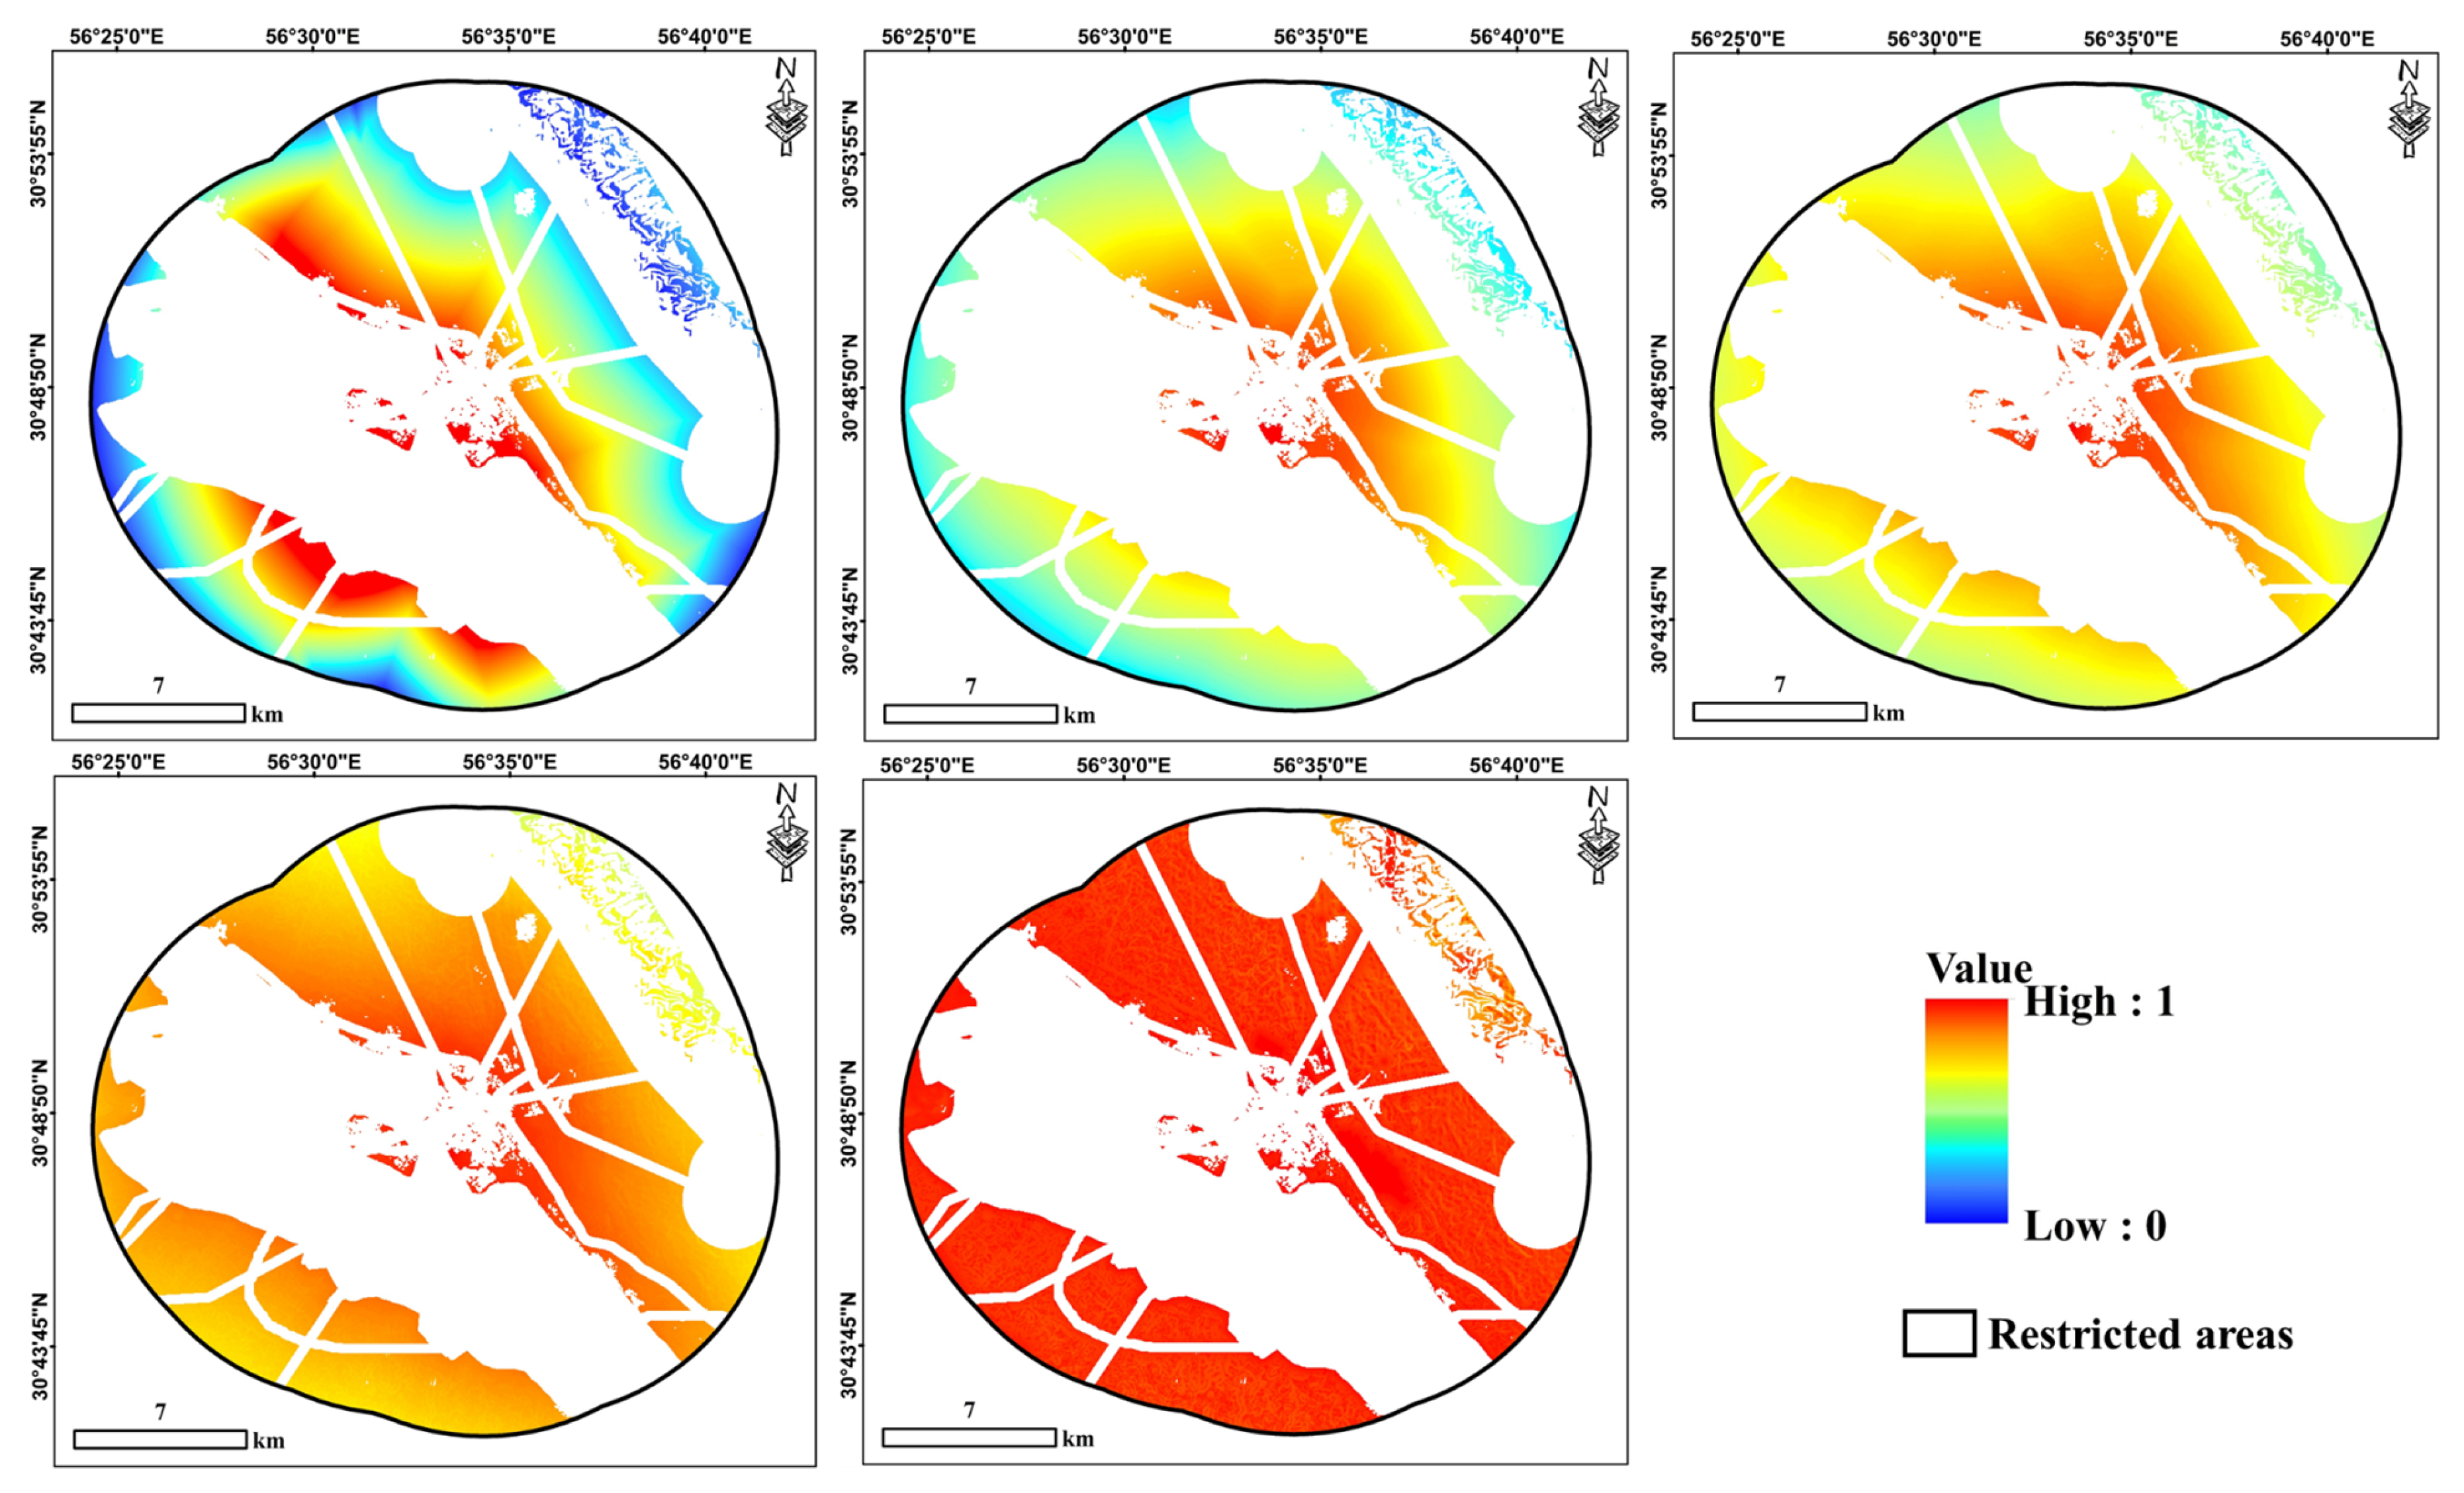
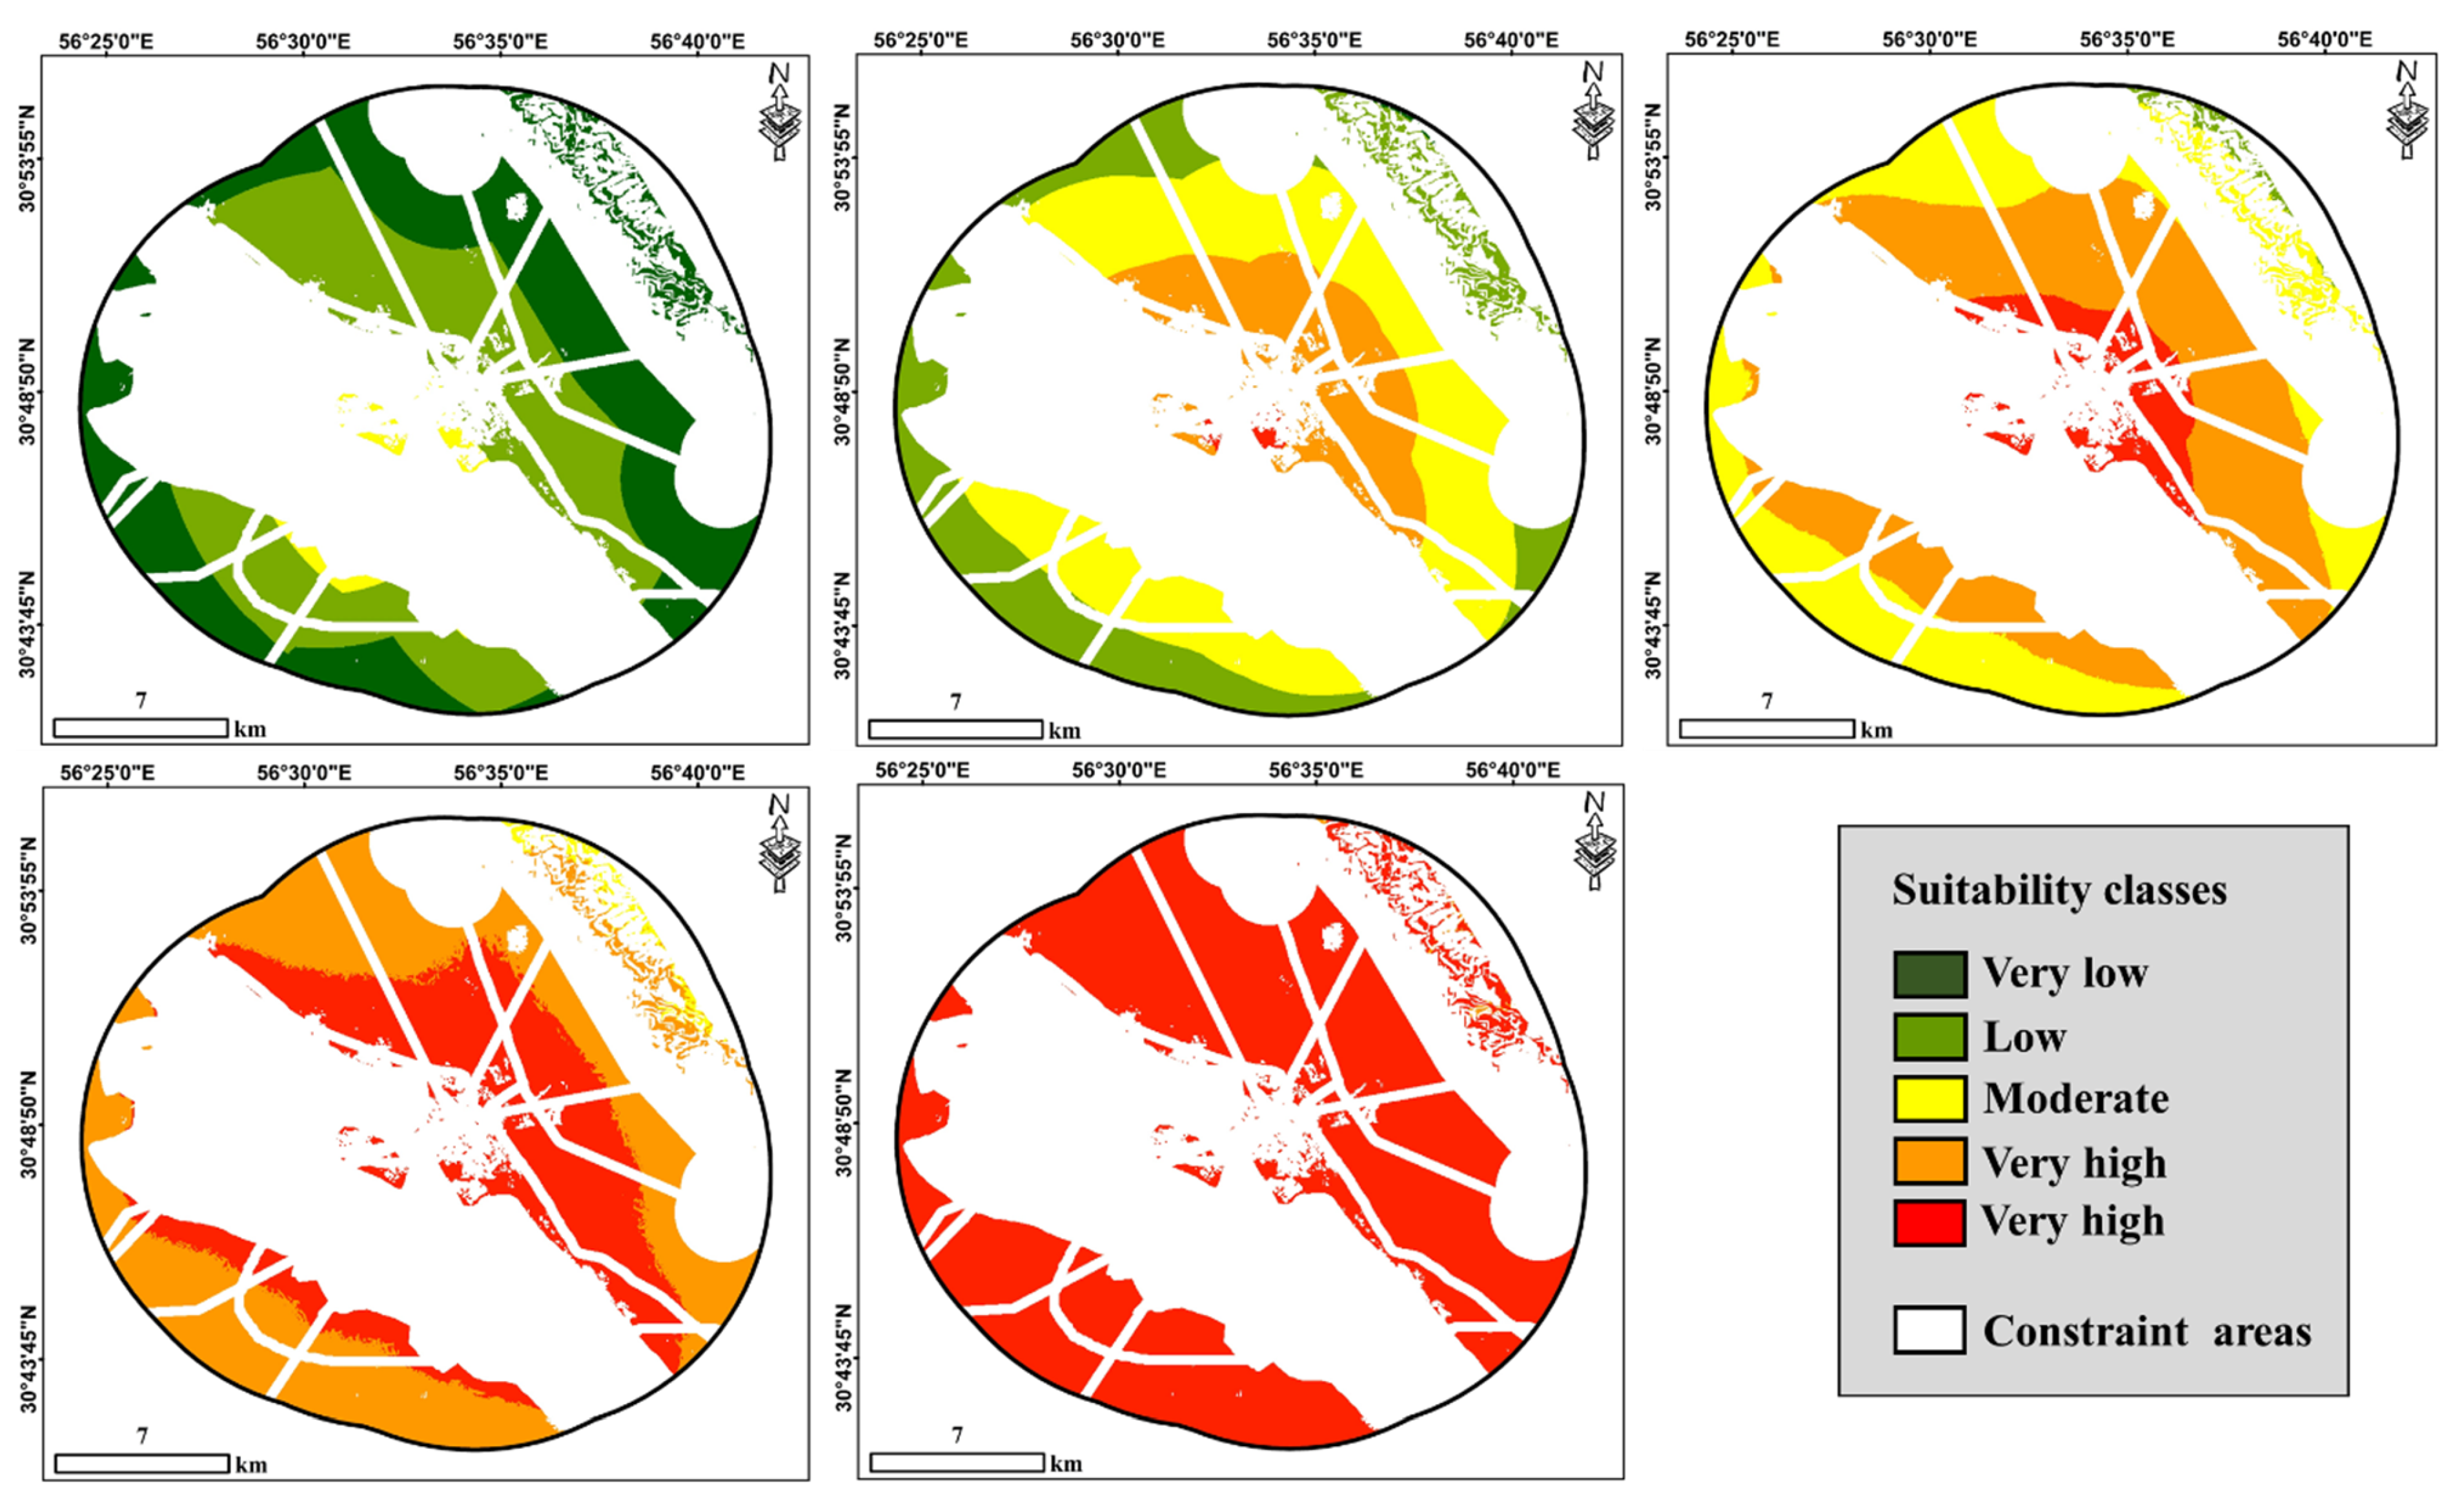
3.2.4. Land Suitability Modeling under Different Scenarios
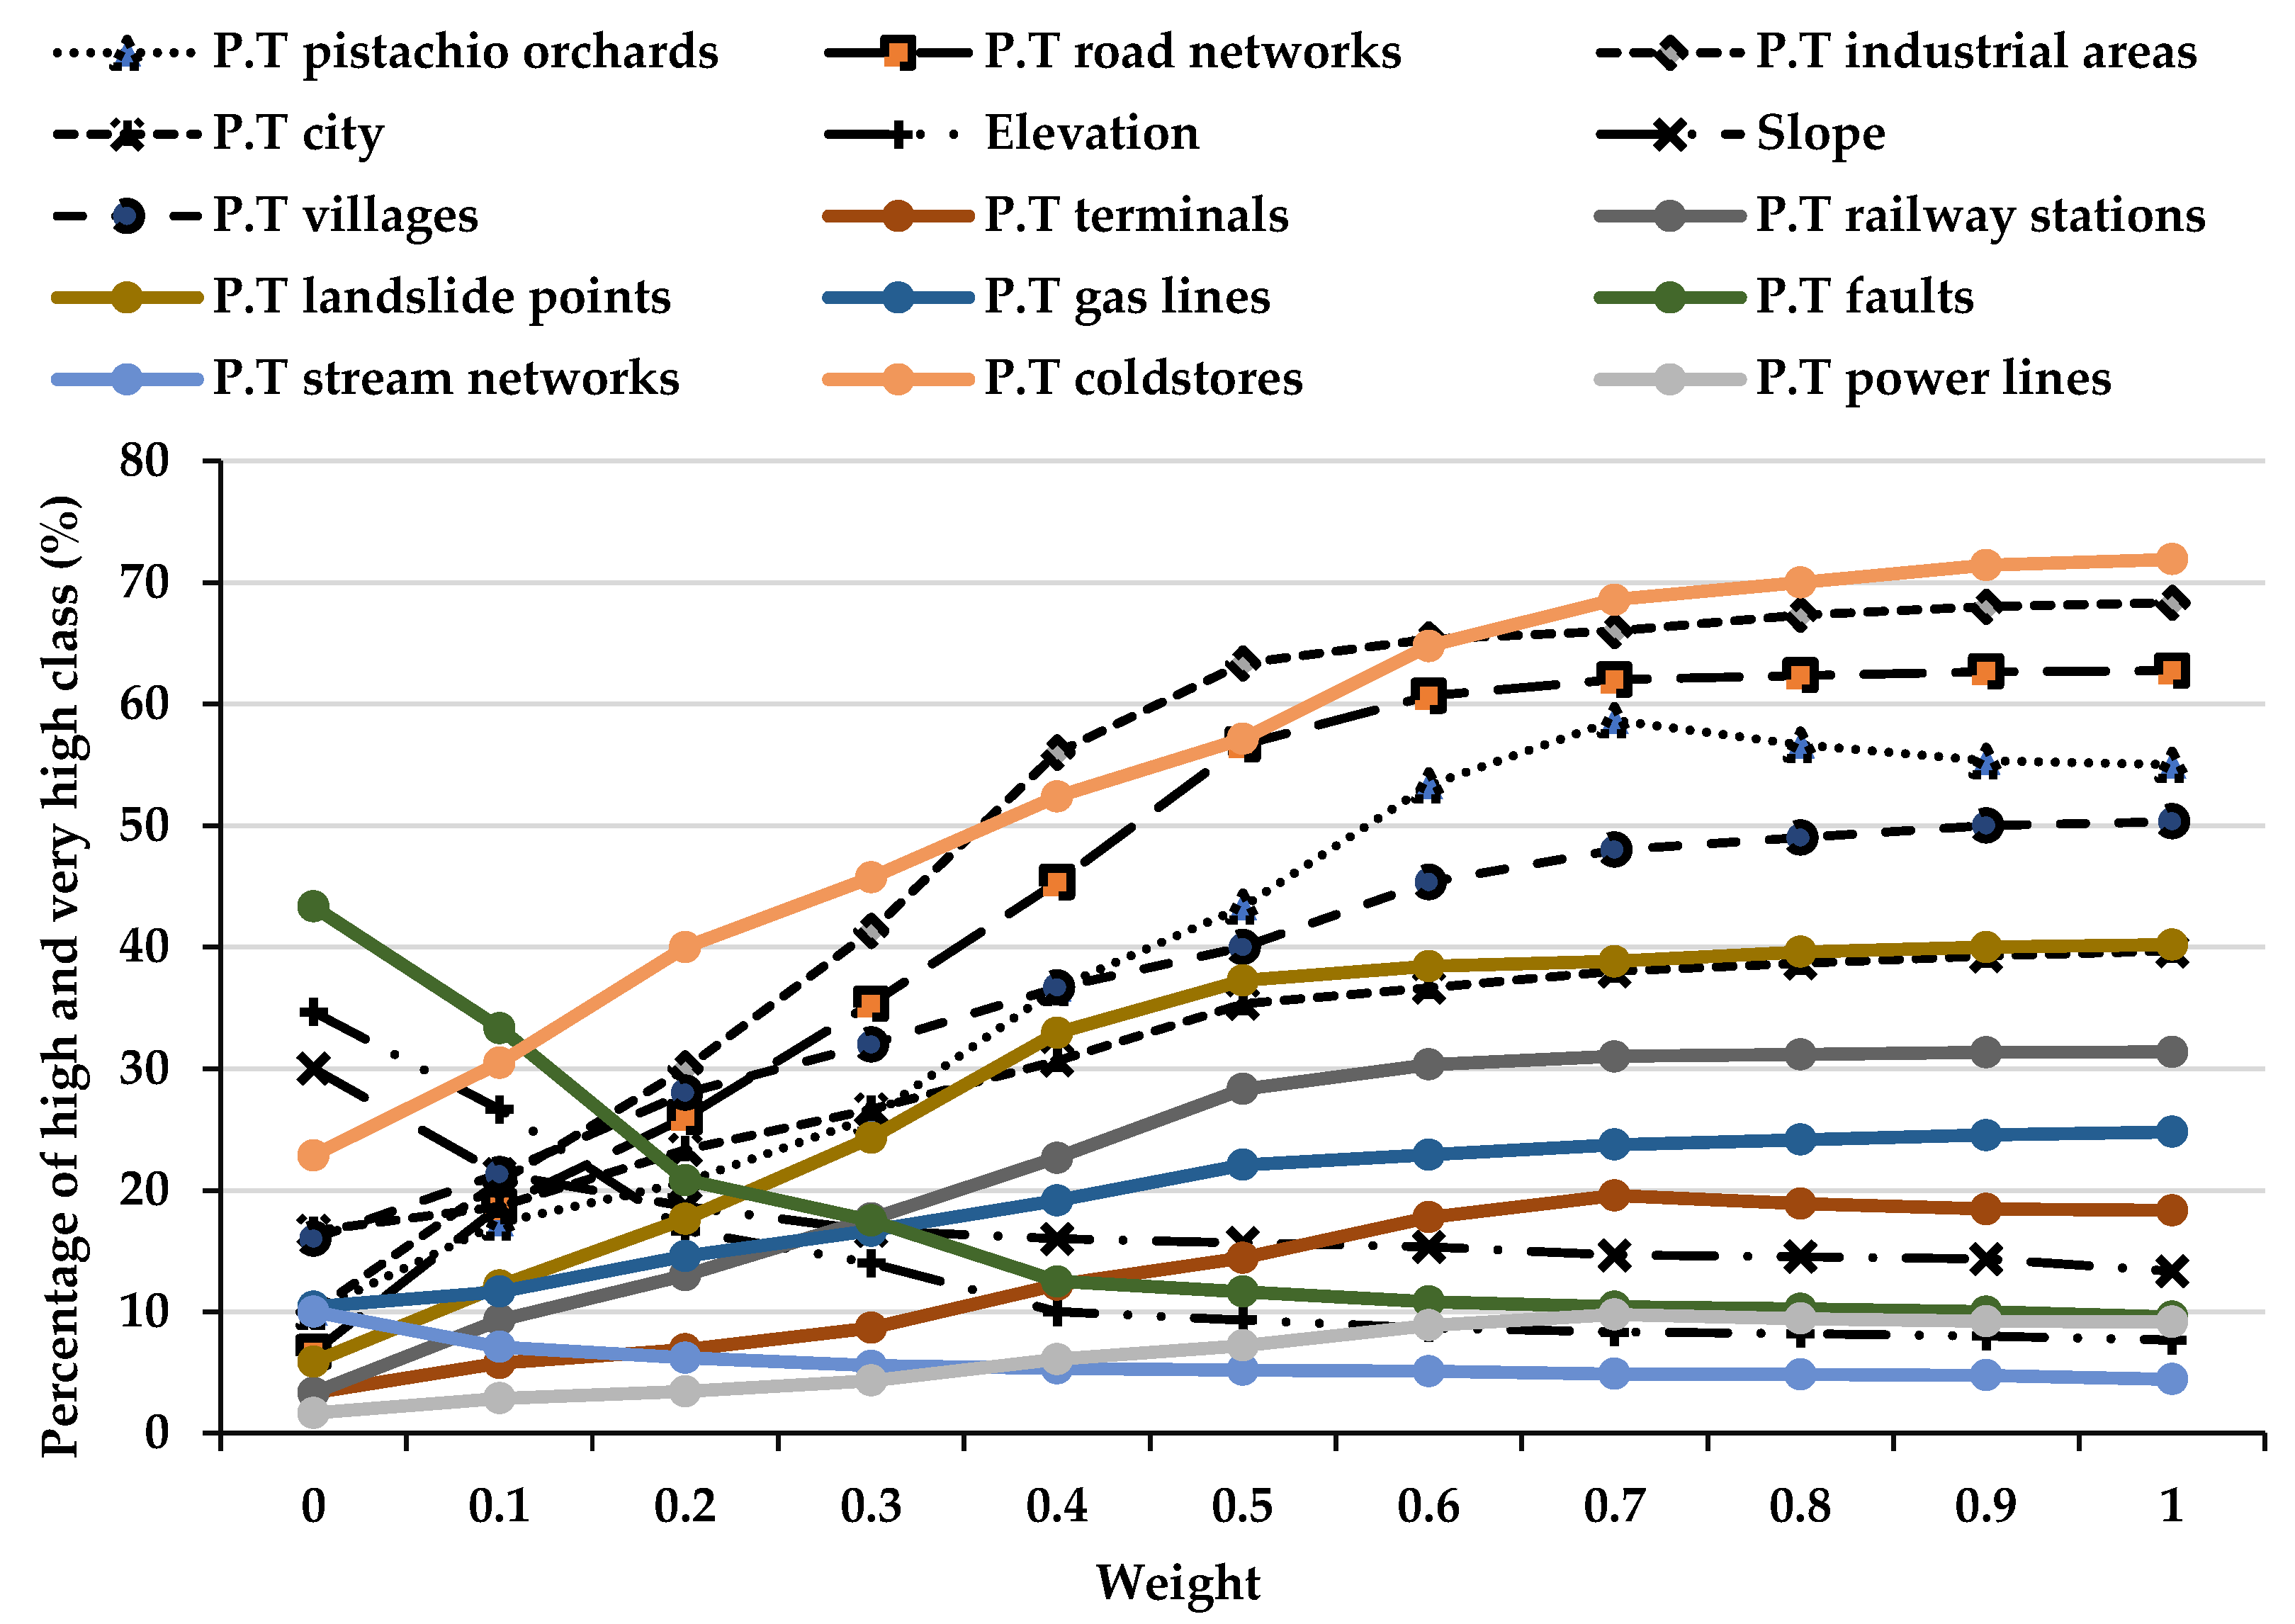
3.2.5. Sensitivity Analysis
4. Results
5. Discussion
6. Conclusions
Author Contributions
Funding
Informed Consent Statement
Data Availability Statement
Conflicts of Interest
Abbreviations
| GIS | Geographic Information System |
| MCDA | Multi-criteria Decision Analysis |
| OWA | Ordered Weighted Averaging |
| AHP | Analytic Hierarchy Process |
| TOPSIS | Technique for Order of Preference by Similarity to Ideal Solution |
| VIKOR | VlseKriterijumska Optimizcija I Kaompromisno Resenje |
| ANP | Analytical Network Process |
| ELECTRE | Elimination and Choice Translating Reality |
| PROMETHEE | Preference Ranking Organization Method for Enrichment Evaluation |
| DEM | Digital Elevation Model |
| BWM | Best-Worst Method |
| OAT | One-At-a-Time |
References
- Aburas, M.M.; Abdullah, S.H.; Ramli, M.F.; Asha’ari, Z.H. Land suitability analysis of urban growth in Seremban Malaysia, using GIS based analytical hierarchy process. Procedia Eng. 2017, 198, 1128–1136. [Google Scholar] [CrossRef]
- Kordi, F.; Yousefi, H. Crop classification based on phenology information by using time series of optical and synthetic-aperture radar images. Remote Sens. Appl. Soc. Environ. 2022, 27, 100812. [Google Scholar] [CrossRef]
- Lin, K.; Zhao, H. The Impact of Green Finance on the Ecologicalization of Urban Industrial Structure—Based on GMM of Dynamic Panel System. J. Artif. Intell. Technol. 2022, 2, 123–129. [Google Scholar] [CrossRef]
- Shorabeh, S.N.; Firozjaei, M.K.; Nematollahi, O.; Firozjaei, H.K.; Jelokhani-Niaraki, M. A risk-based multi-criteria spatial decision analysis for solar power plant site selection in different climates: A case study in Iran. Renew. Energy 2019, 143, 958–973. [Google Scholar] [CrossRef]
- Shorabeh, S.N.; Varnaseri, A.; Firozjaei, M.K.; Nickravesh, F.; Samany, N.N. Spatial modeling of areas suitable for public libraries construction by integration of GIS and multi-attribute decision making: Case study Tehran, Iran. Libr. Inf. Sci. Res. 2020, 42, 101017. [Google Scholar] [CrossRef]
- Mohimi, A.; Esmaeily, A. Spatiotemporal analysis of urban sprawl using a multi-technique approach and remote sensing satellite imagery from 1990 to 2020: Kerman/Iran. Environ. Dev. Sustain. 2023, 1–36. [Google Scholar] [CrossRef]
- Shacheri, F.; Nikou, N.; Ziaei, A.; Saeedi, M. Surface dense discharge from rectangular and trapezoidal channels. Flow Meas. Instrum. 2022, 87, 102213. [Google Scholar] [CrossRef]
- Pilevar, A.R.; Matinfar, H.R.; Sohrabi, A.; Sarmadian, F. Integrated fuzzy, AHP and GIS techniques for land suitability assessment in semi-arid regions for wheat and maize farming. Ecol. Indic. 2020, 110, 105887. [Google Scholar] [CrossRef]
- Zolekar, R.B.; Bhagat, V.S. Multi-criteria land suitability analysis for agriculture in hilly zone: Remote sensing and GIS approach. Comput. Electron. Agric. 2015, 118, 300–321. [Google Scholar] [CrossRef]
- Ramya, S.; Devadas, V. Integration of GIS, AHP and TOPSIS in evaluating suitable locations for industrial development: A case of Tehri Garhwal district, Uttarakhand, India. J. Clean. Prod. 2019, 238, 117872. [Google Scholar] [CrossRef]
- Ostovari, Y.; Honarbakhsh, A.; Sangoony, H.; Zolfaghari, F.; Maleki, K.; Ingram, B. GIS and multi-criteria decision-making analysis assessment of land suitability for rapeseed farming in calcareous soils of semi-arid regions. Ecol. Indic. 2019, 103, 479–487. [Google Scholar] [CrossRef]
- Hassan, I.; Javed, M.A.; Asif, M.; Luqman, M.; Ahmad, S.R.; Ahmad, A.; Akhtar, S.; Hussain, B. Weighted overlay based land suitability analysis of agriculture land in Azad Jammu and Kashmir using GIS and AHP. Pak. J. Agric. Sci. 2020, 57, 1509–1519. [Google Scholar]
- Akıncı, H.; Özalp, A.Y.; Turgut, B. Agricultural land use suitability analysis using GIS and AHP technique. Comput. Electron. Agric. 2013, 97, 71–82. [Google Scholar] [CrossRef]
- Nezhadkian, M.; Azimi, S.M.; Ferro, A.; Nafei, A.H. A model for new product development in business companies based on grounded theory approach and fuzzy method. J. Comput. Cogn. Eng. 2023, 2, 124–132. [Google Scholar] [CrossRef]
- Afsari, R.; Nadizadeh Shorabeh, S.; Kouhnavard, M.; Homaee, M.; Arsanjani, J.J. A spatial decision support approach for flood vulnerability analysis in urban areas: A case study of Tehran. ISPRS Int. J. Geo-Inf. 2022, 11, 380. [Google Scholar] [CrossRef]
- Shahpari Sani, D.; Heidari, M.T.; Tahmasebi Mogaddam, H.; Nadizadeh Shorabeh, S.; Yousefvand, S.; Karmpour, A.; Jokar Arsanjani, J. An Assessment of Social Resilience against Natural Hazards through Multi-Criteria Decision Making in Geographical Setting: A Case Study of Sarpol-e Zahab, Iran. Sustainability 2022, 14, 8304. [Google Scholar] [CrossRef]
- Mijani, N.; Alavipanah, S.K.; Hamzeh, S.; Firozjaei, M.K.; Arsanjani, J.J. Modeling thermal comfort in different condition of mind using satellite images: An Ordered Weighted Averaging approach and a case study. Ecol. Indic. 2019, 104, 1–12. [Google Scholar] [CrossRef]
- Kiavarz, M.; Jelokhani-Niaraki, M. Geothermal prospectivity mapping using GIS-based Ordered Weighted Averaging approach: A case study in Japan’s Akita and Iwate provinces. Geothermics 2017, 70, 295–304. [Google Scholar] [CrossRef]
- Erbaş, M.; Kabak, M.; Özceylan, E.; Çetinkaya, C. Optimal siting of electric vehicle charging stations: A GIS-based fuzzy Multi-Criteria Decision Analysis. Energy 2018, 163, 1017–1031. [Google Scholar] [CrossRef]
- Sarkar, A.; Biswas, A.; Kundu, M. Development of q-rung orthopair trapezoidal fuzzy Einstein aggregation operators and their application in MCGDM problems. J. Comput. Cogn. Eng. 2022, 1, 109–121. [Google Scholar] [CrossRef]
- Maihulla, A.S.; Yusuf, I.; Bala, S.I. Reliability and performance analysis of a series-parallel system using Gumbel–Hougaard family copula. J. Comput. Cogn. Eng. 2022, 1, 74–82. [Google Scholar] [CrossRef]
- Tashayo, B.; Honarbakhsh, A.; Akbari, M.; Eftekhari, M. Land suitability assessment for maize farming using a GIS-AHP method for a semi-arid region, Iran. J. Saudi Soc. Agric. Sci. 2020, 19, 332–338. [Google Scholar] [CrossRef]
- Tercan, E.; Dereli, M.A. Development of a land suitability model for citrus cultivation using GIS and multi-criteria assessment techniques in Antalya province of Turkey. Ecol. Indic. 2020, 117, 106549. [Google Scholar] [CrossRef]
- Qureshi, S.; Shorabeh, S.N.; Samany, N.N.; Minaei, F.; Homaee, M.; Nickravesh, F.; Firozjaei, M.K.; Arsanjani, J.J. A new integrated approach for municipal landfill siting based on urban physical growth prediction: A case study mashhad metropolis in Iran. Remote Sens. 2021, 13, 949. [Google Scholar] [CrossRef]
- Moghaddam, M.H.R.; Sedighi, A.; Fasihi, S.; Firozjaei, M.K. Effect of environmental policies in combating aeolian desertification over Sejzy Plain of Iran. Aeolian Res. 2018, 35, 19–28. [Google Scholar] [CrossRef]
- Firozjaei, M.K.; Nematollahi, O.; Mijani, N.; Shorabeh, S.N.; Firozjaei, H.K.; Toomanian, A. An integrated GIS-based Ordered Weighted Averaging analysis for solar energy evaluation in Iran: Current conditions and future planning. Renew. Energy 2019, 136, 1130–1146. [Google Scholar] [CrossRef]
- Moghaddam, H.A.; Shorabeh, S.N. Designing and implementing a location-based model to identify areas suitable for multi-renewable energy development for supplying electricity to agricultural wells. Renew. Energy 2022, 200, 1251–1264. [Google Scholar] [CrossRef]
- Shorabeh, S.N.; Firozjaei, H.K.; Firozjaei, M.K.; Jelokhani-Niaraki, M.; Homaee, M.; Nematollahi, O. The site selection of wind energy power plant using GIS-multi-criteria evaluation from economic perspectives. Renew. Sustain. Energy Rev. 2022, 168, 112778. [Google Scholar] [CrossRef]
- Shorabeh, S.N.; Samany, N.N.; Minaei, F.; Firozjaei, H.K.; Homaee, M.; Boloorani, A.D. A decision model based on decision tree and particle swarm optimization algorithms to identify optimal locations for solar power plants construction in Iran. Renew. Energy 2022, 187, 56–67. [Google Scholar] [CrossRef]
- Hassan, S.A.; Amlan, H.A.; Alias, N.E.; Abd Kadir, M.A.; Sukor, N.S.A. Vulnerability of road transportation networks under natural hazards: A bibliometric analysis and review. Int. J. Disaster Risk Reduct. 2022, 83, 103393. [Google Scholar] [CrossRef]
- Afsari, R.; Nadizadeh Shorabeh, S.; Bakhshi Lomer, A.R.; Homaee, M.; Arsanjani, J.J. Using Artificial Neural Networks to Assess Earthquake Vulnerability in Urban Blocks of Tehran. Remote Sens. 2023, 15, 1248. [Google Scholar] [CrossRef]
- Carey, M.; Huggel, C.; Bury, J.; Portocarrero, C.; Haeberli, W. An integrated socio-environmental framework for glacier hazard management and climate change adaptation: Lessons from Lake 513, Cordillera Blanca, Peru. Clim. Chang. 2012, 112, 733–767. [Google Scholar] [CrossRef]
- Ma, Y.; Lyu, D.; Sun, K.; Li, S.; Zhu, B.; Zhao, R.; Zheng, M.; Song, K. Spatiotemporal Analysis and War Impact Assessment of Agricultural Land in Ukraine Using RS and GIS Technology. Land 2022, 11, 1810. [Google Scholar] [CrossRef]
- Withanage, W.; Gunathilak, M.; Mishra, P.K.; Wijesinghe, W.; Tripathi, S. Indexing habitat suitability and human-elephant conflicts using GIS-MCDA in a human-dominated landscape. Geogr. Sustain. 2023, 4, 343–355. [Google Scholar] [CrossRef]
- Mijani, N.; Shahpari Sani, D.; Dastaran, M.; Karimi Firozjaei, H.; Argany, M.; Mahmoudian, H. Spatial modeling of migration using GIS-based multi-criteria decision analysis: A case study of Iran. Trans. GIS 2022, 26, 645–668. [Google Scholar] [CrossRef]
- Luan, C.; Liu, R.; Peng, S. Land-use suitability assessment for urban development using a GIS-based soft computing approach: A case study of Ili Valley, China. Ecol. Indic. 2021, 123, 107333. [Google Scholar] [CrossRef]
- Parry, J.A.; Ganaie, S.A.; Bhat, M.S. GIS based land suitability analysis using AHP model for urban services planning in Srinagar and Jammu urban centers of J&K, India. J. Urban Manag. 2018, 7, 46–56. [Google Scholar]
- Kumar, A.; Pramanik, M.; Chaudhary, S.; Negi, M.S. Land evaluation for sustainable development of Himalayan agriculture using RS-GIS in conjunction with analytic hierarchy process and frequency ratio. J. Saudi Soc. Agric. Sci. 2021, 20, 1–17. [Google Scholar] [CrossRef]
- Roy, S.; Singha, N.; Bose, A.; Basak, D.; Chowdhury, I.R. Multi-influencing factor (MIF) and RS–GIS-based determination of agriculture site suitability for achieving sustainable development of Sub-Himalayan region, India. Environ. Dev. Sustain. 2023, 25, 7101–7133. [Google Scholar] [CrossRef]
- Zhang, F.; Cao, N. Application and research progress of Geographic Information System (GIS) in agriculture. In Proceedings of the 2019 8th International Conference on Agro-Geoinformatics (Agro-Geoinformatics), Istanbul, Turkey, 16–19 July 2019; pp. 1–5. [Google Scholar]
- Benaissa, F.T.; Khalfallah, B. Industrial Activity Land Suitability Assessment Using Delphi and AHP to Control Land Consumption: The Case Study of Bordj Bouarreridj, Algeria. Eng. Technol. Appl. Sci. Res. 2021, 11, 7738–7744. [Google Scholar] [CrossRef]
- Baghel, A. GIS-based Industrial Land Suitability Analysis for locating Industrial Parks in Raipur and Nava Raipur. In Proceedings of the IOP Conference Series: Earth and Environmental Science, Hanoi, Vietnam, 25–27 February 2022; p. 012024. [Google Scholar]
- Radiom, S. Estimation of actual evapotranspiration in pistachio orchards using SEBAL algorithm in three irrigation system. J. RS GIS Nat. Resour. 2021, 12, 72–90. [Google Scholar]
- Alijani, B.; Saligheh, M. Spatial Analysis of Pistachio Cultivates (Growth Period) in Iran. J. Appl. Res. Geogr. Sci. 2022, 22, 1–24. [Google Scholar]
- Pour-taheri, M.; Roknoddin-eftkhari, A.-R.; Rahbari, M. The Analysis of Social–Economic Impacts of Pistachio Cultivation upon Development of Damghan. Economy 2013, 2, 69–86. [Google Scholar]
- Farajnia, A.; Moravej, K.; Alamdari, P.; Eslahi, M. Application of FAO Agro-ecological Model for Locating Areas Prone to Pistachio Cultivation in East Azerbaijan Province. Water Soil 2021, 35, 703–717. [Google Scholar]
- Bakhshi Lomer, A.R.; Rezaeian, M.; Rezaei, H.; Lorestani, A.; Mijani, N.; Mahdad, M.; Raeisi, A.; Arsanjani, J.J. Optimizing emergency shelter selection in earthquakes using a risk-driven large group decision-making support system. Sustainability 2023, 15, 4019. [Google Scholar] [CrossRef]
- Al Garni, H.Z.; Awasthi, A. Solar PV power plant site selection using a GIS-AHP based approach with application in Saudi Arabia. Appl. Energy 2017, 206, 1225–1240. [Google Scholar] [CrossRef]
- Tegou, L.-I.; Polatidis, H.; Haralambopoulos, D.A. Environmental management framework for wind farm siting: Methodology and case study. J. Environ. Manag. 2010, 91, 2134–2147. [Google Scholar] [CrossRef] [PubMed]
- Baskurt, Z.M.; Aydin, C.C. Nuclear power plant site selection by Weighted Linear Combination in GIS environment, Edirne, Turkey. Prog. Nucl. Energy 2018, 104, 85–101. [Google Scholar] [CrossRef]
- Lysaniuk, B.; Cely-García, M.F.; Giraldo, M.; Larrahondo, J.M.; Serrano-Calderón, L.M.; Guerrero-Bernal, J.C.; Briceno-Ayala, L.; Cruz Rodriguez, E.; Ramos-Bonilla, J.P. Using gis to estimate population at risk because of residence proximity to asbestos processing facilities in Colombia. Int. J. Environ. Res. Public Health 2021, 18, 13297. [Google Scholar] [CrossRef]
- Boloorani, A.D.; Kazemi, Y.; Sadeghi, A.; Shorabeh, S.N.; Argany, M. Identification of dust sources using long term satellite and climatic data: A case study of Tigris and Euphrates basin. Atmos. Environ. 2020, 224, 117299. [Google Scholar] [CrossRef]
- Boloorani, A.D.; Shorabeh, S.N.; Samany, N.N.; Mousivand, A.; Kazemi, Y.; Jaafarzadeh, N.; Zahedi, A.; Rabiei, J. Vulnerability mapping and risk analysis of sand and dust storms in Ahvaz, IRAN. Environ. Pollut. 2021, 279, 116859. [Google Scholar] [CrossRef] [PubMed]
- Ramík, J. Pairwise comparisons method. Lect. Notes Econ. Math. Syst. 2020, 690. [Google Scholar] [CrossRef]
- Saaty, T. The analytic hierarchy process (AHP) for decision making. In Quantitative Assessment in Arms Control; Springer: Boston, MA, USA, 1980; p. 69. [Google Scholar]
- Rezaei, J. Best-worst multi-criteria decision-making method. Omega 2015, 53, 49–57. [Google Scholar] [CrossRef]
- Rezaei, J. Best-worst multi-criteria decision-making method: Some properties and a linear model. Omega 2016, 64, 126–130. [Google Scholar] [CrossRef]
- Vanolya, N.M.; Jelokhani-Niaraki, M. The use of subjective–Objective weights in GIS-based multi-criteria decision analysis for flood hazard assessment: A case study in Mazandaran, Iran. GeoJournal 2019, 86, 379–398. [Google Scholar] [CrossRef]
- Huang, B.; Zha, R.; Chen, S.; Zha, X.; Jiang, X. Fuzzy evaluation of ecological vulnerability based on the SRP-SES method and analysis of multiple decision-making attitudes based on OWA operators: A case of Fujian Province, China. Ecol. Indic. 2023, 153, 110432. [Google Scholar] [CrossRef]
- Karimi Firozjaei, M.; Sedighi, A.; Jelokhani-Niaraki, M. An urban growth simulation model based on integration of local weights and decision risk values. Trans. GIS 2020, 24, 1695–1721. [Google Scholar] [CrossRef]
- Yager, R.R. On ordered weighted averaging aggregation operators in multicriteria decisionmaking. IEEE Trans. Syst. Man Cybern. 1988, 18, 183–190. [Google Scholar] [CrossRef]
- Malczewski, J. Integrating multicriteria analysis and geographic information systems: The ordered weighted averaging (OWA) approach. Int. J. Environ. Technol. Manag. 2006, 6, 7–19. [Google Scholar] [CrossRef]
- Malczewski, J.; Rinner, C. Multicriteria Decision Analysis in Geographic Information Science; Springer: Berlin/Heidelberg, Germany, 2015. [Google Scholar]
- Malczewski, J.; Chapman, T.; Flegel, C.; Walters, D.; Shrubsole, D.; Healy, M.A. GIS–multicriteria evaluation with ordered weighted averaging (OWA): Case study of developing watershed management strategies. Environ. Plan. A 2003, 35, 1769–1784. [Google Scholar] [CrossRef]
- Mokarram, M.; Hojati, M. Using ordered weight averaging (OWA) aggregation for multi-criteria soil fertility evaluation by GIS (case study: Southeast Iran). Comput. Electron. Agric. 2017, 132, 1–13. [Google Scholar] [CrossRef]
- Rezvani, M.; Nickravesh, F.; Astaneh, A.D.; Kazemi, N. A risk-based decision-making approach for identifying natural-based tourism potential areas. J. Outdoor Recreat. Tour. 2022, 37, 100485. [Google Scholar] [CrossRef]
- Moradi, M.; Delavar, M.R.; Moshiri, B. A GIS-based multi-criteria decision-making approach for seismic vulnerability assessment using quantifier-guided OWA operator: A case study of Tehran, Iran. Ann. GIS 2015, 21, 209–222. [Google Scholar] [CrossRef]
- Eldrandaly, K.A.; AL-Amari, M.A. An expert GIS-based ANP-OWA decision making framework for tourism development site selection. Int. J. Intell. Syst. Appl. 2014, 6, 1–11. [Google Scholar] [CrossRef]
- Daniel, C. One-at-a-time plans. J. Am. Stat. Assoc. 1973, 68, 353–360. [Google Scholar] [CrossRef]
- Chen, Y.; Yu, J.; Khan, S. Spatial sensitivity analysis of multi-criteria weights in GIS-based land suitability evaluation. Environ. Model. Softw. 2010, 25, 1582–1591. [Google Scholar] [CrossRef]
- Khalid, K.; Ali, M.; Abd Rahman, N.; Mispan, M. Application on one-at-a-time sensitivity analysis of semi-distributed hydrological model in tropical watershed. Int. J. Eng. Technol. 2016, 8, 132–136. [Google Scholar] [CrossRef]
- Yu, S.; Yun, S.-T.; Hwang, S.-I.; Chae, G. One-at-a-time sensitivity analysis of pollutant loadings to subsurface properties for the assessment of soil and groundwater pollution potential. Environ. Sci. Pollut. Res. 2019, 26, 21216–21238. [Google Scholar] [CrossRef]
- Dutta, B.; Das, M.; Roy, U.; Das, S.; Rath, S. Spatial analysis and modelling for primary healthcare site selection in Midnapore town, West Bengal. GeoJournal 2021, 87, 4807–4836. [Google Scholar] [CrossRef]
- Torkayesh, A.E.; Zolfani, S.H.; Kahvand, M.; Khazaelpour, P. Landfill location selection for healthcare waste of urban areas using hybrid BWM-grey MARCOS model based on GIS. Sustain. Cities Soc. 2021, 67, 102712. [Google Scholar] [CrossRef]
- Mighty, M.A. Site suitability and the analytic hierarchy process: How GIS analysis can improve the competitive advantage of the Jamaican coffee industry. Appl. Geogr. 2015, 58, 84–93. [Google Scholar] [CrossRef]
- Zambrano-Asanza, S.; Quiros-Tortos, J.; Franco, J.F. Optimal site selection for photovoltaic power plants using a GIS-based multi-criteria decision making and spatial overlay with electric load. Renew. Sustain. Energy Rev. 2021, 143, 110853. [Google Scholar] [CrossRef]
- Feng, P.; Yi-peng, J.; Li-nan, D.; Zhan-xiu, S. Study on layout optimization of the iron and steel industry in the Bohai Sea rim area based on GIS. In Proceedings of the 2013 International Conference on Management Science and Engineering 20th Annual Conference Proceedings, Prague, Czech Republic, 21–24 April 2013; pp. 1183–1189. [Google Scholar]
- Awasthi, M.K.; Pandey, A.K.; Bundela, P.S.; Wong, J.W.; Li, R.; Zhang, Z. Co-composting of gelatin industry sludge combined with organic fraction of municipal solid waste and poultry waste employing zeolite mixed with enriched nitrifying bacterial consortium. Bioresour. Technol. 2016, 213, 181–189. [Google Scholar] [CrossRef] [PubMed]
- Yalcinkaya, S.; Uzer, S.; Kaleli, H.İ.; Doğan, F.; Kayalık, M. Compost plant site selection for food waste using GIS based multicriteria analysis. Turk. J. Agric.-Food Sci. Technol. 2021, 9, 1908–1914. [Google Scholar] [CrossRef]
- Rezaei, H.; Macioszek, E.; Derakhshesh, P.; Houshyar, H.; Ghabouli, E.; Bakhshi Lomer, A.R.; Ghanbari, R.; Esmailzadeh, A. A Spatial Decision Support System for Modeling Urban Resilience to Natural Hazards. Sustainability 2023, 15, 8777. [Google Scholar] [CrossRef]
- Li, X.; Hijazi, I.; Koenig, R.; Lv, Z.; Zhong, C.; Schmitt, G. Assessing essential qualities of urban space with emotional and visual data based on GIS technique. ISPRS Int. J. Geo-Inf. 2016, 5, 218. [Google Scholar] [CrossRef]
- Ghoushchi, S.J.; Dorosti, S.; Khazaeili, M.; Mardani, A. Extended approach by using best–worst method on the basis of importance–necessity concept and its application. Appl. Intell. 2021, 51, 8030–8044. [Google Scholar] [CrossRef]
- Nadizadeh Shorabeh, S.; Neisany Samany, N.; Abdali, Y. Mapping the potential of solar power plants based on the concept of risk Case study: Razavi Khorasan Province. Sci.-Res. Q. Geogr. Data SEPEHR 2019, 28, 129–147. [Google Scholar]
- Nadizadeh Shorabeh, S.; Neysani Samani, N.; Jelokhani-Niaraki, M.R.J.-N. Determination of optimum areas for the landfill with emphasis on the urban expansion trend based on the combination of the Analytical Hierarchy Process and the Ordered Weighted Averaging model. J. Nat. Environ. 2017, 70, 949–969. [Google Scholar]
- Vanolya, N.M.; Jelokhani-Niaraki, M.; Toomanian, A. Validation of spatial multicriteria decision analysis results using public participation GIS. Appl. Geogr. 2019, 112, 102061. [Google Scholar] [CrossRef]
- Gasparin, A.; Lukovic, S.; Alippi, C. Deep learning for time series forecasting: The electric load case. CAAI Trans. Intell. Technol. 2022, 7, 1–25. [Google Scholar] [CrossRef]
- Meng, J.; Li, Y.; Liang, H.; Ma, Y. Single-image dehazing based on two-stream convolutional neural network. J. Artif. Intell. Technol. 2022, 2, 100–110. [Google Scholar] [CrossRef]
- Zheng, M.; Zhi, K.; Zeng, J.; Tian, C.; You, L. A hybrid CNN for image denoising. J. Artif. Intell. Technol. 2022, 2, 93–99. [Google Scholar] [CrossRef]
- Wu, Z.; Luo, G.; Yang, Z.; Guo, Y.; Li, K.; Xue, Y. A comprehensive review on deep learning approaches in wind forecasting applications. CAAI Trans. Intell. Technol. 2022, 7, 129–143. [Google Scholar] [CrossRef]
- Ma, L.; Wei, P.; Qu, X.; Bi, S.; Zhou, Y.; Shen, T. Apple grading method based on neural network with ordered partitions and evidential ensemble learning. CAAI Trans. Intell. Technol. 2022, 7, 561–569. [Google Scholar] [CrossRef]


| Criteria | Description |
|---|---|
| Proximity to city and village | Pistachio processing facilities should not be far from urban and rural areas, as they host the workforce and central markets [46]. Therefore, location suitability increases as the proximity decreases. However, in order to reduce the negative effects that industrial areas may have on the urban environment, a proximity of less than 300 m from the city and 200 m from the village was considered a restriction. |
| Proximity to fault and landslide points | As the proximity to fault and landslide points increases, the location suitability increases since such events can cause serious damage [47]. Therefore, locations with a proximity of less than 1000 m were considered restricted areas. |
| Elevation and slope | The higher the slope and elevation, the higher the cost of energy transfer, construction, and equipment transport [28]. Therefore, a lower slope and elevation means higher suitability. Here, slopes over 35% and elevations over 2200 m were considered restricted areas. |
| Proximity to power transmission lines | Considering both easy access and cost saving [48], the lesser the proximity to the power grid, the higher the suitability. However, in order to reduce electrical hazards, areas with a proximity of less than 200 m were considered restricted areas. |
| Accessibility | Easy accessibility means higher investment opportunities and economic growth. In addition, the longer the proximity, the higher the transportation costs and production time [49]. |
| Proximity to stream network | Being too close to water bodies can cause flooding hazards and economic loss [50]. According to the regulations of Iran’s Environment and Forestry Organization, a proximity of less than 300 m from rivers was considered a restriction. |
| Proximity to coldstores | Proximity to coldstores is very important given their necessity for maintaining product properties and quality and increasing added value [41]. |
| Proximity to pistachio orchards | A fundamental criterion in determining a suitable location for pistachio processing facilities is proximity to pistachio orchards [10,42]. Still, a proximity of less than 300 m was considered a restriction to prevent possible damage to pistachio orchards. |
| Proximity to industrial areas | Given the existence of suitable infrastructure, access to raw materials and equipment, and access to technology in industrial areas, the shorter the proximity, the higher the suitability [51]. |
| 1 | 2 | 3 | 4 | 5 | 6 | 7 | 8 | 9 | |
|---|---|---|---|---|---|---|---|---|---|
| 0.00 | 0.44 | 1.00 | 1.63 | 2.30 | 3.00 | 3.73 | 4.47 | 5.23 |
| Criteria | Weight | Type of Impact |
|---|---|---|
| Proximity to city | 0.12 | Minimum |
| Elevation | 0.05 | Minimum |
| Proximity to faults | 0.04 | Maximum |
| Proximity to gas lines | 0.02 | Minimum |
| Proximity to landslide points | 0.04 | Maximum |
| Proximity to pistachio orchards | 0.16 | Minimum |
| Proximity to power lines | 0.03 | Minimum |
| Proximity to railway stations | 0.05 | Minimum |
| Proximity to stream networks | 0.04 | Minimum |
| Proximity to road networks | 0.10 | Minimum |
| Proximity to industrial areas | 0.09 | Minimum |
| Slope | 0.06 | Minimum |
| Proximity to coldstores | 0.03 | Minimum |
| Proximity to terminals | 0.07 | Minimum |
| Proximity to village points | 0.10 | Minimum |
| Min | Max | Mean | STD | |
|---|---|---|---|---|
| Very pessimistic | 0.01 | 0.56 | 0.19 | 0.09 |
| Pessimistic | 0.18 | 0.84 | 0.47 | 0.13 |
| Intermediate | 0.33 | 0.91 | 0.63 | 0.10 |
| Optimistic | 0.51 | 0.96 | 0.78 | 0.07 |
| Very optimistic | 0.74 | 1 | 0.97 | 0.02 |
| Very Low | Low | Moderate | High | Very High | |
|---|---|---|---|---|---|
| Very pessimistic | 53.10 | 45.13 | 1.77 | 0.00 | 0.00 |
| Pessimistic | 0.15 | 31.13 | 48.85 | 19.47 | 0.41 |
| Intermediate | 0.00 | 0.99 | 36.17 | 54.59 | 8.25 |
| Optimistic | 0.00 | 0.00 | 1.59 | 58.76 | 39.64 |
| Very optimistic | 0.00 | 0.00 | 0.00 | 0.22 | 99.78 |
Disclaimer/Publisher’s Note: The statements, opinions and data contained in all publications are solely those of the individual author(s) and contributor(s) and not of MDPI and/or the editor(s). MDPI and/or the editor(s) disclaim responsibility for any injury to people or property resulting from any ideas, methods, instructions or products referred to in the content. |
© 2023 by the authors. Licensee MDPI, Basel, Switzerland. This article is an open access article distributed under the terms and conditions of the Creative Commons Attribution (CC BY) license (https://creativecommons.org/licenses/by/4.0/).
Share and Cite
Ebrahimi Sirizi, M.; Taghavi Zirvani, E.; Esmailzadeh, A.; Khosravian, J.; Ahmadi, R.; Mijani, N.; Soltannia, R.; Jokar Arsanjani, J. A Scenario-Based Multi-Criteria Decision-Making Approach for Allocation of Pistachio Processing Facilities: A Case Study of Zarand, Iran. Sustainability 2023, 15, 15054. https://doi.org/10.3390/su152015054
Ebrahimi Sirizi M, Taghavi Zirvani E, Esmailzadeh A, Khosravian J, Ahmadi R, Mijani N, Soltannia R, Jokar Arsanjani J. A Scenario-Based Multi-Criteria Decision-Making Approach for Allocation of Pistachio Processing Facilities: A Case Study of Zarand, Iran. Sustainability. 2023; 15(20):15054. https://doi.org/10.3390/su152015054
Chicago/Turabian StyleEbrahimi Sirizi, Mohammad, Esmaeil Taghavi Zirvani, Abdulsalam Esmailzadeh, Jafar Khosravian, Reyhaneh Ahmadi, Naeim Mijani, Reyhaneh Soltannia, and Jamal Jokar Arsanjani. 2023. "A Scenario-Based Multi-Criteria Decision-Making Approach for Allocation of Pistachio Processing Facilities: A Case Study of Zarand, Iran" Sustainability 15, no. 20: 15054. https://doi.org/10.3390/su152015054
APA StyleEbrahimi Sirizi, M., Taghavi Zirvani, E., Esmailzadeh, A., Khosravian, J., Ahmadi, R., Mijani, N., Soltannia, R., & Jokar Arsanjani, J. (2023). A Scenario-Based Multi-Criteria Decision-Making Approach for Allocation of Pistachio Processing Facilities: A Case Study of Zarand, Iran. Sustainability, 15(20), 15054. https://doi.org/10.3390/su152015054