


Assessment of Eutrophication Characteristics and Evaluation of the First-Generation Eutrophication Model in the Nearshore Waters of Shantou City


Abstract
:1. Introduction
2. Materials and Methods
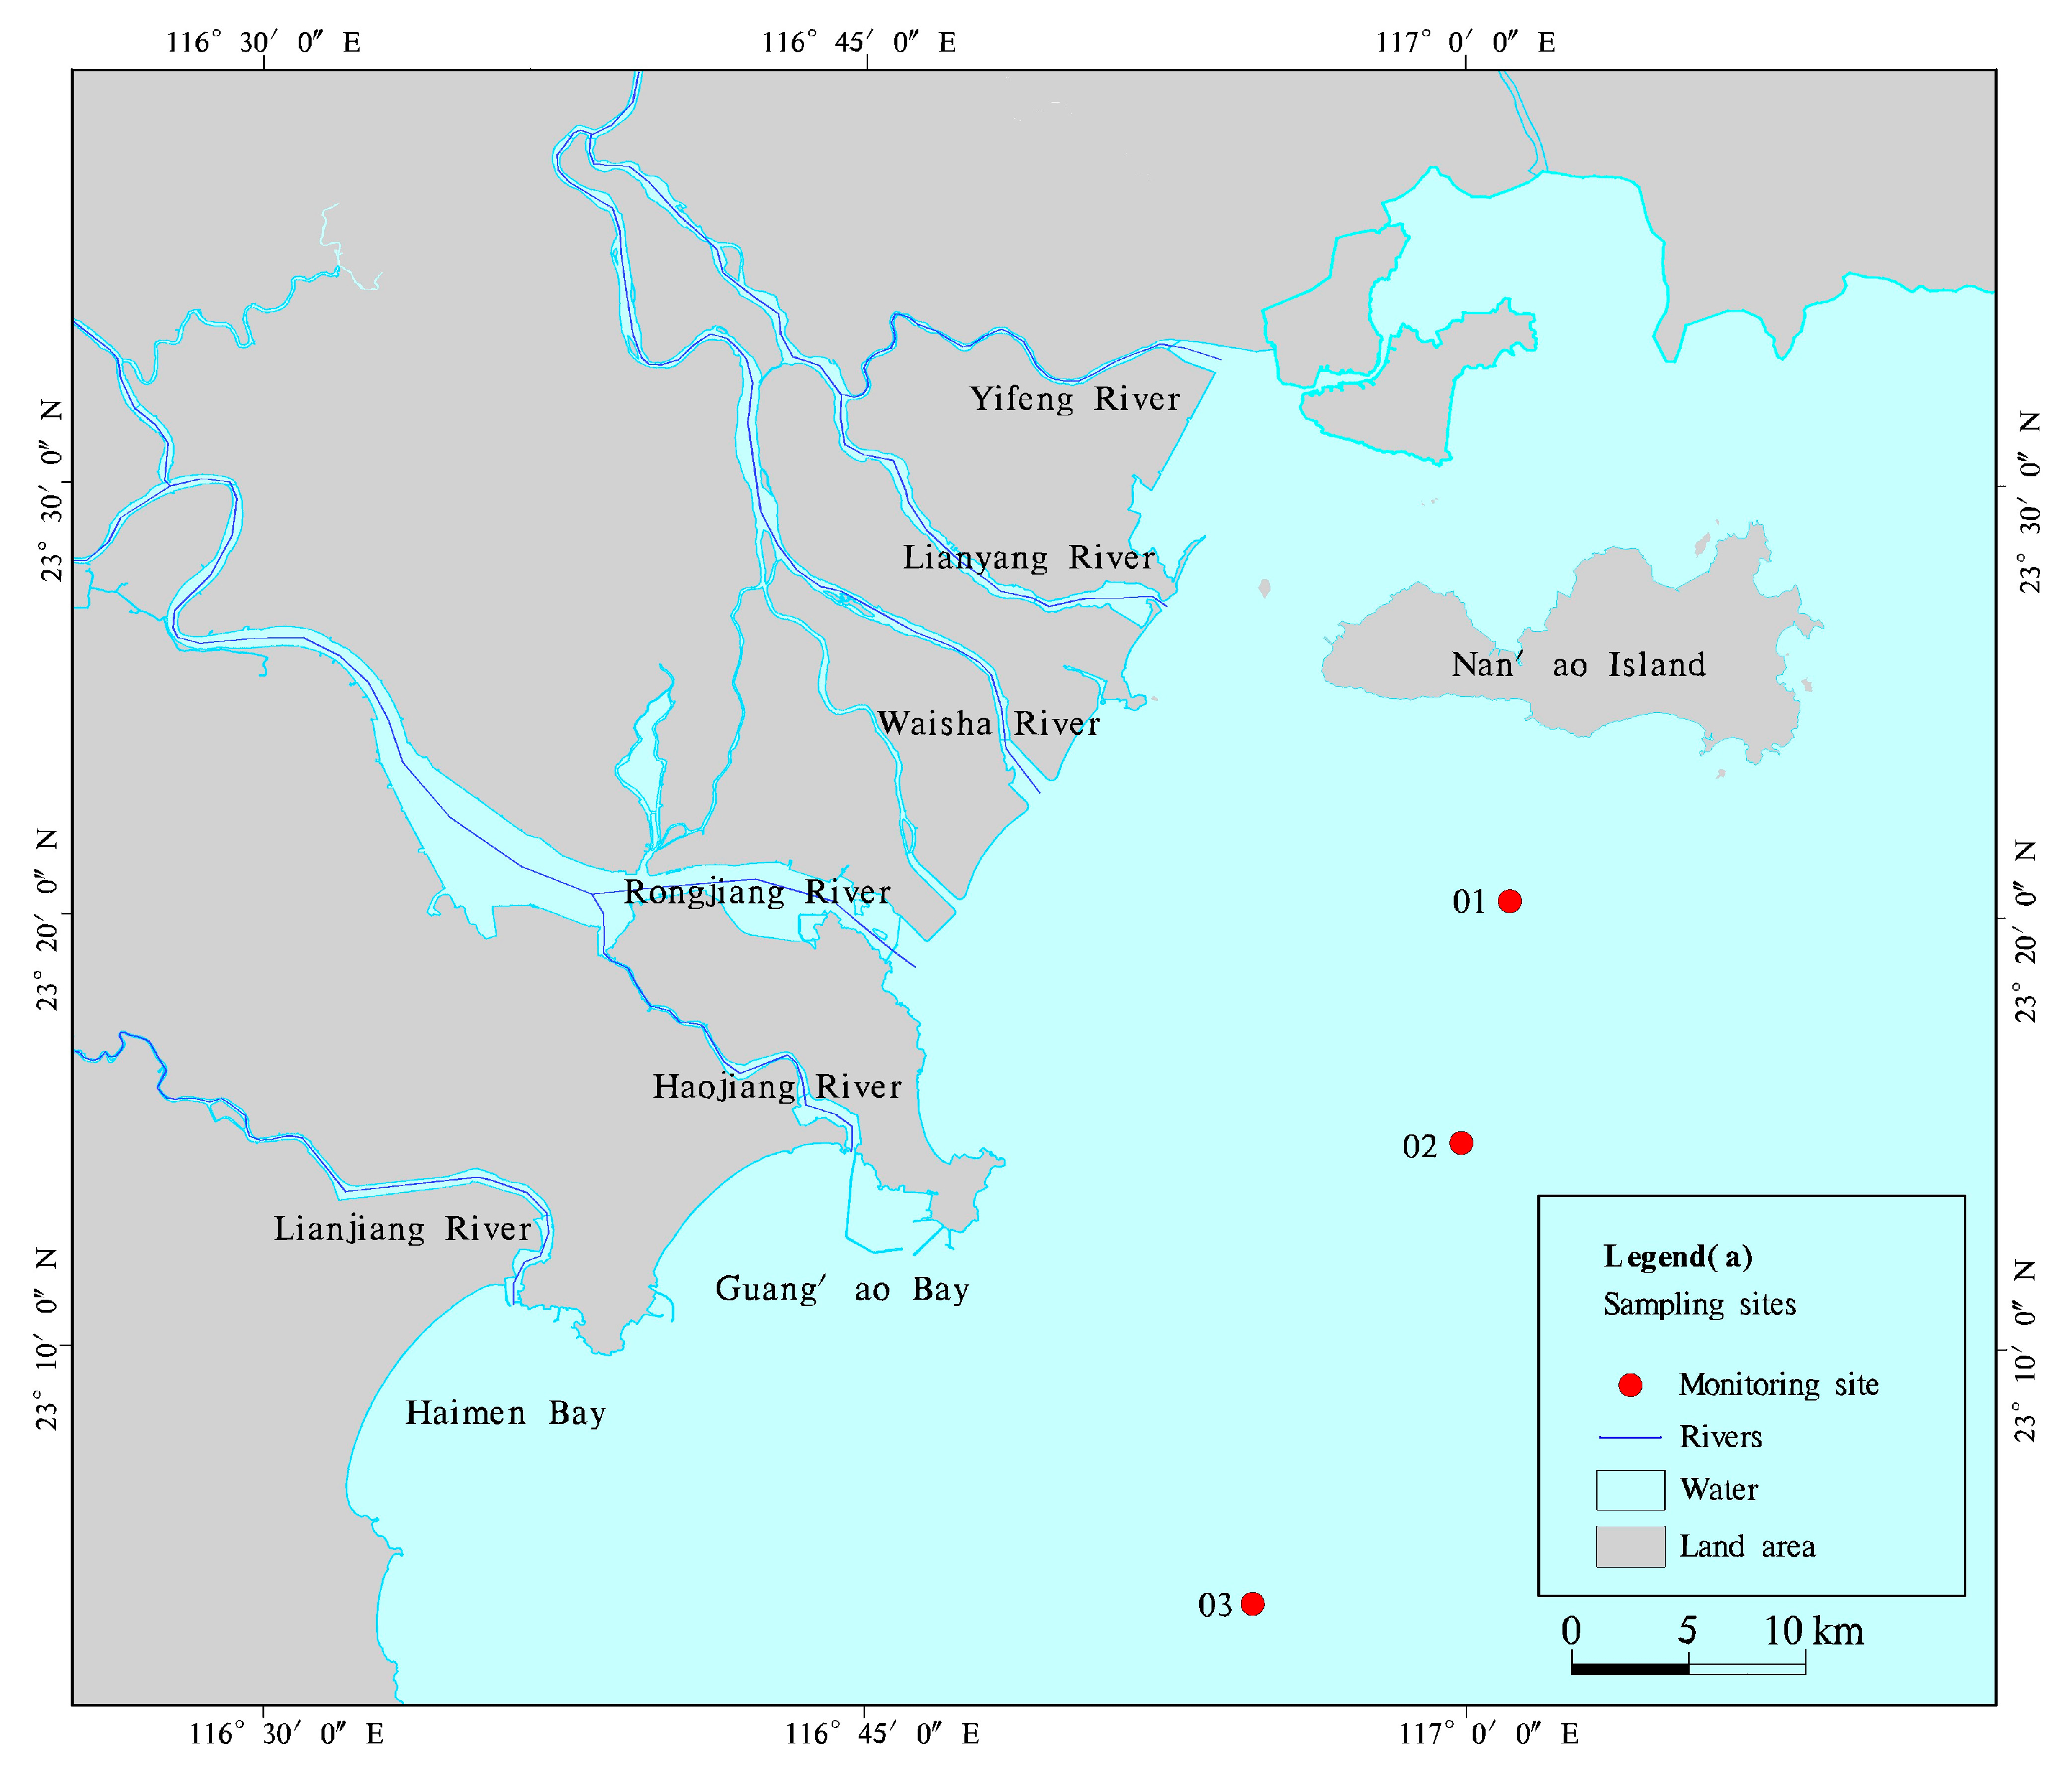
2.1. Monitoring Stations
2.2. Eutrophication Assessment Methods for Seawater
- Single-factor index method: This method uses the standard index method to evaluate the equivalent impact of individual water quality factors on the environment. The factor pollution index of 1.0 serves as the basic threshold for determining whether the factor pollutes the environment. A value less than 0.5 indicates that the water area is not polluted by that factor, a value between 0.5 and 1.0 indicates pollution in the water area due to that factor, and a value greater than 1.0 indicates severe pollution in the water area due to that factor. The formula is as follows:
- 2.
- The eutrophication index method: The level of water eutrophication is determined based on the indicators specified in Table 3. The calculation formula for the eutrophication index (E) is as follows:
- 3.
- Nutritional status quality method: the calculation formula is as follows:
- 4.
- Comprehensive index method: the calculation formula is as follows:
- 5.
- Organic pollution index: We refer readers to the rating scale (Table 4). The calculation formula is as follows:
- 6.
- Nitrogen–phosphorus ratio method: The nitrogen-to-phosphorus ratio method is based on the Redfield ratio, which represents the theoretical basis of marine phytoplankton’s absorption of nitrogen and phosphorus nutrients. When the nitrogen-to-phosphorus ratio (N/P) is less than 8, it indicates nitrogen limitation, while an N/P greater than 30 indicates phosphorus limitation. Based on the first-class seawater quality standards in China, upper or lower threshold values for dissolved inorganic nitrogen (DIN) and dissolved inorganic phosphorus (DIP) concentrations are determined for oligotrophic, mesotrophic, and eutrophic seawater. The nitrogen-to-phosphorus ratio method is commonly used to calculate potential eutrophication and reveals the limitations of nutrient enrichment. It is believed that only when the nitrogen-to-phosphorus ratio approaches the Redfield ratio can the contribution of potential nutrient reserves to eutrophication be released.
- 7.
- Potential eutrophication assessment: The nitrogen-to-phosphorus ratio (N/P) is a key indicator for assessing nutrient concentration structures in seawater. Redfield [43] discovered that the molar ratio of nitrogen to phosphorus in deep ocean layers is generally around 16:1, which is referred to as the Redfield ratio. This ratio is widely used to determine whether the growth of phytoplankton in a particular marine area is limited by phosphorus or nitrogen [44]. Bueler [45] conducted experiments and found that when N/P > 30, phytoplankton growth is limited by phosphorus, while N/P < 8 indicates that phytoplankton growth is limited by nitrogen. Phytoplankton typically uptakes nutrients based on the Redfield ratio, resulting in a relative surplus of phosphorus (in nitrogen-limited water bodies) or nitrogen (in phosphorus-limited water bodies). Guo Weidong et al. [40] proposed a potential eutrophication assessment model, known as the potential eutrophication assessment model (PEAM), which reflects nutrient limitation. This model primarily relies on the concentrations of dissolved inorganic nitrogen (DIN) and dissolved inorganic phosphate (DIP), along with the N/P value. It combines China’s seawater quality standards and results from biological cultivation experiments to categorize the eutrophication status into nine trophic levels. The classification criteria and principles for trophic levels can be seen in Table 5.
- 8.
- Dissolved oxygen saturation parameter method: the calculation formula is as follows:
3. Results
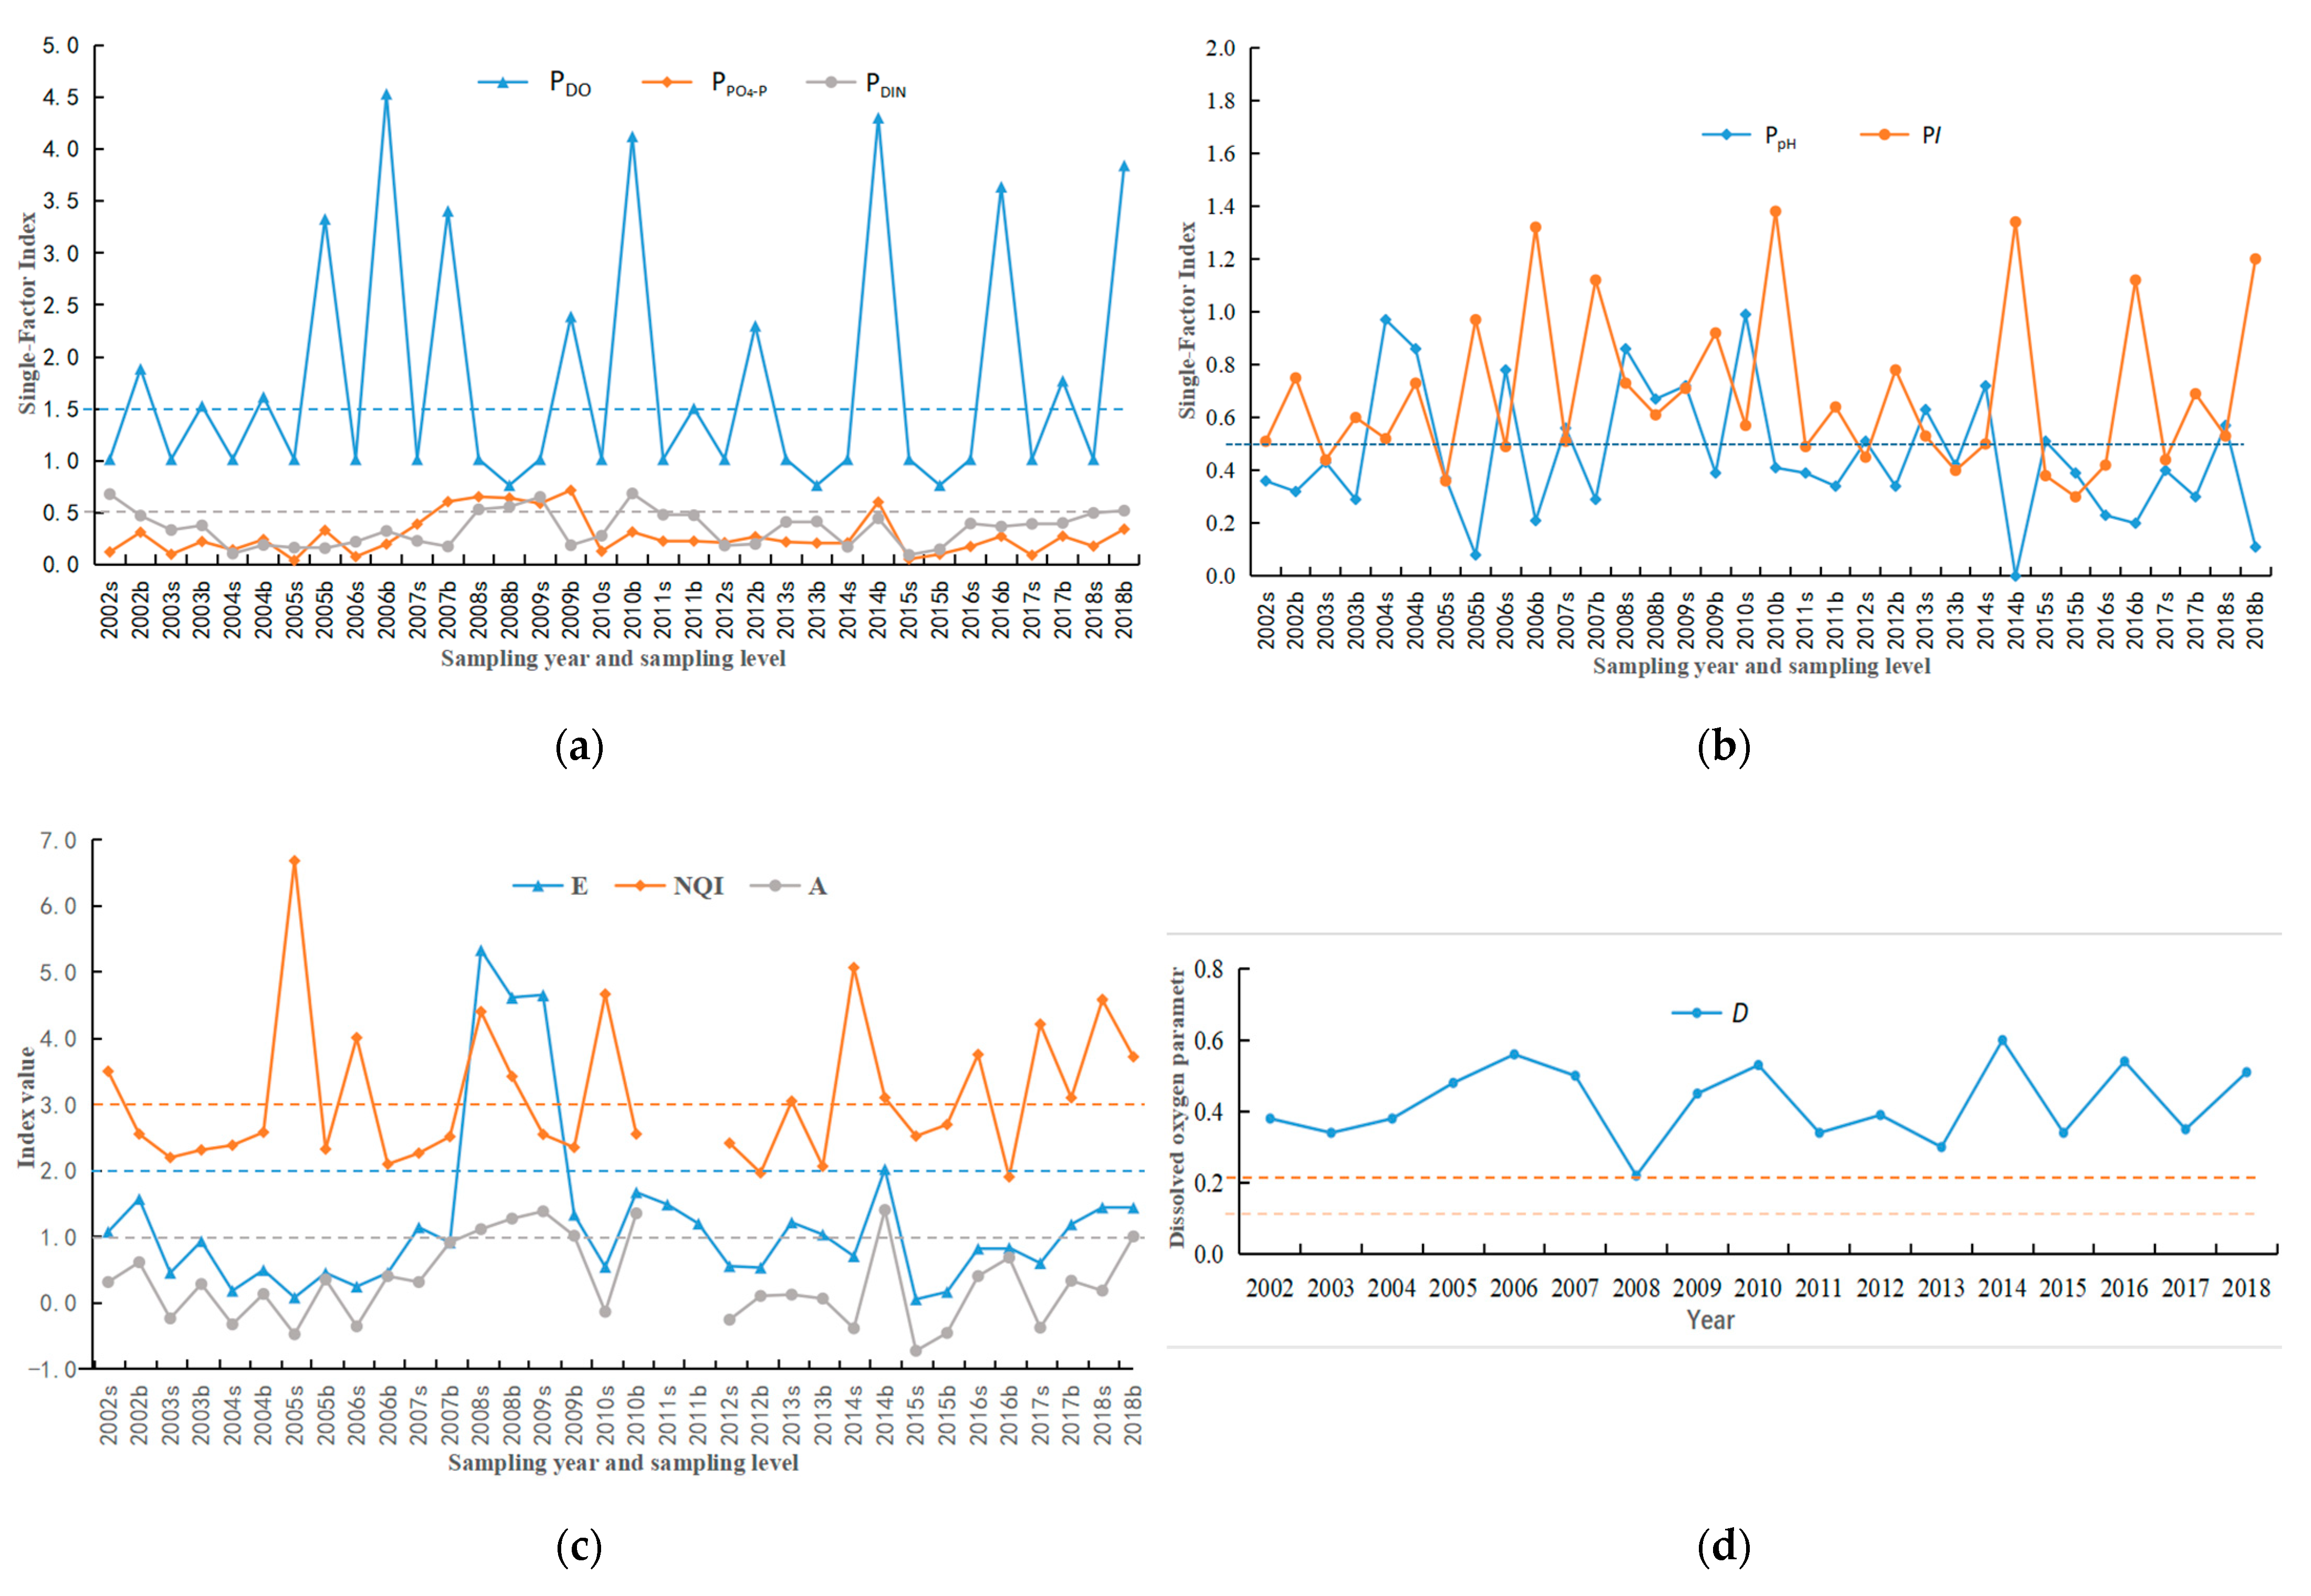
3.1. Single-Factor Index Method
- The pH index ranges from 0.08 to 0.99. Values between 0.5 and 1.0 indicate pollution caused by this factor in the water body. The years affected by pollution are 2004, 2006–2010, 2012–2015, and 2018. Pollution mainly occurred at the surface layer, while the bottom layer was contaminated in 2004 and 2008. This indicates that out of the 17 years of monitoring, this factor caused pollution in 11 years, with less impact on the bottom layer of water.
- The range of the PDO index is 0.08–4.54. The dissolved oxygen index in surface water was 1.06 in 2014, indicating severe pollution from this factor. In other years, the dissolved oxygen index in surface water was less than 1, with years between 0.5 and 1 being 2002, 2004, 2005, 2007, 2009, 2011, 2013, 2015, and 2016, indicating pollution from this factor in those years. The dissolved oxygen indices in the bottom water were lower than 1 only in 2008 and 2013, indicating pollution from this factor, while in other years, the dissolved oxygen indices in bottom water were greater than 1, indicating severe pollution from this factor in other years in the marine region.
- The PDIN index ranges from 0.09 to 0.68, with values between 0.5 and 1.0 indicating pollution by this factor in the water body. The polluted years include 2002 (surface), 2008 (surface and bottom layers), 2009 (surface), 2010 (bottom layer), and 2018 (surface and bottom layers). All other years are considered unpolluted.
- The range of the PDIP index is 0.04–0.71. The years 2007 (bottom), 2008 (surface and bottom), 2009 (surface and bottom), and 2014 (bottom) fall between 0.5 and 1, indicating pollution from this factor in those years. Compared with the seawater quality standard, the years of pollution indicated by the second-class seawater classification are consistent with the index method.
3.2. Eutrophication Index Method
3.3. Nutrient Quality Index Method
3.4. Comprehensive Index Method
3.5. Organic Pollution Index Method
3.6. Nitrogen–Phosphorus Ratio Method and Eutrophication Evaluation
3.7. Dissolved Oxygen Saturation Parameters Method
4. Discussion
4.1. Red Tide Occurrence in the Study Area
4.2. Advantages and Disadvantages of Each Evaluation Method
- Single-factor index method and comprehensive index method
- 2.
- Eutrophication index method, nutrient state quality method, and organic pollution index method
- 3.
- Nitrogen–Phosphorus Ratio Method and Eutrophication Assessment
- 4.
- Dissolved Oxygen Saturation Parameter Method
4.3. Application Prospects of the First-Generation Eutrophication Assessment Model
5. Conclusions
- According to the N/P ratio and potential eutrophication evaluation method, the coastal waters of the study area are mostly in a phosphorus-limited state for the majority of the time, occasionally in a nutrient-poor state, and rarely in a moderately nutrient-limited state of both nitrogen and phosphorus. The overall trend shows an increase in the N/P ratio, mainly due to the gradual increase in inorganic nitrogen content.
- In terms of evaluating eutrophication symptoms, the comprehensive index method provides a better reflection of eutrophication statuses. The eutrophication index method and dissolved oxygen saturation parameter method can highlight problematic areas but often overestimate them. The nutrient status quality method and organic pollution index method do not provide distinguishing indications and cannot validate red tide symptoms. The nitrogen–phosphorus ratio method and potential eutrophication evaluation can reflect certain nutrient structures and eutrophication characteristics but also cannot validate red tide symptoms.
- This study found that there is a certain pattern between the occurrence of red tides and the ratio of nitrate nitrogen to ammonia nitrogen. The ratio falls between 1.15 and 1.94 during red tide occurrences. Therefore, further verification is needed to determine whether this ratio can be used as a characteristic value for red tide prediction and monitoring.
Author Contributions
Funding
Institutional Review Board Statement
Informed Consent Statement
Data Availability Statement
Conflicts of Interest
References
- Dai, M.; Zhao, Y.; Chai, F.; Chen, M.; Chen, N. Persistent eutrophication and hypoxia in the coastal ocean. Camb. Prism. Coast. Futures 2023, 1, E19. [Google Scholar] [CrossRef]
- Han, G.; Fan, J. The Current Status and Development Trend of the Ecological Environment in China’s Nearshore Waters; Ocean Press: Beijing, China, 2016. [Google Scholar]
- State Oceanic Administration. 2016 China Marine Environment Bulletin; State Oceanic Administration: Beijing, China, 2017. [Google Scholar]
- Devlin, M.J.; Lyons, B.P.; Bacon, J.; Edmonds, N.; Tracey, D.; Al Zaidan, A.S.; Al Ajmi, F.; Al-Wazzan, Z.A.; Al-Hussain, M.M.; Al Khaled, H.; et al. Principles to enable comprehensive national marine ecosystem status assessments from disparate data: The state of the marine environment in Kuwait. Estuar. Coast. Shelf Sci. 2019, 230, 106407. [Google Scholar] [CrossRef]
- Howarth, R.W.; Anderson, D.B.; Cloern, J.E.; Elfring, C.; Hopkinson, C.S.; Lapointe, B.; Malone, T.; Marcus, N.; McGlathery, K.; Sharpley, A.N.; et al. Nutrient pollution of coastal rivers, bays and seas. Issues Ecol. 2000, 7, 1–15. [Google Scholar]
- Foden, J.; Devlin, M.J.; Mills, D.K.; Malcolm, S.J. Searching for undesirable disturbance: An application of the OSPAR eutrophication assessment method to marine waters of England and Wales. Biogeochemistry 2011, 106, 157–175. [Google Scholar] [CrossRef]
- Kratzer, S.; Kyryliuk, D.; Edman, M.; Philipson, P.; Lyon, S.W. Synergy of satellite, in situ and modelled data for addressing the scarcity of water quality information for eutrophication assessment and monitoring of swedish coastal waters. Remote Sens. 2019, 11, 2051. [Google Scholar] [CrossRef]
- Lao, Q.; Liu, G.; Gao, J.; Shen, Y.; Guo, Z.; Qing, S.; Su, Q.; Sun, Y. Study on the distribution characteristics of nutrients and eutrophication status in Qinzhou Bay aquaculture area. Mar. Environ. Sci. 2021, 40, 407–416. [Google Scholar]
- Kitsiou, D.; Karydis, M. Coastal marine eutrophication assessment: A review on data analysis. Environ. Int. 2011, 37, 778–801. [Google Scholar] [CrossRef]
- Nguyen, T.T.; Némery, J.; Gratiot, N.; Strady, E.; Tran, V.Q.; Nguyen, A.T.; Aimé, J.; Peyne, A. Nutrient dynamics and eutrophication assessment in the tropical river system of Saigon-Dongnai (southern Vietnam). Sci. Total Environ. 2019, 653, 370–383. [Google Scholar] [CrossRef] [PubMed]
- Große, F.; Fennel, K.; Laurent, A. Quantifying the relative importance of riverine and Open-Ocean nitrogen sources for hypoxia formation in the northern Gulf of Mexico. J. Geophys. Res. Ocean. 2019, 124, 5451–5467. [Google Scholar] [CrossRef]
- Santos, I.R.; Chen, X.; Lecher, A.L.; Sawyer, A.H.; Moosdorf, N.; Rodellas, V.; Tamborski, J.; Cho, H.-M.; Dimova, N.; Sugimoto, R.; et al. Submarine groundwater discharge impacts on coastal nutrient biogeochemistry. Nat. Rev. Earth Environ. 2021, 2, 307–323. [Google Scholar] [CrossRef]
- Tuholske, C.; Halpern, B.S.; Blasco, G.; Villasenor, J.C.; Frazier, M.; Caylor, K. Mapping global inputs and impacts from of human sewage in coastal ecosystems. PLoS ONE 2021, 16, e0258898. [Google Scholar] [CrossRef] [PubMed]
- Asmal, I.; Syarif, E.; Amin, S.; Walenna, M.A. The Impact of the Environment and People’s Attitudes on Greywater Management in Slum Coastal Settlements. Civ. Eng. J. 2022, 8, 2734–2748. [Google Scholar] [CrossRef]
- Codispoti, L.; Brandes, J.A.; Christensen, J.; Devol, A.; Naqvi, S.; Paerl, H.W.; Yoshinari, T. The oceanic fixed nitrogen and nitrous oxide budgets: Moving targets as we enter the anthropocene? Sci. Mar. 2001, 65, 85–105. [Google Scholar] [CrossRef]
- Liu, X.; Stock, C.A.; Dunne, J.P.; Lee, M.; Shevliakova, E.; Malyshev, S.; Milly, P.C.D. Simulated global coastal ecosystem responses to a half-century increase in river nitrogen loads. Geophys. Res. Lett. 2021, 48, e2021GL094367. [Google Scholar] [CrossRef]
- Bennett, E.M.; Carpenter, S.R.; Caraco, N.F. Human impact on erodable phosphorus and eutrophication: A global perspective: Increasing accumulation of phosphorus in soil threatens rivers, lakes, and coastal oceans with eutrophication. Bioscience 2001, 51, 227–234. [Google Scholar] [CrossRef]
- Malone, T.C.; Newton, A. The globalization of cultural eutrophication in the Coastal Ocean: Causes and consequences. Front. Mar. Sci. 2020, 7, 670. [Google Scholar] [CrossRef]
- Beusen, A.; Doelman, J.; Van Beek, L.; Van Puijenbroek, P.J.T.M.; Mogollón, J.M.; Van Grinsven, H.J.M.; Stehfest, E.; Van Vuuren, D.P.; Bouwman, A.F. Exploring river nitrogen and phosphorus loading and export to global coastal waters in the shared socio-economic pathways. Glob. Environ. Chang. 2022, 72, 102426. [Google Scholar] [CrossRef]
- Peñuelas, J.; Sardans, J. The global nitrogen-phosphorus imbalance. Science 2022, 375, 266–267. [Google Scholar] [CrossRef] [PubMed]
- Lin, S.; Litaker, R.W.; Sunda, W.G. Phosphorus physiological ecology and molecular mechanisms in marine phytoplankton. J. Phycol. 2016, 52, 10–36. [Google Scholar] [CrossRef]
- Paerl, H.W. Mitigating toxic planktonic cyanobacterial blooms in aquatic ecosystems facing increasing anthropogenic and climatic pressures. Toxins 2018, 10, 76. [Google Scholar] [CrossRef]
- Lin, X.; Gao, S.; Zhang, T.; Liu, G. Research progress and application status of methods for evaluating eutrophication in seawater. Adv. Earth Sci. 2018, 33, 373–384. [Google Scholar]
- Yao, Y.; Shen, Z. Water quality evaluation of eutrophication in Jiaozhou Bay. Mar. Sci. 2004, 28, 14–17. [Google Scholar]
- Wu, Z. Eutrophication Characteristics, Evaluation Methods and Their Applications in Typical Sea Areas of China; Graduate University of Chinese Academy of Sciences (Institute of Oceanography): Qingdao, China, 2013. [Google Scholar]
- Shantou Municipal Bureau of Ocean and Fisheries. Shantou Marine Environment Report (2015); Shantou Municipal Bureau of Ocean and Fisheries: Shantou, China, 2011. [Google Scholar]
- Zhao, C.; Hu, J.; Li, F.; Liu, L.; Lu, W.; Fu, J.; Zhou, J.; Li, J. Distribution and Risk Assessment of Heavy Metal Contents in Surface Sediments of Shantou Bay, Guangdong. J. Appl. Oceanogr. 2020, 39, 408–418. [Google Scholar]
- Nworie, F.S.; Mgbemena, N.; Ike-Amadi, A.C.; Ebunoha, J. Functionalized Biochars for Enhanced Removal of Heavy Metals from Aqueous Solutions: Mechanism and Future Industrial Prospects. J. Hum. Earth Future 2022, 3, 377–395. [Google Scholar] [CrossRef]
- Li, J.; Liu, N.; Gong, Q.; Li, C. Survey and Evaluation of Heavy Metal Environmental Quality in the Inshore Bay Sediments of Shantou City, Guangdong. Mod. Geol. 2021, 35, 1441–1449. [Google Scholar]
- Zhang, J.; Ke, D.; Fang, H.; Sun, S. Study on Nitrogen and Phosphorus Nutrient Environmental Capacity and Total Emission Control in Shantou Port Sea Area. J. Dalian Ocean. Univ. 2012, 27, 247–254. [Google Scholar]
- Huang, Y. Analysis of the Spatial and Temporal Distribution Characteristics of Nitrogen and Nitrogen Transformation Processes in Estuarine Rivers with Sluice Control; Shantou University: Shantou, China, 2022. [Google Scholar]
- Zhang, J.; Liu, Q.; Wang, Q.; Yang, Y. Phytoplankton Community Structure and Distribution Characteristics of Nutrients in Baisha Bay, Nanao, Shantou. J. Aquat. Ecol. 2012, 33, 61–68. [Google Scholar]
- Chen, D.; Ke, Z.; Tang, Y.; Liu, J. Seasonal Distribution Characteristics of Nutrients in Nanao-Dongshan Waters, Shantou, and Potential Limitations on Phytoplankton Growth. Ecol. Sci. 2020, 39, 41–50. [Google Scholar]
- GB 17378-2007; Specification for Marine Monitoring. National Technical Committee for Marine Standardization: Beijing, China, 2008.
- Office of the Leading Group for the Second National Marine Pollution Baseline Survey. Technical Regulations for the Second National Marine Pollution Baseline Survey; China Ocean Press: Beijing, China, 1997. [Google Scholar]
- HJ 442.0-2020; Evaluation and Reporting of Nearshore Marine Environment Monitoring Specifications Part Ten. China Environmental Science Press: Beijing, China, 2021.
- Bian, J.; Yuan, L.; Wang, Q.; Jiang, J.; Li, J.; Zhuang, H.; Xue, J.; Wu, H. Analysis of water quality variations and eutrophication assessment in the waters of Yangshan Deep-water Port. Mar. Bull. 2013, 32, 107–112. [Google Scholar]
- China Geological Survey. Specification for Geological Environmental Investigation and Evaluation of Coastal Zone; (DD 2014-03); China Geological Survey: Beijing, China, 2014. [Google Scholar]
- Guo, F.; Chen, J.; Zhang, Y.; Chen, B. Analysis and evaluation of nutrient levels and organic pollution in the southern waters of Huangdao District. Adv. Fish. Sci. 2015, 36, 44–50. [Google Scholar]
- Guo, W.; Zhang, X.; Yang, Y.; Hu, M. Evaluation of the potential eutrophication level in China’s coastal waters. Taiwan Strait 1998, 1, 64–70. [Google Scholar]
- Justic, D.A. Simple oxygen index for trophic state description. Mar. Pollut. Bull. 1991, 22, 201–204. [Google Scholar] [CrossRef]
- GB 3097-1997; Water Quality Standards for Seawater. China Standards Press: Beijing, China, 1997.
- Baodong, W.; Aiping, C.; Feng, L. Study on the Redfield Ratio in the Ocean. Adv. Mar. Sci. 2003, 21, 232–235. [Google Scholar]
- Redfield, A.C. The biological control of chemical factors in the environments. Am. Sci. 1958, 46, 205–221. [Google Scholar]
- Butler, E.I. Nutrient balance in the Western Englsh Channel. Estuar. Coast. Mar. Sci. 1979, 8, 195–197. [Google Scholar] [CrossRef]
- Burkholder, J.M.; Noga, E.J.; Hobbs, C.H.; Glasgow, H.B. New phantom dinoflagellate is the causative agent of major estuarine fish kills. Nature 1992, 360, 768. [Google Scholar] [CrossRef]
- Zou, D.; Xia, J. Nutrient Metabolism of Macroalgae and its Relationship with Coastal Eutrophication. Chin. J. Ecol. 2011, 30, 589–595. [Google Scholar]
- Zhang, S.F.; Han, B.B.; Shi, R.J.; Wu, F.X.; Rao, Y.Y.; Dai, M.; Huang, H.H. Quantitative Proteomic Analysis Reveals the Key Molecular Events Driving Phaeocystis globosa Bloom and Dissipation. Int. J. Mol. Sci. 2022, 23, 12668. [Google Scholar] [CrossRef] [PubMed]
- Mo, Y.; Lan, C.; Xu, M.; Lai, J.; Ling, H. The Influence of Nitrogen and Phosphorus Nutrient Changes on the Growth of Spheroidal Brown Algae in Qinzhou Bay. Mar. Sci. 2022, 46, 30–41. [Google Scholar]
- Su, X.; Chen, B.; Ya, H.; Zhu, D.; Zhang, R.; Qin, X. Analysis of nutrient salts and phytoplankton community composition during the sphere-shaped brown algal bloom process in the waters of Weizhou Island. J. Trop. Subtrop. Bot. 2022, 30, 863–873. [Google Scholar]
- Shen, P. Taxonomic Physiological Characteristics and Sulfur Production of Harmful Red Tide Alga—Spheroid Brown Algae; Jinan University: Guangzhou, China, 2001. [Google Scholar]
- Zheng, X.; Fu, Z.; Xi, Y.; Mu, J.; Li, Y. Gray correlation analysis of the population density of Noctiluca and environmental factors in the waters near Qinhuangdao. Adv. Fish. Sci. 2014, 35, 8–15. [Google Scholar]
- Tian, D.; Song, S.; Chen, T.; Li, Z.; Liu, Y.; Liang, J.; Li, C. Population dynamics and ecological mechanisms of mass reproduction of Noctiluca in Jiaozhou Bay. J. Oceanogr. Limnol. 2017, 48, 276–284. [Google Scholar]
- Hu, C.; Jin, H.; Li, Z.; Zhu, W.; Zhou, Y. Research Progress on Bioluminescent Dinoflagellates in Red Tide. J. Zhejiang Ocean. Univ. Nat. Sci. Ed. 2015, 34, 379–386. [Google Scholar]
- Wang, N.; Zhou, Z.; Ma, Z.; Han, J.; Xue, K.; Wan, L.; Deng, H.; Wang, S. Principal component analysis of Prorocentrum minimum red tide in Dalian Bay. Fish. Sci. 2004, 7, 9–11. [Google Scholar]
- Luo, X.; Shan, Y.; Yang, J. Distribution Characteristics of Phytoplankton Communities and Their Relationship with Water Environment in the Yellow River Estuary and Adjacent Waters. J. Ocean. Univ. China Nat. Sci. Ed. 2018, 48, 16–23. [Google Scholar]
- Bricker, S.B.; Longstaff, B.; Dennison, W.; Jones, A.; Boicourt, K.; Wicks, C.; Woerner, J. Effects of nutrient enrichment in the nation’s estuaries: A decade of change. Harmful Algae 2008, 8, 21–32. [Google Scholar] [CrossRef]
- OSPAR Commission. Second Integrated Report on the Eutrophication Status of the OSPAR Maritime Area; OSPAR Commission: London, UK, 2008. [Google Scholar]


| Monitoring Parameters | Analysis Method | Detection Limit |
|---|---|---|
| pH | pH meter method | 0.02 |
| Salinity | Salinometer method | 2.000 |
| COD | Alkaline potassium permanganate titration method | 0.15 mg/L |
| DO | Iodometric method | -- |
| NH4-N | Indigo carmine spectrophotometric method | 0.005 mg/L |
| NO3-N | Naphthalene ethylenediamine spectrophotometry | 0.001 mg/L |
| NO2-N | Cadmium column reduction method | 0.003 mg/L |
| PO4-P | Molybdenum blue colorimetric method. | 0.001 mg/L |
| Chl-a | Spectrophotometric method | 1.0 µg/L |
| Item | First Class | Second Class | Third Class | Fourth Class |
|---|---|---|---|---|
| <Dissolved oxygen | 6 | 5 | 4 | 3 |
| ≥Chemical oxygen demand | 2 | 3 | 4 | 5 |
| Chemical oxygen demand ≤ (calculated by N) | 0.2 | 0.3 | 0.4 | 0.5 |
| Reactive phosphate ≤ (calculated by P) | 0.015 | 0.03 | 0.045 | |
| Water Quality Grade | Poor Eutrophication | Light Eutrophication | Moderate Eutrophication | Heavy Eutrophication | Severe Eutrophication |
|---|---|---|---|---|---|
| Eutrophication index | E < 1 | 1 ≤ E < 2.0 | 2.0 ≤ E < 5.0 | 5.0 ≤ E < 15.0 | E ≥ 15.0 |
| A | Pollution Degree Classification | Water Quality Evaluation |
|---|---|---|
| <0 | 0 | Excellent |
| 0–1 | 1 | Good |
| 1–2 | 2 | Began to be polluted |
| 2–3 | 3 | Lightly polluted |
| 3–4 | 4 | Moderate pollution |
| 4–5 | 5 | Severe pollution |
| Level | Trophic Level | DIN (mg/L) | DIP (mg/L) | N/P (Molar Ratio) |
|---|---|---|---|---|
| I | Poor nutrition | <0.2 | <0.03 | 8~30 |
| II | Moderate nutrition | 0.2~0.3 | 0.03~0.45 | 8~30 |
| III | Eutrophic | >0.3 | >0.045 | 8~30 |
| IVP | Phosphorus-limited moderate nutrient | 0.2~0.3 | — | >30 |
| VP | Phosphorus moderately limiting potentially eutrophic | >0.3 | — | 30~60 |
| VIP | Phosphorus-limited potentially eutrophic | >0.3 | — | >60 |
| IVN | Nitrogen-limited moderate nutrition | — | 0.03~0.045 | <8 |
| VN | Nitrogen moderately limiting potentially eutrophic | — | >0.045 | 4~8 |
| VIN | Nitrogen-limited potentially eutrophic | — | >0.045 | <4 |
| Time | Layer | N/P | Trophic Level | Time | Layer | N/P | Trophic Level | Time | Layer | N/P | Trophic Level |
|---|---|---|---|---|---|---|---|---|---|---|---|
| 2002 | surface | 125.0 | Phosphorus-limited moderate nutrient | 2008 | surface | 18.0 | Poor nutrition | 2014 | surface | 18.1 | Poor nutrition |
| bottom | 33.6 | Phosphorus-limited | bottom | 19.2 | Poor nutrition | bottom | 16.4 | Poor nutrition | |||
| 2003 | surface | 75.2 | Phosphorus-limited | 2009 | surface | 24.5 | Poor nutrition | 2015 | surface | 39.8 | Phosphorus-limited |
| bottom | 37.7 | Phosphorus-limited | bottom | 5.7 | Nitrogen limitation | bottom | 32.9 | Phosphorus-limited | |||
| 2004 | surface | 16.4 | Poor nutrition | 2010 | surface | 48.3 | Phosphorus-limited | 2016 | surface | 50.6 | Phosphorus-limited |
| bottom | 17.3 | Poor nutrition | bottom | 48.3 | Phosphorus-limited moderate nutrient | bottom | 29.8 | Poor nutrition | |||
| 2005 | surface | 94.9 | Phosphorus-limited | 2011 | surface | 47.3 | Phosphorus-limited | 2017 | surface | 97.4 | Phosphorus-limited |
| bottom | 10.5 | Poor nutrition | bottom | 46.7 | Phosphorus-limited | bottom | 32.5 | Phosphorus-limited | |||
| 2006 | surface | 65.0 | Phosphorus-limited | 2012 | surface | 19.2 | Poor nutrition | 2018 | surface | 62.6 | Phosphorus-limited |
| bottom | 36.5 | Phosphorus-limited | bottom | 16.3 | Poor nutrition | bottom | 33.7 | Phosphorus-limited | |||
| 2007 | surface | 12.9 | Poor nutrition | 2013 | surface | 41.8 | Phosphorus-limited | ||||
| bottom | 6.3 | Nitrogen limitation | bottom | 44.6 | Phosphorus-limited |
Disclaimer/Publisher’s Note: The statements, opinions and data contained in all publications are solely those of the individual author(s) and contributor(s) and not of MDPI and/or the editor(s). MDPI and/or the editor(s) disclaim responsibility for any injury to people or property resulting from any ideas, methods, instructions or products referred to in the content. |
© 2023 by the authors. Licensee MDPI, Basel, Switzerland. This article is an open access article distributed under the terms and conditions of the Creative Commons Attribution (CC BY) license (https://creativecommons.org/licenses/by/4.0/).
Share and Cite
Wang, H.; Wan, X.; Wang, S.; Xia, L.; Song, Y. Assessment of Eutrophication Characteristics and Evaluation of the First-Generation Eutrophication Model in the Nearshore Waters of Shantou City. Sustainability 2023, 15, 14866. https://doi.org/10.3390/su152014866
Wang H, Wan X, Wang S, Xia L, Song Y. Assessment of Eutrophication Characteristics and Evaluation of the First-Generation Eutrophication Model in the Nearshore Waters of Shantou City. Sustainability. 2023; 15(20):14866. https://doi.org/10.3390/su152014866
Chicago/Turabian StyleWang, Hongbing, Xiaoming Wan, Si Wang, Lu Xia, and Yanwei Song. 2023. "Assessment of Eutrophication Characteristics and Evaluation of the First-Generation Eutrophication Model in the Nearshore Waters of Shantou City" Sustainability 15, no. 20: 14866. https://doi.org/10.3390/su152014866
APA StyleWang, H., Wan, X., Wang, S., Xia, L., & Song, Y. (2023). Assessment of Eutrophication Characteristics and Evaluation of the First-Generation Eutrophication Model in the Nearshore Waters of Shantou City. Sustainability, 15(20), 14866. https://doi.org/10.3390/su152014866