
Analysis of the Temporal and Spatial Pattern and Convergence Characteristics of High-Quality Sustainable Economic Development of Urban Agglomeration


Abstract
:1. Introduction
2. Methods and Data
2.1. Indexes System and Data Sources
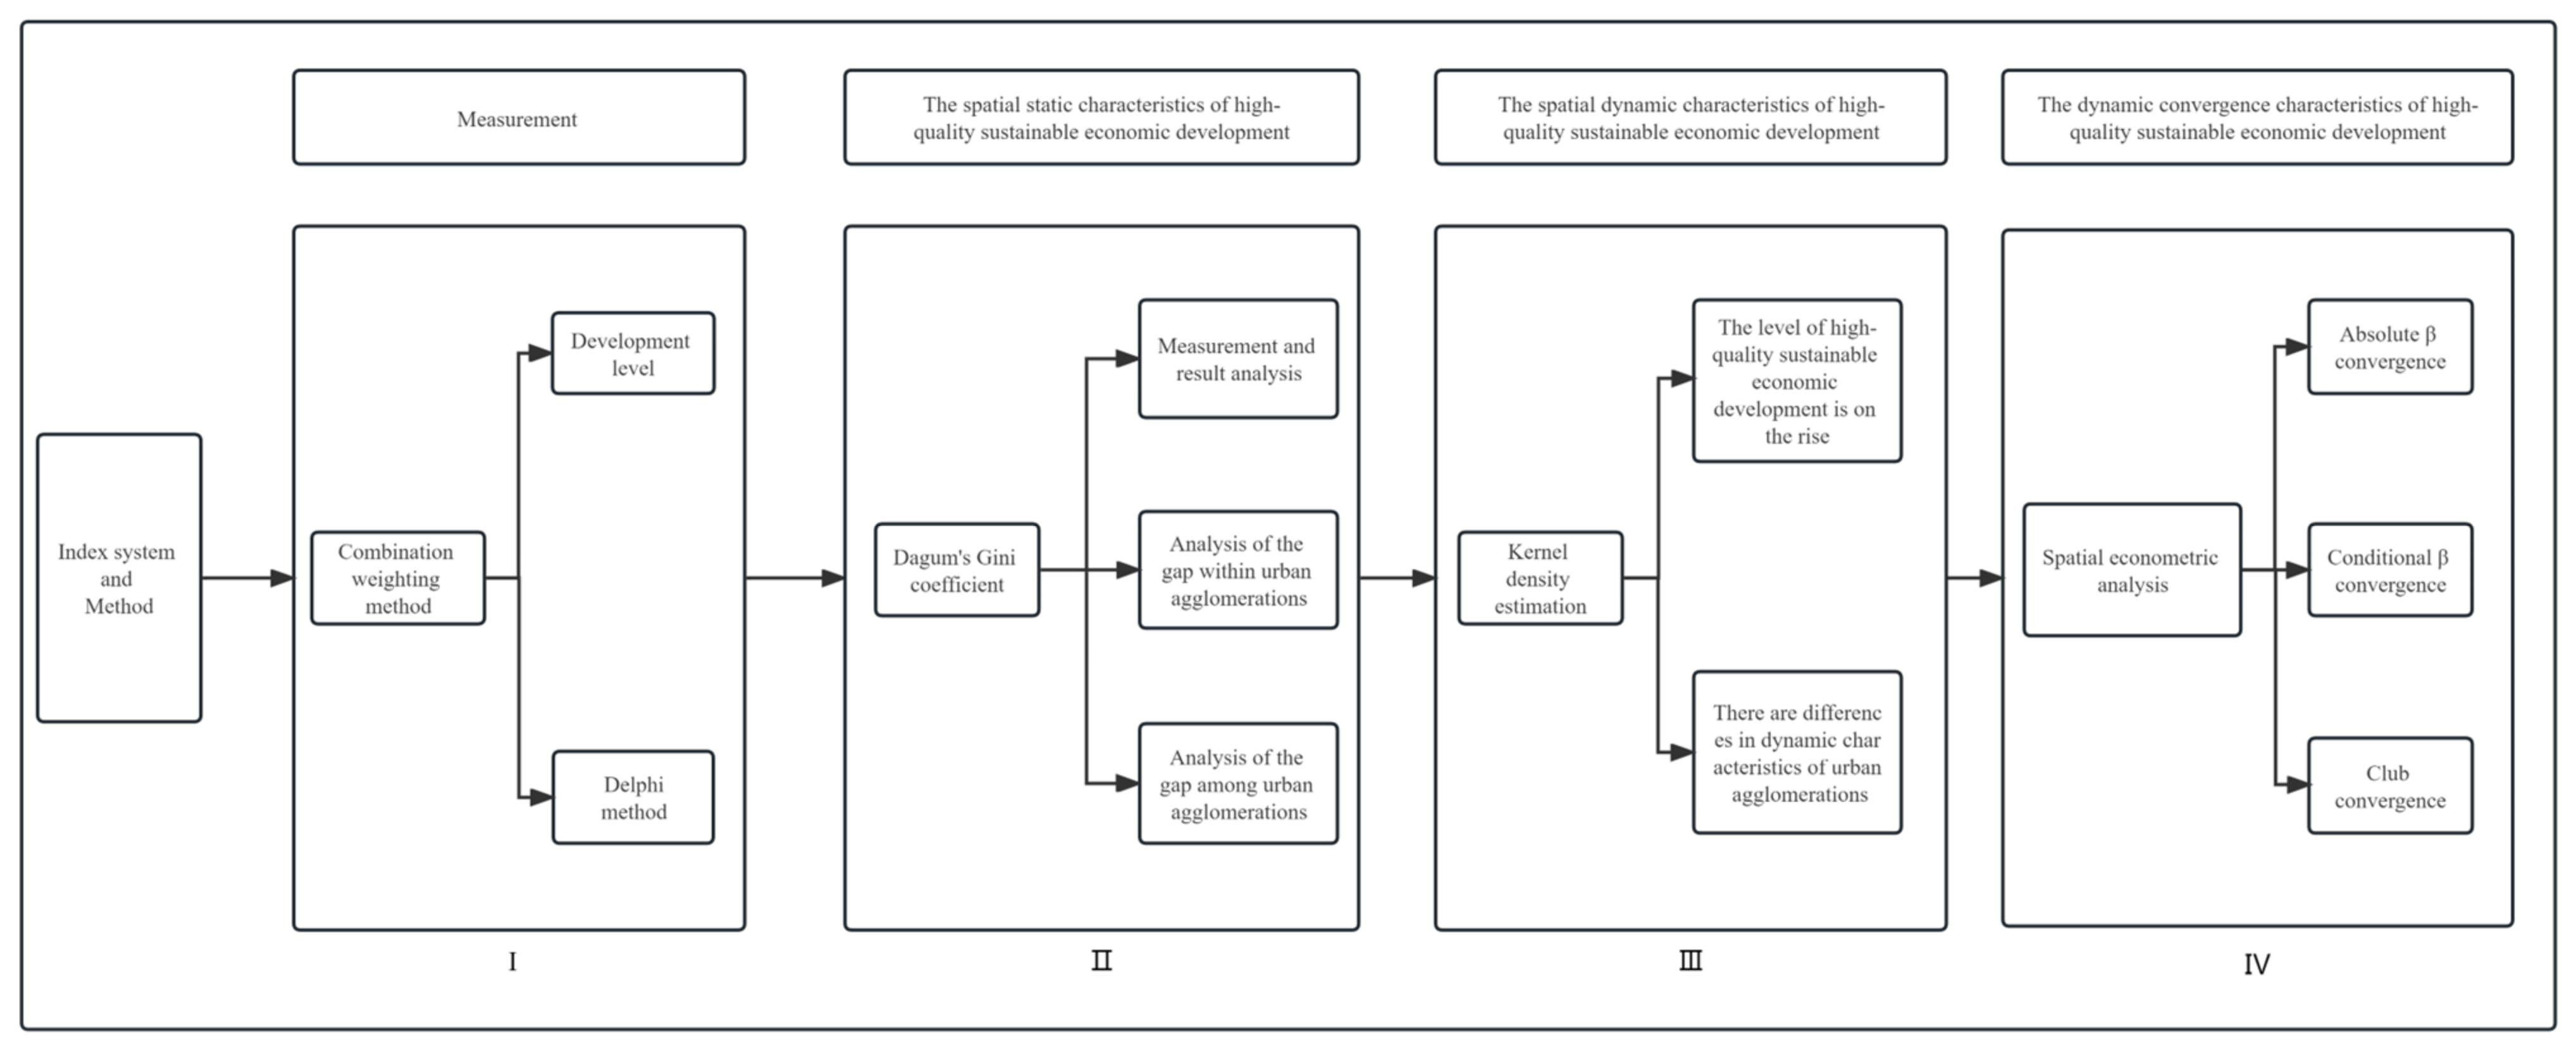
2.2. Research Methods
2.2.1. Combination Weighting Method
2.2.2. Dagum’s Gini Coefficient
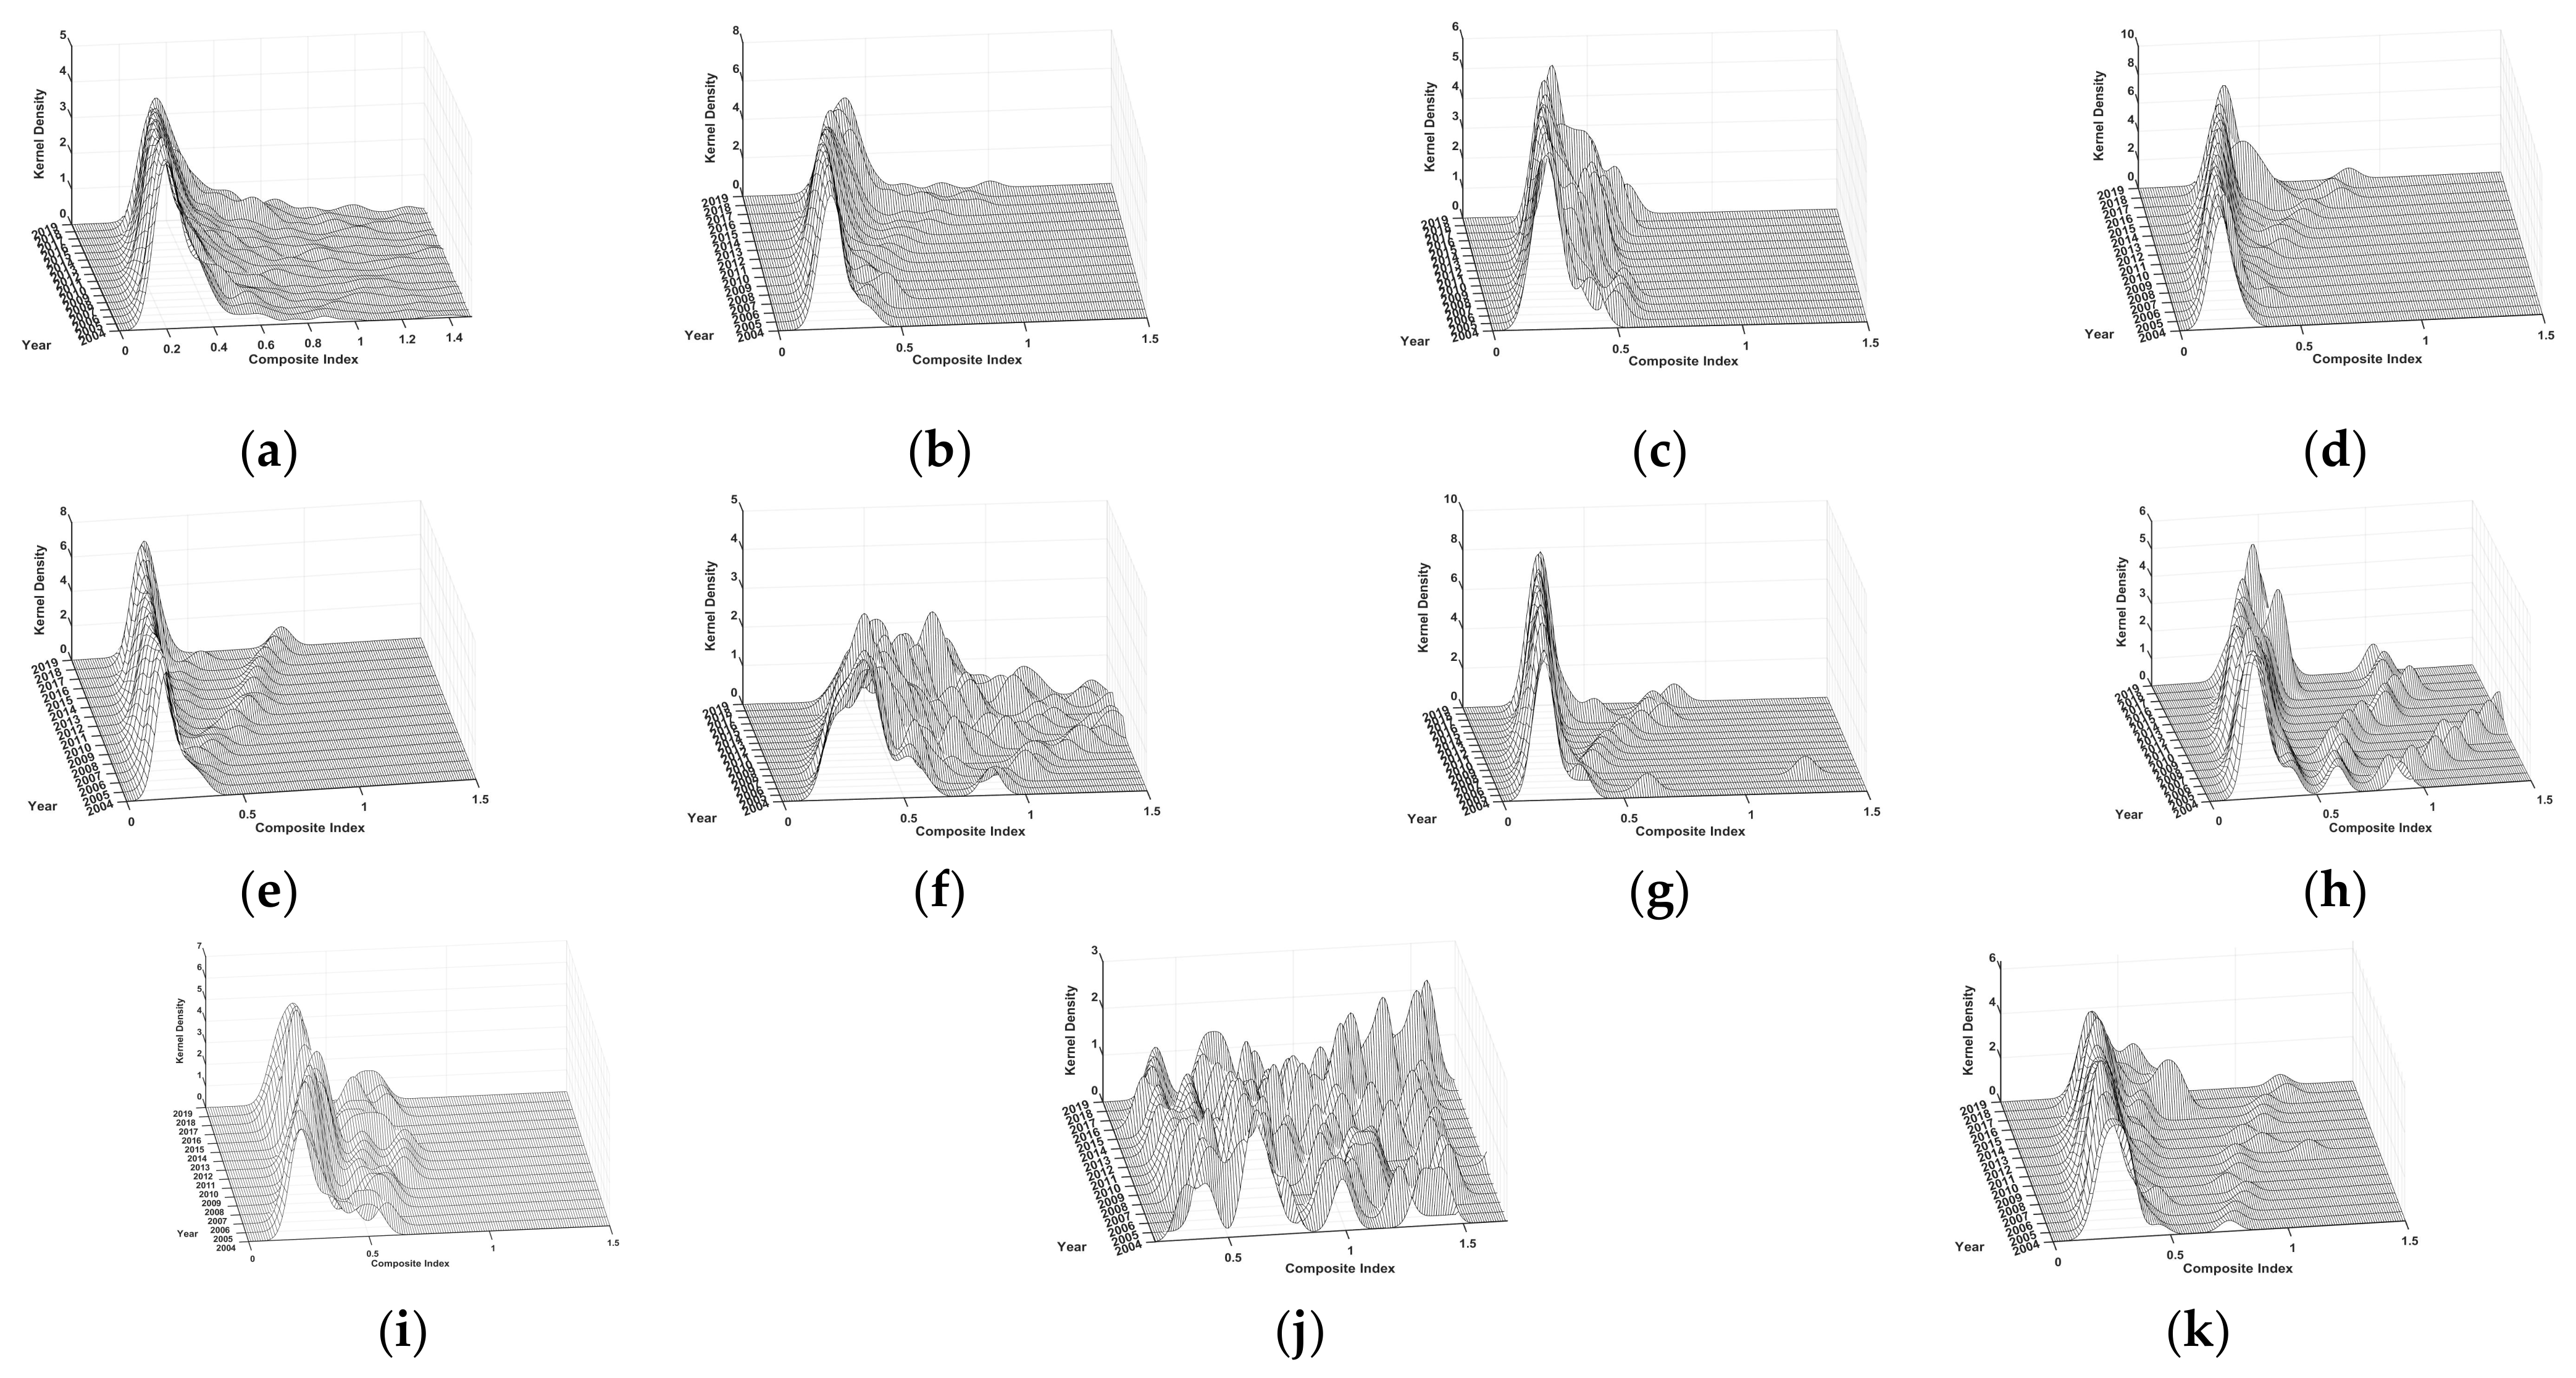
2.2.3. Kernel Density Estimation
2.2.4. Spatial Econometric Model
3. Analysis of Dynamic Convergence Characteristics of High-Quality, Sustainable Economic Development of Urban Agglomerations
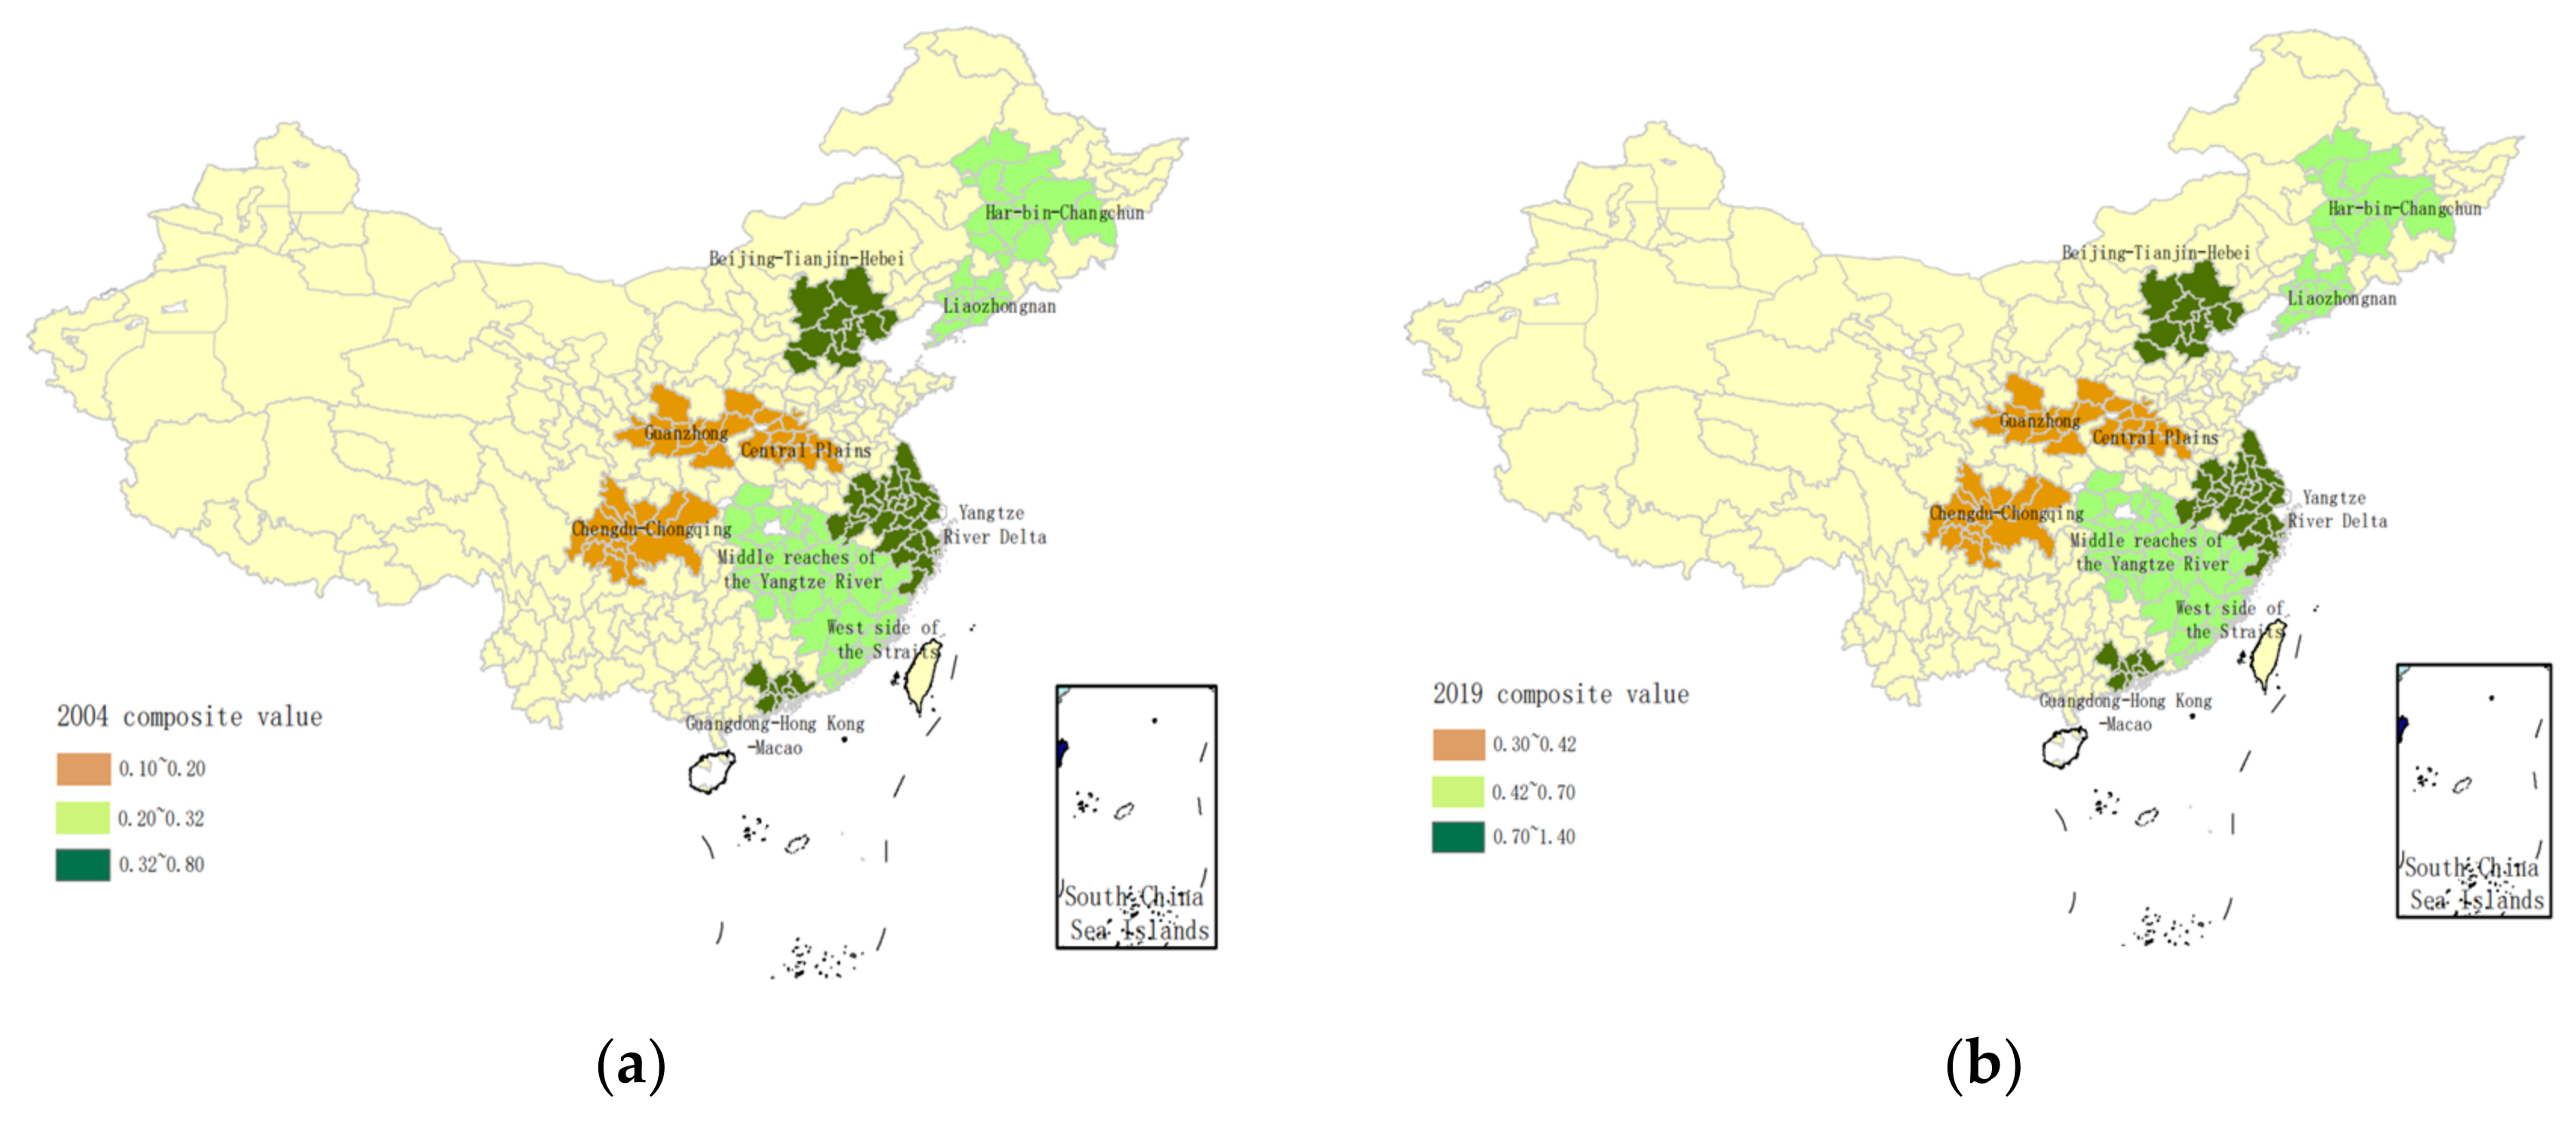
3.1. Measurement and Result Analysis of High-Quality, Sustainable Economic Development Level of Urban Agglomerations
3.2. Spatial Gap Analysis of High-Quality, Sustainable Economic Development Level of Urban Agglomerations
3.2.1. Analysis of the Gap in High-Quality, Sustainable Economic Development within Urban Agglomerations
3.2.2. Analysis of the Gap in High-Quality Sustainable Economic Development within Urban Agglomerations
3.2.3. Source of the Gap in the High-Quality Sustainable Economic Development of Urban Agglomerations
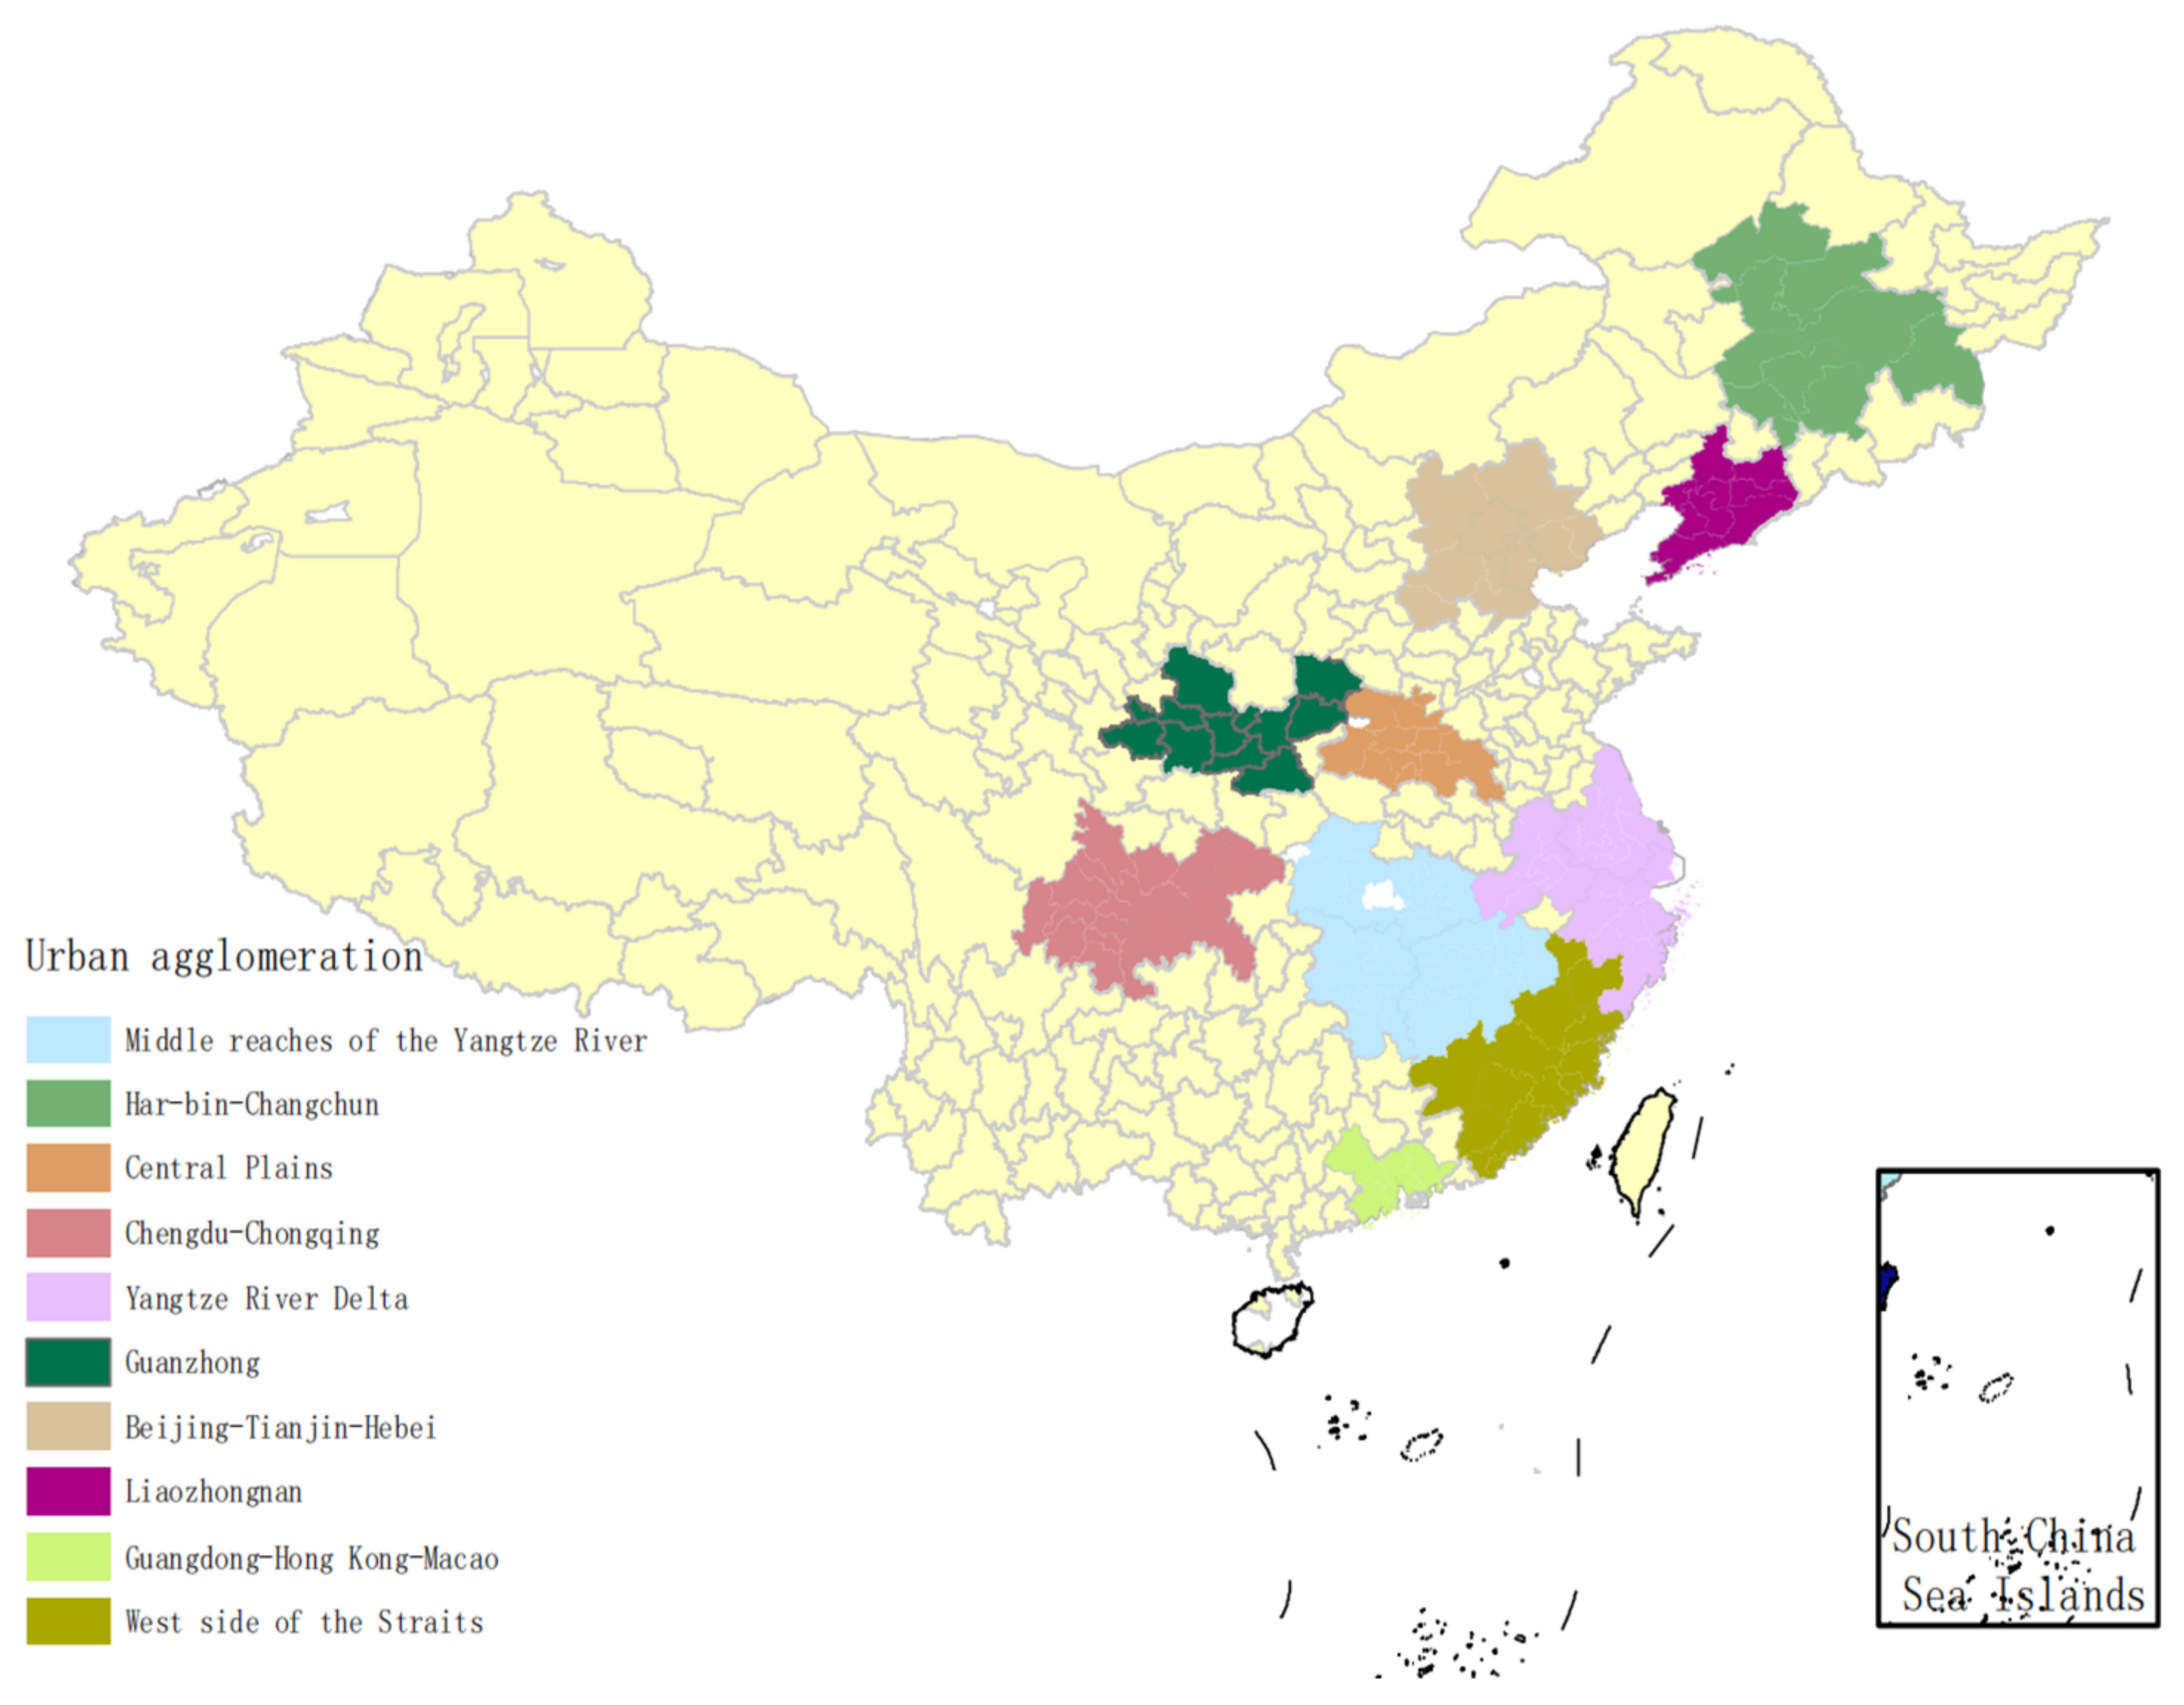
3.3. Indexes System and Data Sources
4. Analysis of Dynamic Convergence Characteristics of High-Quality Sustainable Economic Development of Urban Agglomerations
4.1. Analysis of Dynamic Convergence Characteristics of High-Quality Sustainable Economic Development among Individuals within Urban Agglomerations
4.1.1. Absolute β Convergence Analysis
4.1.2. Conditional Convergence Analysis
- Degree of government intervention (Govern).
- 2.
- Financial development level (Finance).
- 3.
- Urbanization level (Urban).
- 4.
- Human capital level (Human).
4.2. Analysis of Dynamic Convergence Characteristics of High-Quality Sustainable Economic Development among Urban Agglomerations
5. Conclusions and Policy Recommendations
Main Results
- (1)
- Build a differentiated urban agglomeration collaborative linkage mechanism, exert the radiation-driving effect within and between urban agglomerations, and continuously narrow the spatial gap between urban agglomerations.
- (2)
- Accurately implement the measures to promote high-quality economic development, accelerate the formation of a dynamic and coordinated development pattern of urban agglomerations, and promote the high-quality development of the overall economy of urban agglomerations.
Author Contributions
Funding
Institutional Review Board Statement
Informed Consent Statement
Data Availability Statement
Conflicts of Interest
Appendix A

| Time | Total | Middle Yangtze River | Harbin–Changchun | Central Plains | Chengdu–Chongqing | Yangtze River Delta | Guanzhong | Beijing–Tianjin–Hebei | South and Central Liaoning | Guangdong–Hong Kong–Macao | West Side of the Strait |
|---|---|---|---|---|---|---|---|---|---|---|---|
| 2004 | 0.3163 | 0.2352 | 0.2497 | 0.1795 | 0.1953 | 0.3768 | 0.1962 | 0.3442 | 0.3063 | 0.7829 | 0.2968 |
| 2005 | 0.3206 | 0.2386 | 0.2686 | 0.1826 | 0.1959 | 0.3876 | 0.2437 | 0.3481 | 0.3080 | 0.7253 | 0.3072 |
| 2006 | 0.3235 | 0.2454 | 0.2785 | 0.1921 | 0.2013 | 0.3989 | 0.2173 | 0.3625 | 0.3057 | 0.7343 | 0.2995 |
| 2007 | 0.3647 | 0.2818 | 0.2935 | 0.2359 | 0.2148 | 0.4622 | 0.2907 | 0.3960 | 0.3402 | 0.8031 | 0.3290 |
| 2008 | 0.3531 | 0.2657 | 0.3028 | 0.2281 | 0.2255 | 0.4071 | 0.2209 | 0.4249 | 0.3579 | 0.7887 | 0.3095 |
| 2009 | 0.3575 | 0.2682 | 0.2923 | 0.2289 | 0.2323 | 0.4816 | 0.2295 | 0.4224 | 0.3702 | 0.7281 | 0.3216 |
| 2010 | 0.3901 | 0.2779 | 0.3097 | 0.2392 | 0.2479 | 0.5342 | 0.2372 | 0.4503 | 0.3980 | 0.8674 | 0.3393 |
| 2011 | 0.4072 | 0.2916 | 0.3235 | 0.2616 | 0.2631 | 0.5679 | 0.2461 | 0.4660 | 0.4129 | 0.8899 | 0.3492 |
| 2012 | 0.4283 | 0.2993 | 0.3457 | 0.2803 | 0.2871 | 0.6099 | 0.2627 | 0.4887 | 0.4239 | 0.8780 | 0.4076 |
| 2013 | 0.4557 | 0.3178 | 0.3553 | 0.3125 | 0.3000 | 0.6525 | 0.2728 | 0.5318 | 0.4424 | 0.9840 | 0.3876 |
| 2014 | 0.4498 | 0.3333 | 0.3519 | 0.3092 | 0.3129 | 0.5969 | 0.2885 | 0.5438 | 0.4447 | 0.9346 | 0.3823 |
| 2015 | 0.4743 | 0.3543 | 0.3638 | 0.3272 | 0.3260 | 0.6464 | 0.3061 | 0.5837 | 0.3845 | 1.0350 | 0.4157 |
| 2016 | 0.4955 | 0.3753 | 0.3810 | 0.3388 | 0.3331 | 0.6597 | 0.3354 | 0.6212 | 0.4019 | 1.0760 | 0.4331 |
| 2017 | 0.6080 | 0.4880 | 0.4551 | 0.4541 | 0.3682 | 0.8562 | 0.3735 | 0.6882 | 0.4443 | 1.3988 | 0.5538 |
| 2018 | 0.5643 | 0.4245 | 0.3993 | 0.3898 | 0.3730 | 0.7651 | 0.3396 | 0.6804 | 0.4154 | 1.3728 | 0.4835 |
| 2019 | 0.5848 | 0.4542 | 0.4396 | 0.4048 | 0.3926 | 0.7983 | 0.3682 | 0.7054 | 0.4248 | 1.3509 | 0.5094 |
| Mean Value | 0.4308 | 0.3219 | 0.3381 | 0.2853 | 0.2793 | 0.5751 | 0.2768 | 0.5036 | 0.3863 | 0.9594 | 0.3828 |
| Growth Rate | 0.0462 | 0.0486 | 0.0406 | 0.0609 | 0.0480 | 0.0566 | 0.0513 | 0.0496 | 0.0239 | 0.0416 | 0.0408 |
References
- Chen, Y.; Tian, W.T.; Ma, W.B. Research on urban agglomerations at abroad: Tracks, hotspots and trends—Visual literature analysis based on CiteSpace V. Front. Sci. Technol. Eng. Manag. 2020, 39, 89–96. [Google Scholar]
- Fang, C.; Yang, J.; Fang, J.; Huang, X.; Zhou, Y. Optimization transmission theory and technical pathways that describe multiscale urban agglomeration spaces. Chin. Geogr. Sci. 2018, 28, 543–554. [Google Scholar] [CrossRef]
- Li, Y.; Wu, F.L. Understanding city-regionalism in China: Regional cooperation in the Yangtze River Delta. Reg. Stud. 2018, 52, 313–324. [Google Scholar] [CrossRef]
- Olfert, M.R.; Partridge, M. Creating the cultural community: Ethnic diversity vs. agglomeration. Spat. Econ. Anal. 2011, 6, 25–55. [Google Scholar] [CrossRef]
- Salvati, L.; Ferrara, A.; Chelli, F. Long-term growth and metropolitan spatial structures: An analysis of factors influencing urban patch size under different economic cycles. Geogr. Tidsskr.-Dan. J. Geogr. 2018, 118, 56–71. [Google Scholar] [CrossRef]
- Nakamura, R. Agglomeration economies in urban manufacturing-industries: A case of Japanese cities. J. Urban Econ. 1985, 17, 108–124. [Google Scholar] [CrossRef]
- Tabuchi, T. Urban agglomeration and dispersion: A synthesis of Alonso and Krugman. J. Urban Econ. 1998, 44, 333–351. [Google Scholar] [CrossRef]
- Peng, D.; Li, R.; Shen, C.; Wong, Z. Industrial agglomeration, urban characteristics, and economic growth quality: The case of knowledge-intensive business services. Int. Rev. Econ. Financ. 2022, 81, 18–28. [Google Scholar] [CrossRef]
- Brenner, N. Globalisation as reterritorialisation: There-scaling of urban governance in the European Union. Urban Stud. 1999, 36, 431–451. [Google Scholar] [CrossRef]
- Storper, M.; Scott, A.J. Rethinking human capital, creativity and urban growth. J. Econ. Geogr. 2008, 9, 147–167. [Google Scholar] [CrossRef]
- Partridge, M.D.; Rickman, D.S.; Ali, K.; Olfert, M.R. Lost in space: Population growth in the American hinterlands and small cities. J. Econ. Geogr. 2008, 8, 727–757. [Google Scholar] [CrossRef]
- Grivas, G.; Chaloulakou, A.; Kassomenos, P. An overview of the PM10 pollution problem, in the Metropolitan Area of Athens, Greece. Assessment of controlling factors and potential impact of long range transport. Sci. Total Environ. 2008, 389, 165–177. [Google Scholar] [CrossRef] [PubMed]
- Wei, H.K.; Nian, M.; Li, L. China’s regional development strategy and policy during the 14th five-year plan period. China Ind. Econ. 2020, 18, 5–22. [Google Scholar] [CrossRef]
- Zhao, Q.; Shen, K.R. A study on promoting the high-quality development of regional economy by urban agglomeration. Econ. Rev. J. 2018, 9, 92–98. [Google Scholar]
- Lin, Y.; Li, J.; Yue, X. Research on the integration and high-quality development of central plains urban agglomeration. Front. Econ. Manag. 2020, 1, 138–142. [Google Scholar]
- Lin, J.Z.; Kim, H.H. Research on the development efficiency of tourism in the Non-Pearl River Delta of Guangdong. Int. J. Adv. Cult. Technol. 2021, 9, 34–45. [Google Scholar]
- Yan, T.; Zhang, X.P.; Chen, H.; Li, R.K. Evolution of regional differences in urban economic development in China from 2001 to 2016. Econ. Geogr. 2019, 39, 11–20. [Google Scholar]
- Frame, B.; Cavanagh, J. Experiences of sustainability assessment: An awkward adolescence. Account. Forum 2008, 33, 3. [Google Scholar] [CrossRef]
- Yan, B.R.; Yao, B.; Zhang, C.J. Industrial structure, high-quality development of logistics industry and the economy. PLoS ONE 2023, 18, e0285229. [Google Scholar] [CrossRef]
- Chen, Y.; Xi, M.; Liao, K.; Wang, F. The relationship between economic growth and the development of industrial cluster and city group. Int. J. Technol. Policy Manag. 2018, 18, 155–163. [Google Scholar] [CrossRef]
- Feng, C.C.; Zeng, Z.R.; Cui, N.N. The temporal and spatial evolution of China’s regional economic disparity since 2000. Geogr. Res. 2015, 34, 234–246. [Google Scholar]
- Dokic, I.; Frohlich, Z.; Bakaric, I.R. The impact of the economic crisis on regional disparities in Croatia. Camb. J. Reg. Econ. Soc. 2016, 9, 179–195. [Google Scholar] [CrossRef]
- Xiao, D.; Yu, F. Measurement and comparison of high-quality economic development of China’s urban agglomerations. J. Macro-Qual. Res. 2021, 9, 86–98. [Google Scholar]
- Tan, F.F.; Wang, F.Y.; Niu, Z.Y. Multiscale disparity and spatial pattern of comprehensive carrying capacity in the Yangtze River Economic Belt, China. Ecol. Indic. 2023, 148, 110119. [Google Scholar] [CrossRef]
- Chen, J.H.; Chen, Y.; Chen, M.M. China’s high-quality economic development level, regional differences and dynamic evolution of distribution. J. Quant. Technol. Econ. 2020, 37, 108–126. [Google Scholar]
- Friedman, J. Regional Development Planning: A Reader; Cambridge Mass Press: London, UK, 1963; pp. 321–322. [Google Scholar]
- Zhang, J.K.; Hou, Y.Z.; Liu, P.L.; He, J.W.; Zhuo, X. The goals and strategy path of high-quality development. J. Manag. World 2019, 35, 1–7. [Google Scholar]
- Shi, X.H.; Chen, X.; Han, L.; Zhou, Z.J. The mechanism and test of the impact of environmental regulation and technological innovation on high quality development. J. Comb. Optim. 2023, 45, 52. [Google Scholar] [CrossRef]
- Fang, C.L. Important progress and prospects of China’s urbanization and urban agglomeration in the past 40 years of reform and opening-up. Econ. Geogr. 2018, 38, 1–9. [Google Scholar]
- Ding, R.Z.; Xu, B.Y.; Zhang, H. Can urban agglomeration drive regional economic growth? Empirical analysis based on seven state-level urban agglomerations. Econ. Geogr. 2021, 41, 37–45. [Google Scholar]
- Huang, J.C.; Chen, S.Q. Classification of China’s urban agglomerations. Prog. Geogr. 2015, 34, 290–301. [Google Scholar]
- Pan, Y.R.; Luo, L.W. The impact of infrastructure investment on high-quality economic development: Mechanism and heterogeneity research. Reform 2020, 6, 100–113. [Google Scholar]
- Wei, M.; Li, S.H. Study on the measurement of economic high quality development level in China in the new era. J. Quant. Technol. 2018, 35, 3–20. [Google Scholar]
- Yang, L.; Sun, Z.C. The Development of Western New-type Urbanization Level Evaluation Based on Entropy Method. Econ. Probl. 2015, 5, 115–119. [Google Scholar]
- Dagum, C. A new approach to the decomposition of the Gini income inequality ratio. Empir. Econ. 1997, 22, 515–531. [Google Scholar] [CrossRef]
- Gao, P.; Du, C.; Liu, X.; Yuan, F.; Tang, D. The construction of a modern economic system in the context of high-quality development: A new framework. Econ. Res. J. 2019, 54, 4–17. [Google Scholar]
- Joo, H.Y.; Seo, Y.W.; Min, H. Examining the effects of government intervention on the firm’s environmental and technological innovation capabilities and export performance. Int. J. Prod. Res. 2018, 56, 6090–6111. [Google Scholar] [CrossRef]
- Lin, Y.F.; Fu, C.H.; Ren, X.M. How Financial Innovation Promotes High Quality Development: A Perspective of New Structural Economics. Financ. Forum 2019, 24, 3–13. [Google Scholar]
- Lu, J.; Mao, W.F. The Rise of Urban Network Externalities: A New Mechanism for the High-quality Integrated Development of Regional Economy. Economist 2020, 12, 62–70. [Google Scholar]
- Fallah, B.N.; Partridge, M.D.; Olfert, M.R. Urban sprawl and productivity: Evidence from U.S. metropolitan areas. Pap. Reg. Sci. 2011, 90, 451–472. [Google Scholar] [CrossRef]
- Wu, T.; Yi, M. Talents resource matching, technical efficiency and Chinas high-quality economic development. Stud. Sci. Sci. 2019, 37, 1955–1963. [Google Scholar]


| First-Grade Index | Second-Grade Index | Third-Grade Index | Unit | Weight | Index Direction |
|---|---|---|---|---|---|
| Innovative Development | Innovation Input | Research Funding Intensity | % | 0.0499 | + |
| Researcher Input Intensity | Per | 0.0351 | + | ||
| Innovation Output | Grant Number | Ind | 0.1149 | + | |
| Coordinated Development | Industrial Development Coordination | Rationalization of Industrial Structure | % | 0.0369 | - |
| Optimization of Industrial Structure | % | 0.0855 | + | ||
| Proportion of Producer Services | % | 0.0776 | + | ||
| Green Development | Green Lifestyle | Urban Green Coverage Rate | % | 0.0460 | + |
| Innocuous Disposal Rate of Domestic Garbage | % | 0.0441 | + | ||
| Energy Consumption | Energy Consumption Per Unit of GDP | M3/Million CNY | 0.0324 | - | |
| Electricity Consumption Per Unit of GDP | KWH/Million CNY | 0.0326 | - | ||
| Environmental Governance | Comprehensive Utilization Rate of General Industrial Solid Waste | % | 0.0449 | + | |
| Open Development | Foreign Trade | Proportion of Total Export–Import to GDP | % | 0.1294 | + |
| Foreign Capital Use | FDI | % | 0.0706 | + | |
| Sharing Development | Economic Sharing | Per Capita GDP | CNY/PP | 0.0413 | + |
| Public Service Expenditure Per CAPITA | CNY/PP | 0.0564 | + | ||
| Social Sharing | Number of Hospital Beds Per Capita | Ind/Million People | 0.0257 | + | |
| Educational Fund | Million CNY | 0.0766 | + |
| Time | Total | Middle Yangtze River | Harbin–Changchun | Central Plains | Chengdu–Chongqing | Yangtze River Delta | Guanzhong | Beijing–Tianjin–Hebei | South and Central Liaoning | Guangdong–Hong Kong–Macao | West Side of the Strait | |
|---|---|---|---|---|---|---|---|---|---|---|---|---|
| 2004 | 0.0219 | 0.1183 | 0.1647 | 0.1001 | 0.1313 | 0.2301 | 0.1401 | 0.2985 | 0.2009 | 0.2544 | 0.1784 | |
| 2005 | 0.0214 | 0.1178 | 0.1702 | 0.1004 | 0.1300 | 0.2223 | 0.2310 | 0.2900 | 0.2042 | 0.1997 | 0.1730 | |
| 2006 | 0.0206 | 0.1156 | 0.1788 | 0.0932 | 0.1407 | 0.1965 | 0.1503 | 0.3134 | 0.1949 | 0.2148 | 0.1843 | |
| 2007 | 0.0238 | 0.1625 | 0.1825 | 0.1127 | 0.1516 | 0.2151 | 0.3403 | 0.3229 | 0.1882 | 0.2234 | 0.1891 | |
| 2008 | 0.0207 | 0.1287 | 0.1765 | 0.1121 | 0.1697 | 0.1935 | 0.1009 | 0.3123 | 0.1731 | 0.2428 | 0.1760 | |
| 2009 | 0.0210 | 0.1180 | 0.1209 | 0.1102 | 0.1818 | 0.2119 | 0.1107 | 0.2919 | 0.1550 | 0.2122 | 0.1595 | |
| 2010 | 0.0229 | 0.1314 | 0.1391 | 0.1104 | 0.2008 | 0.2207 | 0.1289 | 0.3165 | 0.1638 | 0.2728 | 0.1720 | |
| 2011 | 0.0240 | 0.1436 | 0.1439 | 0.1106 | 0.1992 | 0.2328 | 0.1354 | 0.3338 | 0.1704 | 0.2809 | 0.1709 | |
| 2012 | 0.0247 | 0.1286 | 0.1558 | 0.1171 | 0.2068 | 0.2324 | 0.1209 | 0.3350 | 0.1665 | 0.2641 | 0.2333 | |
| 2013 | 0.0240 | 0.1303 | 0.1513 | 0.1452 | 0.2152 | 0.2278 | 0.1380 | 0.3438 | 0.1515 | 0.2800 | 0.1794 | |
| 2014 | 0.0218 | 0.1321 | 0.1392 | 0.1211 | 0.2139 | 0.2015 | 0.1275 | 0.3330 | 0.1557 | 0.2510 | 0.1581 | |
| 2015 | 0.0224 | 0.1373 | 0.1414 | 0.1264 | 0.2069 | 0.2039 | 0.1419 | 0.3291 | 0.1344 | 0.2677 | 0.1668 | |
| 2016 | 0.0223 | 0.1300 | 0.1392 | 0.1321 | 0.2068 | 0.2032 | 0.1635 | 0.3283 | 0.1440 | 0.2819 | 0.1687 | |
| 2017 | 0.0239 | 0.1701 | 0.1135 | 0.1357 | 0.1962 | 0.2106 | 0.1712 | 0.2884 | 0.1877 | 0.2705 | 0.1781 | |
| 2018 | 0.0238 | 0.1442 | 0.1371 | 0.1615 | 0.2194 | 0.2132 | 0.1431 | 0.3046 | 0.1692 | 0.2927 | 0.1870 | |
| 2019 | 0.0233 | 0.1455 | 0.1226 | 0.1375 | 0.1986 | 0.2158 | 0.1519 | 0.3081 | 0.1699 | 0.2808 | 0.1719 | |
| Mean Value | 0.0226 | 0.1346 | 0.1485 | 0.1204 | 0.1856 | 0.2145 | 0.1560 | 0.3156 | 0.1706 | 0.2556 | 0.1779 | |
| 0.1879 | ||||||||||||
| Growth Rate | 0.64% | 2.48% | −1.11% | 2.75% | 2.99% | −0.21% | 8.93% | 0.36% | −0.62% | 1.30% | 0.51% | |
| Region | (1) | (2) | (3) | (4) | (5) | (6) | (7) | (8) | (9) | (10) |
|---|---|---|---|---|---|---|---|---|---|---|
| Model | Nt-OLS | Nt-OLS | Nt-OLS | Nt-OLS | Nt-OLS | Nt-OLS | N-SDM | N-OLS | N-OLS | Nt-OLS |
| −0.622 *** (−13.98) | −0.230 *** (−4.354) | −0.732 *** (−10.890) | −0.319 *** (−7.656) | −0.580 *** (−12.824) | −0.940 *** (−12.487) | −0.303 *** (−4.844) | −0.280 *** (−5.532) | −0.235 *** (−3.645) | −0.628 *** (−12.077) | |
| 0.307 *** (4.721) | ||||||||||
| λ | 0.494 *** (5.515) | |||||||||
| 0.318 | 0.113 | 0.379 | 0.197 | 0.289 | 0.487 | 0.292 | 0.186 | 0.090 | 0.328 | |
| 0.05 [0.823] | 6.958 *** [0.008] | 7.235 *** [0.007] | 3.291 * [0.070] | 0.009 [0.925] | 3.717 * [0.054] | 35.400 *** [0.000] | 9.910 *** [0.002] | 7.061 *** [0.008] | 0.474 [0.491] | |
| 0.084 [0.772] | 0.229 [0.632] | 0.001 [0.975] | 0.051 [0.822] | 0.000 [0.998] | 0.236 [0.627] | 14.975 *** [0.000] | 15.496 *** [0.000] | 21.821 *** [0.000] | 11.465 *** [0.001] | |
| 0.015 [0.902] | 6.765 *** [0.009] | 7.722 *** [0.005] | 3.432 * [0.064] | 0.009 [0.923] | 5.528 ** [0.019] | 38.213 *** [0.000] | 26.049 *** [0.000] | 18.505 *** [0.000] | 0.426 [0.514] | |
| 0.084 [0.772] | 0.037 [0.847] | 0.488 [0.485] | 0.192 [0.661] | 0.001 [0.980] | 2.047 [0.152] | 17.789 *** [0.000] | 31.636 *** [0.000] | 33.265 *** [0.000] | 11.417 *** [0.001] | |
| 0.126 [0.723] | 2.113 [0.146] | 0.868 [0.352] | 3.417 * [0.065] | 3.458 * [0.063] | 0.433 [0.510] | 0.929 [0.335] | ||||
| - | 0.075 [0.784] | 0.424 [0.515] | 0.374 [0.541] | 1.992 [0.158] | 4.268 ** [0.039] | 0.760 [0.383] | 0.513 [0.474] | |||
| −0.187 [1.000] | −0.319 [1.000] | 0.207 [0.649] | −0.653 [1.000] | 6.195 ** [0.013] | 0.473 [0.492] | −0.344 [1.000] | ||||
| - | 0.001 [0.974] | 0.019 [0.892] | 0.247 [0.619] | 0.619 [0.432] | 5.929 ** [0.015] | 1.599 [0.206] | 0.094 [0.760] |
| Region | (1) | (2) | (3) | (4) | (5) | (6) | (7) | (8) | (7) | (10) |
|---|---|---|---|---|---|---|---|---|---|---|
| Model | Nt-OLS | Nt-OLS | Nt-OLS | Nt-OLS | Nt-OLS | Nt-OLS | N-SDM | N-OLS | N-SAR | Nt-OLS |
| −0.565 *** (−12.339) | −0.223 *** (−4.159) | −0.693 *** (−9.993) | −0.337 *** (−7.356) | −0.483 *** (−9.382) | −0.782 *** (−8.626) | −0.340 *** (−5.156) | −0.304 *** (−4.054) | −0.331 *** (−4.060) | −0.692 *** (−11.985) | |
| Govern | −0.028 (−1.474) | −0.005 (−0.899) | −0.009 * (−1.949) | −0.002 (−0.244) | −0.011 (−0.847) | −0.004 (−0.282) | 0.037 * (1.935) | −0.008 (−0.220) | 0.140 (1.282) | −0.103 * (−1.666) |
| Finance | 0.135 (0.695) | −0.008 (−0.109) | −0.040 *** (−2.854) | −0.173 (−1.612) | −0.148 * (−1.870) | −0.087 * (−1.907) | −0.340 ** (−2.845) | −0.131 (−0.858) | −0.637 (−1.061) | 0.033 * (1.858) |
| Urban | 0.002 (0.202) | −0.007 (−0.238) | 0.010 (0.684) | 0.014 (1.587) | −0.002 (−0.309) | 0.030 (0.632) | −0.011 (−0.853) | 0.029 * (1.695) | 0.024 (0.620) | −0.003 ** (−2.567) |
| Human | −0.067 (−1.220) | −0.035 (−0.275) | 0.070 (0.962) | −0.037 (−0.447) | −0.062 (−1.050) | 0.021 (−0.0477) | −0.031 (−0.303) | 0.480 * (1.800) | 0.207 ** (2.057) | −0.003 (−0.384) |
| 0.234 ** (2.259) | ||||||||||
| control variable | Yes | |||||||||
| Λ | 0.287 ** (2.398) | 0.282 ** (2.462) | ||||||||
| 0.347 | 0.131 | 0.433 | 0.228 | 0.316 | 0.527 | 0.382 | 0.261 | 0.202 | 0.353 | |
| 0.001 [0.986] | 6.711 ** [0.010] | 7.500 *** [0.006] | 3.482 * [0.062] | 0.048 [0.827] | 2.881 * [0.090] | 18.765 *** [0.000] | 12.583 *** [0.000] | 5.164 ** [0.023] | 0.353 [0.552] | |
| 0.717 [0.397] | 0.093 [0.760] | 0.480 [0.489] | 0.029 [0.864] | 0.012 [0.913] | 0.267 [0.606] | 6.997 *** [0.008] | 6.179 ** [0.013] | 3.463 * [0.063] | 4.566 ** [0.033] | |
| 0.123 [0.726] | 6.618 ** [0.010] | 9.067 *** [0.003] | 3.465 * [0.063] | 0.039 [0.844] | 5.114 ** [0.024] | 13.143 *** [0.000] | 22.559 *** [0.000] | 7.236 *** [0.007] | 0.012 [0.913] | |
| 0.839 [0.360] | 0.001 [0.987] | 2.047 [0.153] | 0.012 [0.912] | 0.003 [0.957] | 2.499 [0.114] | 3.364 * [0.067] | 16.154 *** [0.000] | 2.923 * [0.087] | 4.225 ** [0.040] | |
| 9.208 [0.101] | 12.128 ** [0.033] | 5.878 [0.318] | 4.952 [0.422] | 24.685 *** [0.000] | 5.049 [0.410] | 10.403 * [0.065] | ||||
| - | 0.075 [0.784] | 0.424 [0.515] | 0.374 [0.541] | 1.992 [0.158] | 4.268 ** [0.039] | 0.760 [0.383] | 0.513 [0.474] | |||
| 7.885 [0.163] | 6.496 [0.261] | 5.413 [0.368] | 0.446 [0.994] | 27.806 *** [0.000] | 3.675 [0.597] | 8.372 [0.137] | ||||
| - | 0.001 [0.974] | 0.019 [0.892] | 0.247 [0.619] | 0.619 [0.432] | 5.929 ** [0.015] | 1.599 [0.206] | 0.094 [0.760] |
| Region | Total | First Level | Second Level | Third Level | ||||
|---|---|---|---|---|---|---|---|---|
| Type | Absolute | Conditional | Absolute | Conditional | Absolute | Conditional | Absolute | Conditional |
| Model | Nt-SDM | Nt-SDM | Nt-SAR | Nt-SAR | Nt-SDM | Nt-SDM | Nt-OLS | Nt-OLS |
| −0.613 *** (−30.545) | −0.561 *** (−27.443) | −0.525 *** (−14.930) | −0.489 *** (−13.347) | −0.553 *** (−19.133) | −0.498 *** (−16.823) | −0.696 *** (−18.648) | −0.621 *** (−15.661) | |
| Govern | −0.007 *** (−2.708) | 0.004 (0.268) | −0.013 *** (−4.252) | −0.002 (−0.359) | ||||
| Finance | −0.080 *** (−6.115) | −0.185 ** (−2.276) | −0.053 *** (−3.559) | −0.101 *** (−4.135) | ||||
| Urban | −0.005 (−1.000) | −0.007 (−0.838) | 0.006 (0.885) | −0.022 ** (−2.030) | ||||
| Hum | 0.024 (1.205) | −0.052 (−1.160) | −0.040 (−1.012) | 0.034 (1.120) | ||||
| 0.953 *** (9.356) | 0.853 *** (8.358) | 0.730 *** (8.550) | 0.709 *** (8.083) | |||||
| control variable | Yes | Yes | ||||||
| Λ | 0.755 *** (18.762) | 0.752 *** (18.397) | 0.350 *** (4.604) | 0.360 *** (4.774) | 0.712 *** (15.913) | 0.670 *** (13.518) | ||
| 0.477 | 0.501 | 0.501 | 0.513 | 0.525 | 0.553 | 0.362 | 0.399 | |
| 30.702 *** (0.000) | 34.630 *** (0.000) | 5.042 ** (0.025) | 5.622 ** (0.018) | 40.745 *** (0.000) | 39.557 *** (0.000) | 2.247 (0.134) | 1.325 (0.250) | |
| 44.325 *** (0.001) | 27.085 *** (0.000) | 3.848 * (0.068) | 3.465 * (0.064) | 42.372 *** (0.000) | 24.456 *** (0.000) | 2.334 (0.127) | 0.271 (0.603) | |
| 106.095 *** (0.000) | 99.852 *** (0.000) | 9.315 *** (0.002) | 10.602 *** (0.001) | 114.682 *** (0.000) | 101.384 *** (0.000) | 0.913 (0.339) | 1.055 (0.304) | |
| 119.718 *** (0.000) | 92.307 *** (0.000) | 5.122 ** (0.024) | 6.075 ** (0.014) | 116.309 *** (0.000) | 86.283 *** (0.000) | 1.000 (0.317) | 0.001 (0.974) | |
| - | 87.541 *** (0.000) | 79.745 *** (0.000) | 4.238 ** (0.040) | 11.244 ** (0.047) | 73.100 *** (0.000) | 78.805 *** (0.000) | ||
| 79.177 *** (0.000) | 72.402 *** (0.000) | 4.090 ** (0.043) | 10.308 * (0.063) | 67.675 *** (0.000) | 76.446 *** (0.000) | |||
| - | 25.463 *** (0.002) | 25.885 *** (0.003) | 0.622 (0.430) | 3.049 (0.693) | 18.155 *** (0.000) | 29.833 *** (0.000) | ||
| 30.108 *** (0.002) | 29.993 *** (0.004) | 0.623 (0.430) | 4.038 (0.544) | 22.857 *** (0.000) | 37.419 *** (0.000) | |||
| Convergence | Middle Yangtze River | Harbin–Changchun | Central Plains | Chengdu–Chongqing | Yangtze River Delta | Guanzhong | Beijing–Tianjin–Hebei | South and Central Liaoning | Guangdong–Hong Kong–Macao | West Side of the Strait | |
|---|---|---|---|---|---|---|---|---|---|---|---|
| Absolute β | Yes | Yes | Yes | Yes | Yes | Yes | Yes | Yes | Yes | Yes | |
| Conditional β | Yes | Yes | Yes | Yes | Yes | Yes | Yes | Yes | Yes | Yes | |
| Absolute β convergence level | Middle | Low | High | Low | Middle | High | Low | Low | Low | Middle | |
| Conditional β convergence level | High | Low | High | Low | Middle | High | Low | Low | Low | High | |
| Club convergence | Total | First level | Second level | Third level | |||||||
| Guangdong–Hong Kong–Macao | Yangtze River Delta | Beijing–Tianjin–Hebei | Middle Yangtze River | Central Plains | Chengdu–Chongqing | South and Central Liaoning | Harbin–Changchun | Guanzhong | West Side of the Strait | ||
| Absolute β | Yes | Yes | Yes | Yes | |||||||
| Conditional β | Yes | Yes | Yes | Yes | |||||||
| Absolute β convergence level | Low | Middle | Hihg | ||||||||
| Conditional β convergence level | Low | Middle | High | ||||||||
Disclaimer/Publisher’s Note: The statements, opinions and data contained in all publications are solely those of the individual author(s) and contributor(s) and not of MDPI and/or the editor(s). MDPI and/or the editor(s) disclaim responsibility for any injury to people or property resulting from any ideas, methods, instructions or products referred to in the content. |
© 2023 by the authors. Licensee MDPI, Basel, Switzerland. This article is an open access article distributed under the terms and conditions of the Creative Commons Attribution (CC BY) license (https://creativecommons.org/licenses/by/4.0/).
Share and Cite
Liu, F.; Zhang, G.; Li, C.; Ren, T.; Masi, D. Analysis of the Temporal and Spatial Pattern and Convergence Characteristics of High-Quality Sustainable Economic Development of Urban Agglomeration. Sustainability 2023, 15, 14807. https://doi.org/10.3390/su152014807
Liu F, Zhang G, Li C, Ren T, Masi D. Analysis of the Temporal and Spatial Pattern and Convergence Characteristics of High-Quality Sustainable Economic Development of Urban Agglomeration. Sustainability. 2023; 15(20):14807. https://doi.org/10.3390/su152014807
Chicago/Turabian StyleLiu, Fei, Genyu Zhang, Chenghao Li, Tao Ren, and Donato Masi. 2023. "Analysis of the Temporal and Spatial Pattern and Convergence Characteristics of High-Quality Sustainable Economic Development of Urban Agglomeration" Sustainability 15, no. 20: 14807. https://doi.org/10.3390/su152014807
APA StyleLiu, F., Zhang, G., Li, C., Ren, T., & Masi, D. (2023). Analysis of the Temporal and Spatial Pattern and Convergence Characteristics of High-Quality Sustainable Economic Development of Urban Agglomeration. Sustainability, 15(20), 14807. https://doi.org/10.3390/su152014807