Article

Study on the Spatial Structure of the Complex Network of Population Migration in the Poyang Lake Urban Agglomeration

1
College of Civil Engineering and Architecture, Nanchang Hangkong University, Nanchang 330063, China
2
Jiangxi Intelligent Building Engineering Research Centre, Nanchang 330063, China
3
Nanchang Hangkong University Intelligent Construction Research Centre, Nanchang 330063, China
*
Author to whom correspondence should be addressed.
Sustainability 2023, 15(20), 14789; https://doi.org/10.3390/su152014789
Submission received: 16 August 2023 / Revised: 6 October 2023 / Accepted: 9 October 2023 / Published: 12 October 2023

Abstract

:
Population constitutes the foundational element of cities, and population migration drives the transfer of production factors among urban areas. The population migration network serves as an objective representation of intercity interactions, bearing great significance for the analysis of urban network spatial structure. This study focuses on the 10 core cities within the Poyang Lake urban agglomeration. It utilizes population migration data from Tencent’s location-based big data spanning from 2015 to 2018. Employing the point-axis theory from spatial network theory and the directed weighted network theory within the complex network, the study establishes a comprehensive set of network indices and a network model for spatial structure. It investigates the dynamics of population migration networks within the urban agglomeration and considers strategies for enhancing, regulating, or guiding urban agglomeration development to strengthen its overall vitality. The findings indicate that the urban agglomeration displays distinct characteristics of an urban hierarchical sequence and demonstrates gradual improvement in its spatial network development. While network density remains relatively stable across various threshold intervals over an extended period, network connectivity remains weak. Moreover, the urban agglomeration exhibits the lowest degree of centralization, the highest network structure entropy, and limited network connectivity. Migration along the primary power axis within the urban agglomeration remains relatively stable, while the internal network of the urban agglomeration is interconnected through a “core-non-core” network, reflecting near-geographical connection characteristics. Variations in spatial structure are observed, with the spatial network structure following two modes: “weak core city + edge city” and “node city + outer network city”. The trend in network connections diversifies, resulting in both “core-edge” connections and cross-regional connections. In conclusion, the network characteristics of the urban agglomeration surrounding Poyang Lake are consolidated to aid in formulating an optimization plan for the urban agglomeration’s spatial structure. Additionally, these findings serve as a reference for studying the evolution of spatial structures in the other two urban agglomerations within the city agglomeration in the middle reaches of the Yangtze River.

1. Introduction

In the contemporary era of globalization, urban agglomeration has emerged as a novel geographical entity with profound implications for China’s international competitiveness. The concept of urban agglomeration, initially introduced by Gottman [1] in 1957, underscores that “the development of cities along the urban transport network will evolve into an organic socio-economic system, and subsequently connect multiple socio-economic systems through the transport network between cities, resulting in a regional spatial structure characterized by polycentricity”. Today, urban agglomeration has evolved into a high-density spatial geographic unit within a defined spatial scope, encompassing various cities of different natures, types, and scales. These cities serve as nodes interconnected through a well-developed integrated infrastructure network, forming a spatial pattern characterized by compact, economically interconnected urban agglomeration [2].
As a complex aggregate, urban agglomeration encompasses multifaceted dimensions. Population stands as the most fundamental constituent of cities, and population migration acts as the driving force behind the exchange of production factors among urban centers. A significant volume of population migration activities can lead to imbalances in factor transfers, resulting in disparities in wealth among cities, thereby disrupting the spatial structure of the network. Taking into consideration the elemental components of cities, this study investigates the evolving patterns of the population migration network within urban agglomerations. It also scrutinizes weak links within these agglomerations and deliberates on the necessity of augmenting, regulating, or guiding their development to enhance the overall resilience of urban agglomerations. This research centers on the urban agglomeration surrounding Poyang Lake in Jiangxi Province, China. This agglomeration is one of the three sub-urban agglomerations within the larger city agglomeration situated in the middle reaches of the Yangtze River. The study aims to contribute support for crafting an optimization plan for the spatial structure of the urban agglomeration surrounding Poyang Lake and offers insights for the examination of the evolving spatial structures within the other urban agglomerations in the middle reaches of the Yangtze River.
At the current stage, scholarly research, both domestic and international, predominantly focuses on several aspects of urban agglomeration, including network structure characteristics, interconnections among urban agglomerations, influencing factors, and the evaluation of these agglomerations. In terms of network structure characteristics, it is posited that urban agglomeration does not exist as an isolated spatial unit; rather, it defines multi-level urban clusters through socio-economic linkages. A bottom-up aggregation method is proposed to quantify urban agglomeration at multiple spatial scales [3]. The spatial structure of urban agglomeration is analyzed using a multitude of data sources, encompassing the construction of a primary center score index and an average sub-center score index. These analyses employ tools such as the Getis Ord-Gi* model, the natural discontinuity approach, and other models [4]. Additionally, the hindrances posed by urban networking and the removal of administrative boundaries are studied through average control and average centrality indexes [5]. Further, the spatial network patterns and their evolution across various stages of development are explored via complex network analysis and Quadratic Assignment Procedure (QAP) analysis [6]. The research also evaluates overall network completeness, network structure characteristics, and network aggregation [7].
Concerning the interconnections and influencing factors within urban agglomeration, researchers delve into the network hierarchy, correlation relationships, and driving forces, primarily rooted in population migration flow [8,9]. In terms of economic flows, scholars measure the strength of correlations among cities, primarily employing the modified gravity model. They also analyze network connections and spatial network structures within urban agglomerations through social network analysis [10,11]. The examination of traffic flows primarily involves constructing passenger transport networks within urban agglomerations based on intercity highway and railway passenger transport data. Topological features are developed using multi-modal transport networks, and the characteristics of resilience changes are explored, encompassing absorptive capacity, buffer capacity, and restorability [12].
In the realm of urban agglomeration evaluation, the entropy weight method is widely employed to assess urban agglomeration in terms of infrastructure connectivity, open sharing of data resources, and large-scale cross-domain collaborative governance [13]. Additionally, panel fixed effects (FE) models are used to analyze population, urban agglomeration (UAG), and economic growth dynamics. The model’s applicability is validated through the Hausmann test [14]. Spatio-temporal patterns of urban growth are examined and compared with the assumptions of urbanization models (diffusion-agglomeration and three growth patterns). This is achieved through the analysis of time-series neighborhood-level built-up area densities, aiming to identify two broad spatial scales of cities [15]. Economic agglomeration is assessed via spatial econometric modeling, evaluating the economic and technological indicators of urban agglomeration [16]. Spatial differentiation characteristics of economic development within urban agglomerations are analyzed using kernel density estimation and the ellipse standard deviation method. Additionally, the Dagum Gini coefficient and subgroup decomposition method are employed to study the spatial heterogeneity sources of economic development within urban agglomerations. A panel data regression model is used to identify the spatial dependence mechanisms influencing economic development within urban agglomerations [17].
While previous scholarly endeavors have contributed significantly to the field, there remains room for further exploration. Many existing studies analyzing population migration within urban agglomerations primarily focus on specific periods, such as weekends, holidays, the Spring Festival, National Day, and the like. Consequently, the findings mainly reflect network structure characteristics under specific conditions.
This thesis adopts a broader approach, encompassing the entire year and dividing it into stages of three years each, thus conducting long-term dynamic research. This approach minimizes the influence of chance and enhances the scientific rigor of the data. The Poyang Lake urban agglomeration, as one of the three sub-city agglomerations within the city agglomeration in the middle reaches of the Yangtze River, is relatively less studied compared to the other two city agglomerations (the ChangZhuTan agglomeration and the Wuhan City Circle). Considering that it predominantly relies on labor migration, this thesis constructs a network indicator system and a spatial structure network model based on population migration data. It draws upon the point-axis theory from spatial network theory and the oriented-weighted network theory from complex networks. Our analysis, focusing on population migration, aims to construct a population migration directed weighted network, offering valuable support for strengthening urban agglomeration.
Throughout the research process, interdisciplinary theories are harnessed to scrutinize specific aspects of urban agglomeration, thus providing potential insights for applying mature theories from multiple disciplines. Additionally, this study conducts in-depth research, offering potential research avenues for exploring the underlying causes of urban agglomeration development.

2. Materials and Methods

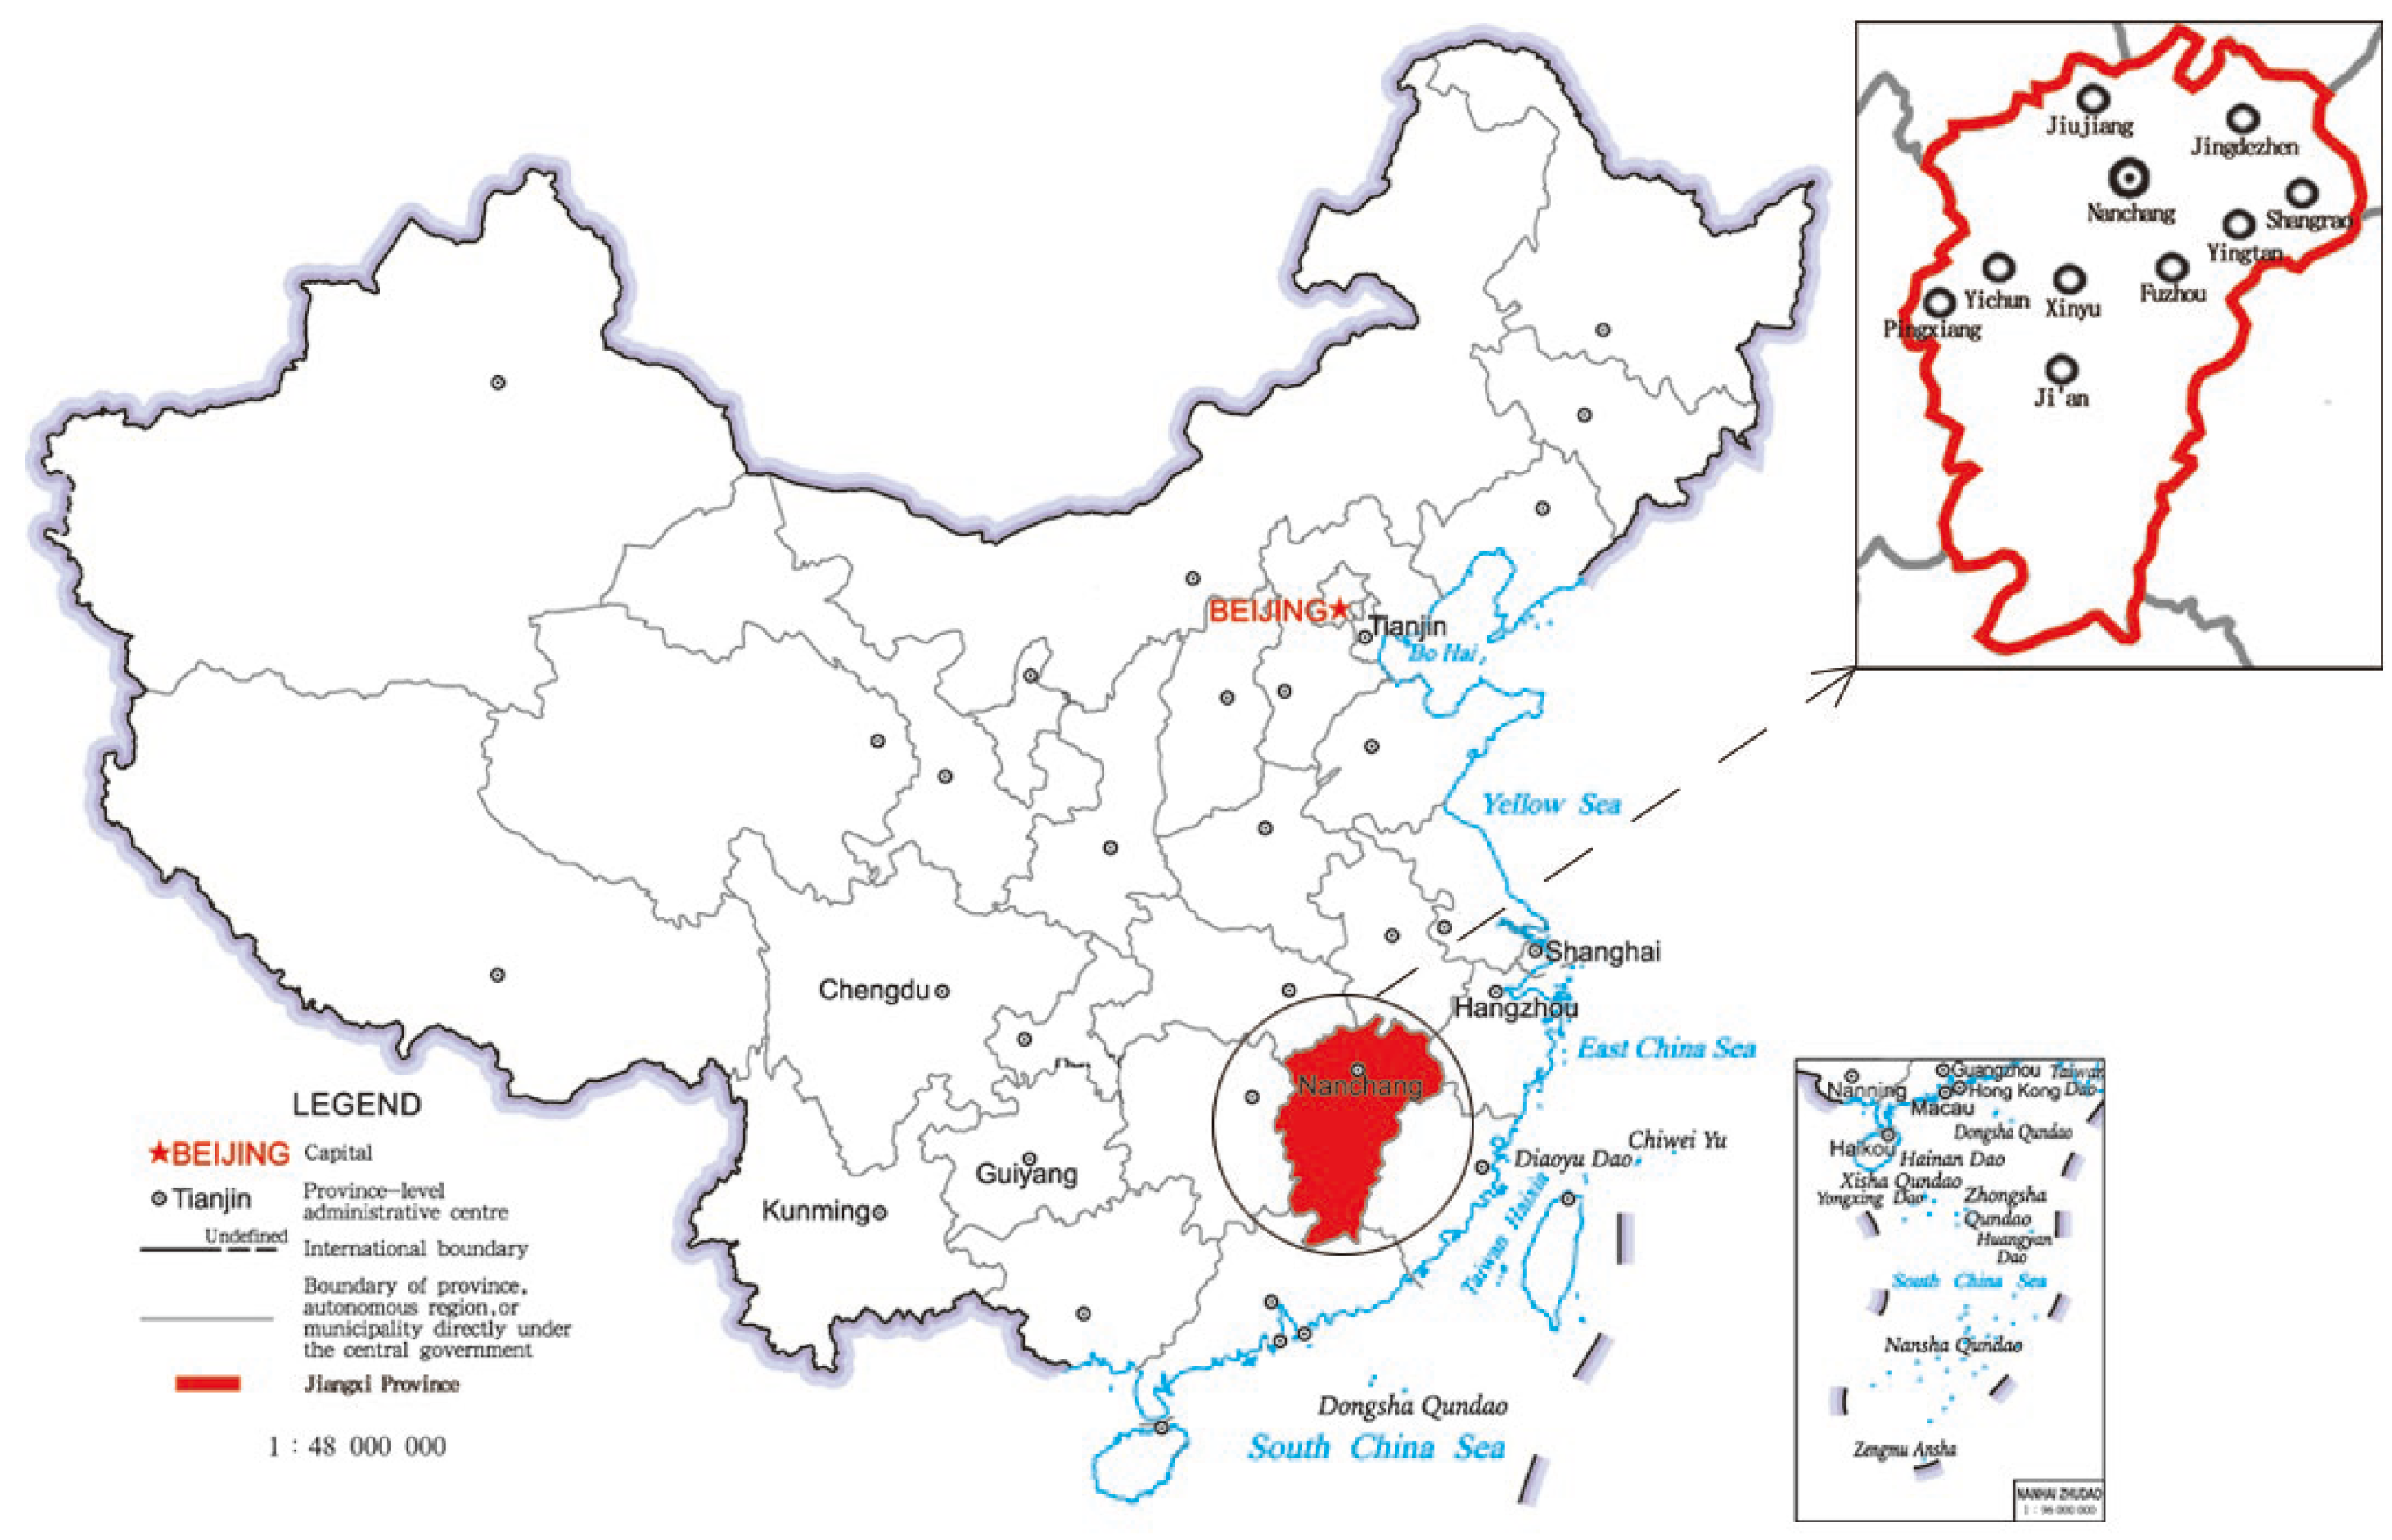
2.1. Research Object

The study focused on the ten cities within the urban agglomeration surrounding Poyang Lake, as specified in the Development Plan of Urban Agglomeration in the Middle Reaches of the Yangtze River. The study area of urban agglomeration around Poyang Lake is shown in Figure 1 These cities are Nanchang, Jiujiang, Jingdezhen, Yingtan, Xinyu, Yichun, Pingxiang, Shangrao, Fuzhou, and Ji’an. As of 2018, the total land area of this region amounted to 127,546 square kilometers, constituting 76.41% of Jiangxi Province’s entire land area. The regional population reached 37,798,100, representing 81.33% of the province’s total population. Additionally, the annual regional GDP stood at 191,775,400,000 Yuan, accounting for 87.23% of the province’s GDP [18,19].

2.2. Data Source and Description

The study employs population migration data for analysis, sourced from Tencent’s Location Big Data Platform’s “Population Migration Map” (available at https://heat.qq.com/, accessed on 16 August 2023). This platform offers data on the ten cities with the highest daily immigration and emigration rates, encompassing three primary migration modes: airplane, train, and car. The data are extracted using Python to determine the precise volume of individuals relocating to and from these cities.

2.3. Study Time and Total Data

As Tencent Location Big Data provides population migration data starting from February 2015, our research is structured around three years as a research stage, focusing on the period from 2015 to 2018 as the initial phase of the investigation. Specifically, the research timeframe for the first phase spans from 1 February 2015, to 30 June 2018, encompassing a total of 1246 days. The population migration data is categorized into inbound and outbound migration data. This research prioritizes high-volume migration data as they significantly influence the structural composition of the population migration network within the urban agglomeration. Consequently, the study selects the migration data occurring among the top ten cities as the primary research focus, accounting for data generated by the three modes of migration: automobile, train, and airplane. Based on these considerations, the total dataset for this study amounts to 747,600 records (1246 days × 10 cities × 2 migration directions × 10,000 migrations per mode).

2.4. Research Methods

The core of complex network research lies in the examination of the relationship between properties, such as node degree values and edge weight values within a network, and various network attributes, including geometric properties, efficiency, and stability. This investigation serves as the key to elucidating the distinctive features of spatial networks [20].
This research employs the point-line theory from spatial network theory and the directed-weighted network theory from complex network analysis to develop a comprehensive network indicator system and a spatial structure network model. The network index system comprises key elements such as edge weight, network density, degree of centralization, and network structure entropy. Meanwhile, the spatial structure network model encompasses the first weighted population migration axis and spatial network topology. The characteristics analysis of the network indicators of the urban agglomeration around Poyang Lake determines the city hierarchy sequence within the urban agglomeration and the degree of spatial network development of the urban agglomeration; the network density determines the closeness of the network connection of the urban agglomeration; and the degree of centralization and network structure entropy determines the degree of centrality of the urban agglomeration and the connectivity of the network. By using the characteristics of the spatial structure network of urban agglomeration around Poyang Lake, the pattern of the spatial structure of urban agglomeration and the trend of network connection are determined, and the relationship between the core cities and the edge cities is determined.
The spatial network within the Poyang Lake Urban Agglomeration consists of nodes and axes, displaying typical complex network characteristics. This study analyzes the fundamental traits of the spatial network in the Poyang Lake urban agglomeration, drawing upon relevant complex network metrics.
The research designates 10 cities within the Poyang Lake urban agglomeration as node cities, denoting them as nodes represented by ‘i’. Cities that share migration relationships with these node cities are identified as neighboring points and expressed as ‘j’. The migration axis is constructed based on migration volume, and the edge weight of the migration axis, denoted as ‘w’, is determined by various weight criteria.

2.4.1. Edge Weight

According to the research method of complex network on point weight, the edge weight of a node and its neighboring points are aggregated separately for a specific period to obtain the total edge weight of the node to each neighbor separately, which is the outgoing edge weight of the node, as W T denotes. According to the directed weighted network theory, the outward edge weights are divided into immigrating edge weight ( W T i n ) and emigrating edge weight ( W T o u t ).
Following the research methodology of complex network analysis utilizing point weights, the edge weight of a node and its neighboring points are individually aggregated over a specified period. This aggregation yields the total edge weight of the node with each neighbor, denoted as the outgoing edge weight of the node represented as W T .
By the principles of directed weighted network theory, the outward edge weights are further categorized into immigrating edge weight ( W T i n ) and emigrating edge weight ( W T o u t ).
W T i n = j N j w j i
W T o u t = j N i w i j
where, N j is the set of neighboring points j; w i j is the edge weight from node i to neighboring point j ; w j i is the edge weight from neighboring point j to node i .
These thresholds are employed to calculate the values of all edge weights and categorize them based on various threshold levels. Using this classification, the immigrating and emigrating edge weight axes were plotted, revealing their patterns of variation across different threshold ranges.

2.4.2. Network Density

Network density refers to the closeness of the connections between the nodes in the network. The expression is.
ρ = 2 M N N 1
where ρ is the network density; M is the number of edges; and N is the number of nodes.
In a directed network containing N nodes, the number of edges M has a theoretical maximum value of N ( N 1 ) , so ρ [ 0 , 1 ] .
In the network model constructed by the study, in which all nodes are almost always connected, ρ 1 . Therefore, according to the characteristics of the network, it is necessary to define the network density under different thresholds. The expressions are.
ρ w = 2 M w N N 1
Under a particular threshold range, ρ w is the network density with edge weight w , and M w is the number of edges with edge weight w .
Network density at different thresholds can elucidate the distribution of spatial connection strength within the network across multiple value domains. Greater network density indicates a stronger level of connectivity within the network.

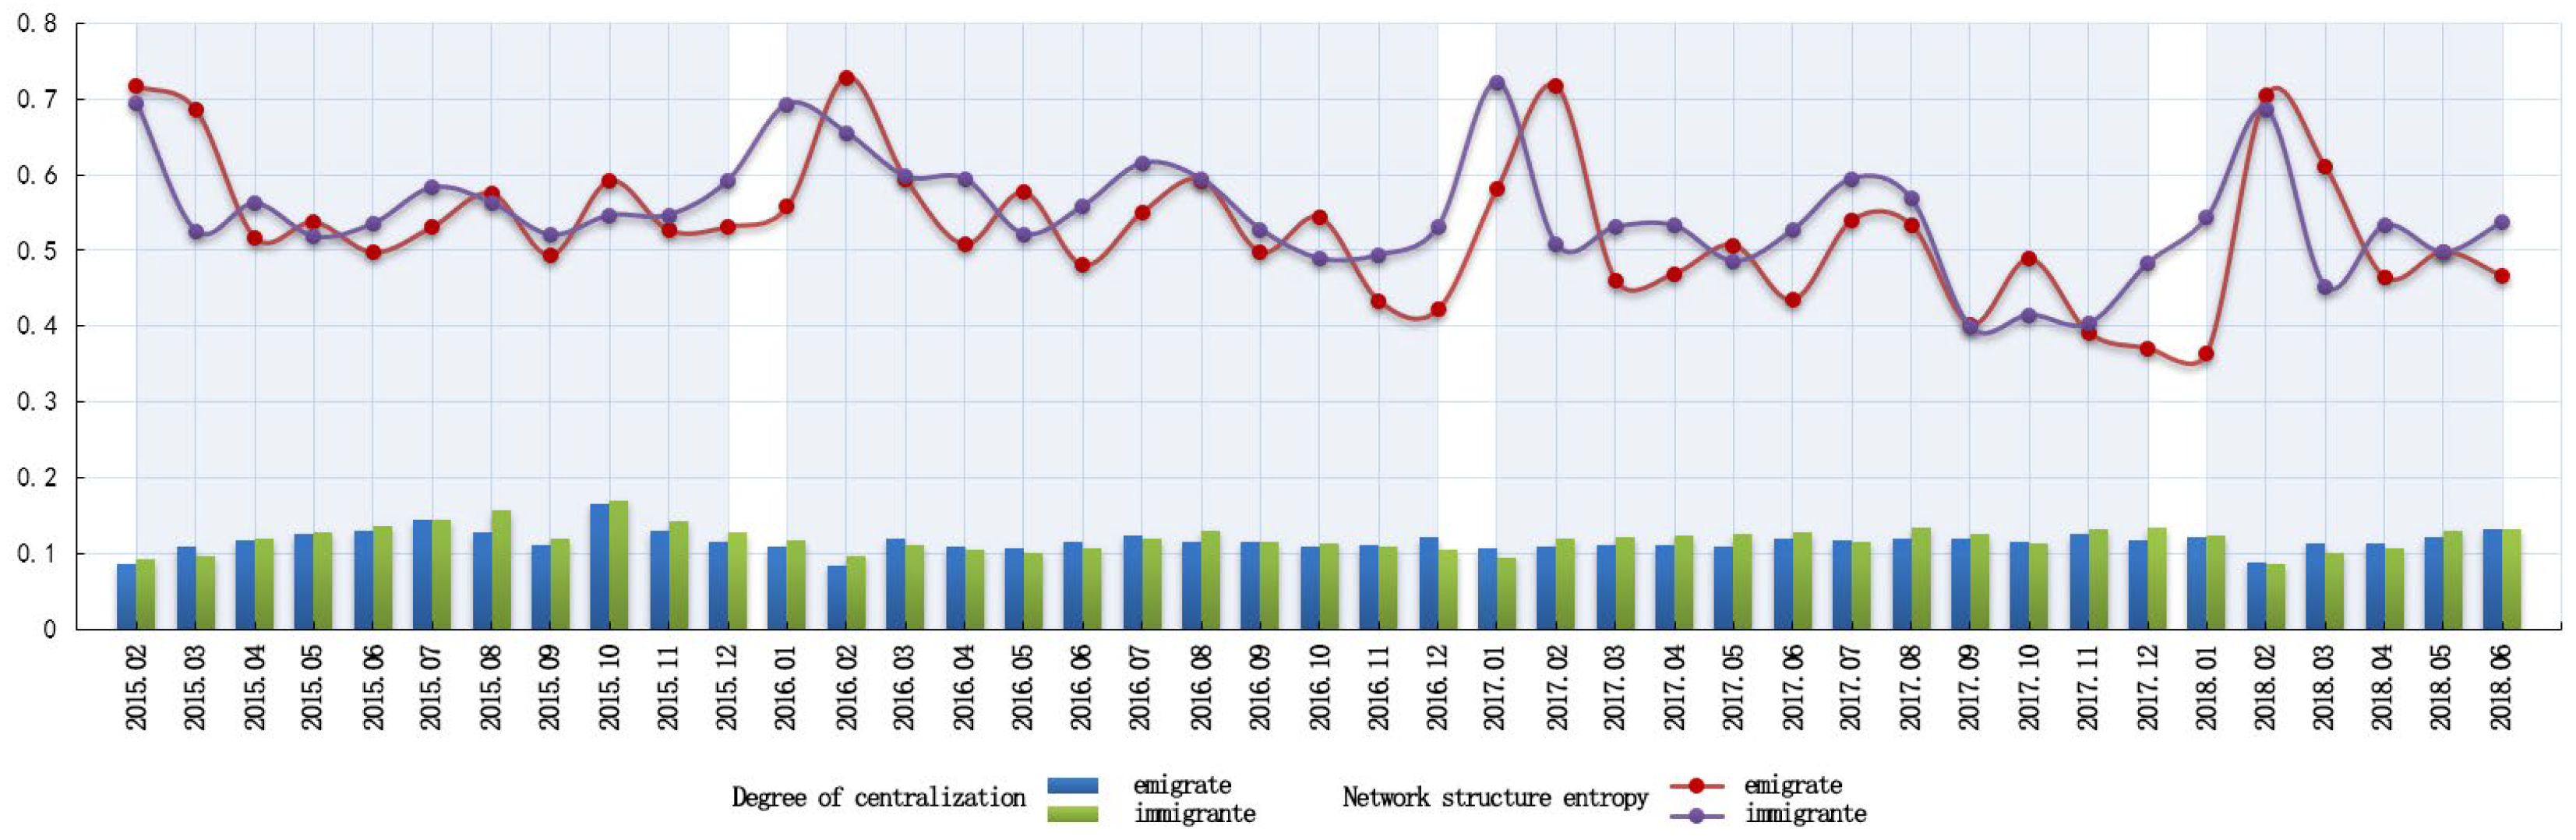
2.4.3. Degree of Centralization

Network centrality measures the level of integration or coherence within the overall network associations. In urban networks, it serves to delineate the presence of prominent core cities within the urban network and quantifies the role these core cities play in shaping regional space. The expression is.
C = 1 N 1 W m a x W i W m a x W m i n
where C is the degree of centrality of the network; W i , is the edge weight of node i ; W m a x , is the maximum value of the edge weight; W m i n is the minimum value of the edge weight; and N is the number of nodes in the network.
The degree of network centrality is a standardized relative value represented as C [ 0 , 1 ] . In the context of urban spatial networks and urban agglomeration spatial networks, a value approaching 1 indicates a more centralized network, signifying that a node holds a prominent central position within the network. Conversely, a value approaching 0 suggests a higher degree of balance among the nodes.

2.4.4. Network Structure Entropy

Network structure entropy is a metric used to measure the sequential state of a complex network, which is defined based on the importance of the nodes in the network.
In a weighted network, the importance of a node is measured using the magnitude of the edge weight. Suppose the node in the network i has an edge weight of w i , then the importance of the node I i is expressed as
I i = W i / i = 1 N W i
If the nodes W i = 0 are not considered, the network structure entropy can be defined as
E = i = 1 N I i l n I i
where E is the network structure entropy; I i is the importance of node i ; and N is the number of nodes.
When the network is perfectly homogeneous, I i = 1 / N , E m a x = l n N . When the network is most inhomogeneous and all nodes in the network are only connected to the same node, E m i n = l n 4 N 1 / 2 .
To eliminate the number of nodes N on the nodes E , the effect of E normalization is performed to obtain the standard network structure entropy E , and the expression is
E = E E m i n E m a x E m i n = 2 i = 1 N I i l n I i l n 4 N 1 2 l n N l n 4 N 1
where E is the standard network structure entropy, E [ 0 , 1 ] .
Network structure entropy is employed to investigate the heterogeneity within complex networks. In instances where an urban network exhibits a scale-free characteristic, the entropy value tends to be smaller, indicating enhanced network connectivity and a more pronounced small-world property. Conversely, in cases of poor network connectivity, the entropy value tends to be larger, signifying a weaker small-world property. Network structure entropy serves as a crucial indicator of network connectivity.

3. Results

3.1. Analysis of the Characteristics of Complex Network Indicators of Population Migration in the Poyang Lake Urban Agglomeration
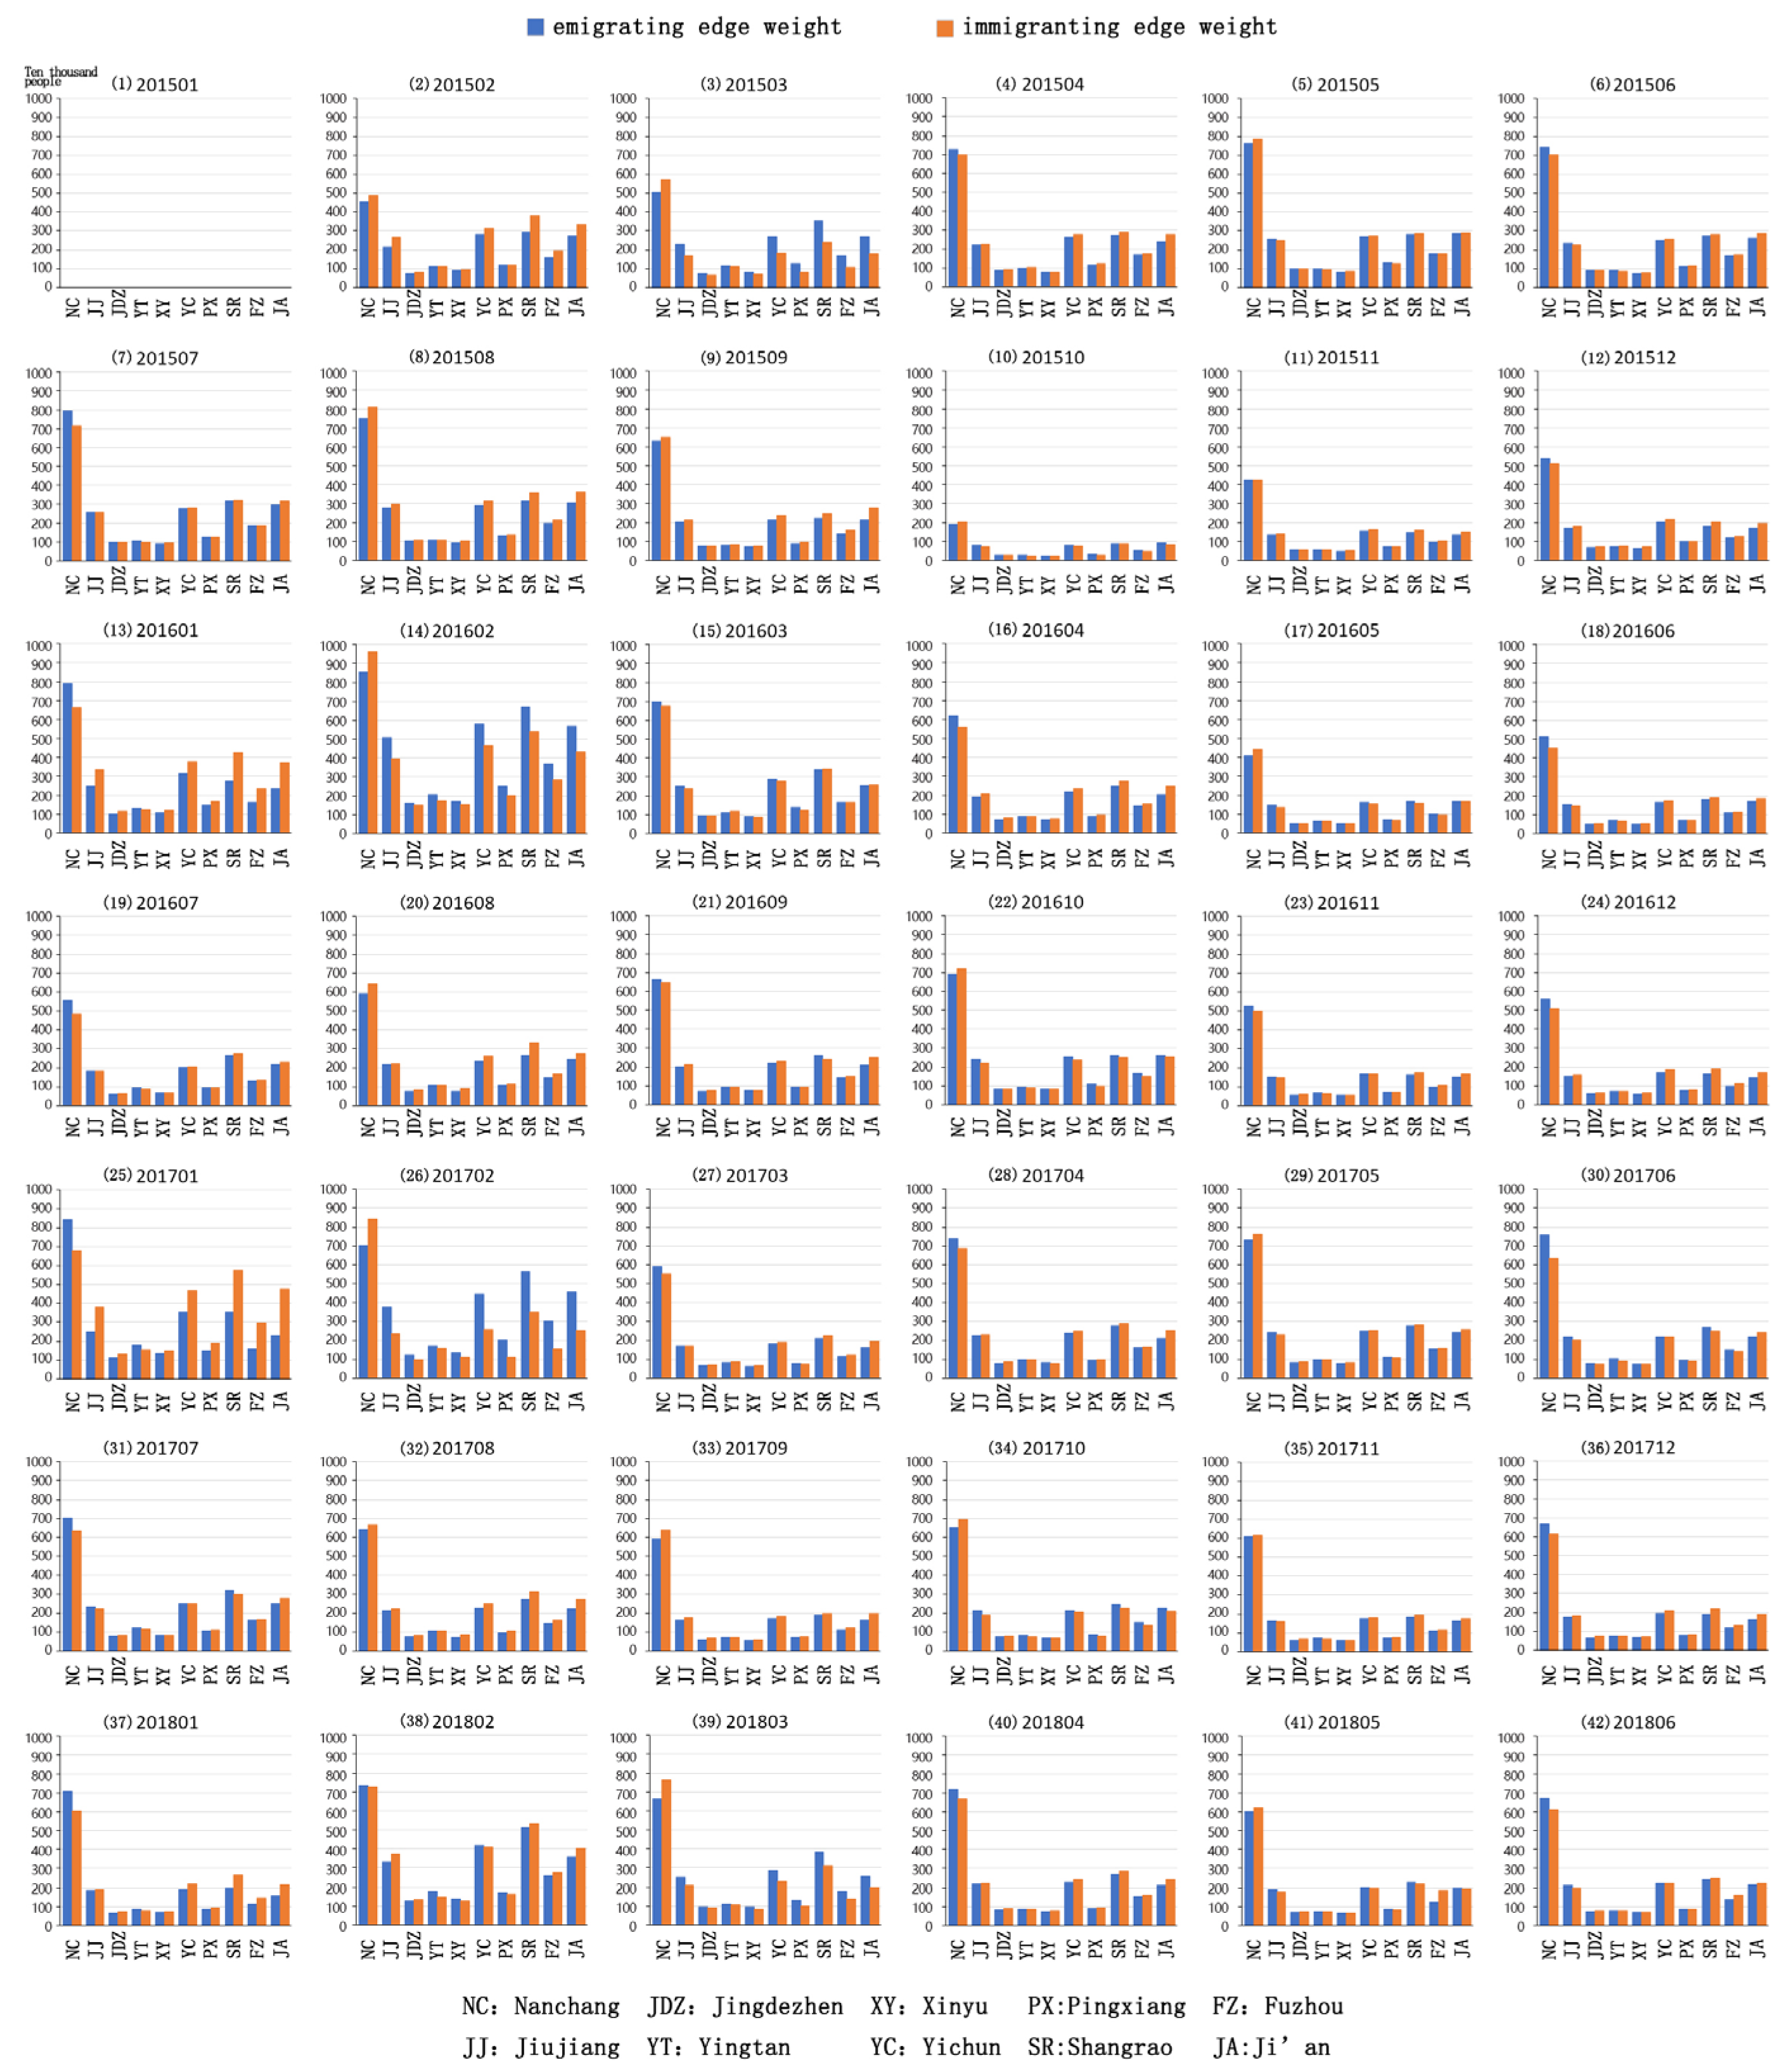
3.1.1. Edge Weight

Based on the statistical data, a summary graph illustrating the immigrating and emigrating edge weights of the 10-node cities within the Poyang Lake urban agglomeration from 2015 to 2018 is presented in Figure 2.
Figure 2 reveals several key observations: ➀ Steady Comparison of Edge Weights: The immigrating and emigrating edge weights of each node city exhibit consistent patterns. Throughout the study period, the monthly immigrating and emigrating edge weights for the 10 node cities within the Poyang Lake urban agglomeration remained relatively stable when compared to their historical values. Notably, Nanchang consistently maintained the highest immigrating and emigrating edge weights among all 10 node cities. ➁ Three-Tier Classification: Based on the values of their immigrating and emigrating edge weights, the 10 node cities can be categorized into three levels. Nanchang occupies the top tier, with the highest weight values, securing a solid first-place position. The second tier includes Jiujiang, Yichun, Shangrao, and Ji’an. The third tier comprises Fuzhou, Jingdezhen, Yingtan, Xinyu, and Pingxiang. Notably, the second and third tiers are closely balanced, facilitating a smooth transition of gradient ranks. ➂ Seasonal Variation Trends: Over a year, the immigrating and emigrating edge weights follow distinct trends. Peaks are consistently observed around the Spring Festival and the months preceding and following it, while the lowest weight values occur during November and December. The remaining months exhibit moderate fluctuations, but generally maintain a relatively stable pattern. (Please note that the absence of data in certain months, such as October 2015, may lead to variations not accounted for in these trends).

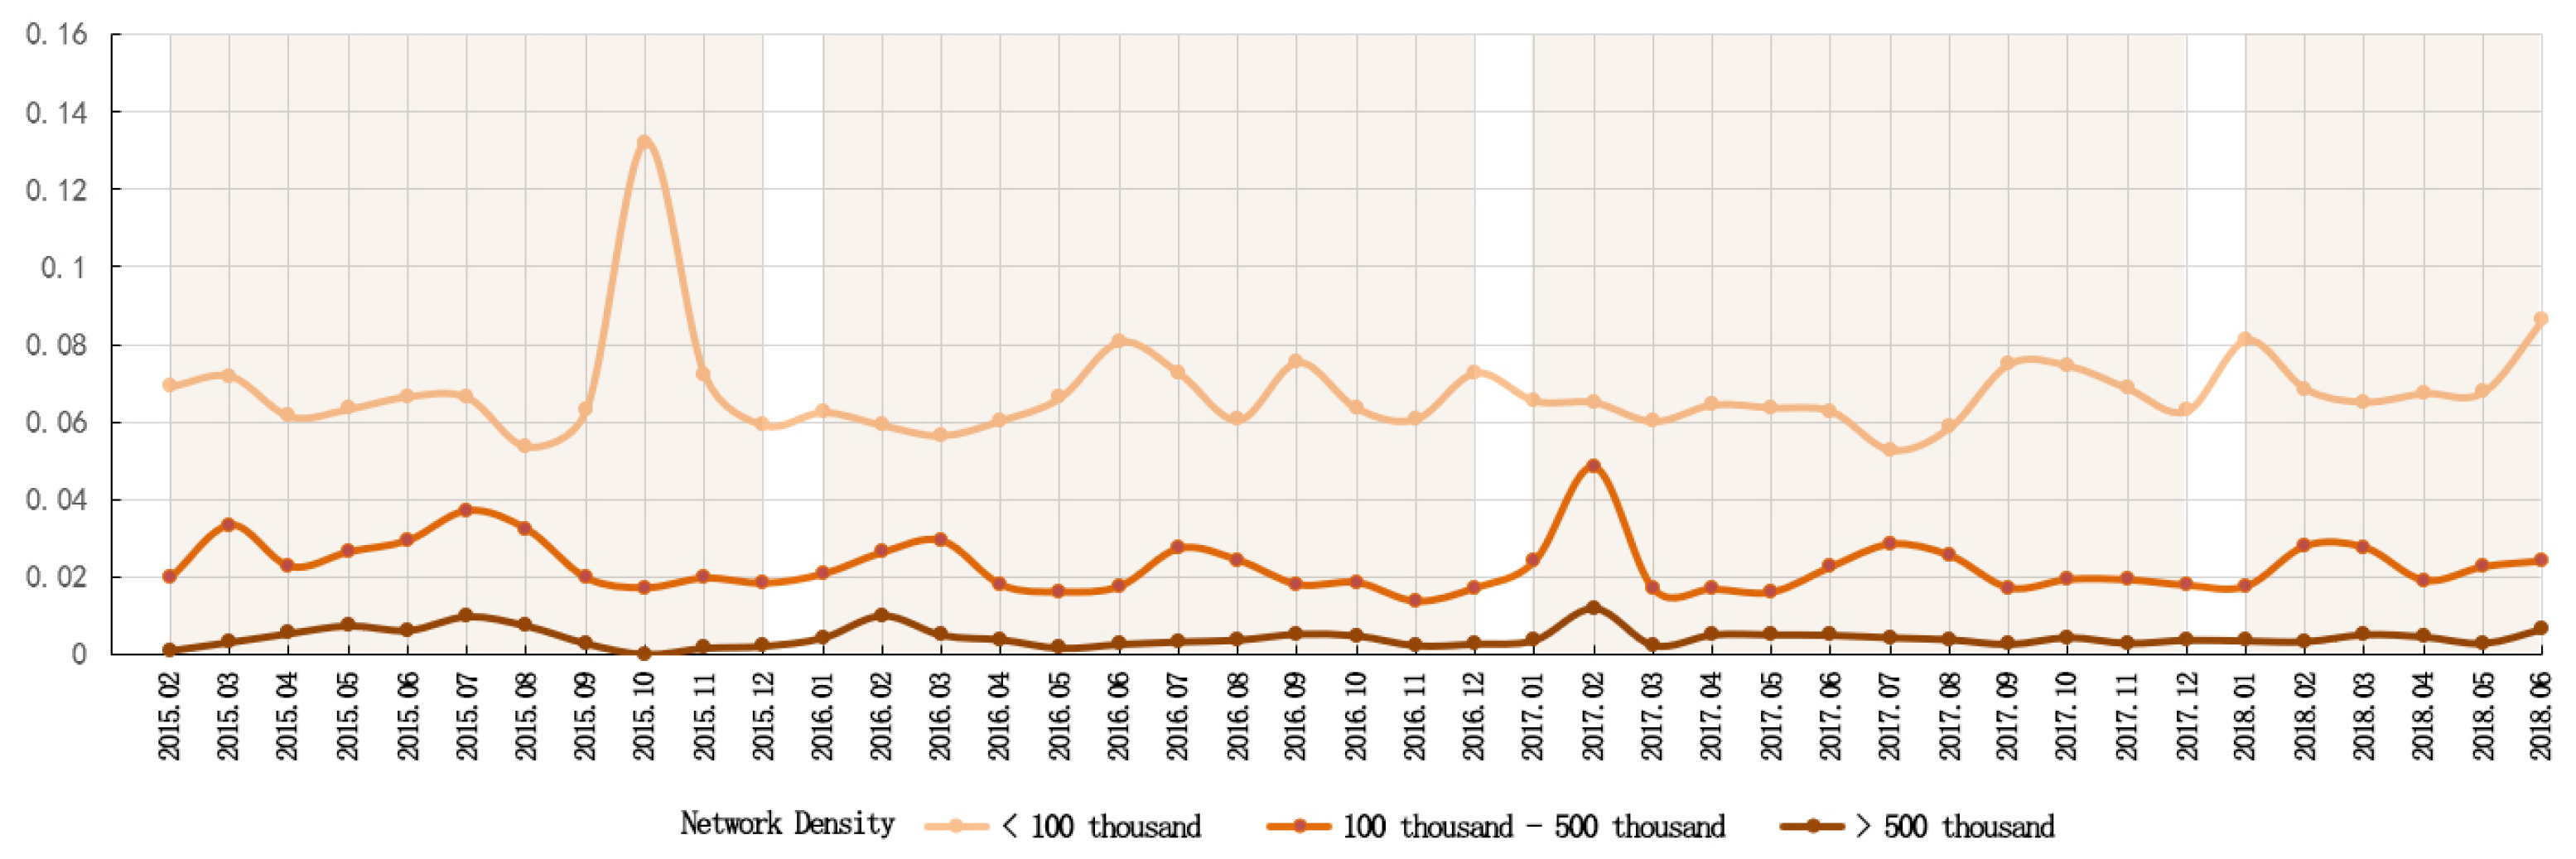
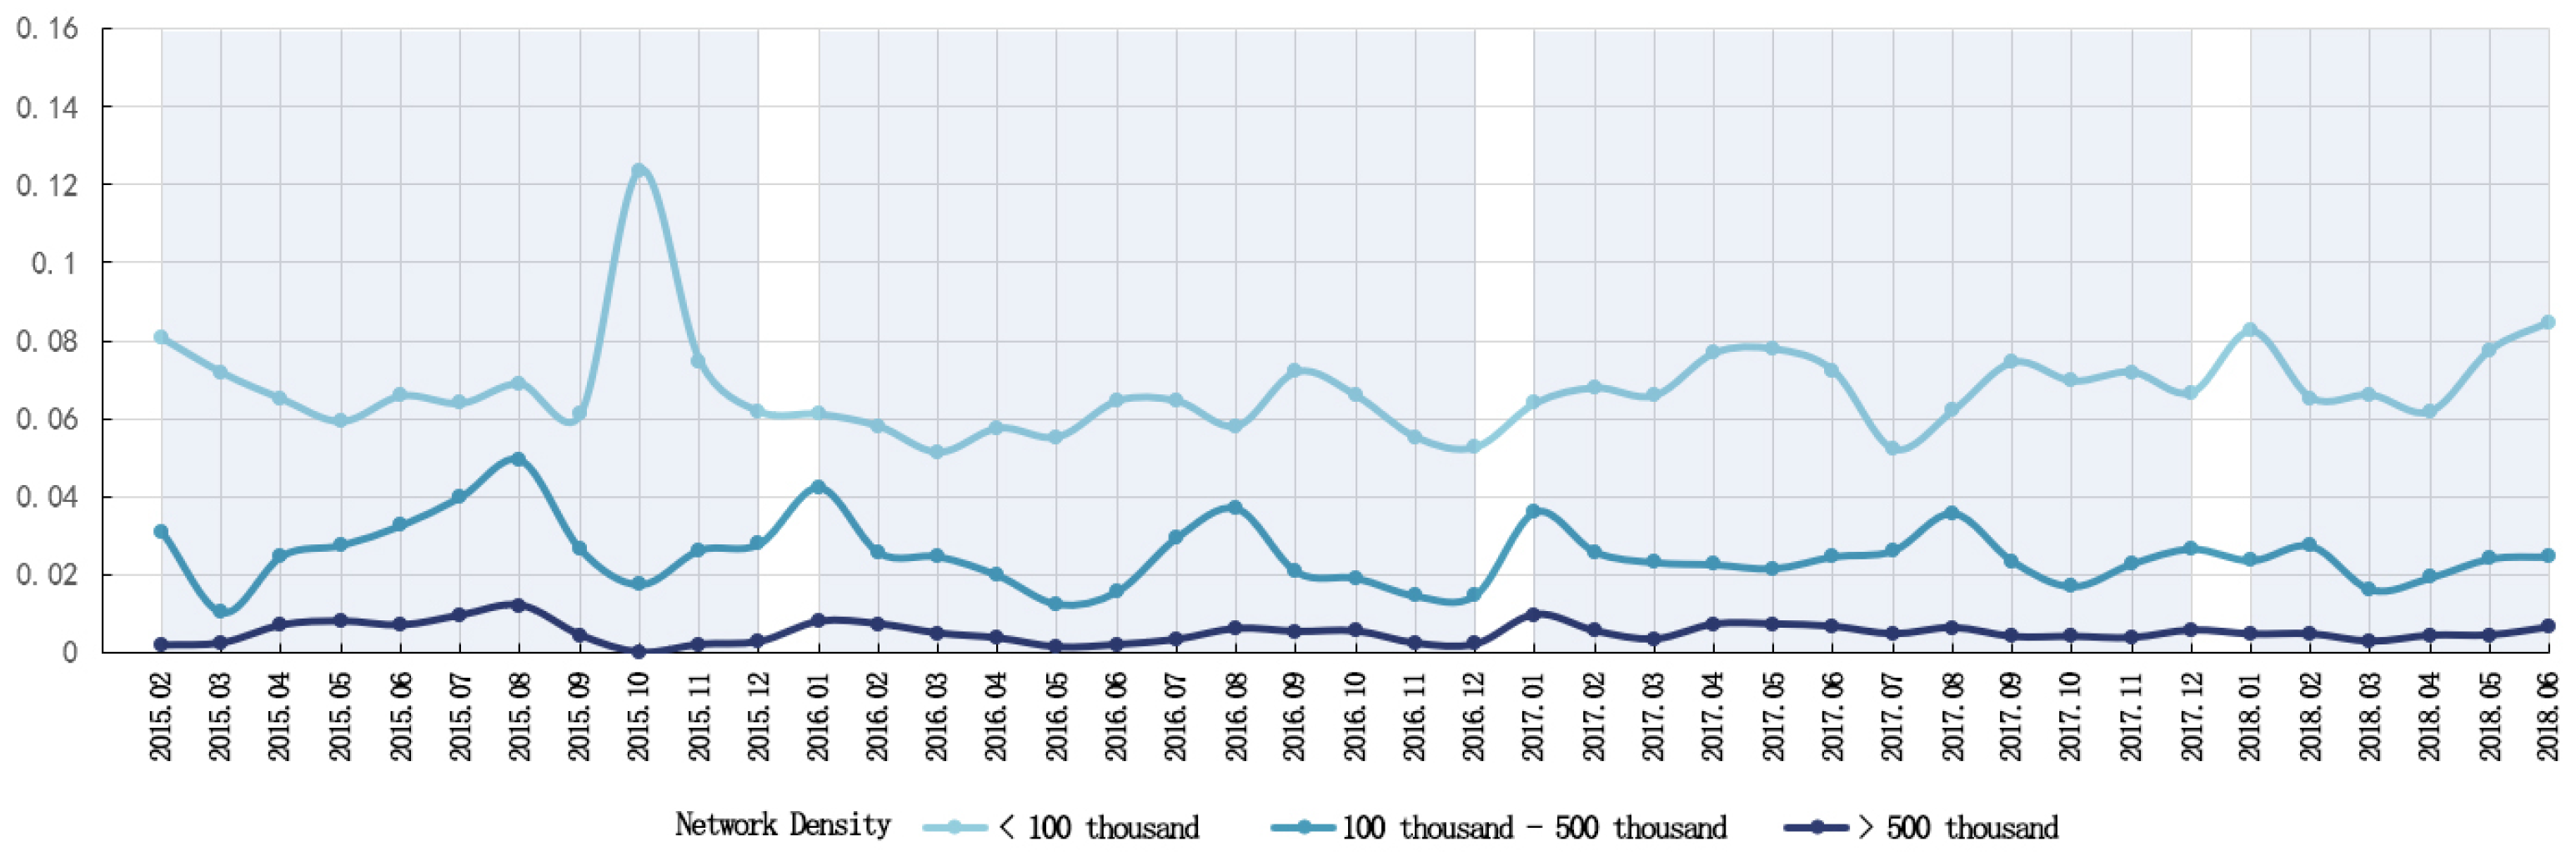
3.1.2. Network Density

According to the basic data and Formula (4), the statistics of the Poyang Lake urban agglomeration are compiled under the three threshold ranges, the edge weight is the network density of w , i.e., w > 500   k , 500   k > w > 1000   k , and w < 1000   k , and the network density of three levels of immigration and emigration in the city agglomeration is plotted in the different threshold ranges, respectively.
According to the collated data, the density of the 3-level network of immigrating and emigrating in the Poyang Lake urban agglomeration in the range of different thresholds from 2015 to 2018 are plotted, respectively. See Figure 3 and Figure 4.
From Figure 3 and Figure 4, it can be seen that from 2015 to 2018, the Poyang Lake urban agglomeration: ➀ w > 500   k of network density, which fluctuates very little, lies below 1%, and maintains a stable state of a straight line. ➁ 500   k > w > 1000   k of network density, fluctuates between 2 and 4%, and forms regular fluctuations by itself every year. ➂ w < 1000   k the network density, except for October 2015 (the missing data are serious), is basically below 8% and fluctuates more frequently. It can be seen that the network density of the high edge weight of the Poyang Lake urban agglomeration occupies a small proportion.

3.1.3. Degree of Centralization and Network Structure Entropy

The centralization degree and network structure entropy graph of the Poyang Lake Urban Agglomeration from 2015 to 2018 is depicted in Figure 5, based on statistical data and Formulas (5) and (8).
Figure 5 reveals the following insights regarding the 2015–2018 Poyang Lake urban agglomeration: ➀ The centrality degrees of immigration and emigration is quite similar, predominantly falling within the range of 0.08–0.13. These values deviate significantly from one and approach zero, indicating a consistent and relatively high balance among nodes throughout the entire cycle. While the core city (Nanchang) within the agglomeration holds an essential position, it appears relatively weaker in core status when compared to similar cities in other agglomerations (e.g., Changsha in the Changsha-Zhuzhou-Xiangtan city group in Hunan province, and Wuhan and the urban agglomerations around Wuhan in Hubei province within the Central Yangtze River City Agglomeration). ➁ The network structure entropy of immigration and emigration for the years 2015–2018 exhibits a generally consistent trend. Aside from notable fluctuations during specific months (impacted by the Chinese Spring Festival), the overall trend fluctuates within a defined range. Over the long-term trend, the network structure entropy of urban agglomerations hovers between 0.5 and 0.6, predominantly in the mid to upper range. This suggests relatively poor network connectivity and a relatively weak small-world property.

3.2. Analysis of Spatial Structure Characteristics of the Complex Network of Population Migration in the Poyang Lake Urban Agglomeration

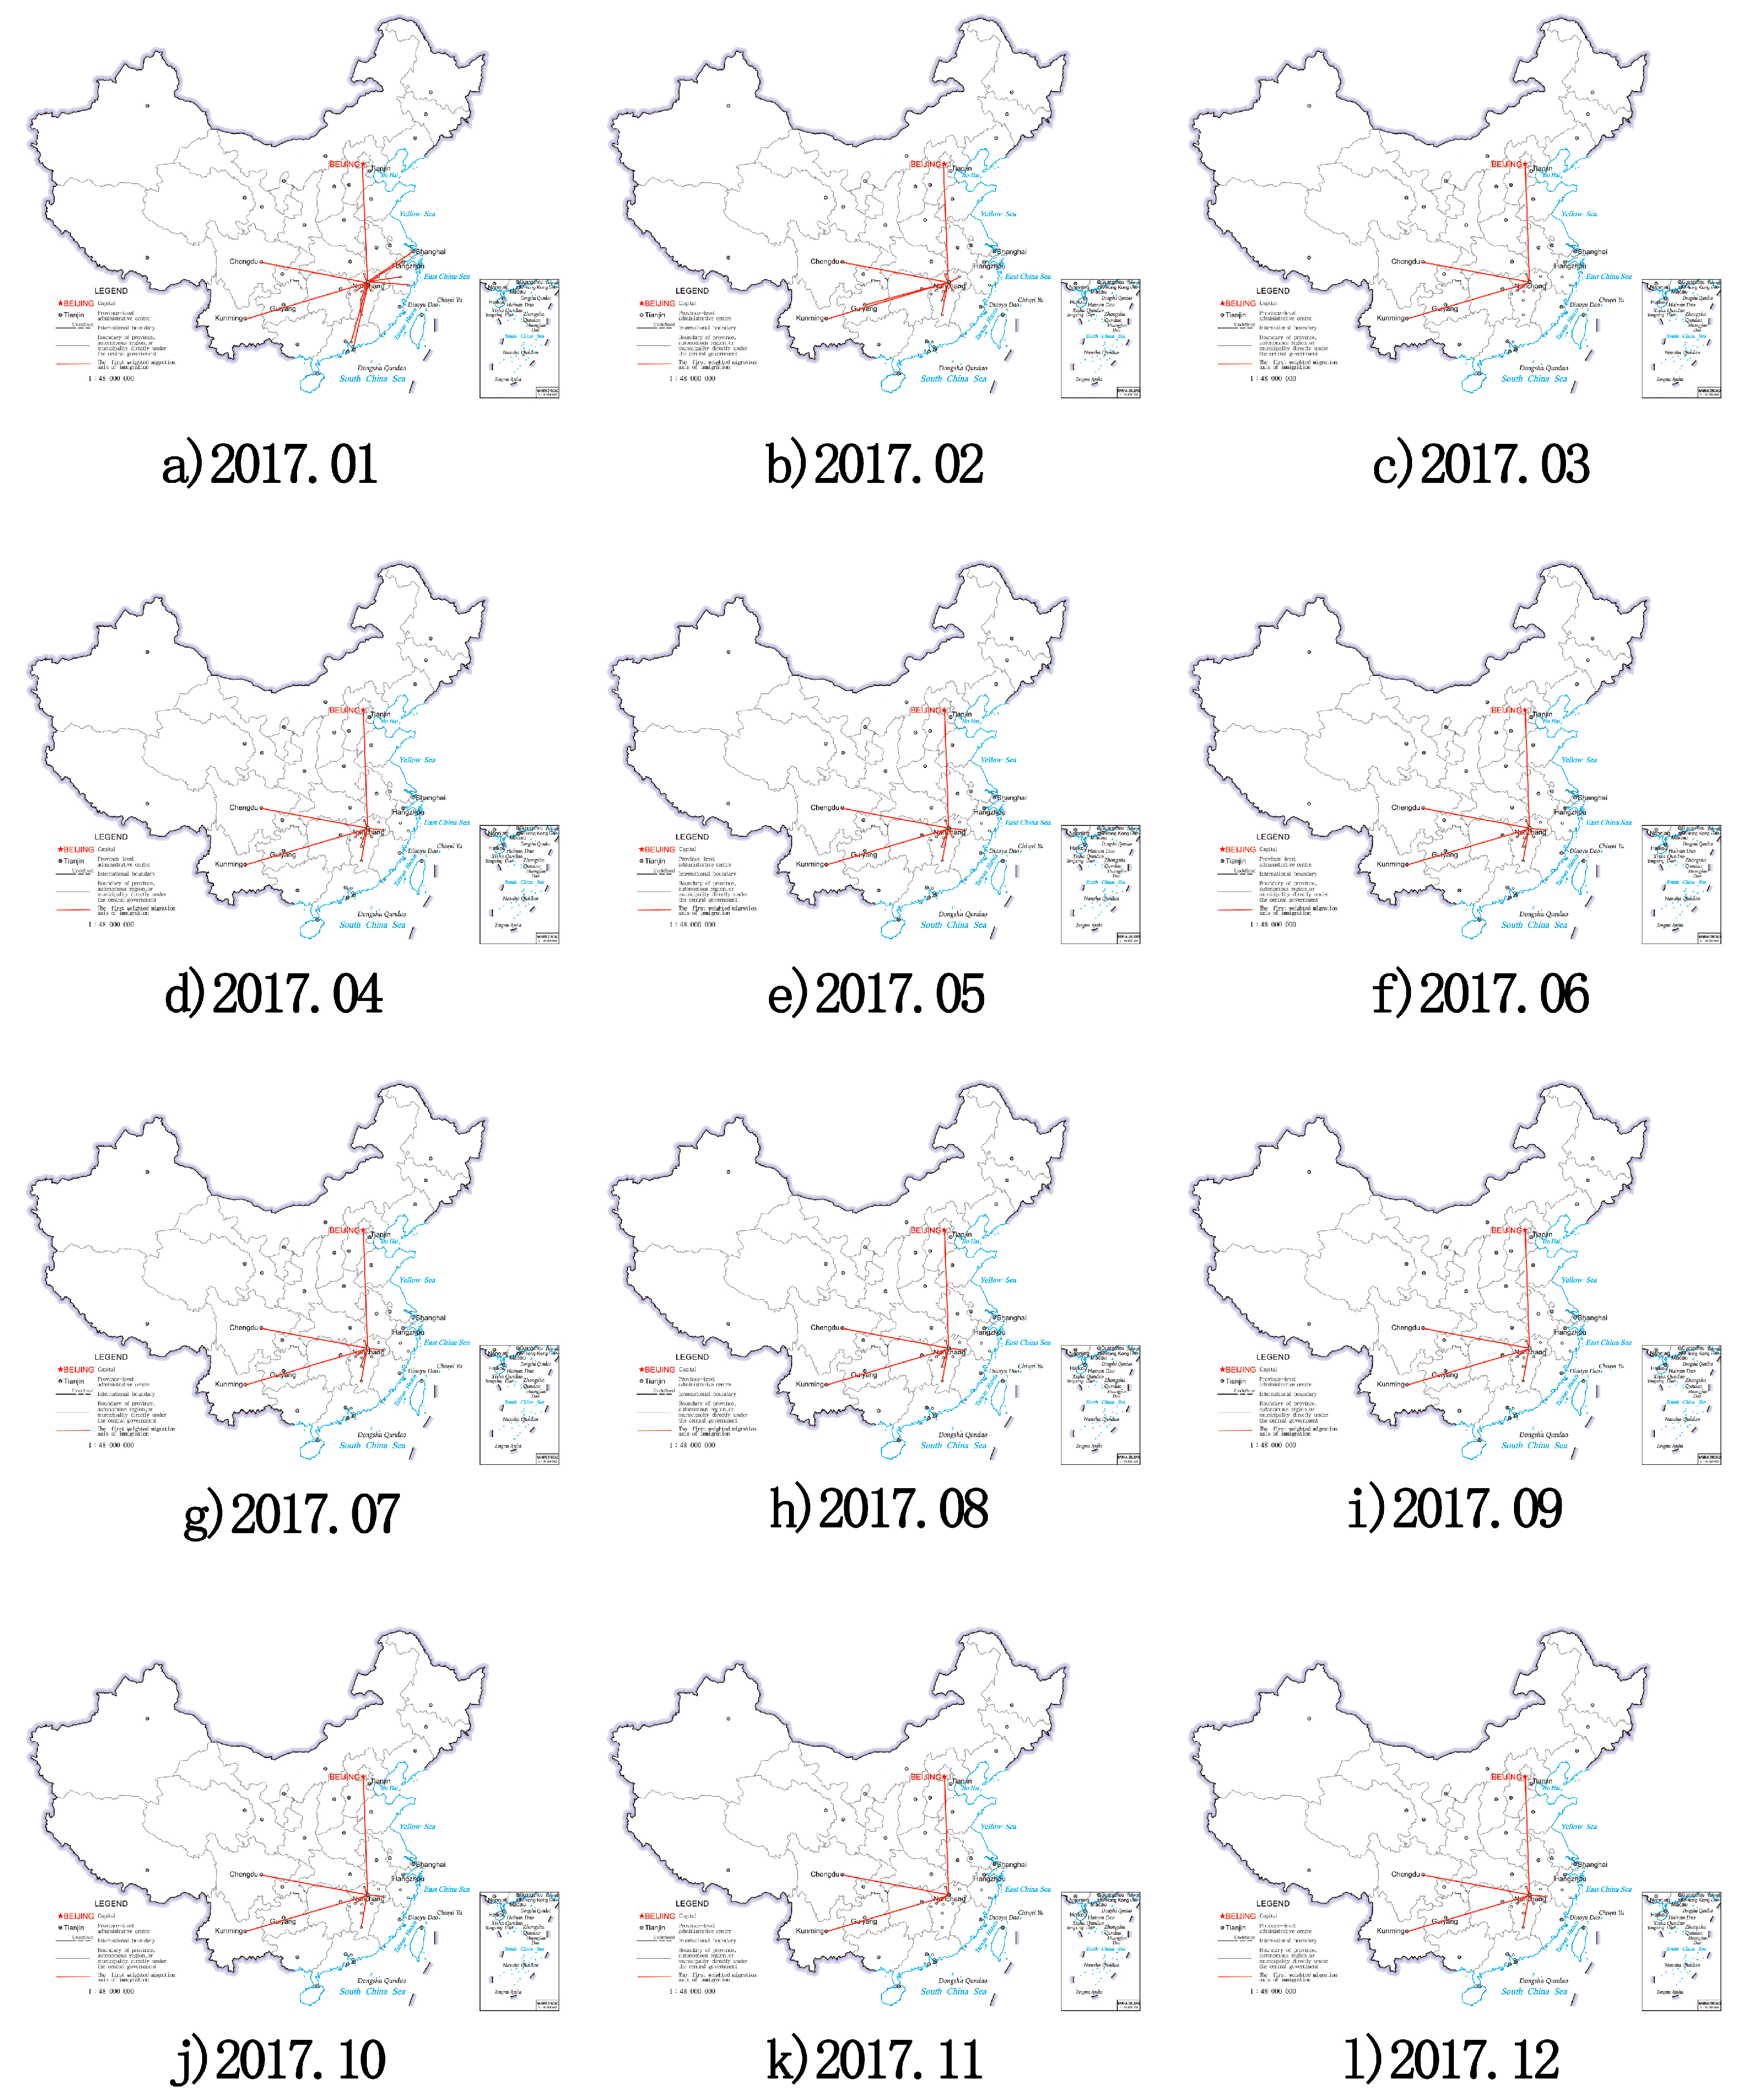
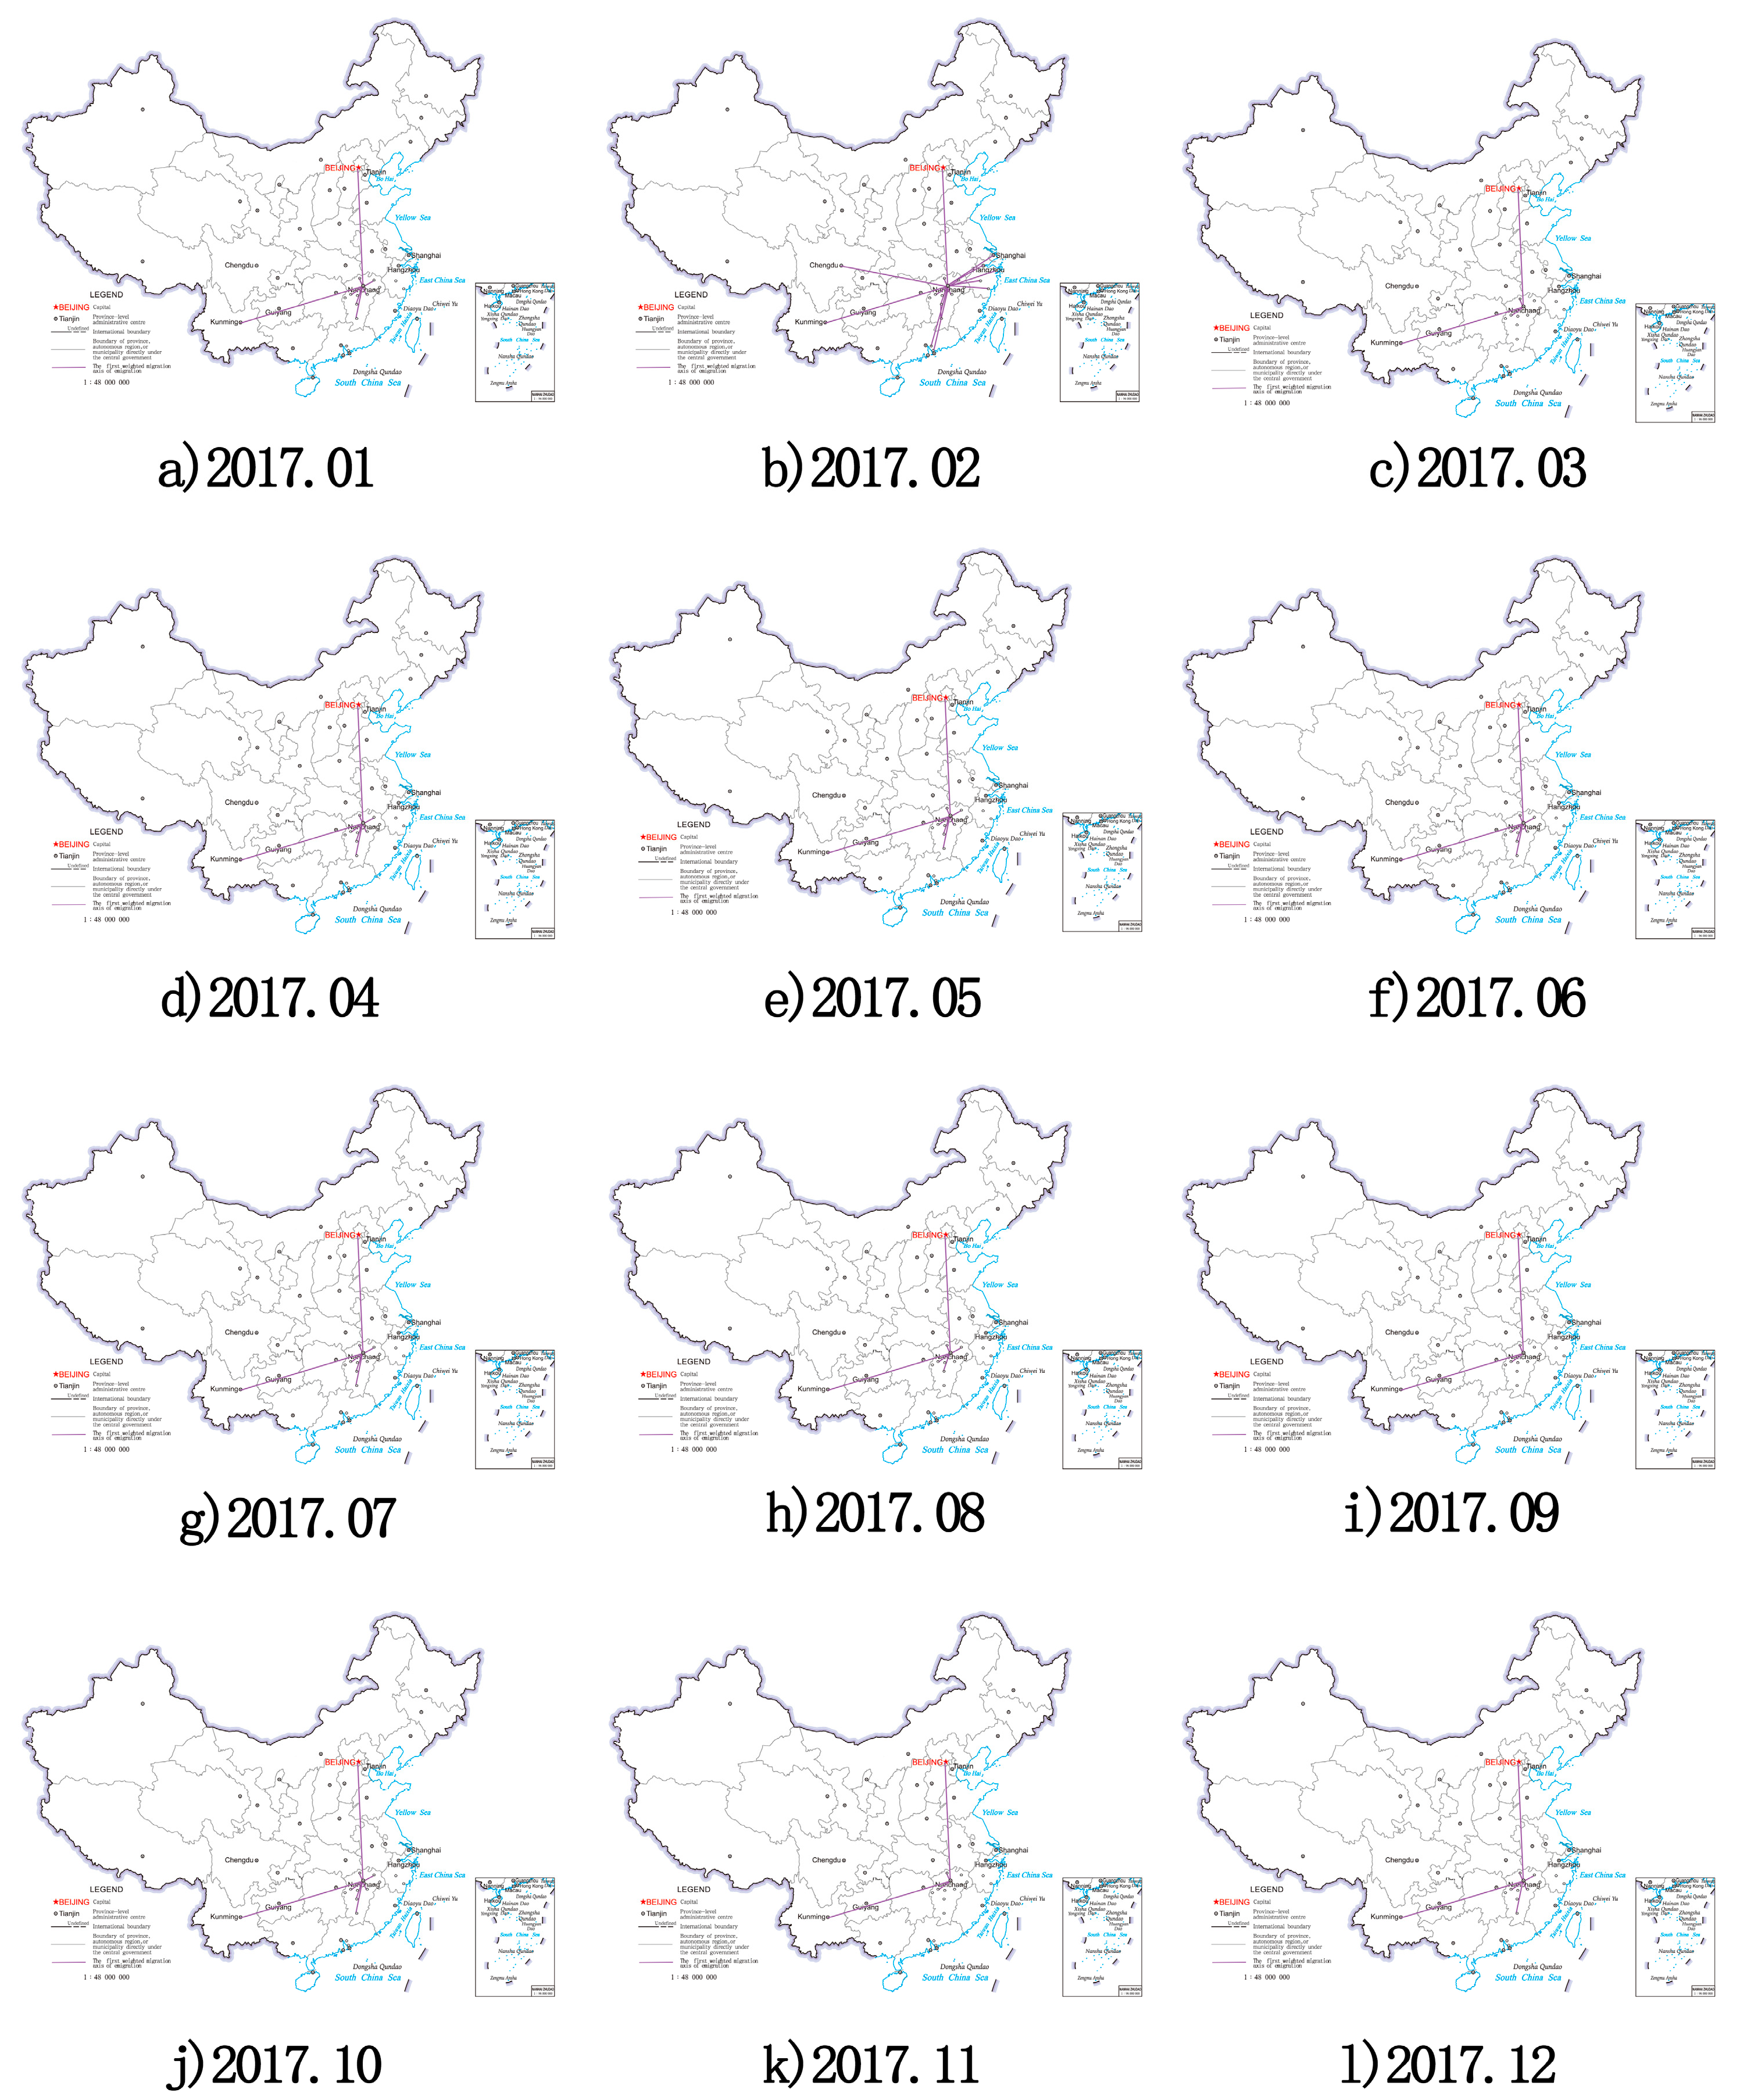
3.2.1. Spatial Structure of the First Weighted Population Migration Network

The first weighted linkage axis is defined as “weight ≥ 500 k”. The first weighted population migration axis is used to determine the maximum migration trend of node cities.
  • Analysis of the characteristics of the first weighted migration axis of immigration
The migration axis maps of the first weighted immigration in the Poyang Lake urban agglomeration for each month spanning from 2015 to 2018 are constructed using ArcGIS. As an illustrative example, Figure 6 represents the migration axis maps for the year 2017.
The primary migration axis of first-weighted immigration in the Poyang Lake city agglomeration during 2015–2018, predominantly exhibited a northward trajectory in external migration, with a secondary trend towards the west. Southward and eastward migrations were relatively infrequent. The major destinations for northbound migration were Beijing, while Chengdu and Kunming were significant for westward migration. In the eastward direction, Shanghai drew migrants, and Shenzhen was the primary destination for those moving southward. Notably, migration activities were more pronounced during the months coinciding with the Spring Festival. The overall spatial structure shows a “Sustainability 15 14789 i001” pattern which is presented as a bow and arrow with an opening to the northwest in most of the remaining months. The network of migration axes within the urban agglomerations is more intensive than that of external migration.
2.
Analysis of the characteristics of the first weighted migration axis of emigration
This research plots the first-weighted out-migration population migration axes of Poyang Lake urban agglomeration for each month from 2015 to 2018 based on statistical data, with 2017 serving as an illustrative example. Please refer to Figure 7 for visualization.
Analysis of First-Weighted Emigration Migration Axis Characteristics: ➀ External Migration Trends: From 2016 to 2018, except for months coinciding with the Spring Festival, migration axes exhibited notably low intensity. The primary migration directions are predominantly northward and westward, with key destinations being Beijing in the northward direction and Kunming in the westward direction. In 2015, migration axes also primarily favored the northward and westward directions. Notably, between May and August, there is an increased prevalence of northward axes, while in other months, the number of axes remains low. The overarching spatial structure is characterized by a pattern resembling a “Sustainability 15 14789 i002” with an obtuse angle opening to the northwest. ➁ Internal Migration Patterns: In the context of internal migration, the density of axial connections among nodes within the urban agglomerations remains relatively low. However, it is slightly denser compared to external migration.

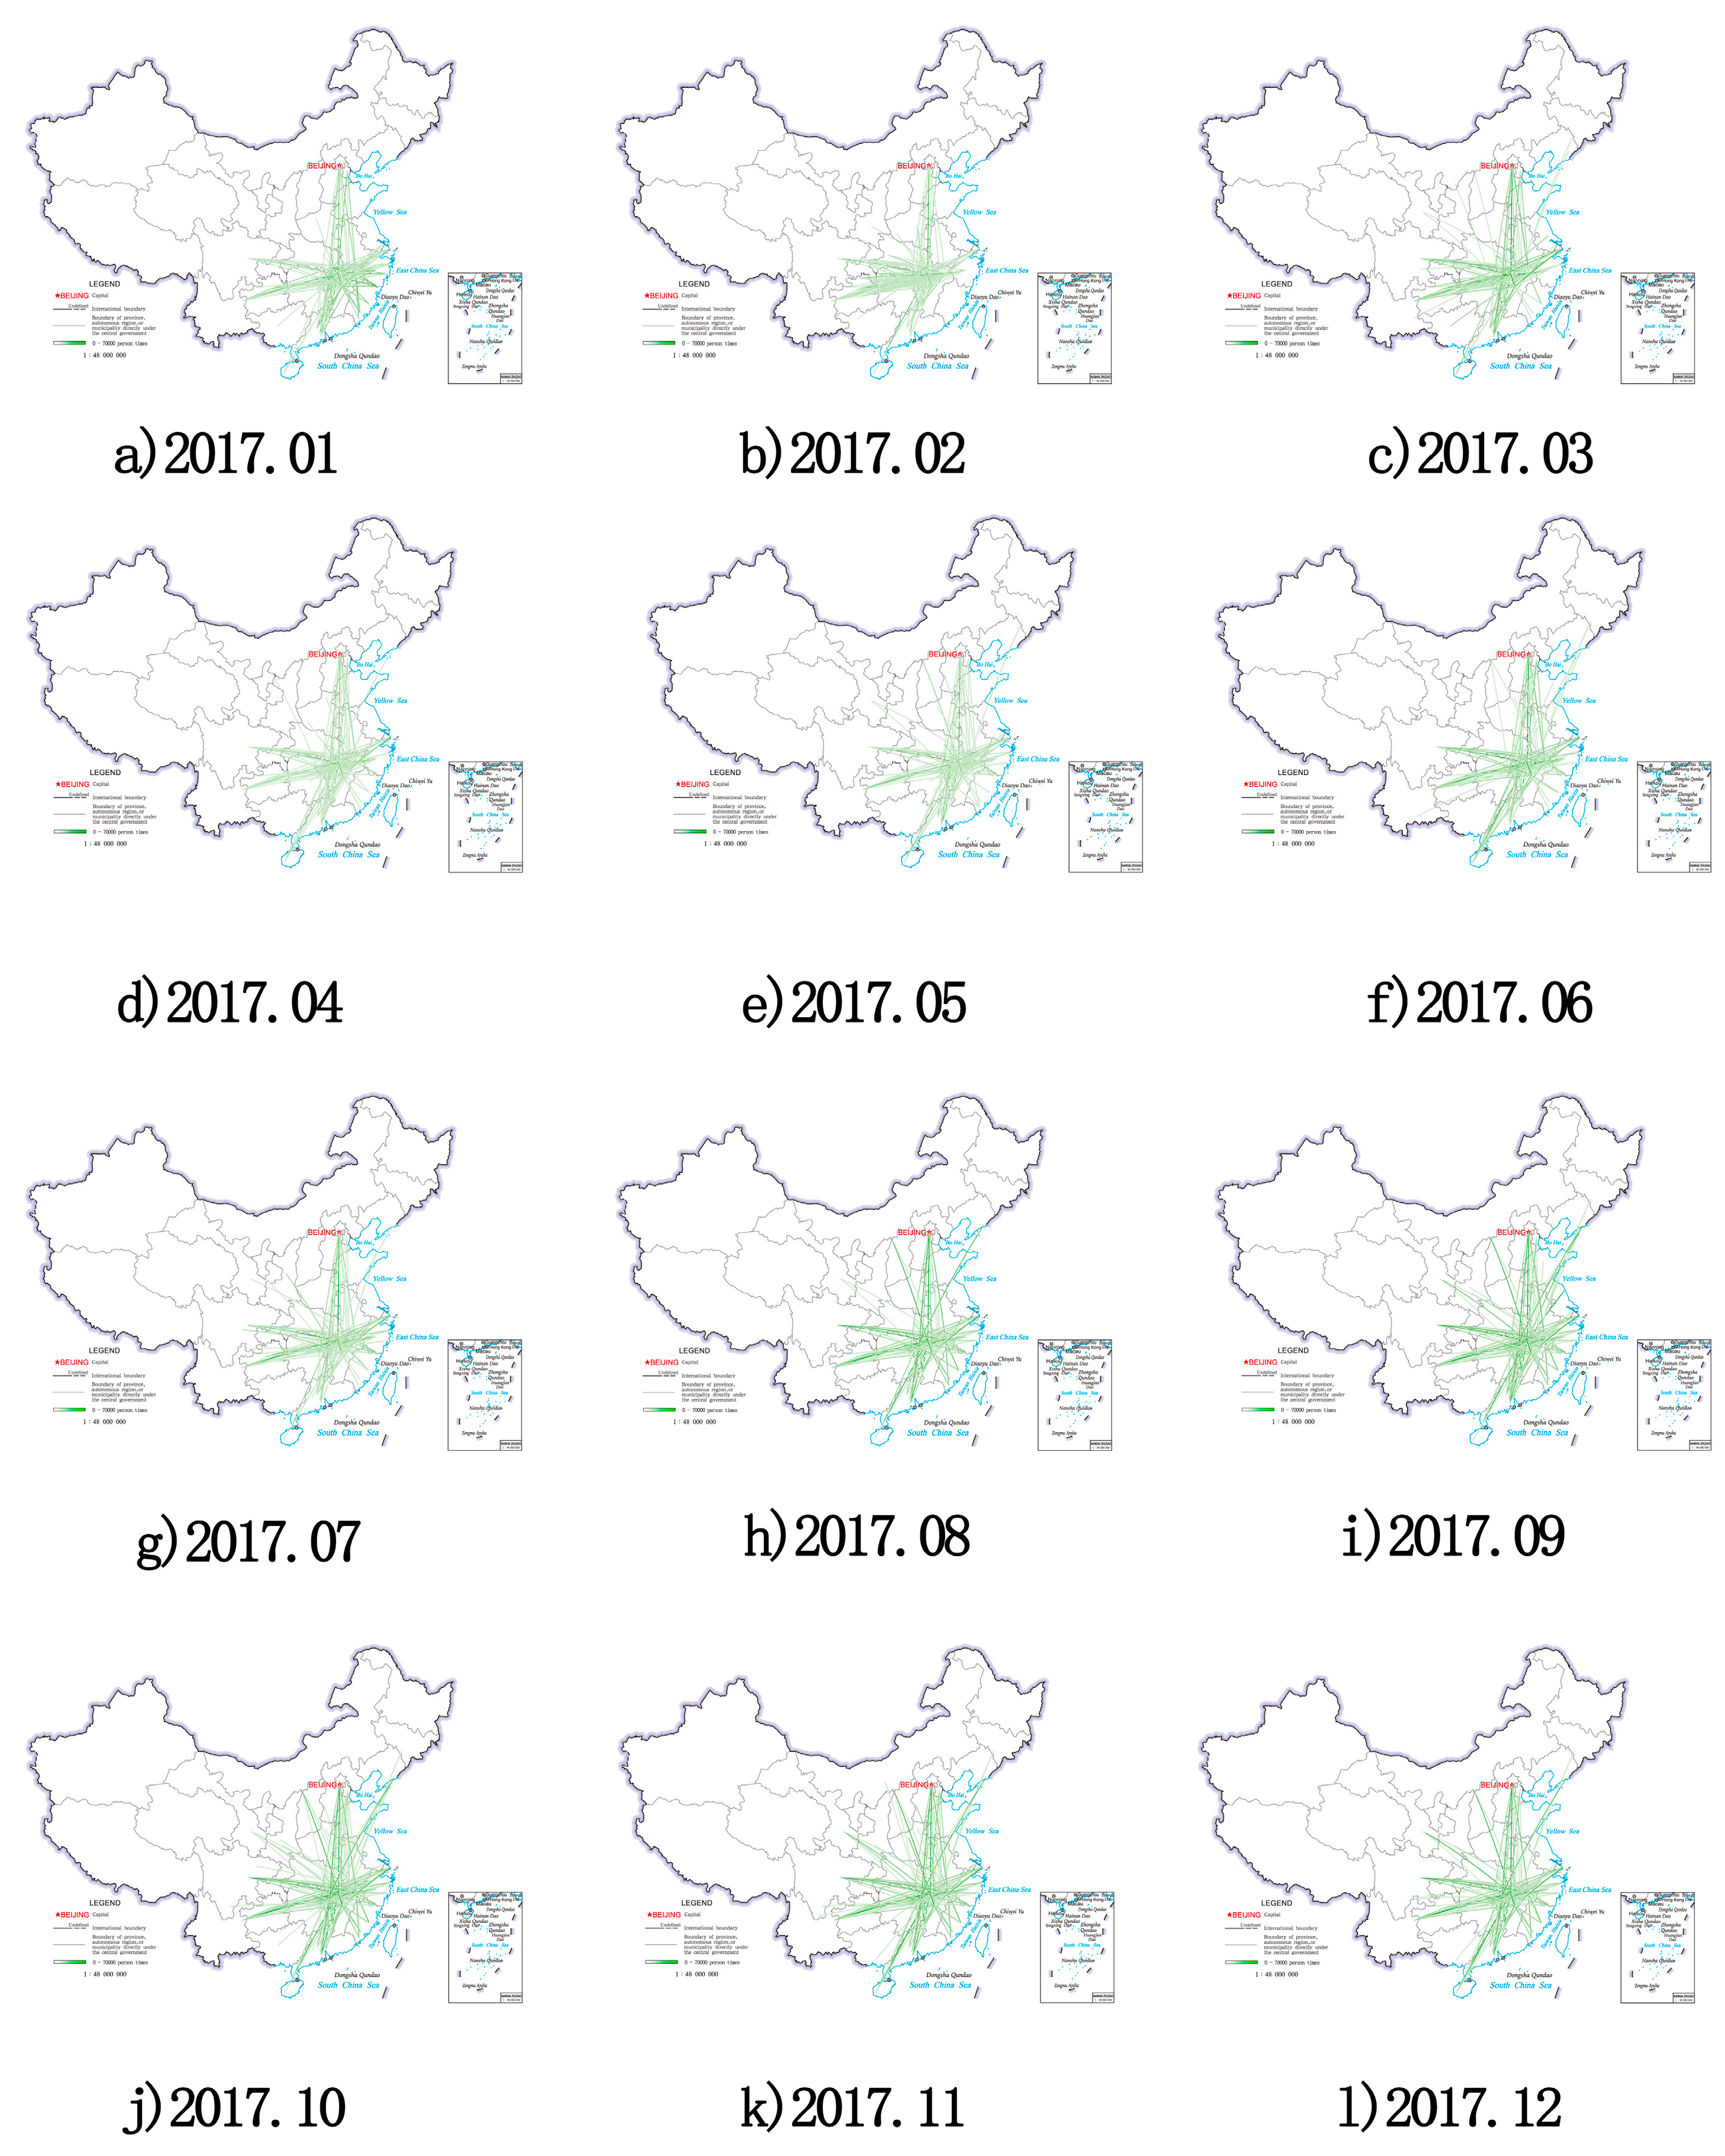
3.2.2. Spatial Network Topology Feature Analysis

Through the basic data collation, the 10 node cities in the Poyang Lake city agglomeration have migratory links with 125 cities in 2015, 154 cities in 2016, 149 cities in 2017, and 113 cities in the first half of 2018, forming spatial network links.
  • Analysis of the topological structure of the Spatial Network of the immigration
For the 10 node cities in the Poyang Lake urban agglomeration, the number of immigrating contact cities was 100 in 2015, 138 in 2016, 114 in 2017, and 98 in the first half of 2018.
Based on the migration axis and the size of the edge weight of the axis, the spatial network topology variation of population immigration in the Poyang Lake urban agglomeration is plotted for each month from 2015 to 2018 (with 2017 as the example), see Figure 8.
During the whole study period, ➀ the axes of large migratory volume show: an axial belt with the center dispersing outward in five directions: north, south, west, southwest, and east, forming a “Sustainability 15 14789 i003” pattern which exhibits a pentagonal snowflake-shaped antennal dispersion morphology; ➁ the rest of the axes show: a tentacle dispersal spatial network pattern; ➂ the overall spatial structure forms a “Sustainability 15 14789 i004 + tentacle dispersal” shaped spatial network pattern.
The color grading of the migratory volume determines that the north direction is the main migratory direction, followed by the southwest, then the west and south directions, and the weakest is the east direction.
The trend of spatial network linkage intensity is basically the same each year. In the first half of the year, the spatial network linkage intensity is stronger in the months related to the Spring Festival, and the migration volume and intensity in the five directions are significantly enhanced; in the second half of the year, the phenomenon of increased migration volume is also more obvious in July–August. During the two peak months, the spatial network linkage was stronger, and the main trend of migration was still dominated by the north direction, followed by the west and southwest directions, while the other directions were weaker. In other months, the spatial network linkage strength is gradually weakening with the two relatively high large migrations.
2.
Analysis of the topological structure of the spatial network of the emigration
For the 10 node cities in the Poyang Lake urban agglomeration, the number of emigrating contact cities was 114 in 2015, 119 in 2016, 129 in 2017, and 99 in the first half of 2018.
Based on the migration axis and the size of the edge weight of the axis, the topological structure of the spatial network of the population emigrating from the Poyang Lake urban agglomeration is plotted for each month from 2015 to 2018, (with 2017 as the example), see Figure 9.
During the whole study cycle, ➀ the axes of large migratory volume show: an axial belt dispersing outward in five directions from the center to the north, south, west, southwest, and east, still with “Sustainability 15 14789 i005” as the main feature, but the north and southwest directions are the main migratory axial belt; ➁ the migratory axes in the rest of the directions are weaker, forming a weak tentacle dispersal-like spatial network pattern; ➂ the overall spatial structure forms a “Sustainability 15 14789 i006 + weak tentacle dispersal” shaped spatial network pattern.
The annual trends in the strength of spatial network linkages remain relatively consistent, and the trend is largely consistent with the trend in the spatial network of population immigration.

4. Discussion

4.1. Exploration of Complex Network Characteristics of Urban Agglomerations

From the perspective of population migration [21], the use of edge weight indicators to analyze the characteristics of population migration in and out of key node cities within an urban agglomeration network over time is crucial. This approach helps to identify the presence of hierarchical relationships in population migration within the urban agglomeration and highlights the significant role played by core cities in attracting and accommodating migrants. Moreover, studying the differences in population migration patterns between weekdays and special occasions [22], such as holidays or festivals, can provide valuable insights. For example, during the Spring Festival, May Day and the 11th holiday period, it has been observed that large-scale, long-distance and short-distance migrations occur regularly during special times, leading to changes in both the total volume and direction of population flow. This finding aligns with the established population flow patterns observed in major urban agglomerations like the Changsha-Zhuzhou-Xiangtan urban agglomeration and the Wuhan metropolitan area [23].
By plotting the network densities of emigration and immigration at different threshold ranges within urban agglomerations, it is possible to determine that the high-threshold network density of urban agglomerations remains consistently low, with minimal fluctuations over the study period. Conversely, the low-threshold network density tends to be relatively high and fluctuates within a certain range. These findings suggest that urban agglomerations experience limited time for large-scale migration flows and exhibit relatively weak activity in this regard. Instead, frequent small-scale migration flows are more common. This indicates that urban agglomerations lack a strong, core, internal driving force, with various other driving factors being small scale and scattered. The internal drive serves as the primary source of power for urban agglomeration development, and the pattern of population migration can most intuitively reflect the flow of various elements [24].Through an analysis of the statistical yearbooks of Jiangxi, Hunan, and Hubei provinces [25,26,27], it becomes evident that Jiangxi Province lags behind other urban agglomerations of the same level in terms of population, education, finance, industry, transport, postal and telecommunication services, domestic trade, tourism, and other multi-industry data. This serves to validate the accuracy and feasibility of the research results.
During the research cycle, the degree of centralization of the urban agglomeration around Poyang Lake basically lies between 0.08 and 0.13, constant and low. It indicates that the status and role of the core city of urban agglomeration are relatively weak, unable to form significant agglomeration characteristics and the balanced development of different scales of aggregation points. From the network structure entropy, which is an important indicator reflecting network connectivity, it can be seen that the network structure entropy of urban agglomeration is basically in the range of 0.5–0.6, which indicates that the connectivity of the network is general, and the small-world nature is relatively weak. Several previous studies have also examined various aspects of the economic linkage between urban agglomerations. For example, Guo Weidong [28] and others studied the economic linkage between urban agglomerations through the urban flow model, Wang Shengyun [29] and others used QAP and other models to study the transport cost between urban agglomerations, and Chen Bei [30] and others used the Super-SBM-DEA model to analyze the innovation efficiency of urban agglomerations. All the related studies reflect the weak status of core cities in the urban agglomeration around Poyang Lake from different perspectives, general network connectivity and relatively weak small-worldliness, which is consistent with the results of this study.

4.2. Characterization of the Spatial Structure of Urban Agglomeration

4.2.1. Impact of First Weighted Population Migration on Urban Agglomeration

First weighted is an indicator that characterizes the main flow direction in which urban agglomeration migration occurs. Through the study, it was determined that the distinctive feature of population migration in urban agglomeration is that intra-provincial migration is more frequent than extra-provincial migration. The flow distance of migrating populations can reflect the characteristics of population urbanization, and there is a great difference in the impact of near-, medium- and long-distance migration on urbanization [31,32,33,34]. The QAP regression analysis shows that geographical proximity significantly affects the strength of urban network association [35]. Based on the analysis of the city almanac, combined with the results of this research, it can be determined that the population migration pattern of urban agglomeration is to some extent consistent with the positive relationship between distance and the degree of urbanization, indicating that it is feasible to reflect the degree of urbanization in this way intuitively.

4.2.2. Exploration of Spatial Network Topology

The spatial network topology of urban agglomeration constructed by point-axis theory in this study can clearly reflect the spatial distribution characteristics of migrating populations in the urban agglomeration around Poyang Lake. The study analyzes the network’s topological structure features hierarchically from the perspective of the quantitative hierarchy of migration, and determines that the trend of population migration in urban agglomeration basically remains consistent and remains basically constant in spatial structure. The research results are consistent with Niu Fangqu [36], Zhao Miaoxi [37], Liu Xiangping [38], Wang Rui [39] and others from exploring the construction of multi-level spatial structure of urban agglomeration. Through the study, it is determined that there exists a multi-level spatial structure network in the urban agglomeration around Poyang Lake, and the same spatial topology exists at different levels, with high-level tier, core cities radiating sub-core cities and lower tier cities, and sub-core cities radiating lower tier cities, forming a multi-level spatial network structure and emphasizing the multi-level nature of the inter-connections between cities.

4.3. Recommendations for Optimizing the Network and Spatial Structure of Urban Agglomeration

Firstly, in view of the overall variability of population size and migration volume of urban agglomeration, it is necessary to focus on the policy tilt and support for the core cities to cultivate core growth poles. From the results, the current node cities within the urban agglomeration have some variability in the amount of population migration, but there is no absolute advantage between the core city of Nanchang and the sub-core cities, such as Jiujiang, Yichun, Shangrao and Ji’an. The role of the polar nucleus of the urban agglomeration is of vital importance to the healthy development of the urban agglomeration, so it is necessary to give it greater policy attention and support in terms of transport, economy and population. For example, it could be a policy to require enterprises with an annual output value of more than 10 million in other cities to relocate to the core city of Nanchang, for example, in order to strengthen the role of the city’s growth pole. Furthermore, the management and construction of classification and grading should be adopted to optimize the key cities for different grades of urban agglomeration, as the core city of the level, and to strengthen the network radiation system of the hierarchical structure, so as to form different echelons for healthy and sustainable development. Based on the results of the study, the three levels of urban agglomeration will be divided into three levels of city sequences, and one–two key cities will be identified in each level, so as to construct the spatial structure tree, and form an orderly queue for steady development. Ultimately, it is important to clarify the positioning of city development and strengthen regional city cooperation. There are problems of overlapping functions and industrial overlap among the cities in urban agglomerations, so it is necessary to clarify the functions and development positioning of the cities in each urban agglomeration on the whole, form a good ecology of urban agglomeration development, avoid vicious competition, and promote regional cooperation.

4.4. Directions for Future Research

Population migration is the basis of the flow of various factors between cities, which deeply clarifies the interactions and exchanges between cities. During the research process, it has been deeply recognized that there are still a number of aspects that can be studied in depth: firstly, continuous research will be conducted. In order to predict the future development trend more scientifically and accurately, the research will be divided into multiple stages, with three years as a research stage for continuous research, and will be compared between multiple stages, hoping to produce more scientific and reasonable analysis results. Furthermore, research on the spatial structure of urban agglomeration under the joint action of multiple flows [40,41,42] will be carried out, with population migration as a guide. Population migration, as a kind of “flow”, is also the main carrier of factor transfer between cities. However, there are still other forms of “flow”. Taking population migration as a guide, we will explore other forms of flow to study the spatial structure of the complex network of urban agglomeration around Poyang Lake. In the future, we can add many kinds of “flow” elements to study the urban agglomeration from multiple angles and directions. Finally, through the spatial network change of population migration, the aspects of resource allocation and policy-making are analyzed. The purpose of analyzing the population migration network is to visualize the migration pattern of the population with data. In the future, the spatial network model will be optimized according to the continuous accumulation of data, and long-term dynamic simulation correction will be adhered to, with the expectation that the model changes will be used to more accurately provide technical support for the formulation of policies related to urban agglomeration.

5. Conclusions

This study focuses on the Poyang Lake urban agglomeration, with the 10 node cities as the primary research subjects. Leveraging population migration data from Tencent’s Location Big Data platform spanning 2015 to 2018, the research has constructed a comprehensive network indicator system and a spatial structure network model. This model is founded upon the principles of point-axis theory from spatial network theory and oriented weighted network theory from complex networks. Our analysis aims to elucidate the intricate spatial structure of population migration within the Poyang Lake urban agglomeration.
The examination of complex network indicators in the Poyang Lake urban agglomeration reveals distinctive hierarchical characteristics among cities. This underscores the gradual refinement in the development of the spatial network within the agglomeration. By considering inward and outward migration edge weights, the 10 node cities can be classified into three distinct levels, characterized by clear hierarchical attributes: a single city in the highest tier functions as the core city, followed by four cities in the second tier, and five cities in the third tier. A comprehensive assessment of network density indicates a consistent long-term state for each threshold interval, reflecting relatively weak network connectivity. However, when considering the degree of centralization and network structure entropy, a contrasting narrative emerges. These indicators showcase the lowest degree of centralization and the highest network structure entropy, indicating overall poor network connectivity and limited small-world characteristics.
An analysis of the spatial structure of the Poyang Lake urban agglomeration reveals several notable features. Firstly, the primary axis of the urban agglomeration remains relatively stable, while the internal network connectivity predominantly adheres to a “core-non-core” model, displaying characteristics of geographic proximity. Spatial structures exhibit diversity, manifesting as “weak core city + edge city” and “node city + outer network city” arrangements. This diversity results in varied network connection trends, fostering both “core-edge” connections and inter-regional linkages.
Core cities exert substantial influence on peripheral cities, fostering close connections, which, in turn, prompt peripheral cities to rely on core cities for development. Additionally, the urban agglomeration’s nodes demonstrate substantial cross-region migration patterns with cities in the external network, indicating a propensity for multi-directional migration influenced by certain intrinsic factors. This multifaceted network behavior reinforces the open and interrelated nature of the urban agglomeration around Poyang Lake.

Author Contributions

Conceptualization, Y.Z.; methodology, Y.Z.; software, Y.Z.; validation., J.Q. and Y.C.; formal analysis, Y.Z.; investigation, Y.C.; resources, J.Q.; data curation, Y.C.; writing—original draft preparation, Y.Z.; writing—review and editing, J.Q.; visualization, Y.Z.; supervision, Y.Z.; project administration, Y.Z.; funding acquisition, Y.Z. All authors have read and agreed to the published version of the manuscript.

Funding

This research was funded by the Jiangxi Province University Humanities and Social Sciences Research Project (Project Number: YS22113).

Institutional Review Board Statement

Not applicable.

Informed Consent Statement

Not applicable.

Data Availability Statement

Applicable data are contained within this article.

Conflicts of Interest

The authors declare no conflict of interest.

References

  1. Gottmann, J. Megalopolis or the Urbanization of the Northeastern Seaboard of the US. Econ. Geogr. 1957, 33, 189–200. [Google Scholar] [CrossRef]
  2. Fang, C. Progress and the future direction of research into urban agglomeration in China. Acta Geogr. Sin. 2014, 69, 1130–1144. [Google Scholar]
  3. Deng, H.; Li, H. Identification of Urban Spatial Structure of Pearl River Delta Urban Agglomeration Based on Multisource Spatial Data. J. Urban Plan. Dev. 2023, 149, 05023010. [Google Scholar] [CrossRef]
  4. Cao, W.; Dong, L.; Cheng, Y.; Wu, L.; Guo, Q. Constructing multi-level urban clusters based on population distributions and interactions. Comput. Environ. Comput. Environ. Urban Syst. 2023, 99, 101897. [Google Scholar] [CrossRef]
  5. Wang, X.; Zhao, Z.; Cao, W.; Wang, S. The network characteristics and provincial boundary effect of urban agglomerations in the Yangtze River Delta Based on the perspective of population mobility. Geogr. Res. 2021, 40, 1621–1636. [Google Scholar]
  6. Zhang, W.; Hao, Z.; Wang, Y.; Wei, R. Spatial network and influencing factors of population mobility in urban agglomeration. Geoscience 2023, 43, 72–81. [Google Scholar]
  7. Hou, L.; Sun, J. Evaluation of network structure resilience of Chengdu-Chongqing urban agglomeration from the perspective of complex networks. World Reg. Stud. 2022, 31, 561–571. [Google Scholar]
  8. Zhang, X.; Han, H.; Tang, Y.; Luo, G. Research on the characteristics of urban network structure in China based on Baidu migration data. J. Geo-Inf. Sci. 2021, 23, 1798–1808. [Google Scholar]
  9. Yue, H.; Qi, J.; Chen, Y.; Chen, L.; Chen, H. Centrality and symmetry analysis of network structure of three major urban agglomerations in China based on Baidu migration data. Surv. Mapp. Bull. 2022, 110–116. [Google Scholar]
  10. Fan, Y.; Ma, W. Analysis of the spatial network structure of Beijing-Tianjin-Hebei urban agglomeration based on economic correlation. Reg. Econ. 2022, 13, 162–165. [Google Scholar]
  11. Huang, F.; Yang, T. Spatial connectivity and social network of Pearl River Delta cities—An analysis based on “flow space”. Trop. Geogr. 2022, 42, 9. [Google Scholar]
  12. Ma, S.; Wu, Y.; Chen, X. Structural Resilience Analysis of Multimodal Transportation Networks in Urban Agglomeration: A Case Study of Guanzhong Plain Urban Agglomeration. J. Tsinghua Univ. (Nat. Sci. Ed.) 2022, 62, 1228–1235. [Google Scholar]
  13. Wang, W.; Yan, X. Research on the evaluation of smart urban agglomeration development based on entropy weight method. Ind. Appl. 2022, 11, 61–72. [Google Scholar]
  14. Chakraborty, S.; Maity, I.; Patel, P.; Dadashpoor, H.; Pramanik, S. Spatio-temporal patterns of urbanization in the Kolkata Urban Agglomeration: A dynamic spatial territory-based approach. Sustain. Cities Soc. 2021, 67, 102715, republished. [Google Scholar] [CrossRef]
  15. Asogwa, F.; Amuka, J.; Igwe, A.; Nkalu, C. Dynamics of population, urban agglomeration, and economic growths in Sub-Saharan Africa: Evidence from panel data. J. Public Aff. 2020, 22, e2447. [Google Scholar] [CrossRef]
  16. Lv, K.; He, Y. Economic agglomeration, technological progress, and carbon emission intensity in the Yangtze River Delta urban agglomeration empirical study based on spatial measurement and mediating effects. Ecol. Econ. 2021, 37, 13–20. [Google Scholar]
  17. Zeng, P.; Pang, Y.F. Regional differences and convergence analysis of economic development of Chinese urban agglomeration. Econ. Empirics 2023, 17, 132–136. [Google Scholar]
  18. Bureau of Statistics of the People’s Republic of China. China Statistical Yearbook; China Statistics Press: Beijing, China, 2018.
  19. Jiangxi Provincial Bureau of Statistics; National Bureau of Statistics; Jiangxi Survey Team. Jiangxi Statistical Yearbook; Jiangxi Provincial Bureau of Statistics: Nanchang, China, 2019.
  20. Guo, S.; Lu, Z. Fundamental Theory of Complex Network; Science Press: Beijing, China, 2016. [Google Scholar]
  21. Wang, X.; Gao, X. The Evolution of China’s Floating Population and Its Impact on Urbanization: A Comparative Analysis Based on Inter- and Intra-Provincial Perspectives. Sci. Geogr. Sin. 2019, 39, 1866–1874. [Google Scholar]
  22. Niu, X.; Zhu, Y. Spatial Patterns of Population Urbanization in China under the Perspective of Population Migration—A Study Based on Baidu Migration Data. Urban Plan. 2023, 1–10. [Google Scholar]
  23. Zheng, B.; Zhong, Y. Study on Spatial Structure of Population Migration Network of Urban Agglomeration in the Middle Yangtze River Based on Complex Network. Econ. Geogr. 2020, 40, 118–128. [Google Scholar]
  24. He, X.; Chen, X. Influence and spatial effect of population mobility on regional innovation capacity-example of 70 cities in three major urban agglomeration of Yangtze River Economic Belt. West. Forum 2023, 33, 109–124. [Google Scholar]
  25. People’s Government of Jiangxi Province. Available online: http://www.jiangxi.gov.cn/col/col424/index.html (accessed on 5 October 2023).
  26. People’s Government of Hunan Province. Available online: http://www.hunan.gov.cn/zfsj/tjnj/tygl.html (accessed on 5 October 2023).
  27. Hubei Provincial Statistics Bureau. Available online: https://tjj.hubei.gov.cn/tjsj/ (accessed on 5 October 2023).
  28. Guo, W.; Zhong, Y.; Fu, Y. Comparison of economic linkage capacity of urban agglomeration in the middle reaches of Yangtze River. J. South China Norm. Univ. (Nat. Sci. Ed.) 2019, 51, 79–87. [Google Scholar]
  29. Wang, S.; Song, Y.; Zhang, Y.; Li, J. Spatial association mechanism of urban network in the middle reaches of Yangtze River urban agglomeration under the perspective of transport cost. Econ. Geogr. 2020, 40, 87–97. [Google Scholar]
  30. Chen, B.; Peng, W.; Liu, Y. Spatio-temporal evolution and driving factors of green innovation efficiency in urban agglomeration in the middle reaches of the Yangtze River. Econ. Geogr. 2022, 42, 43–49. [Google Scholar]
  31. Dan, J.; Yin, J. Migration Distance of Floating Population and Regional Differences of Its Influence on Urbanization. Acta Sci. Nat. Univ. Pekin. 2017, 53, 487–496. [Google Scholar]
  32. Zhang, H. Impacts of Statistical Belonging of Floating Population on Urbanization Level. City Plan. Rev. 2018, 42, 17–24. [Google Scholar]
  33. Ma, Z.; Zhang, S.; Zhao, S. Study on the Spatial Pattern of Migration Population in Egypt and Its Flow Field Characteristics from the Perspective of “Source-Flow-Sink”. Sustainability 2021, 13, 350. [Google Scholar] [CrossRef]
  34. Zhao, S.; Wang, X.; Ma, Z. Study on Fractal Characteristics of Migration-Population Flow—Evidence from Egypt. ISPRS Int. J. Geo-Inf. 2021, 10, 45. [Google Scholar] [CrossRef]
  35. Wang, Y. Research on the characteristics of spatial network structure of urban agglomeration in Yangtze River Delta. Stat. Obs. 2022, 6, 69–73. [Google Scholar]
  36. Niu, F.; Liu, W.; Song, T.; Hu, Z. A multi-level spatial structure analysis algorithm for urban agglomeration study in China. Geogr. Res. 2015, 34, 1447–1460. [Google Scholar]
  37. Zhao, M.; Lai, Z.; Zhong, Y.; Derudder, B. Polycentric network topology of urban agglomerations in China. Adv. Geogr. Sci. 2016, 35, 376–388. [Google Scholar]
  38. Liu, X.; Liu, H.; Zou, B.; Jin, Y.; Yi, Y.; Wang, J. Comparison of hierarchical structure of urban agglomeration based on urban linkage network. Econ. Geogr. 2021, 41, 55–61+91. [Google Scholar]
  39. Wang, R.; He, W.; Lu, C. Study on the Network Structure Characteristics of Three National-level Urban Agglomerations and Their Hierarchical Linkages. J. Hunan Univ. Technol. 2022, 36, 90–98. [Google Scholar]
  40. Hu, H.; Huang, X.; Li, P.; Zhao, P. Comparison of network structure patterns of urban agglomerations in China from the perspective of space of flows: Analysis based on railway schedule. J. Geo-Inf. Sci. 2022, 24, 1525–1540. [Google Scholar]
  41. Wang, S.; Gao, S.; Wang, Y. Spatial structure of the urban agglomeration based on space of flows: The study of the Pearl River Delta. Geogr. Res. 2019, 38, 1849–1861. [Google Scholar]
  42. Wang, J.; Jing, Y. Comparison of spatial structure and organization mode of inter-city networks from the perspective of railway and air passenger flow. Acta Geogr. Sin. 2017, 72, 1508–1519. [Google Scholar]
Figure 1. Location of study area.
Sustainability 15 14789 g001
Figure 2. Summary of the emigrating edge weights and immigrating edge weights of 10 node cities in the Poyang Lake urban agglomeration, 2015–2018.
Sustainability 15 14789 g002
Figure 3. Network density of emigration three levels network in the Poyang Lake urban agglomeration, 2015–2018.
Sustainability 15 14789 g003
Figure 4. Network density of immigration three levels network in the Poyang Lake urban agglomeration, 2015–2018.
Sustainability 15 14789 g004
Figure 5. Degree of centralization and network structure entropy in the Poyang Lake urban agglomeration, 2015–2018.
Sustainability 15 14789 g005
Figure 6. The first weighted migration axis maps of immigration in the Poyang Lake urban agglomeration for each month in 2017.
Sustainability 15 14789 g006
Figure 7. The first weighted migration axis maps of emigration in the Poyang Lake urban agglomeration for each month in 2017.
Sustainability 15 14789 g007
Figure 8. The spatial network topology variation of population immigration in the Poyang Lake urban agglomeration for each month in 2017.
Sustainability 15 14789 g008
Figure 9. The spatial network topology variation of population emigration in the Poyang Lake urban agglomeration for each month in 2017.
Sustainability 15 14789 g009
Disclaimer/Publisher’s Note: The statements, opinions and data contained in all publications are solely those of the individual author(s) and contributor(s) and not of MDPI and/or the editor(s). MDPI and/or the editor(s) disclaim responsibility for any injury to people or property resulting from any ideas, methods, instructions or products referred to in the content.

