Article

Research on Sustainable Development of Mining Goaf Management Based on Economic Models

College of Energy and Mining Engineering, Shandong University of Science and Technology, Qingdao 266590, China
*
Author to whom correspondence should be addressed.
Sustainability 2023, 15(20), 14772; https://doi.org/10.3390/su152014772
Submission received: 31 July 2023 / Revised: 8 October 2023 / Accepted: 9 October 2023 / Published: 11 October 2023
(This article belongs to the Section Economic and Business Aspects of Sustainability)

Abstract

:
The sustainable development of mines has been the focus of attention in recent years. In China, there are a large number of untreated mined-out areas, and a series of disasters caused by the instability of the goaf will bring heavy blows to people’s safety and financial resources. Filling treatment will lead to increasing costs and decreasing profits, which will seriously reduce the motivation of mining enterprises and even lead to a moral hazard. Therefore, the analysis of the economic benefits of goaf control plays a vital role in the sustainable construction and long-term development of mines. This paper proposed the mined-out area treatment economic model. The proposed method employs the guiding philosophy of the newsboy model to create a mathematical economy model that provides the basis for a goaf management mode for mines. The following research results were obtained: (1) The economic model of the mined-out area backfilling treatment is constructed, which is classified as three different modes. (2) Combined with mathematical derivation and simulation, the influence of relevant variable parameters on each type of filling mode is discussed. (3) Various types of goaf filling treatment mode are compared with a non-filling scheme (benchmark mode), to provide theoretical support to help mining enterprises choose appropriate filling schemes. The results show that the economic model of mined-out area management provides the optimal mode for mined-out area filling, and the balance of tailings and ultra-high-water filling material procurement is realized, resulting in maximum profits. In this paper, we explain how the use of economic thinking has an important impact on the sustainable development of safety goaf management.

1. Introduction

A mined-out area is an empty area left after ore is stripped from the mine body via mining technology [1,2]. The mined-out area is an important hidden danger, threatening mine safety due to its characteristics of strong concealment, poor spatial distribution regularity, strong accident occurrence, and serious consequences [3,4]. The mine pillars left by the goaf will cause a large amount of waste of mineral resources, and these mined-out areas are a potential hidden danger in mine safety production. With the extension of time, the long-standing goaf eventually collapses, the roof falls, and the collapsed rock will instantly bury personnel, equipment, and facilities, block the roadway, and cause personnel to be trapped. It creates high-velocity air currents and huge shock waves. It will also cause surface collapse of the mining area and damage buildings. Damage to the water barrier layer leads to underground water inrush and goaf water permeation; it even causes major geological disasters, such as mine earthquakes, mountain deformation, and landslides. This seriously threatens the lives of surrounding villagers and adversely affects the sustainable development of mining areas [5,6,7,8]. Therefore, researchers at home and abroad have conducted a lot of valuable research about mined-out area management. To better illustrate this, in order to eliminate a series of hidden dangers by the goaf, Ding Zhu et al. [9] conducted an in-depth study on filling materials, using Portland cement, sulfoaluminate cement, and alkali-activated cement as cementing materials for tests, and they analyzed the influence of different water–cement ratios on filling strength. The results show that alkali-fired cement meets filling strength requirements better and has lower environmental load than other materials. Yang Pan et al. [10] prepared three kinds of magnesia-cinder-based gel materials to explore the possibility of goaf filling through fluidity, leaching property and compressive strength. The research showed that the developed full solid-waste MCC can completely replace cement to produce filling materials, reducing the cost of filling. Li et al. [11] studied the gob-retaining technology of high-water filling material, analyzed the stress state of high-water filling body in various periods, and concluded that the width of the filling body was 3.5 m through numerical simulation and theoretical calculation, as well as that high-water filling material could well control the deformation of surrounding rock. Behera et al. [12] studied the possibility of replacing ordinary Portland cement with lead–zinc smoke furnace slag through experiments, and the experimental results showed that the paste filling material using the new material had higher strength, higher economic benefit, and lower cost. Xie et al. [13] proposed a new type of high-water material as the goaf-retaining backfill, studied the basic mechanical properties of high-water material through experiments, and revealed the damage range of goaf-retaining backfill with high-water material. This makes up for defects, such as insufficient supporting force and instability of the backfill body beside the roadway, and plays a positive role in promoting the application of high-water materials in goaf retaining and filling. Li et al. [14] adopted the deviation maximization method to rank the importance of goaf risk assessment indicators and establish an improved mutation model for risk assessment. The results show that this model plays an important role in the risk assessment of goaf and makes a significant contribution to the management of goaf and the prevention and control of mining disasters. Ma et al. [15] proposed an entropy weight–normal cloud goaf stability classification model. Taking 25 goafs in Shandong Gold Mining and Dabaoshan mine as examples, the model was applied for stability evaluation, and the results were basically consistent with the actual situation, providing an effective method for the stability evaluation of goafs. Wang et al. [16] conducted a series of stability analyses and research on the stability of the Daqiao mine goaf by combining theoretical calculation and field investigation. The results show that the depth of the pillar has an important effect on the vertical displacement of the pillar; the deeper the pillar, the greater the collapse risk, and the density distribution of the pillar is closely related to the stability of the pillar. In order to study the influencing factors of goaf surface subsidence, Liu [17] established a mechanical model of the synergistic effect between deformation and surface subsidence. The influence of different filling ratios, overburden thickness, and stope span on surface subsidence was emphatically analyzed, and the validity of the theoretical calculation was verified through engineering examples. Jia et al. [18] obtained the deformation and failure situation of a goaf and evaluated the stability of the goaf through a combination of field monitoring and numerical simulation. The results show that the northern area is relatively stable, while the southern area has a greater risk of collapse. The proposed stability analysis framework of the goaf has a far-reaching influence on the open-pit iron mine. Belibi et al. [19] analyzed the mechanical properties of cemented all-tailings backfill. The relationship between yield stress and the collapse degree of backfill was analyzed through laboratory testing, and the change in compressive strength was measured. Finally, it was determined that CWTB has an important influence on the backfill. Nabassé et al. [20] and Nasir et al. [21] proposed that the shear strength between the backfill and surrounding rock is affected by cohesion and friction. Uskov et al. [22] considered the economic benefits of developing the reserves in the west wing of Oktyabrsky Mine by using the first stope consolidation filling method and the second stope waste filling method. A feasibility study of two process design variants for the full cycle of mining, processing, and recovery of primary metals (nickel) and associated metals (copper, platinum, etc.) showed that the proposed mining system allows for a higher profit per unit of ore mining and processing. Richard et al. [23], using a new risk-adjusted discount rate method, evaluated the mine economy of the application case. The FAHP analysis results give a risk-adjusted discount rate of 11.93%, compared to the traditional assumption of 15% based on the current financial situation of Ghana. The NPV obtained from FAHP gives investors more confidence to take or not take decisions. The above scholars conducted in-depth studies on the filling materials, disaster prediction, and stability analysis of goaf management, and in the aspect of mine economic evaluation, in-depth research has been carried out to prove the importance of goaf management from the perspective of mining engineering. There is no detailed thought and theoretical research on goaf filling management from the perspective of economy, as there is a lack of relevant research on the economy of goaf management. In terms of theoretical research, Valentin et al. [24] proposed a numerical algorithm to calculate the optimal selling price, with the goal of maximizing the profit index. The optimal strategy of the inventory model in which the demand rate potentially depends on both the selling price and the inventory level is given, and the results are illustrated by numerical examples. Askar et al. [25] proposed a profit-maximizing economic model considering sales constraints, based on the theory of nonlinear dynamical systems. The influence of key system parameters on the stability and complexity of dynamic game is studied. Lee et al. [26] proposed a profit model to maximize the profit of intelligent EVCS integrating photovoltaic and energy storage systems under a dynamic pricing strategy. Numerical examples have verified the effectiveness of the model in the aspects of adaptive profit selling price, energy charging and discharging, and sales price factor sensitivity. Xiao et al. [27] proposed a profit-maximizing strategy for the cold chain of table grapes by integrating the carbon footprint. To improve the low-carbon production and sustainability of cold chain systems, life cycle assessment (LCA) was used to evaluate the carbon footprint of the whole cold chain system of table grapes, and the economic order volume (EOQ) model was used to establish a profit maximization model with the minimum carbon footprint as the goal, so as to maintain the best balance between inventory and cost. Since it was first proposed in 1956, the newsboy model has attracted a lot of attention from scholars. Later, it was also applied and expanded by scholars on this basis, and later it will better serve the theory and guide the practice [28]. Guo et al. [29] proposed to use the newsboy model to find the shipper’s optimal container shipping order quantity and the carrier’s maximum profit under the shipper’s optimal order quantity. This research can help manage and promote the container online booking system in the shipping industry. Yu [30] studied the impact of the demand uncertainty on the problem of maximizing the profit of the newsboy model. It was proved that when the secondary order cost is less than or equal to the retail price, the random large demand leads to a higher optimal profit. Ahiad et al. [31] proposed an extended newsboy model considering inventory cost, established a mathematical model to calculate the expected profit, and provided an optimal equation to obtain the optimal order quantity. Patra et al. [32] proposed a two-cycle newsboy model, which admitted that the demand was uncertain even after the disaster occurred, and corrected the demand in the second stage by using the Bayesian method, and proposed a two-stage solution method to find the pre-disaster positioning amount and post-disaster replenishment amount, so as to minimize the total expected cost of rescue operations. According to the current research, it is feasible to solve the problem of maximum profit by using the newsboy model and provide decision support. Through the modeling of demand distribution and profit function, the target is optimized by solving. At present, there is no research in combination with mine engineering.
Mined-out area management plays a vital role in mine safety, which is an important part of filling mining that cannot be ignored. But, at the same time, it also causes a certain degree of threat to mine profits, causing a series of problems such as cost increases. The choice of a goaf treatment scheme by mining enterprises has a certain impact on changes in mining profits. Therefore, the lack of analysis on the economic benefits of goaf filling treatment will lead to the failure of the filling scheme selected by mining enterprises to ensure the maximization of their own benefits, which will have a negative impact on the sustainable development of mines. Therefore, due to the problems of high cost and low profit, mining enterprises have little enthusiasm for goaf treatment, but in view of mine safety problems, they have to carry out filling treatment. On the premise of avoiding the problems of mining engineering, this paper uses an unusual economic view to conduct an economic analysis of several modes of goaf filling treatment to ensure the maximization of mine benefits. The main purpose of this paper is that for mining enterprises, the unit procurement cost of new high-water filling materials is high. If all new high-water filling materials are used in goaf filling, it may lead to a reduction in mine profits, a reduction in mine enthusiasm and even moral hazard behavior. Based on this, the economic benefit analysis of goaf filling treatment is crucial to the sustainable construction and long-term development of mines. This paper constructs an economic model of goaf filling treatment, which provides the optimal model for goaf filling treatment according to different market environments and achieves a balance in the procurement of tailing sand and new high-water materials. The mining enterprises can choose different goaf filling modes under different market conditions so as to maximize the benefits of mining enterprises. Considering this, the sales situation of tailings in the market is the innovation point in this economic model. In the real environment, the price of tailings in the market is increasing so that mining enterprises can obtain more profits. Therefore, under the premise of ensuring the safety and reliability of technology, trying to maintain the balance between the sale of tailings and the purchase of new inorganic water fixing materials, this paper is focused on this research problem: the economic model of goaf filling treatment based on the newsboy model. Firstly, the economic model of mined-out area treatment is constructed by using the newsboy model, and the goaf filling treatment mode is classified. Then, combined with mathematical derivation and simulation, the influence of related variable parameters on each type of filling mode is discussed. Finally, all kinds of goaf filling treatment modes are compared with non-filling schemes (benchmark mode) to provide theoretical support to help mining enterprises choose appropriate filling schemes. This research builds an economic model of goaf filling and treatment, which provides an optimal model for goaf filling and treatment according to different market environments, so as to achieve a balance in the procurement of tailings and new high-water materials, so as to maximize the interests of mining enterprises.
To sum up, in view of the high cost of goaf filling management, many mining enterprises would rather pay the deposit of management than invest in mined-out area management, from the economic point of view to the mined-out area filling ideas, stimulating the enthusiasm of the mining enterprise’s governance. Under the premise of goaf safety management, economic analysis and profit research on goaf management play a crucial role in the sustainable development of the whole mine, realizing the coordinated development of mine safety and economic benefits.

2. Mined-Out Area Management Economic Model

According to data, the annual output of China’s metal mine tailings is about 1.2 billion tons. With the increasing demand for ore, the amount of ore extracted from mines is also increasing year by year, and the stock of solid waste is also expanding. This not only needs to increase the cost of land acquisition but also poses a serious threat to the local ecological environment. Tailings are made into tailing after secondary processing, which refers to the solid waste discharged by the concentrator after grinding the ore finely and selecting useful components under specific economic and technical conditions. With the continuous improvements and developments in science and technology, tailings can be made into cement, tile brick, glass, and silicate tailings of brick and concrete and are used in the construction industry, road construction, and other engineering projects, such as the Tongguan Jian’an new building materials company that will use tailings plus cementified material for roadbed construction, strengthening the resource utilization of tailings, and saving CNY 3 million in costs. In addition to solving the problem of the shortage of sand and stone resources, it also follows the concept of environmental protection, green and sustainable development of the mine, and brings vested interests to the mining enterprises. Therefore, for mining enterprises, they can choose tailings or new high-water materials to fill the goaf, and the excess tailings can be sold on the market. According to the market demand for tailings ( x ) , different tailing sales decisions can be made. According to the different sales conditions of tailings, the remaining tailings and the purchased new high-water materials can be used for goaf filling treatment, as shown in Figure 1.

2.1. Postulated Conditions

In order to ensure that the constructed economic model of goaf filling management has practical significance, the following assumptions are made:
  • It is assumed that mining enterprises are completely rational and risk-neutral, that is, follow the traditional assumption of an “economic man” in economics.
  • It is assumed that mining enterprises obtain profits through tailings sales and goaf filling and consider maximizing their own interests as the ultimate goal.
  • It is assumed that the tailings content of ore extracted due to goaf filling is ignored. The main purpose of this assumption is to simplify the model and build an economic model of goaf filling management in a single period.
  • It is assumed that the market demand for tailings x follows a random distribution on ( 0 ,   U ) ; its probability density function is   f ( x ) and its cumulative distribution function is   F ( x ) ; its inverse function F 1 ( x ) is an increasing function, and F ( U ) = 1 .
  • Based on the actual situation and simplification of tailings treatment, it is assumed that there is a cost of tailings treatment for mining enterprises, that is, unit tailings treatment cost.
  • It is assumed that the selling price of tailing sand in the market is an exogenous parameter, and there is a maximum selling price of tailing sand according to the provisions of the national price management regulations on commodity prices.
  • It is assumed that the additional ore extracted after the goaf filling will also generate income, and the mining enterprise will sell the ore at the market price; that is, the unit marginal income of the goaf filling is the ore sales price.

2.2. Symbol Description and Constraint

  • X: The actual demand quantity of tailing sand on the market, in tons.
  • U: The maximum quantity of tailing sand required on the market, in tons.
  • Q: The total amount of tailings produced by mining enterprises, in tons.
  • q: The quantity of tailings sold by mining enterprises (decision variable), 0 q Q ; the unit is tons, and the conversion factor between the quality and volume of tailings is ρ 1
  • S: Total filling amount of goaf; the unit is m 3 .
  • p: Sales price of tailing sand; the unit is CNY/ton.
  • p - : The upper limit of the sales price of tailings; the unit is CNY/ton.
  • d: Tailings pre-treatment cost; the unit is CNY/ton.
  • e: Ore sales price (unit marginal revenue of goaf filling); the unit is CNY/ton.
  • c: The cost of purchasing ultra-high-water backfilling materials by mining enterprises; the unit is CNY/ton, and the conversion factor between the quality and volume of new inorganic solid water materials is ρ 2 , ρ 2 < ρ 1 .
  • M: Goaf ore production; unit is tons.
  • m: The amount of ore mined due to gob filling, in tons, m = α M , α is the rate of resource increasing.

2.3. Model Building

Analysis of Optimal Decision for Mine Enterprise

Mining enterprises hold a total of Q units of tailings. According to the market demand for tailings, one can determine the sales volume and filling number of tailings and the purchase of new high-water materials. When 0 < x < q , the mining enterprise sells the   x   units of tailing sand, uses Q x   of the units of tailing sand to fill the goaf, and purchases the   ( S ( Q x ) / ρ 1 ) ρ 2 units of ultra-high-water backfilling material, so the profit of the mining enterprise is p x + α M e c ( S ( Q x ) / ρ 1 ) ρ 2 . When x > q , the mining enterprise sells the q units of tailing sand, uses the Q q   units of tailing sand for goaf filling and purchases the ( S ( Q q ) / ρ 1 ) ρ 2 units of new high-water materials, so the profit of the mining enterprise is p q + α M e c ( S ( Q q ) / ρ 1 ) ρ 2 . The pre-treatment cost of tailings for mining enterprises is d q . To sum up, the revenue function of mining enterprises is shown in Equation (1):
g = M e + 0 q [ p x + α M e c ( S ( Q x ) / ρ 1 ) ρ 2 ] f x d x + q U [ p q + α M e c ( S ( Q q ) / ρ 1 ) ρ 2 ] f x d x d q
The solution to the first and second derivatives of the revenue function of the mining enterprise is as follows:
δ g σ q = p c ρ 2 ρ 1 1 F q d
2 g q 2 = p c ρ 2 ρ 1 f q
Therefore, when p > c ρ 2 ρ 1 , we obtain: 2 g q 2 < 0 ; in other words, the revenue function of mining enterprises is a concave function. Then, according to the KKT condition, the decision making of mining enterprises can be equitably transformed into the following:
g q λ 0 q g q λ = 0 q Q 0 λ Q q = 0 q 0 λ 0
When q * = Q , we obtain: g q > 0 , so p satisfies c ρ 2 ρ 1 + d 1 F ( Q ) < p < p - . By c ρ 2 ρ 1 + d 1 F ( Q ) < p - , we gain: 0 < Q < F 1 ( 1 d ρ 1 p - ρ 1 c ρ 2 ) .
When q * < Q , we obtain: q * = F 1 ( 1 d ρ 1 p ρ 1 c ρ 2 ) . By q * > 0 , we gain: c ρ 2 ρ 1 + d < p ; by q * < Q , we gain: p < c ρ 2 ρ 1 + d 1 F ( Q ) .
Comparing with p < c ρ 2 ρ 1 + d 1 F ( Q ) and p - , there are two cases shown below:
  • (2-1) When c ρ 2 ρ 1 + d 1 F ( Q ) < p - , p satisfies c ρ 2 ρ 1 + d < p < c ρ 2 ρ 1 + d 1 F ( Q ) . By c ρ 2 ρ 1 + d 1 F ( Q ) < per - , we gain: 0 < Q < F 1 ( 1 d ρ 1 p - ρ 1 c ρ 2 ) .
  • (2-2) When c ρ 2 ρ 1 + d 1 F ( Q ) p - , we obtain: c ρ 2 ρ 1 + d < p < p - . By c ρ 2 ρ 1 + d 1 F ( Q ) p - , we gain: Q F 1 ( 1 d ρ 1 p - ρ 1 c ρ 2 ) .
When q * = 0 , we obtain: g q < 0 , get: p < c ρ 2 ρ 1 + d . When p > c ρ 2 ρ 1 , there is 2 g q 2 < 0 ; therefore, c ρ 2 ρ 1 < p < c ρ 2 ρ 1 + d .
It can be seen that the total amount of tailings, the unit tailings treatment, and the purchase price of ultra-high-water backfilling materials have an important impact on the optimal reserve decision of mining enterprises. The optimal sales volume of tailings of mining enterprises is shown in Table 1.
According to Table 1, looking at the analysis of the optimal decisions of mining enterprises, we find the following:
When the market sales price of tailings is lower ( c ρ 2 ρ 1 < p < c ρ 2 ρ 1 + d ) , the revenue function of a mining enterprise is a decreasing function of the tailing sales volume, so mining enterprises will not sell tailing in the market but use all of it to fill the goaf (Case 4).
When the total amount of tailings is a small volume ( 0 < Q < F 1 ( 1 d ρ 1 p - ρ 1 c ρ 2 )), the sales price of tailings has an obvious influence on the optimal decision of mining enterprises. If the sales price of tailings is lower (c ρ 2 ρ 1 + d < p < c ρ 2 ρ 1 + d 1 F ( Q ) ) , mining enterprises will only sell ( F 1 ( 1 d ρ 1 p ρ 1 c ρ 2 ) units of tailings (Case 2); with the increase in the selling price of tailings, mining enterprises will sell more tailings; when the price of tailings exceeds c ρ 2 ρ 1 + d 1 F ( Q ) , due to the limitation of the total amount of tailings, the mining enterprise will sell all the tailings (Case 1).
When the total amount of tailings is a large volume ( Q F 1 ( 1 d ρ 1 p - ρ 1 c ρ 2 ) ) , as long as the sales price of tailings is greater than c ρ 2 ρ 1 + d , and lower than the ceiling price stipulated by the state p - , mining enterprises will sell F 1 ( 1 d ρ 1 p ρ 1 c ρ 2 ) units of tailings (Case 3). Hypothesis: Q = 10,000 .
According to the total number of tailings, the mining enterprises’ optimal sales volume of tailings conforms to the combination of 4-2-1 or 4-3 with the changing trend of tailings sales price. The following uses numerical examples to simulate the two combinations, and the relevant parameters are set as follows: ρ 1 = 20 , ρ 2 = 5 , U = 20,000 , d = 20 , c = 50 , α = 0.2 , p - = 500 , M = 100,000 , S = 10,000 , e = 1000 , gain: c ρ 2 ρ 1 + d = 32.5 , c ρ 2 ρ 1 + d 1 F ( Q ) = 52.5 , F 1 ( 1 d ρ 1 p - ρ 1 c ρ 2 ) = 19,179. First of all, for hypothesis Q = 10,000 , plot the trend of the optimal sales volume of tailings in mining enterprises with the sales price ( 20 < p < 100 ) of tailings, as shown in Figure 2a. Secondly, for hypothesis Q = 19,500 , plot the trend of the optimal sales volume of tailings in mining enterprises with the sales price ( 20 < p < 100 ) of tailings, as shown in Figure 2b.
It can be seen that when the total amount of tailings is less than 19,179 , mining enterprises will not sell tailings, and the corresponding income will remain unchanged; with the increase in the selling price of tailings, the sales volume of tailings is increasing, so the mining enterprises can gain higher profits. When the sales price of tailings reaches a certain level, although the sales volume of tailings no longer changes, the income of mining enterprises continues to increase with the increase in the sales price of tailings. When the total amount of tailings is greater than 19,179 , the income of mining enterprises remains unchanged; with the increase in the selling price of tailings, mining enterprises tend to sell tailings, so mining enterprises can obtain more profits.

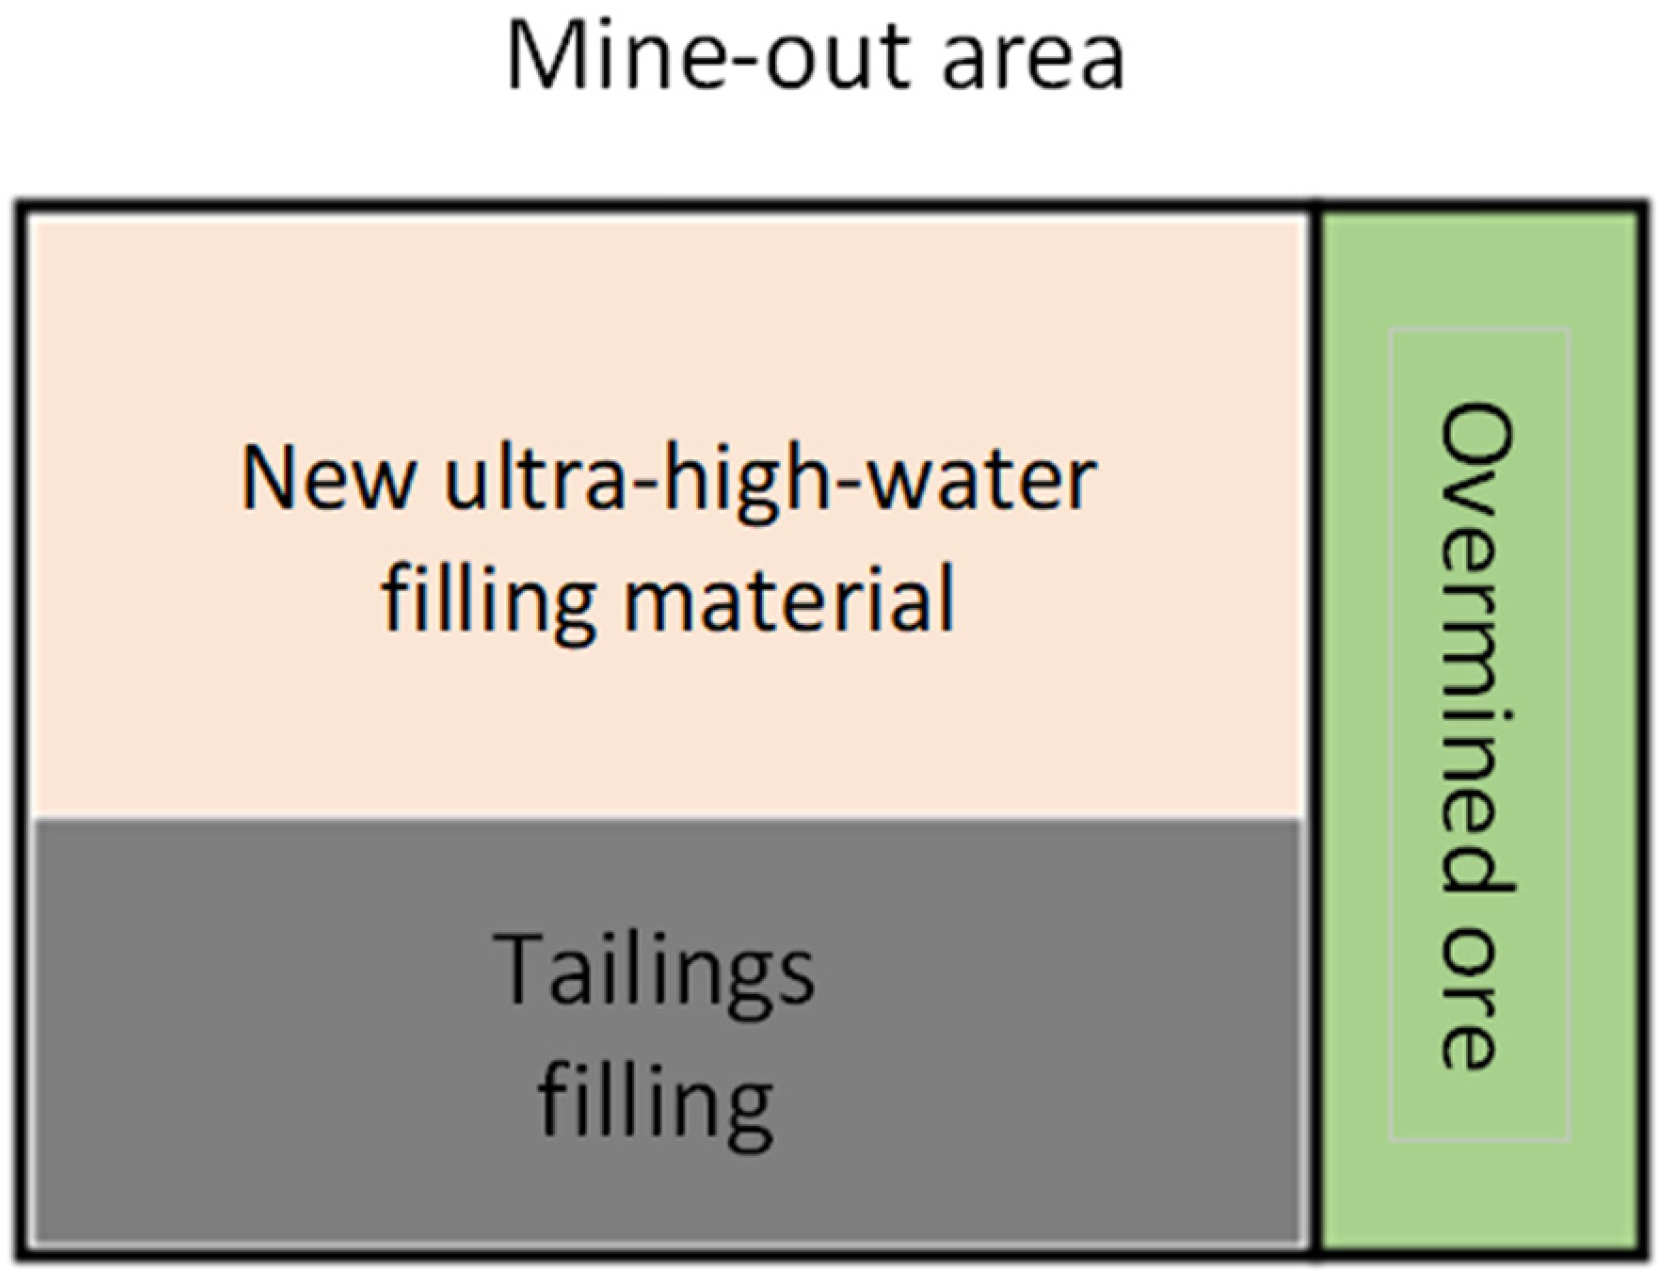
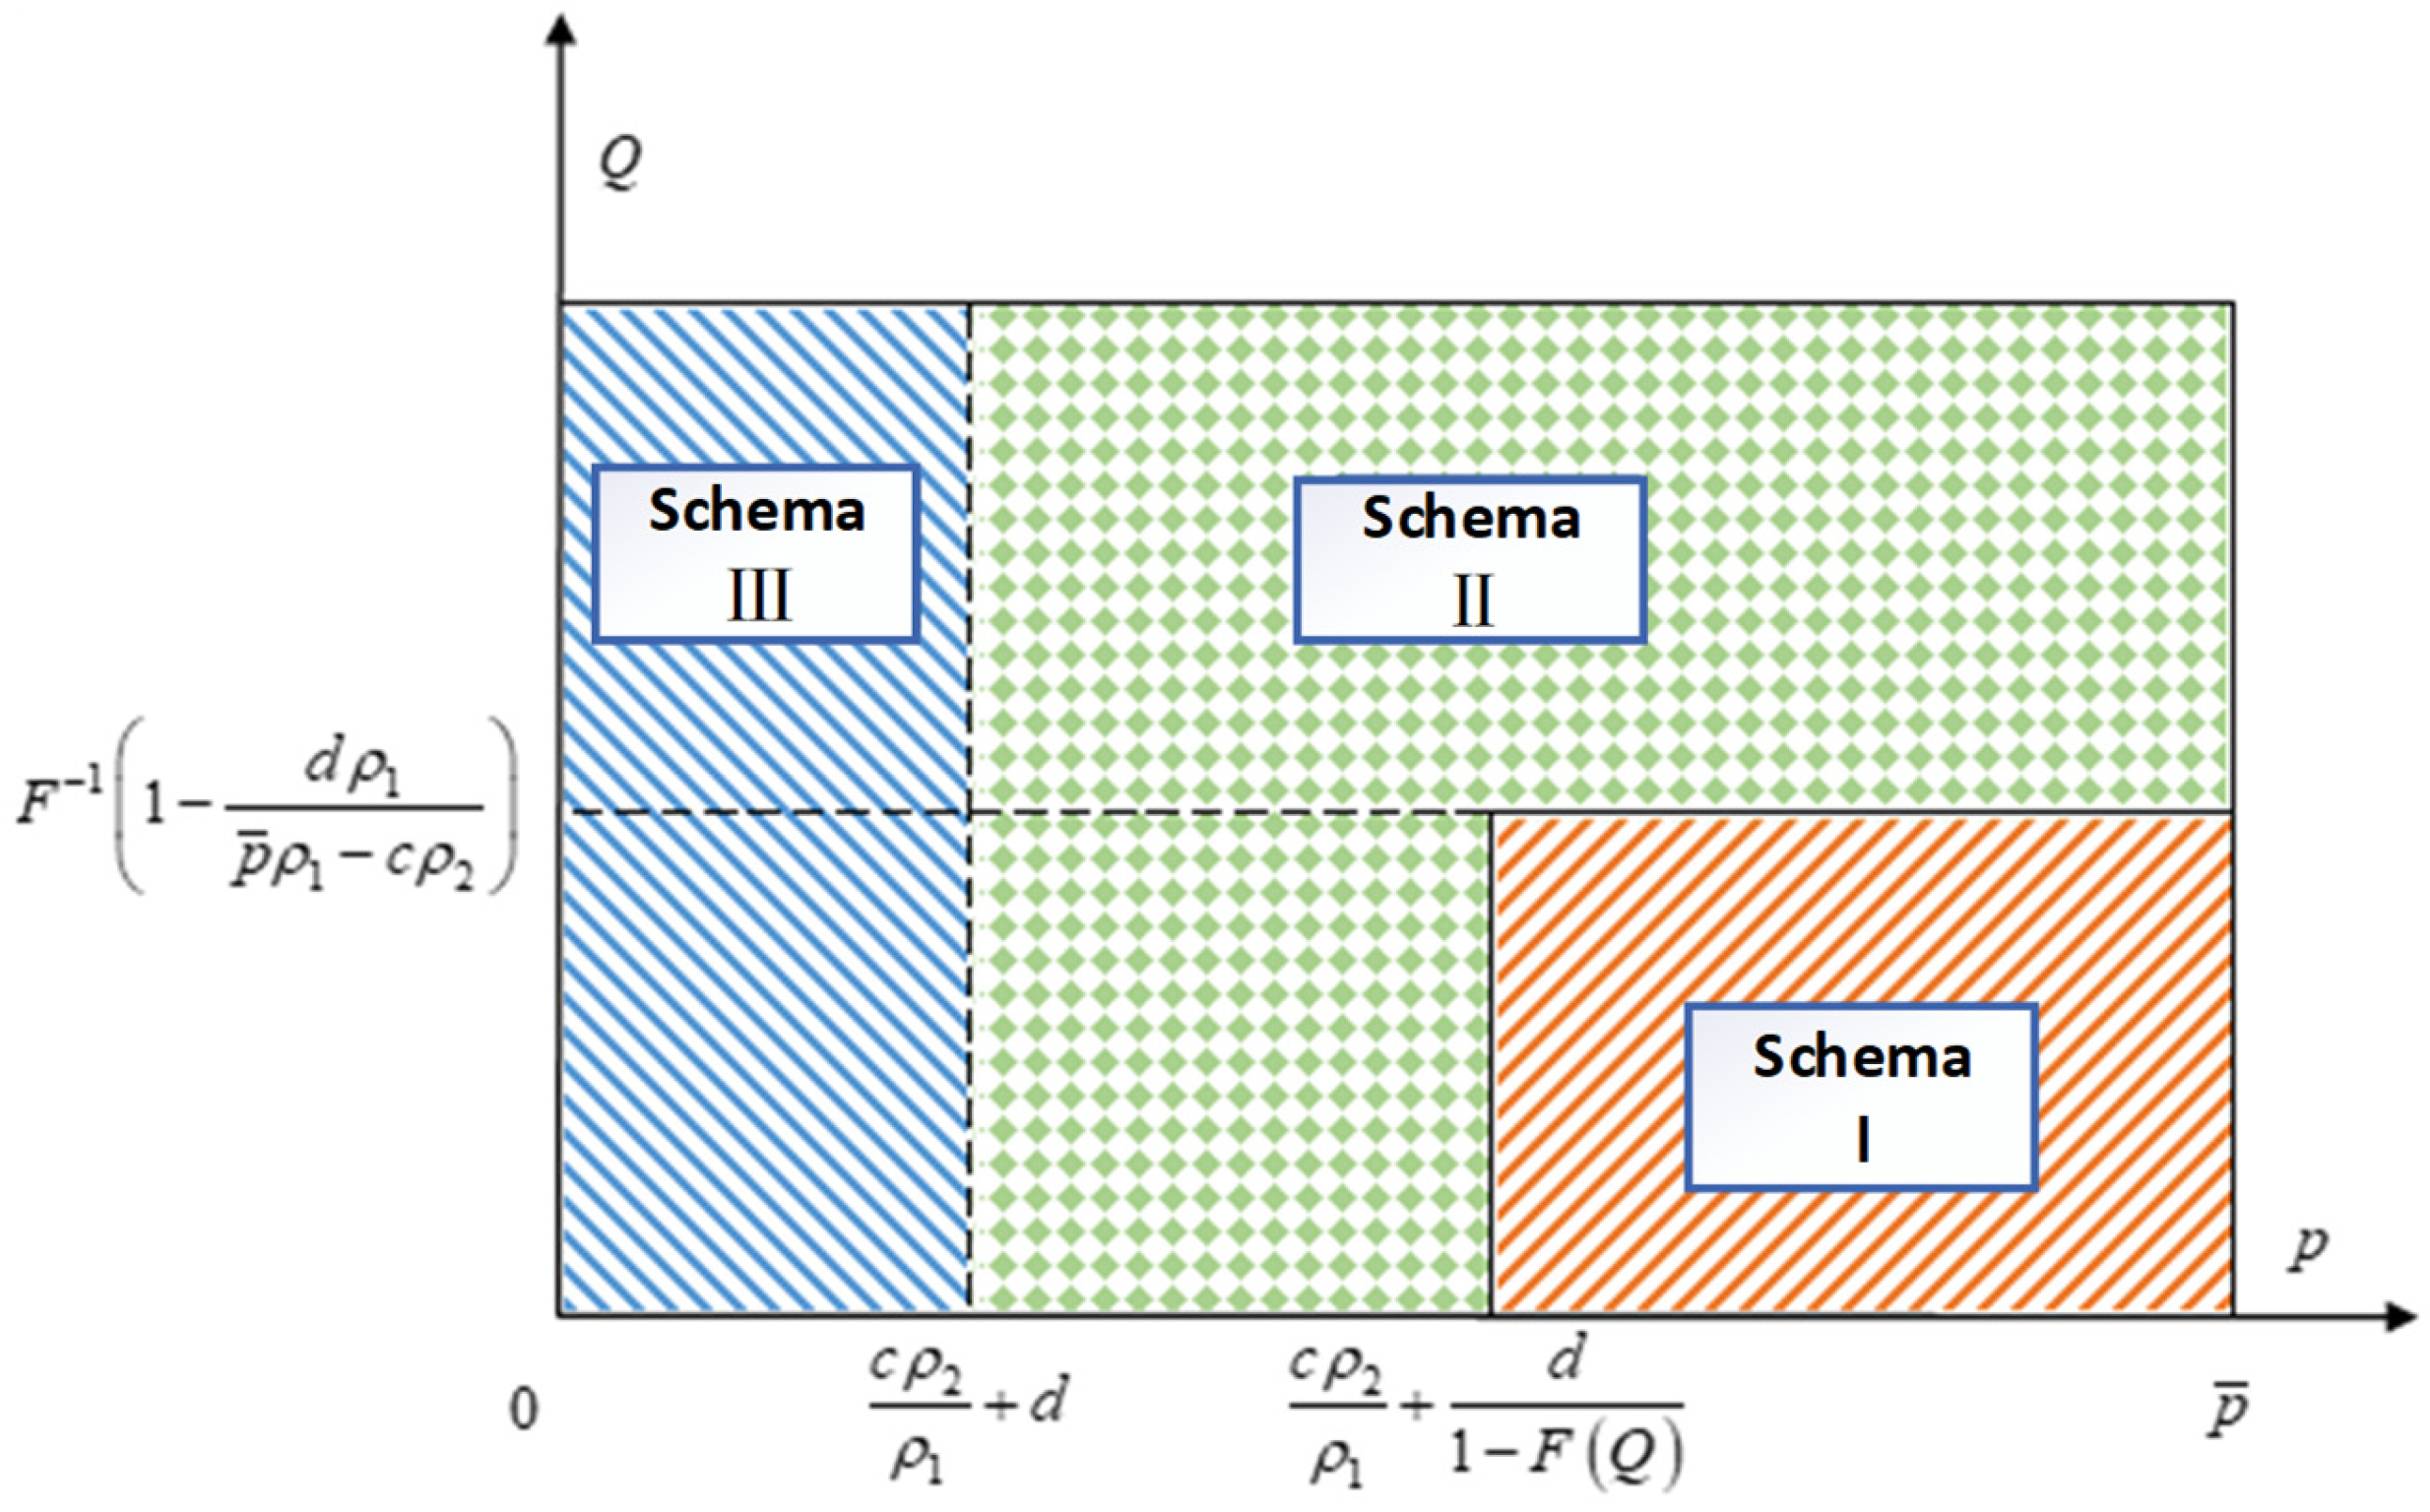
2.4. Classification of Goaf Filling Schema

According to the optimal decision-making scheme of mining enterprises under different circumstances and the actual situation of goaf filling, the mining enterprises’ goaf filling modes are divided into three categories, as shown below:
  • Schema I: ultra-high-water filling materials mode;
  • Schema II: ultra-high-water filling materials + mixed filling mode of partial tailings;
  • Schema III: ultra-high-water filling materials + mixed filling mode of all tailings.
In order to better demonstrate the influences of the total amount of tailings, a unit’s tailings treatment cost, and purchase price of new ultra-high-water filling materials on the selection of the goaf filling mode, the following schematic diagram is drawn showing the changes in the goaf filling mode with the total amount of tailings and sales price of tailings, as shown in Figure 3.
According to Figure 3, there is a critical point c ρ 2 ρ 1 + d 1 F ( Q ) and F 1 ( 1 d ρ 1 p - ρ 1 c ρ 2 ) between schema I and II, and a critical point c ρ 2 ρ 1 + d between schema II and III. These three critical points are related to the total amount of tailings, unit tailings treatment cost, and the purchase price of new ultra-high-water filling materials. Therefore, the following further tests looked at the impact of changes in the total amount of tailings, unit tailings treatment cost, and the purchase price of new ultra-high-water filling materials on the gob filling mode adopted by mining enterprises. Hypothesis p 1 = c ρ 2 ρ 1 + d , p 2 = c ρ 2 ρ 1 + d 1 F ( Q ) , T = F 1 ( 1 d ρ 1 p - ρ 1 c ρ 2 ) . Solving the first-order conditions of P 1 with c and d gives:
P 1 c = ρ 2 ρ 1 > 0 P 1 d = 1 > 0    
Solving the first-order conditions of P 1 with c , d , and Q gives:
P 2 c = ρ 2 ρ 1 > 0 P 2 d = 1 1 F ( Q ) > 0 P 2 Q = d f ( Q ) ( 1 F ( Q ) ) 2 > 0
Solving the first-order conditions of T with c and d gives:
T c = 1 f ( 1 d ρ 1 p - ρ 1 c ρ 2 ) d ρ 1 ρ 2 ( p - ρ 1 c ρ 2 ) 2 < 0 T d = 1 f ( 1 d ρ 1 p - ρ 1 c ρ 2 ) ρ 1 p - ρ 1 c ρ 2 < 0

3. Results

3.1. Selection of Mine Filling Mode

It can be seen that the mined-out area filling mode selected by mining enterprises is not static but constantly adjusted with changes in the market environment, which is consistent with the reality, as follows:
The lower the price of new ultra-high-water filling materials in the market, the smaller the tailings treatment cost, and the smaller the total amount of tailings, the more inclined mining enterprises are to mode I. Due to the lower market price of the new materials, the cost of tailings treatment and the total amount of tailings, the critical point c ρ 2 ρ 1 + d 1 F ( Q ) is smaller, while the total critical point F 1 ( 1 d ρ 1 p - ρ 1 c ρ 2 ) decreases with the increase in the market price of the new filling materials and the cost of tailings treatment and, therefore, the more inclined mining enterprises are to sell all the tailings and all the new filling materials used to fill the gob.
The higher the purchase price of new ultra-high-water filling materials and the greater the cost of tailings treatment, the more willing mining enterprises are to choose mode III. The greater the purchase price of new filling materials and the cost of tailings treatment, the greater the critical point P 1 = c ρ 2 ρ 1 + d , so the mining enterprises are willing to use all tailings for mined-out area filling.
The higher the price of new ultra-high-water filling materials in the market and the greater the tailings treatment cost and the total amount of tailings, the more willing mining enterprises are to choose mode II. The smaller the total amount of tailing sand and the larger the cost of tailing treatment, the greater the distance between the two critical points c ρ 2 ρ 1 + d 1 F ( Q ) and c ρ 2 ρ 1 + d . At the same time, the critical point F 1 ( 1 d ρ 1 p - ρ 1 c ρ 2 ) of the total amount of tailings gradually decreases with the increase in the market price of new filing materials and the cost of tailings treatment. Therefore, mining enterprises will choose to sell part of the tailings and buy part of the new filling materials to fill the mined-out areas, that is, mode II.
Under mode I, the optimal sales volume of tailings is equal to Q ; that is, all tailings are sold, and the more tailings, the more sales volume. Under mode III, the optimal sales volume of tailings is equal to 0 , which has nothing to do with the other parameters. Therefore, the following focuses on the relationship between the optimal sales volume of tailings in mining enterprises and some parameters under model II.
Under mode   I I , the optimal decision of the mining enterprise is equal to F 1 ( 1 d ρ 1 p ρ 1 c ρ 2 ) . Solving the first-order conditions of   F 1 ( 1 d ρ 1 p ρ 1 c ρ 2 ) concerning the tailings treatment cost d , the purchase price of new filling material c , and the sales price of tailings p , we can obtain:
q * d = 1 f ( 1 d ρ 1 p ρ 1 c ρ 2 ) ρ 1 ( p ρ 1 c ρ 2 ) < 0 q * c = 1 f ( 1 d ρ 1 p ρ 1 c ρ 2 ) ρ 1 ρ 2 ( p ρ 1 c ρ 2 ) 2 < 0 q * p = 1 f ( 1 d ρ 1 p ρ 1 c ρ 2 ) ρ 1 2 ( p ρ 1 c ρ 2 ) 2 > 0
Therefore, the higher the unit tailings treatment cost, the lower the sales revenue, so mining enterprises will reduce the sales volume of tailings. The higher the price of purchasing new filling materials, the more enterprises will use tailings to fill the goaf, thus reducing the sales volume of tailings. This is because the procurement cost of new filling materials is higher, but the benefits are fewer. For mining enterprises, purchasing too many new filling materials at a higher price is not the best decision, but the use of tailings for filling may be. The higher the market price of tailings, the more mining enterprises benefit from the sales process, and the more they will increase the sales volume of tailings.
In order to better explain the changing trend of the optimal sales volume of tailings in mining enterprises under mode II with the cost of tailings treatment, the purchase price of new inorganic water solid materials, and the sales price of tailings, several examples are used to illustrate the following, and the relevant parameters are assumed as follows:
(1)
p = 200 , ρ 1 = 20 , ρ 2 = 5 , U = 20,000 , d = 20 , c = 0 : 1 : 100 ;
(2)
p = 200 , ρ 1 = 20 , ρ 2 = 5 , U = 20,000 , d = 0 : 1 : 50 , c = 50 ;
(3)
p = 50 : 1 : 300 , ρ 1 = 20 , ρ 2 = 5 , U = 20,000 , d = 20 , c = 50 .
For convenience, it is assumed that the total demand for tailings in the market is uniformly distributed ( 0 , U ) ; that is, x the probability density function and the cumulative distribution function are, respectively, f ( x ) = 1 / U and F ( x ) = x / U , and the optimal sales volume of tailings in mining enterprises is obtained along with the changing trend of tailings treatment cost, purchase price of new inorganic water solid materials, and sales price of tailings, as shown in Figure 4. It can be seen that the optimal sales volume of tailings for mining enterprises is positively correlated with the cost of tailings treatment and the purchase price of new inorganic water solid materials, and negatively correlated with the sales price of tailings, which is consistent with the above research conclusions.
In summary, for the correlation between the optimal amount of tailings sold by mining enterprises and the market price of new inorganic water fixing materials, tailings treatment cost and sales price under different models are obtained.

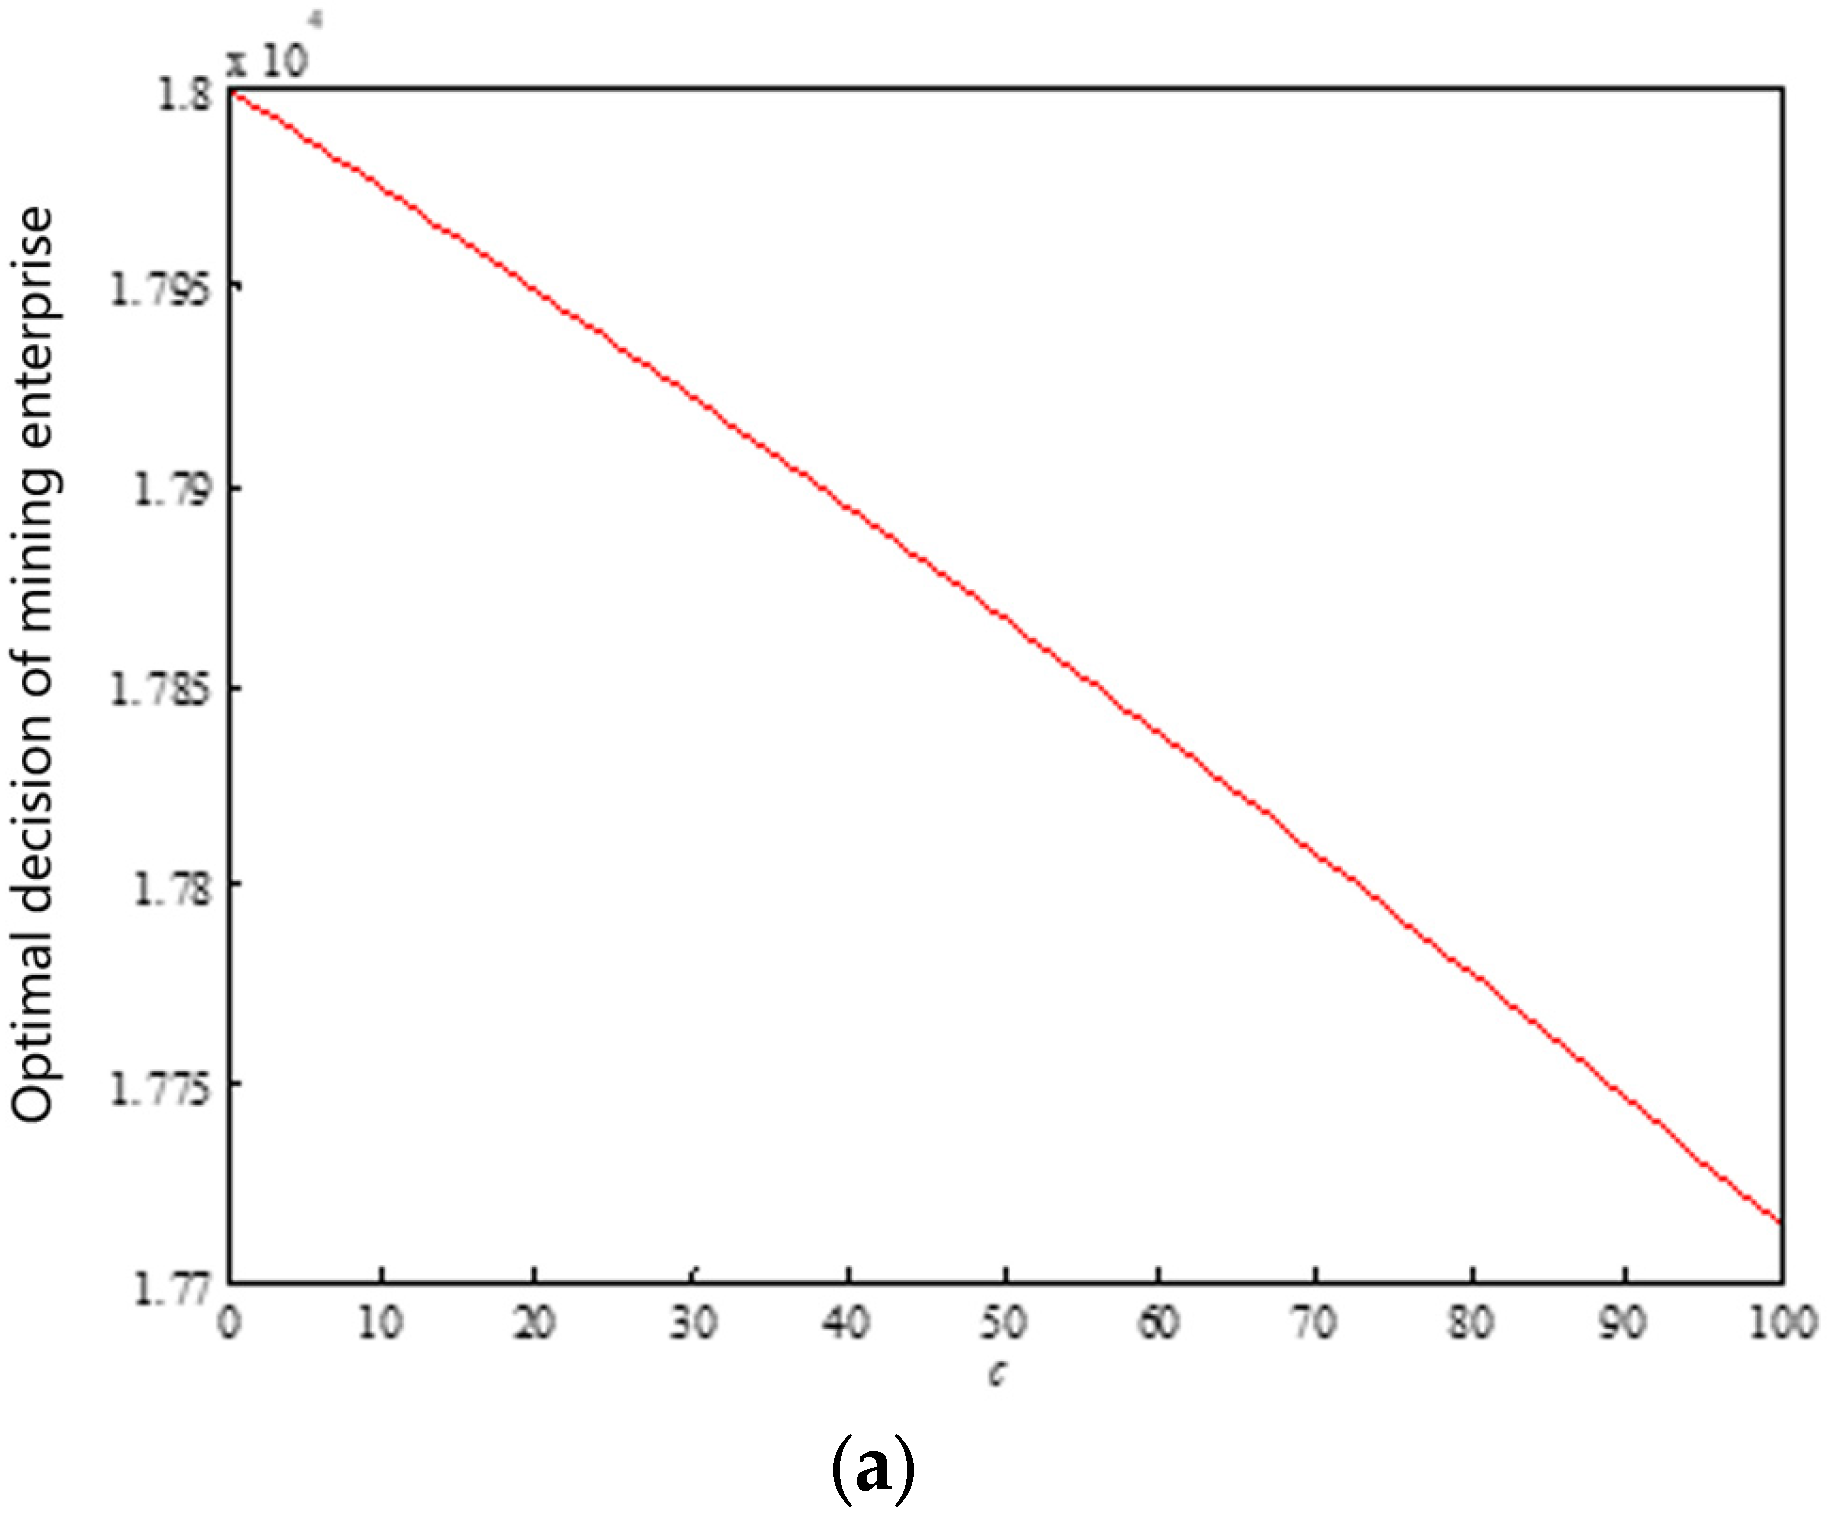
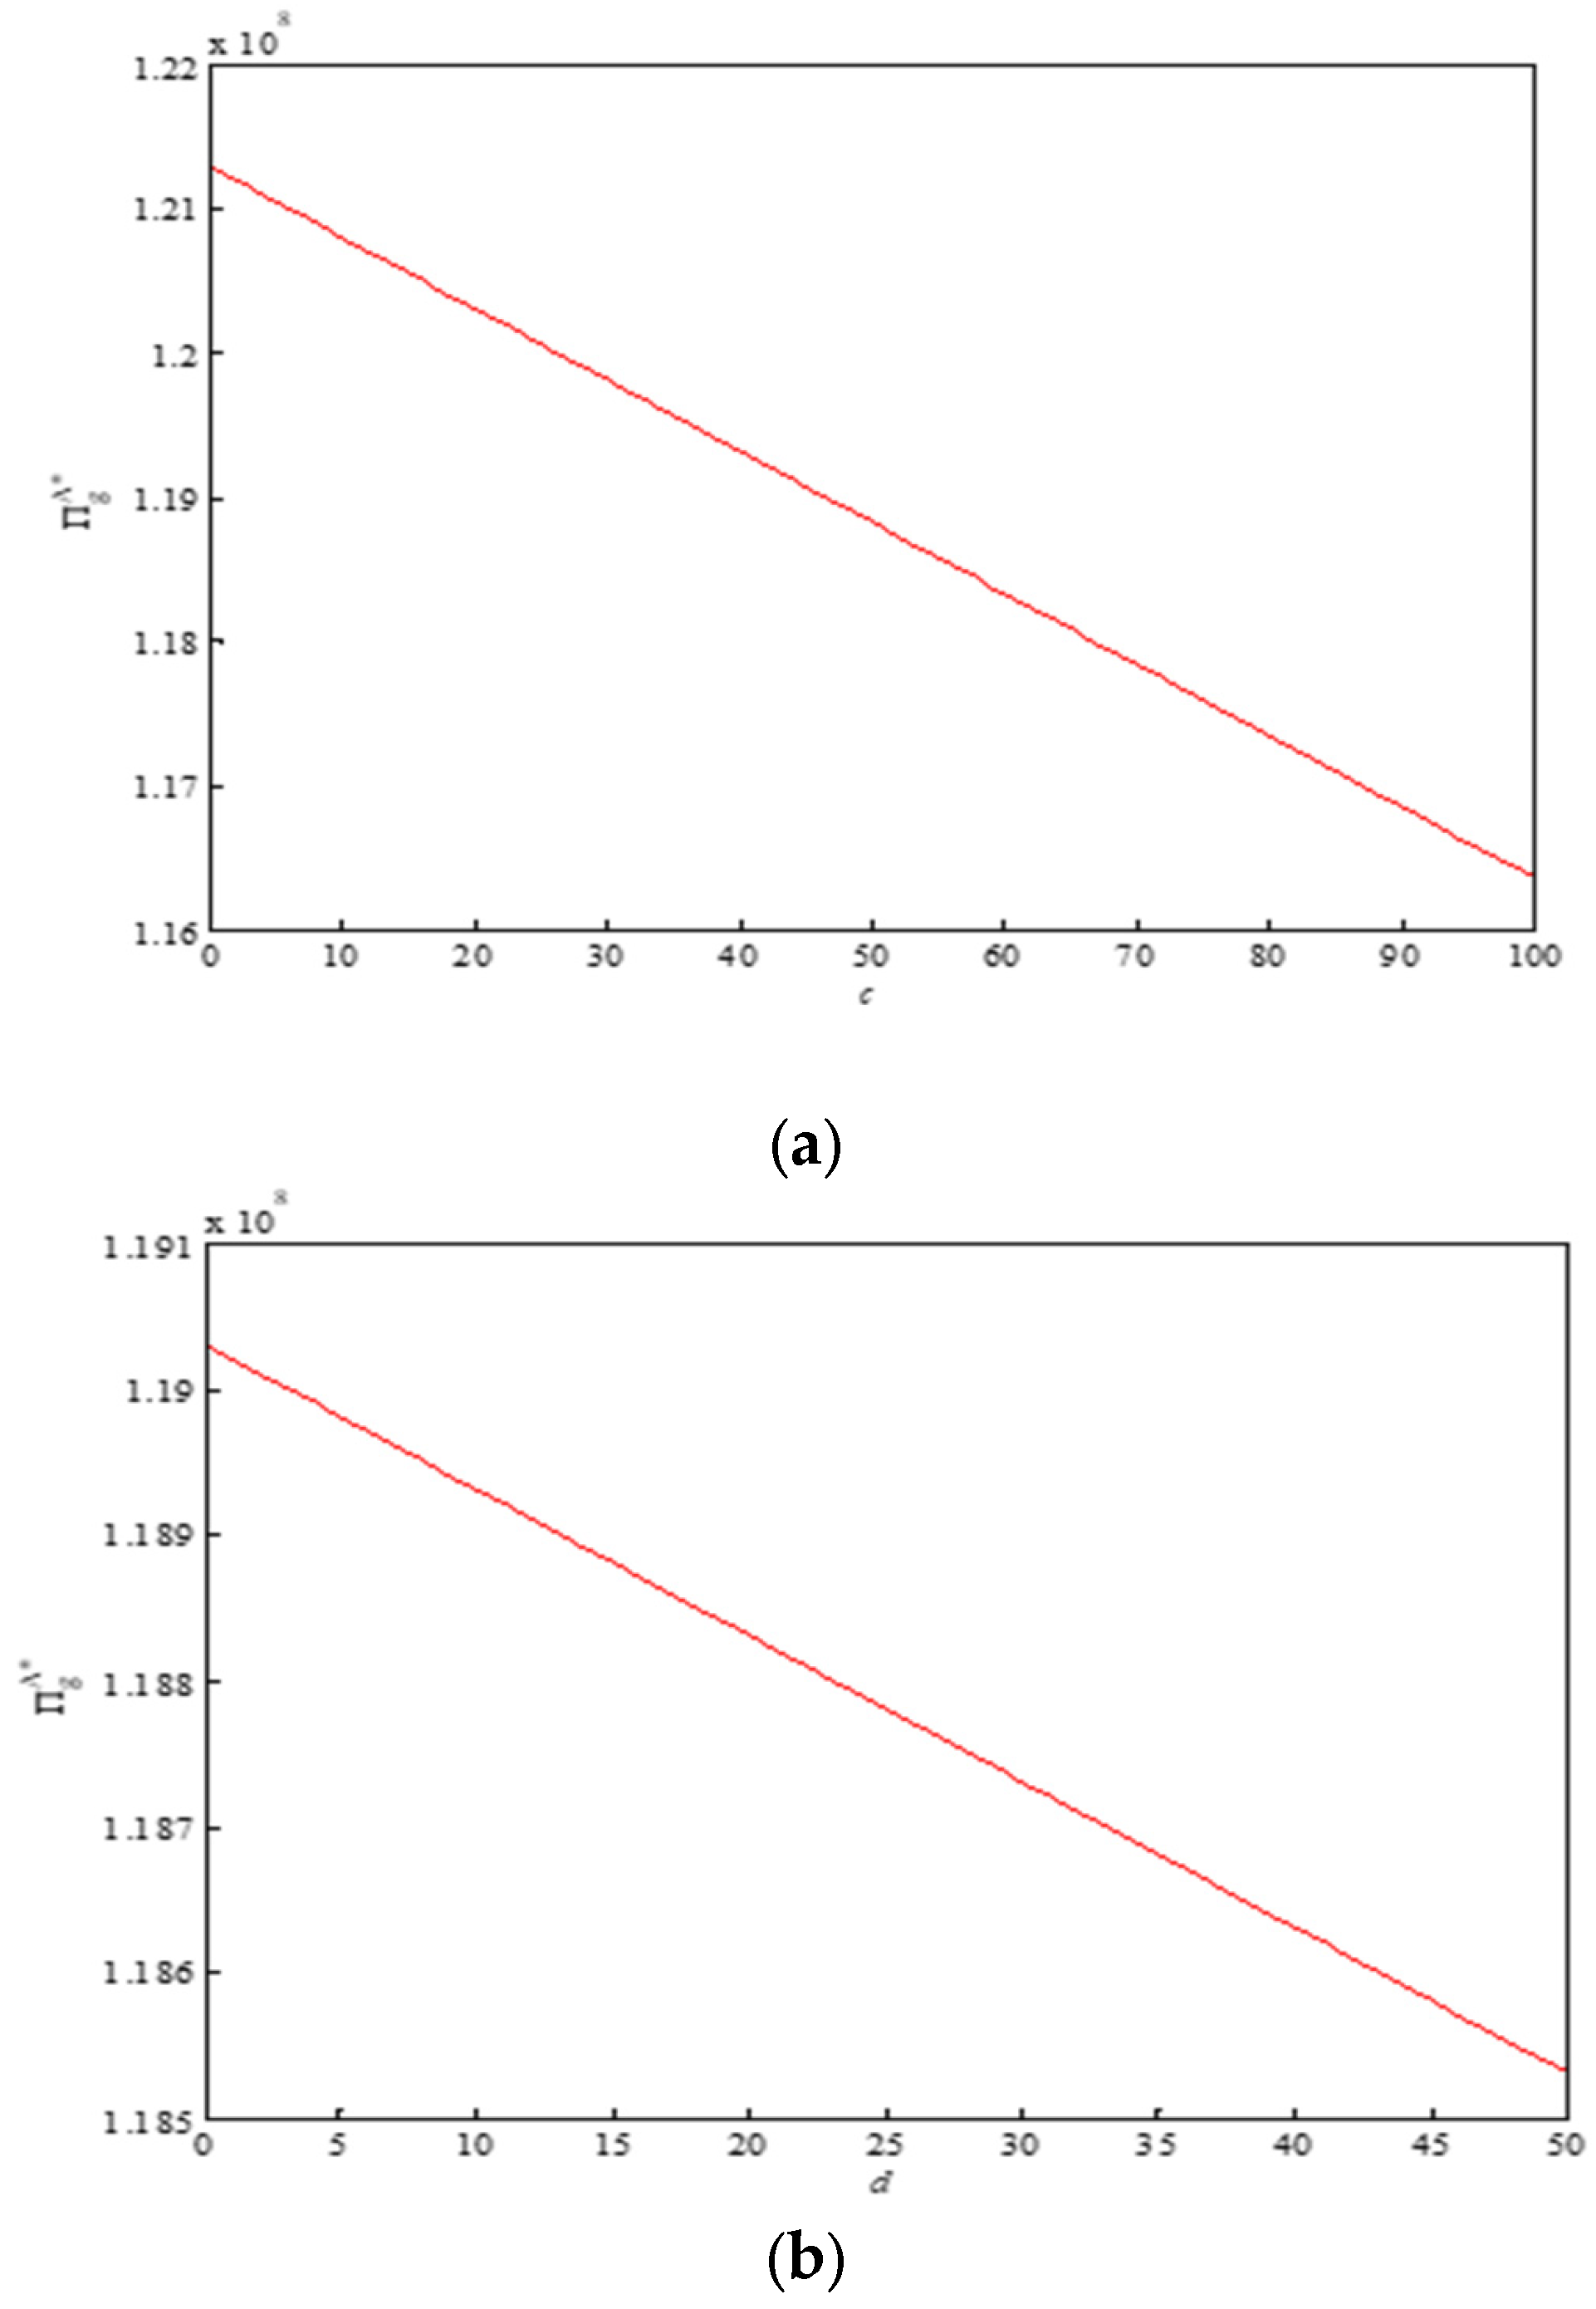
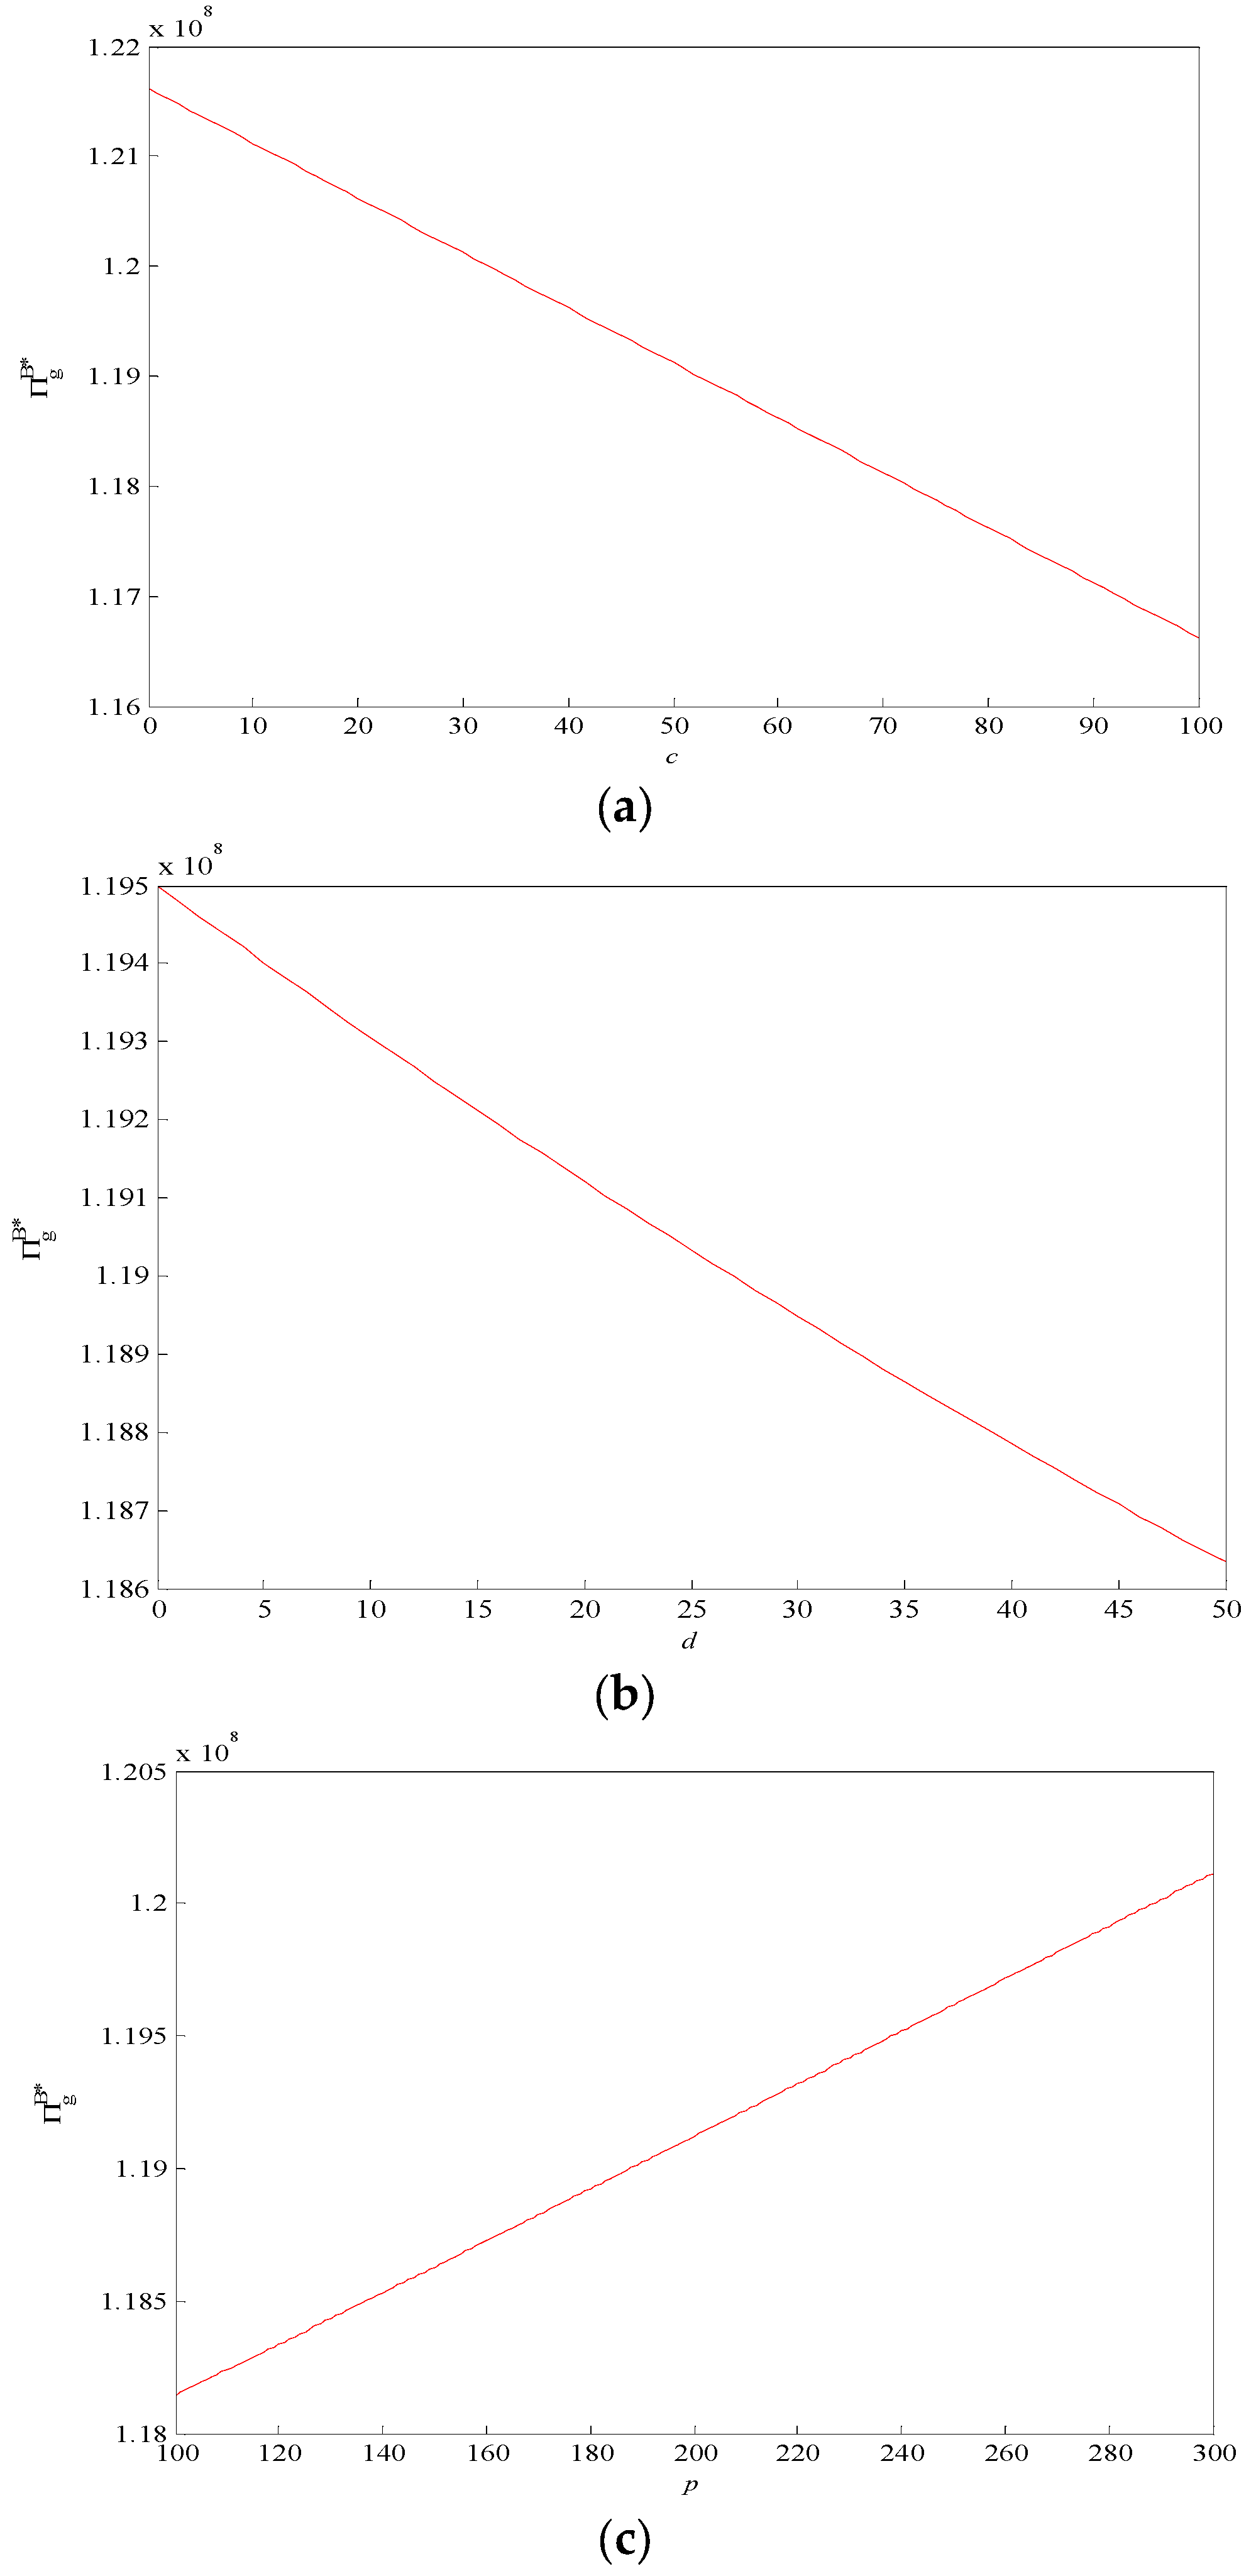
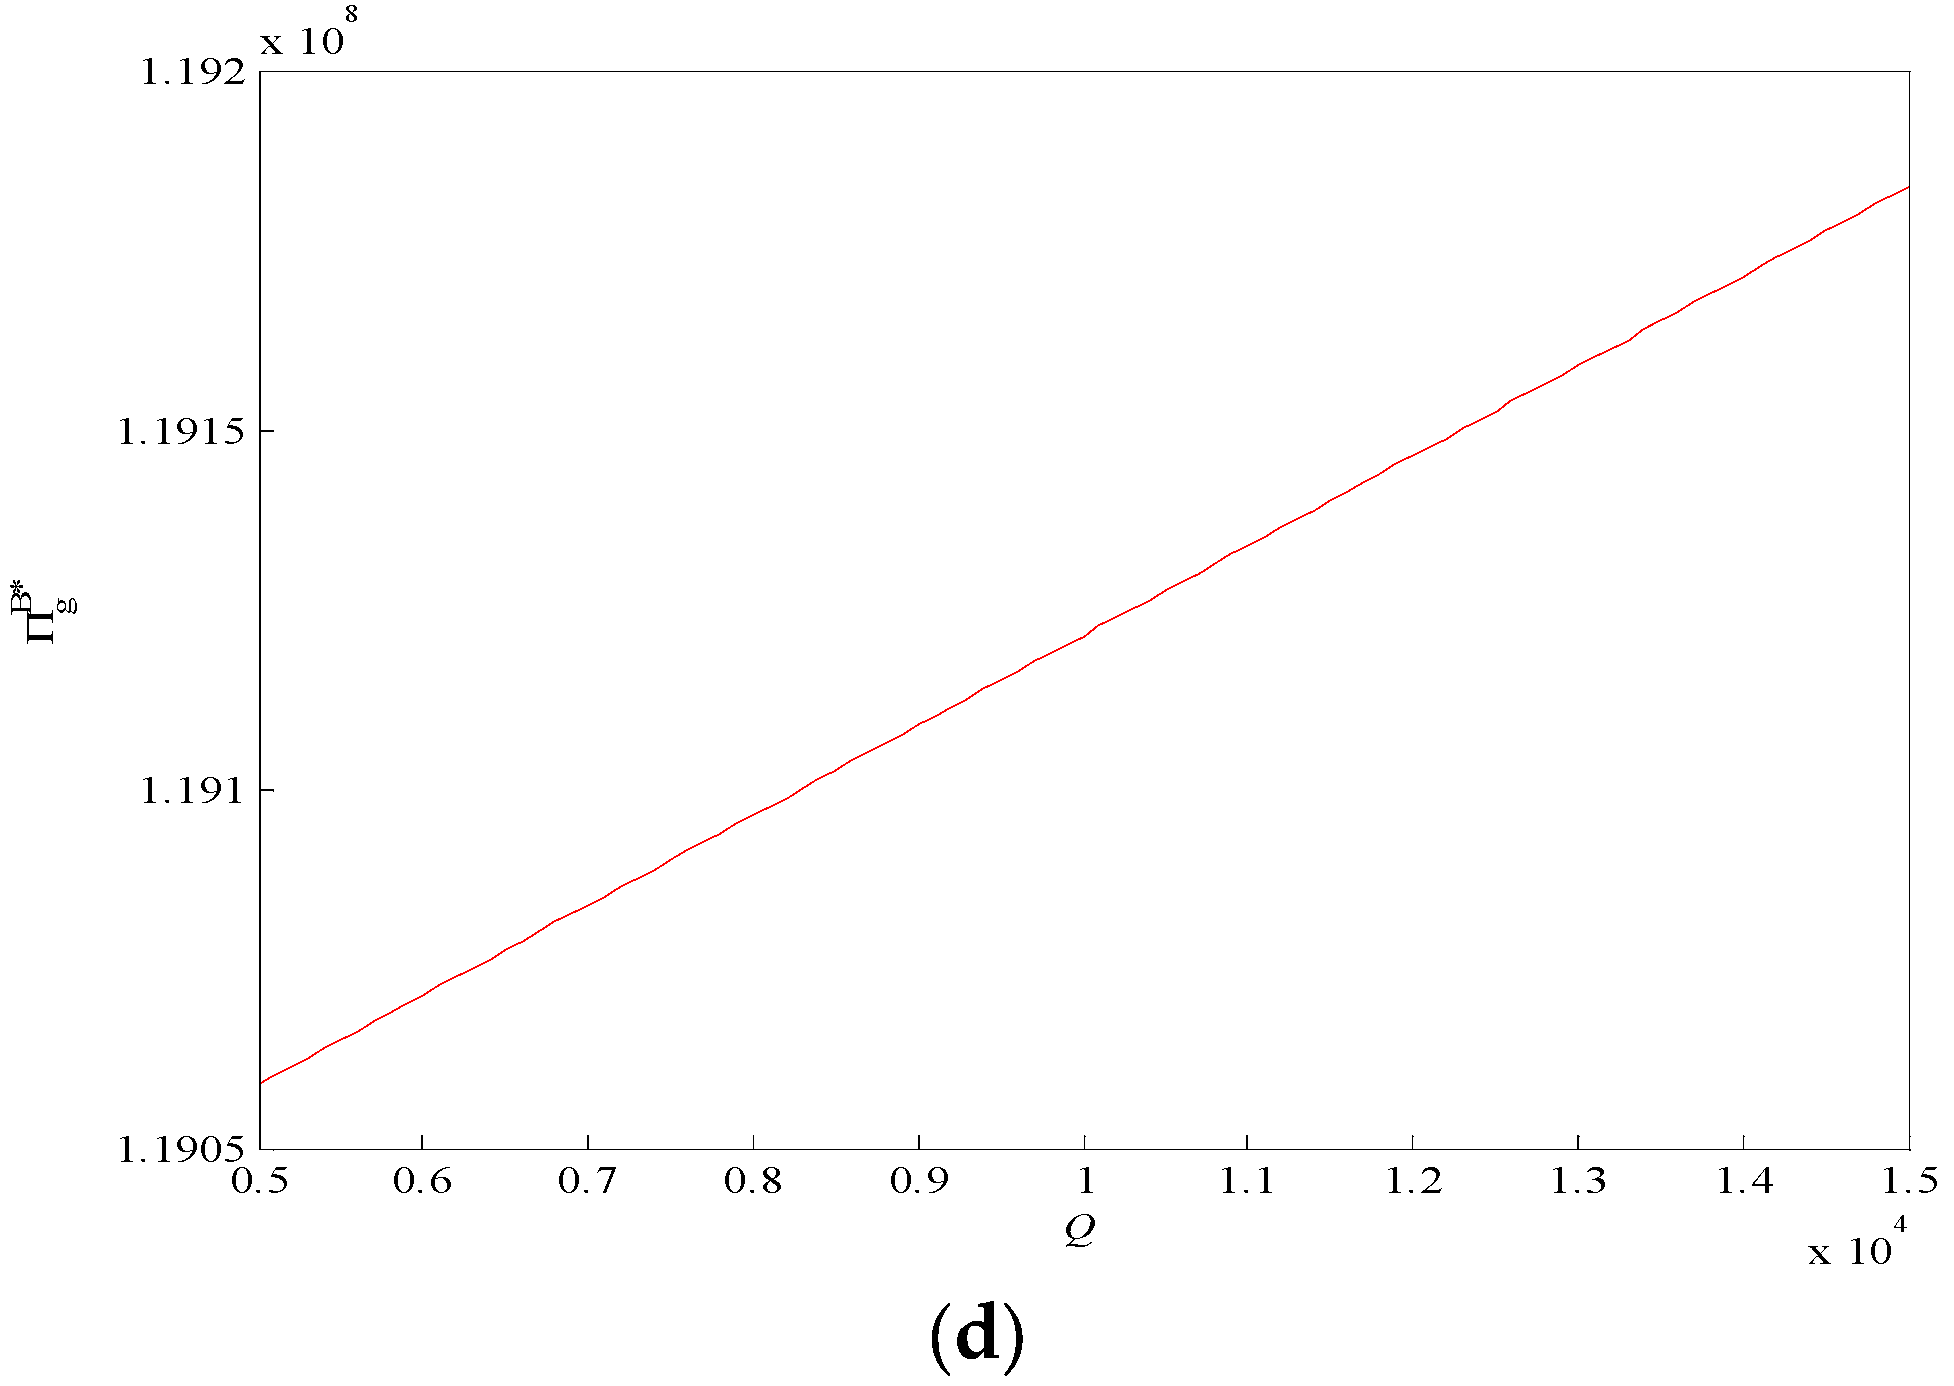
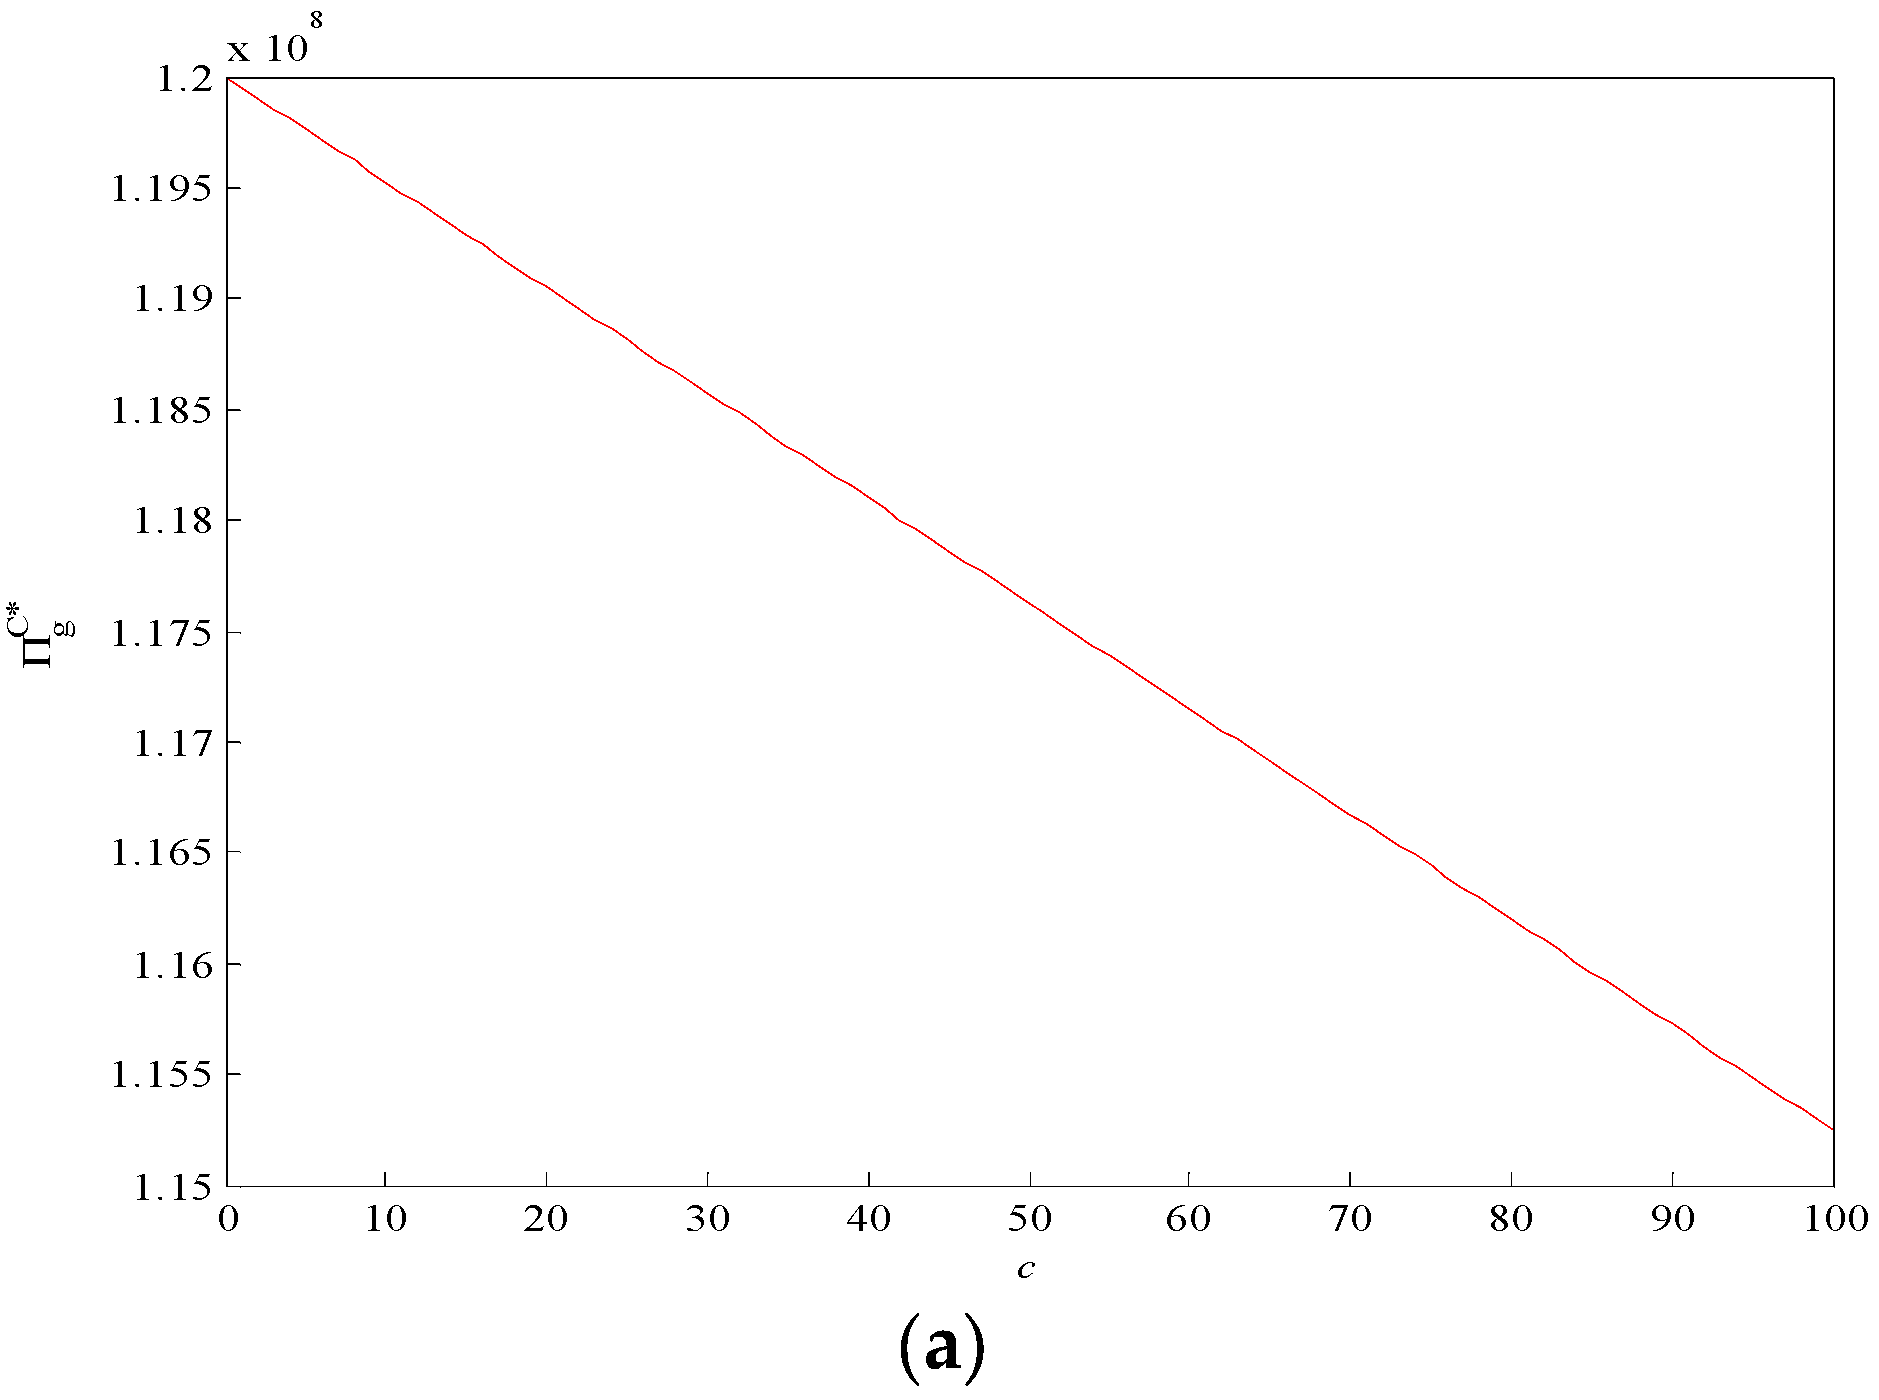
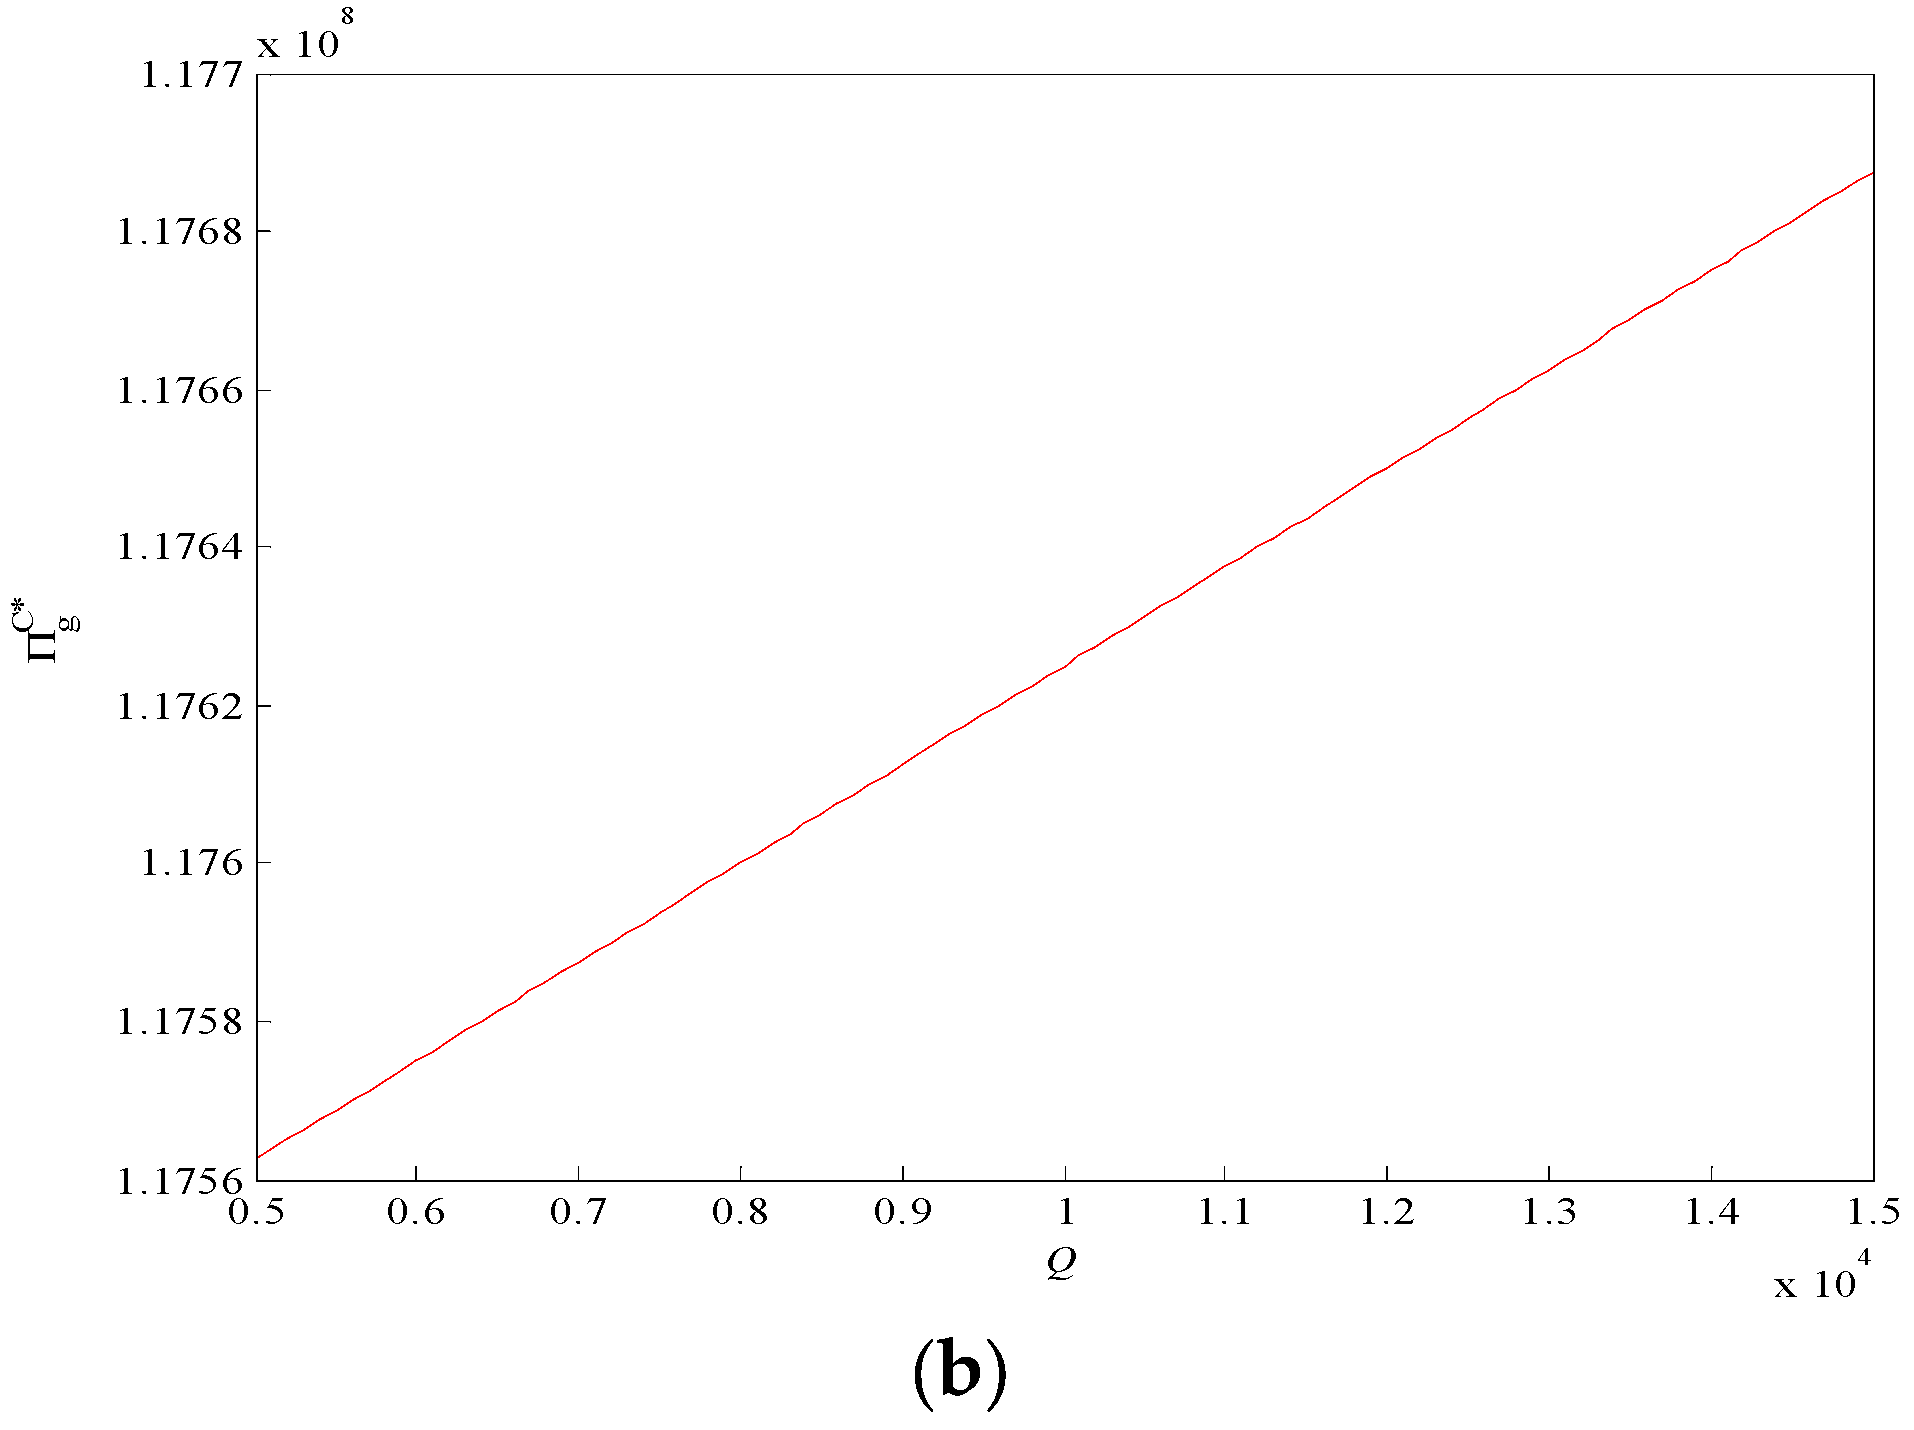
3.2. Expected Income Analysis of Mining Enterprises

Under different conditions, mining enterprises will choose different gob filling modes, and the profits under different modes are also different. Therefore, the following contents, the analyses of the parameters, will have an impact on the earnings of mining enterprises under three modes. The expected profits of mining enterprises under mode I are:
g A * = M ( 1 + α ) e c ( S Q ρ 1 ) ρ 2 + ( p c ρ 2 ρ 1 ) ( Q 0 Q F ( x ) d x ) d Q
Solving the first-order condition of the above formula with respect to p, c, d, and Q, we obtain:
g A * p = Q 0 Q F ( x ) d x > 0 g A * c = ρ 2 ρ 1 ( Q 0 Q F ( x ) d x ) ( S Q ρ 1 ) ρ 2 < 0 g A * d = Q < 0 g A * Q = c ρ 2 ρ 1 + ( p c ρ 2 ρ 1 ) ( 1 F ( Q ) ) d > 0
It can be seen that when the total amount of tailings is lower ( Q < F 1 ( 1 d ρ 1 p - ρ 1 c ρ 2 )) and the sales price is higher ( c ρ 2 ρ 1 + d ( 1 F ( Q ) ) < p < p ¯ ), the mining enterprises will sell all the tailings (mode I); the higher the total amount of tailings and the higher the sales price, the more income the mining enterprises will obtain. On the contrary, if mining enterprises need to spend more on treating tailings and purchasing replacement filling materials, the input cost will increase, so the income of mining enterprises will decrease with the increase in tailings treatment cost and the purchase price of new ultra-high-water filling materials.
Using the example, which is provided above, hypothesis α = 0.2 , M = 100,000 , e = 1000 , we can draw the change trend of the expected income of mining enterprises with d, c, p, and Q under mode I, as shown in Figure 5.
The expected profits of mining enterprises under mode II are:
g B * = M ( 1 + α ) e c ( S Q ρ 1 ) ρ 2 + ( p c ρ 2 ρ 1 ) ( F 1 ( 1 d ρ 1 p ρ 1 c ρ 2 ) 0 F 1 ( 1 d ρ 1 p ρ 1 c ρ 2 ) F ( x ) d x ) d F 1 ( 1 d ρ 1 p ρ 1 c ρ 2 )
Solving the first-order condition of the above formula with respect to p, d, c, and Q, we obtain:
g B * p = q * 0 q * F ( x ) d x > 0 g B * c = ρ 2 ρ 1 ( q * 0 q * F ( x ) d x ) ρ 2 ( S Q ρ 1 ) < 0 g B * d = q * < 0 g B * Q = c ρ 2 ρ 1 > 0
It can be seen that, under mode II, mining enterprises will sell part of the tailings, and the optimal sales volume of tailings decreases with an increase in the purchase price of new ultra-high-water filling materials and the cost of tailings treatment, so the income of mining enterprises will be lower. The optimal sales volume of tailings increases with the increase in the sales price of tailings, so higher profits are obtained. Although the total amount of tailings in mining enterprises will not affect the sales amount of tailings, the higher the total amount of tailings, the fewer replacement filling materials need to be purchased, and the lower the costs, so the profits will increase.
In order to better show the changing trend of mining enterprises’ income along with the sales price of tailings, the total amount of tailings, the treatment cost of tailings, and the purchase price of new inorganic water solid materials, the expected income of mining enterprises under mode II is drawn along with the changing trend of d, c, p, and Q, as shown in Figure 6.
As can be seen from Figure 6 the expected income of mining enterprises under model II increases with the increase in tailing sand sales price and total amount, and decreases with the increase in the tailing sand treatment cost and purchase price of new inorganic water solid materials, which is consistent with the above conclusion.
The expected profits of mining enterprises under mode I I I are:
g C * = M ( 1 + α ) e c ( S Q ρ 1 ) ρ 2
Solving the first-order condition of the above formula with respect to c and Q, we obtain:
g C * c = ρ 2 ( S Q ρ 1 ) < 0 g C * Q = c ρ 2 ρ 1 > 0
Therefore, the expected profits of mining enterprises under mode III decrease with the increase in the purchase price of new filling materials, and they increase with the increase in the total amount of tailings.
In order to better show the changing trend of mining enterprises’ income, the expected income of mining enterprises under mode III is drawn along with the changing trend of c and Q, as shown in Figure 7.
According to Figure 7, in mode III, mining enterprises use all tailings for gob filling and do not sell tailings in the market, so there is no treatment cost. Therefore, the sales price and treatment cost of tailings as exogenous parameters will not affect the income of mining enterprises. Since the entire goaf cannot be filled only with tailing sand, it is necessary to purchase new ultra-high-water filling materials as alternative filling materials. The higher the purchase price per unit of alternative materials, the greater the purchase cost that mining enterprises need to pay, and the lower the corresponding profits. With a greater total amount of tailings held by mining enterprises, fewer replacement filling materials need to be purchased, meaning a lower cost and, correspondingly, the profits of mining enterprises will increase.
Based on the above, the correlation between the income of mining enterprises and the sales price of tailings, the total amount of tailings, the treatment cost of tailings, and the purchase price of new inorganic water solid materials under different modes is obtained.

3.3. Comparison and Analysis with Non-Filling Mode

The goaf filling management mode is divided into three types, and the income obtained by mining enterprises under each mode is different. From an economic point of view, it is necessary to ensure that mining enterprises have the willingness to fill the goaf. Therefore, the following three filling modes are compared with the non-filling schemes, in order to provide theoretical support for the selection of appropriate filling schemes.
In order to facilitate model comparison, the goaf non-filling scheme is taken as the benchmark model (Mode O), α = 0 , and the expected income of mining enterprises is:
      g O * = M e
The difference in the earnings of mining enterprises under mode I and mode O ( g A O * = g A * g 0 * ) is as follows:
g A O * = M α e c ( S Q ρ 1 ) ρ 2 + ( p c ρ 2 ρ 1 ) ( Q 0 Q F ( x ) d x ) d Q      
When Formula (16) is greater than zero, mining enterprises would like to choose a mode that only uses new filling material, which would bring more benefits than the non-filling mode.
Solving for g A O * > 0 , we obtain p > d Q M α e + c ρ 2 ( S Q / ρ 1 ) Q 0 Q F ( x ) d x + d 1 F ( Q ) , because c ρ 2 ρ 1 + d 1 F ( Q ) < p < p - , compared with d Q M α e + c ρ 2 ( S Q / ρ 1 ) Q 0 Q F ( x ) d x and c ρ 2 ρ 1 + d 1 F ( Q ) , including the following circumstances:
(1)
When d Q M α e + c ρ 2 ( S Q / ρ 1 ) ρ 2 Q 0 Q F ( x ) d x < d 1 F ( Q ) , so there is always g A O * > 0 , so mining enterprises would like to fill the mined-out areas.
(2)
When d Q M α e + c ρ 2 ( S Q / ρ 1 ) ρ 2 Q 0 Q F ( x ) d x > d 1 F ( Q ) , and when p 0 < p < p - , g A O * > 0 , so mining enterprises would like to fill the mined-out areas.
(3)
When d Q M α e + c ρ 2 ( S Q / ρ 1 ) ρ 2 Q 0 Q F ( x ) d x + c ρ 2 ρ 1 - > p - , no exiting g A O * > 0 , so mining enterprises would not like to fill the mined-out areas.
Therefore, it can be seen that under mode I, mining enterprises are not always willing to fill the gob but are closely related to the sales price of tailings.
The difference in the earnings of mining enterprises under mode II and mode O ( g B O * = g B * g 0 * ) is as follows:
g B O * = M α e c ( S Q ρ 1 ) ρ 2 + ( p c ρ 2 ρ 1 ) ( F 1 ( 1 d ρ 1 p ρ 1 c ρ 2 ) 0 F 1 ( 1 d ρ 1 p ρ 1 c ρ 2 ) F ( x ) d x ) d F 1 ( 1 d ρ 1 p ρ 1 c ρ 2 )
When Equation (17) is greater than 0, compared with the non-filling scheme, the mixed filling mode of goaf by mining enterprises using new inorganic water solid materials and tailings can bring more benefits. Solving for g B O * > 0 , we obtain:
Q > ρ 1 { S M α e + ( p c ρ 2 / ρ 1 ) 0 F 1 ( 1 d ρ 1 p ρ 1 c ρ 2 ) [ 1 F ( x ) ] d x d F 1 ( 1 d ρ 1 p ρ 1 c ρ 2 ) c ρ 2 }  
If ρ 1 { S M α e + ( p c ρ 2 / ρ 1 ) 0 F 1 ( 1 d ρ 1 p ρ 1 c ρ 2 ) [ 1 F ( x ) ] d x d F 1 ( 1 d ρ 1 p ρ 1 c ρ 2 ) c ρ 2 } , use Q 0 to show up. When satisfying scheme 2 in Table 1, Q satisfies 0 < Q < F 1 ( 1 d ρ 1 p - ρ 1 c ρ 2 ) , compared with Q 0 and 0. When m a x Q 0 , 0 < Q < F 1 ( 1 d ρ 1 p ¯ ρ 1 c ρ 2 ) and c ρ 2 ρ 1 + d < p < p ¯ , mining enterprises would like to fill the mined-out areas.
Therefore, it can be seen that the willingness of mining enterprises to fill goaf under mode II is closely related to the total amount of tailings held.
The difference in the earnings of mining enterprises under mode III and mode O ( g C O * = g C * g 0 * ) is as follows:
g C O * = M α e c ( S Q ρ 1 ) ρ 2            
When Formula (19) is greater than zero, the mixed filling mode of goaf by mining enterprises using new inorganic water solid materials and tailings can bring more benefits than the non-filling scheme. Solving for g C O * > 0 , we obtain: c < M α e ( S Q / ρ 1 ) ρ 2 . At the same time, the sales price of tailing sand also needs to be met p < c ρ 2 ρ 1 + d under mode III. Transforming this formula, we obtain: c > ( p d ) ρ 1 ρ 2 ; only when M α e ( S Q / ρ 1 ) ρ 2 > ( p d ) ρ 1 ρ 2 , c is meaningful, so we obtain: p < d + M α e S ρ 1 Q . In a word, both meet p < d + M α e S ρ 1 Q and ( p d ) ρ 1 ρ 2 < c < M α e ( S Q / ρ 1 ) ρ 2 , so mining enterprises would like to fill the mined-out areas.

3.4. Application

The iron ore in the Zoumaling section of Shimen Mining Area of Lanling Penghui Mining Co., Ltd. (Zaozhuang City, China) is located at the junction of Lanling County and Zaozhuang City, and the administrative division is under the jurisdiction of Lu-urban and rural areas of Lanling County. The mining area is located in the southern edge of the low hill region of southern Shandong Province, which is the transition zone between the southern mountain area of southern Shandong Province and the northern Jiangsu Plain. It is a gentle hilly area with a small height and gentle slope. The highest mountain, Fengtuo Mountain, has a height of 193.0 m, and the lowest altitude is 70 m, generally between 70 and 186 m, and the slope is generally about 15°. The surrounding rock of the deposit has a single lithology, and both surrounding rock and ore body belong to hard rock with high strength and good stability, and the engineering geological conditions are still simple. The mining method of shallow hole deposit and subsequent stoping and subsequent stoping are adopted. The ore block is arranged along the strike of the ore body. The length of the ore block is about 50 m, the height is the height of the stage, and the width is the thickness of the ore body. There are 7 m pillars between the blocks. Penghui Mining ore is sold at CNY 1000/ton. The goaf left by mining is in urgent need of filling treatment, and Lanling Penghui Mining Co., Ltd. has built a set of filling systems to fill the goaf to ensure that the surface will not collapse and to prevent harmful deformation after mining. Due to the large goaf area, the ore output of goaf is 18,250,000 t and the total filling amount is 150,000 m3. According to the actual production experience of similar mines, the design requires the newly generated gob to be filled within 1 to 2 months after mining, and the total production of tailing sand is 730,000 t. According to the situation in Linyi and surrounding areas, the demand for tailing sand in the market is about 2,000,000 t, and the selling price of tailing sand is CNY 50 /ton. The price ceiling is CNY 65/ton, the tailing sand reservation treatment cost is CNY 20 /ton, the cost of the new high-water filling material of Shandong Gufengyuan Technology Co., Ltd. (Zaozhuang City, China) is CNY 900/ton, and the resource increase rate is set at 0.15. Please see Table 2.
According to the interval range given in Table 1, substituting the above data, get F 1 ( 1 d ρ 1 p - ρ 1 c ρ 2 ) = 2,000,000 × ( 1 20 × 200 65 × 200 900 × 5 ) = 1,058,823 t , satisfied 0 < Q < F 1 ( 1 d ρ 1 p - ρ 1 c ρ 2 ) , a n d c ρ 2 ρ 1 + d = 900 × 5 200 + 20 = 42.5 , c ρ 2 ρ 1 + d 1 F ( Q ) = 900 × 5 200 + 20 0.635 = 54 , satisfied c ρ 2 ρ 1 + d < p < c ρ 2 ρ 1 + d 1 F ( Q ) . Therefore, Penghui Mining should choose mode II, the new high-water filling material + partial tailings mixed filling mode. When tailings sold at F 1 ( 1 d ρ 1 p ρ 1 c ρ 2 ) = 2,000,000 × ( 1 20 × 200 50 × 200 900 × 5 ) = 545,454 is the optimal tailings volume for Penghui Mining. The higher the unit tailings disposal cost, the less the sales revenue, so Penghui Mining should reduce the sales volume of tailings. The higher the price of purchasing new inorganic water solid materials, the more enterprises will use tailings to fill the goaf, thus reducing the sales volume of tailings. This is because the procurement cost of new inorganic water solid materials is higher, but the benefits are less. For mining enterprises, purchasing too much new inorganic water solid materials at a higher price is not the best decision, but the use of tailings for filling is better. The higher the market price of tailings, the more Penghui Mining will benefit from the sales process, and the more it will increase the sales volume of tailings.
Under different conditions, mining enterprises will choose different gob filling modes, and the income of mining enterprises under different modes is also different. From the above content, it can be seen that by using MATLAB R2022b to substitute the actual parameters into Equation (11), the expected profit of Penghui Mining is 20,328,925,000. According to the goaf non-filling scheme, g O * = M e = 18,250,000,000 , Penghui Mining’s profits increased to g B O * = g B * g 0 * = 20,328,925,000 18,250,000,000 = 2,078,925,000 . Therefore, compared with the model of no filling and no treatment of goaf, Penghui Mining has increased its income by about 18,250,000,000 + 2,078,925,000 / 18,250,000,000 1 = 11 % . It can be seen that the model is feasible and verified.

4. Discussion

At present, there is relatively little research on mining economics. From the above, it can be seen that there is still insufficient research on the economy of mined-out area treatment with new ultra-high-water filling materials. The above literature does not take into account the sales of tailing sand in the market. In the real environment, the price of tailing sand in the market is constantly increasing, meaning that mining enterprises can obtain higher profits. Therefore, under the premise of ensuring technical safety and reliability, mining enterprises try to maintain the balance between selling tailing sand and purchasing new ultra-high-water filling materials, and this paper will be widely used in practical applications. The current research shows that it is mainly used in newspaper sales, retail inventory management, and catering inventory management. The newsboy model can help enterprises reduce inventory costs, maximize profits, and provide decision support, through the modeling of demand distribution and profit function, solving to optimize the target. At present, there is no research combined with mining engineering.
Based on the results, from the perspective of economic benefit, the economic model of goaf filling management was analyzed. Based on three filling modes constructed in this paper (mode I: new ultra-high-water material filling mode; mode II: the new ultra-high-water material and part of the tailings mixed filling mode; mode III: the new ultra-high-water material plus all-tailings mixed filling mode), the constraints of the establishment of the three modes and the optimal sales decision of tailings under each mode are obtained. Through the analysis, the correlation between the optimal decision of tailings, the expected income of mining enterprises and the total amount of tailings, the sales price, the treatment cost, and the purchase price of new filling materials are obtained. On the one hand, the purpose of this paper is to establish an economic model of goaf management and to study which scheme in the goaf filling mine can obtain the greatest benefits under each circumstance, and through the model to study the correlation of each factor by correlation analysis. On the other hand, based on the theory of engineering technical and economic analysis, the technical and economic rationality of treating a metal mine goaf with new high-water filling material is analyzed, and the related economic indicators are calculated and analyzed. It solves the problem of a shortage of filling materials and the increase in relative filling cost caused by the utilization of tailings resources; realizes a win–win situation regarding safety and economic benefits; and guarantees the efficiency, effect, and benefit of the goaf treatment stage. Although there are important discoveries revealed by these studies, there are also some limitations. Also, this is an important future direction for further research.

5. Conclusions

This paper analyzes the feasibility and importance of the mine filling treatment of gob from the perspective of economic benefit and discusses how to choose which filling mode under which circumstances can ensure the maximum profit of mines.
The economic model of gob filling management is analyzed from the perspective of economic benefit, and three filling modes are provided. Mode I: a new type of ultra-high-water material filling mode; mode II: a new ultra-high-water material, partial tailings mixed filling mode; mode III: a new ultra-high-water material, all-tailings mixed filling mode. The constraints of the establishment of three modes and the optimal sales decision of tailings under each mode are provided. Then, the correlation between the optimal decision of tailings and the expected income and the total amount of tailings, the sales price, the treatment cost, and the purchase price of new inorganic water solid materials are studied. Finally, compared with the non-filling scheme of the goaf, whether the new inorganic water solid material filling of the goaf can produce more economic value is studied, providing theoretical support to help mining enterprises choose the appropriate filling scheme. The economic model of goaf management established in this paper can solve the following problems: (1) What are the plans for goaf filling and management, and what are the boundary conditions? (2) Which factors will have an impact on the goaf filling treatment scheme (positive and negative impacts) and how? (3) Are mining enterprises willing to fill the goaf compared with the non-filling scheme? If so, what are the conditions? In a word, it solves the problem of a shortage of filling materials and the increase in relative filling costs caused by the utilization of tailings resources; realizes a win–win situation regarding safety and economic benefits; guarantees the efficiency, effect, and benefit of the goaf treatment stage; provides a theoretical basis for the economy of goaf treatment with high-water filling; promotes the development of goaf treatment technology and the theoretical supplementation of the mine economic model; and provides a reference for similar mine goaf management.

Author Contributions

Methodology, C.P.; validation, C.P.; formal analysis, C.P.; Conceptualization, Y.L.; resources, Y.L. and C.P.; writing—original draft preparation, C.P.; visualization, Y.L.; supervision, Y.S.; funding acquisition, Y.L. All authors have read and agreed to the published version of the manuscript.

Funding

This research was funded by the Shandong Provincial Natural Science Foundation (No. ZR2023QG073).

Data Availability Statement

Not applicable.

Acknowledgments

The authors acknowledge the Shandong Provincial Natural Science Foundation.

Conflicts of Interest

The authors declare no conflict of interest.

References

  1. Wei, Z.X.; Zhao, M.; Xie, F.; Hong, C.S.; Hong, D.J.; Hui, D.; Yang, D. Detection of former goaf and analysis of deformation characteristics of overburden in Dameidong coal mine. Front. Earth Sci. 2023, 11, 1111745. [Google Scholar] [CrossRef]
  2. Blinova, F.; Ponomarenko, T.; Knysh, V. Analyzing the Concept of Corporate Sustainability in the Context of Sustainable Business Development in the Mining Sector with Elements of Circular Economy. Sustainability 2022, 14, 8163. [Google Scholar] [CrossRef]
  3. Xu, Z.C.; Xu, W.; Zhu, Z.H.; Zhao, J.Y. Research on monitoring and stability evaluation of ground subsidence in gypsum mine goaf. Front. Environ. Sci. 2023, 10, 1097874. [Google Scholar] [CrossRef]
  4. Luthra, S.; Mangla, S.K.; Sarkis, J.; Tseng, M.L. Resources melioration and the circular economy: Sustainability potentials for mineral, mining and extraction sector in emerging economies. Resour. Policy 2022, 77, 102652. [Google Scholar] [CrossRef]
  5. Smoliński, A.; Malashkevych, D.; Petlovanyi, M.; Rysbekov, K.; Lozynskyi, V.; Sai, K. Research into Impact of Leaving Waste Rocks in the Mined-Out Space on the Geomechanical State of the Rock Mass Surrounding the Longwall Face. Energies 2022, 15, 9522. [Google Scholar] [CrossRef]
  6. He, R.X.; Liu, H.; Ren, F.Y.; Li, G.H.; Zhang, J.; Zhou, Y.J. Comprehensive Evaluation and Decision for Goaf Based on Fuzzy Theory in Underground Metal Mine. Adv. Civ. Eng. 2022, 2022, 3104961. [Google Scholar] [CrossRef]
  7. Yang, L. Study on Safety Hazard Investigation and Treatment Scheme in a Marble Mine Goaf. Acad. J. Arch. Geotech. Eng. 2022, 4, 24–30. [Google Scholar]
  8. Han, C.P.; Du, C.; Zu, F.J.; Gao, J.H. Factors Influencing the Stability of a Slope Containing a Coal Seam in a Goaf. Appl. Sci. 2022, 12, 11699. [Google Scholar] [CrossRef]
  9. Ding, Z.; Liu, P.; Cui, P.; Hong, C.Y. Strength Development and Environmental Assessment of Full Tailings Filling Materials with Various Water-to-Binder Ratios. Metals 2023, 13, 122. [Google Scholar] [CrossRef]
  10. Yang, P.; Liu, L.; Sou, Y.L.; Qu, H.S.; Xie, G.; Zhang, C.X.; Deng, S.C.; Lv, Y. Investigating the synergistic effects of magnesia-coal slag based solid waste cementitious materials and its basic characteristics as a backfill material. Sci. Total Environ. 2023, 880, 163209. [Google Scholar] [CrossRef]
  11. Li, T.; Chen, G.B.; Qin, Z.C.; Li, Q.H.; Cao, B.; Liu, Y.L. The gob-side entry retaining with the high-water filling material in Xin’an Coal Mine. Geomech. Eng. 2020, 22, 541. [Google Scholar]
  12. Behera, S.K.; Ghosh, C.N.; Mishra, K.; Mishra, D.P.; Prashant, S.; Mandal, P.K.; Buragohain, J.; Sethi, M.K. Utilization of lead–zinc mill tailings and slag as paste backfill materials. Environ. Earth Sci. 2020, 79, 1–8. [Google Scholar] [CrossRef]
  13. Xie, S.R.; Wang, E.; Chen, D.D.; Li, H.; Jiang, Z.S.; Yang, H.Z. Stability analysis and control technology of gob-side entry retaining with double roadways by filling with high-water material in gently inclined coal seam. Int. J. Coal Sci. Tech. 2022, 9, 52. [Google Scholar] [CrossRef]
  14. Li, Y.F.; Hu, N.Y.; Ye, Y.C.; Wu, M.L. Improved catastrophe progression method of underground goaf risk evaluation. J. Int. Fuzzy Syst. 2023, 44, 1–16. [Google Scholar] [CrossRef]
  15. Ma, T.X.; Lin, Y.; Zhou, X.B.; Zhang, M.Z. Grading Evaluation of Goaf Stability Based on Entropy and Normal Cloud Model. Adv. Civ. Eng. 2022, 2022, 9600909. [Google Scholar] [CrossRef]
  16. Wang, F.F.; Zou, P.; Meng, Z.H.; Li, A.B.; Liu, Z.Y.; Hu, W.J.; Ma, Z. Study on Stability of Goaf Pillars in Daqiao Phosphate Mine: Theoretical Calculation and Field Investigation. Geotech. Geol. Eng. 2019, 37, 1483–1492. [Google Scholar] [CrossRef]
  17. Liu, R. The Mechanical Model on Surface Subsidence Caused by Backfilling Mined-Out Area on Thick Loose Loess Layer: Taking a Sedimentary Bauxite Mine as an Example. Geotech. Geol. Eng. 2022, 41, 1083–1099. [Google Scholar] [CrossRef]
  18. Jia, H.W.; Yan, B.X.; Guan, K.; Liu, H.L.; Wu, Q.Z.; Yin, Y.T.; Liu, H.X. Stability Analysis of Shallow Goaf Based on Field Monitoring and Numerical Simulation: A Case Study at an Open-Pit Iron Mine, China. Front. Earth Sci. 2022, 10, 897779. [Google Scholar] [CrossRef]
  19. Belibi, T.A.E.; Yin, S.H.; Wang, L.M. Investigation on Mechanical Characteristics and Microstructure of Cemented Whole Tailings Backfill. Minerals 2021, 11, 592. [Google Scholar] [CrossRef]
  20. Nabassé, J.F.; Koupouli, T.; Belem, P.; Rivard, H.E. Direct shear tests on cemented paste backfill–rock wall and cemented paste backfill–backfill interfaces. J. Rock Mech. Geotech. Eng. 2016, 8, 472–479. [Google Scholar]
  21. Nasir, O.; Fall, M. Shear behaviour of cemented pastefill-rock interfaces. Eng. Geol. 2008, 101, 146–153. [Google Scholar] [CrossRef]
  22. Uskov, V.A.; Kondrat’ev, S.A.; Neverov, S.A. Economic Expediency of Copper Ore Mining with Waste Rock Fill of Secondary Stopes in the West Wing of the Oktyabrsky Deposit. J. Min. Sci. 2017, 53, 1090–1095. [Google Scholar] [CrossRef]
  23. Richard, G.; Ziggah, Y.Y.; Gyimah, M.D. A novel risk-adjusted discount rate methodology for mine economic evaluation—A case study. Int. J. Min. Miner. Eng. 2022, 13, 162–184. [Google Scholar]
  24. Valentín, P.; Luis, S.A.; Joaquín, S.; David, A.L.P. Profitability Index Maximization in an Inventory Model with a Price- and Stock-Dependent Demand Rate in a Power-Form. Mathematics 2021, 9, 1157. [Google Scholar]
  25. Askar, S.S.; AI-Khedhairi, A. Local and Global Dynamics of a Constraint Profit Maximization for Bischi–Naimzada Competition Duopoly Game. Mathematics 2020, 8, 1458. [Google Scholar] [CrossRef]
  26. Lee, S.; Choi, D.H. Dynamic pricing and energy management for profit maximization in multiple smart electric vehicles charging stations: A privacy-preserving deep reinforcement learning approach. Appl. Energy 2021, 304, 117754. [Google Scholar] [CrossRef]
  27. Xiao, X.Q.; Zhu, Z.Q.; Fu, Z.T.; Mu, W.S.; Zhang, X.S. Carbon Footprint Constrained Profit Maximization of Table Grapes Cold Chain. Agronomy 2018, 8, 125. [Google Scholar] [CrossRef]
  28. Li, X.M.; Miu, L.X.; Xu, Q.Q. Review on the research progress of newsboy model. Stat. Decis. Mak. 2008, 17, 11–14. [Google Scholar]
  29. Guo, Y.; Yan, R.; Wang, H. Maximization of container slot booking profits for carriers in the liner shipping industry. J. Shipp. Trade 2021, 6, 1–10. [Google Scholar] [CrossRef]
  30. Yu, H.B. The impact of demand uncertainty on minimizing cost and maximizing profit on the newsboy problem. Syst. Eng. Theory Pract. 2014, 34, 1756–1768. [Google Scholar]
  31. Ahiad, M.; Tal, A. The newsvendor problem with a non-stationary demand process and exact accounting of holding costs. IFAC–PapersOnLine 2022, 55, 2761–2766. [Google Scholar]
  32. Prasad, D.T.P.; Jha, J.K. A two-period newsvendor model for prepositioning with a post-disaster replenishment using Bayesian demand update. Soc. Econ. Plan. Sci. 2021, 78, 101080. [Google Scholar]
Figure 1. Sketch map of gob stowing.
Sustainability 15 14772 g001
Figure 2. The enterprise’s optimal sales volume of tailings with p should be listed as: (a) the change trend in the optimal sales volume of enterprise tail sand with p   ( Q = 10,000 ) ; (b) the change trend in the optimal sales volume of enterprise tail sand with p   ( Q = 19,500 ) .
Sustainability 15 14772 g002
Figure 3. Mode selection of gob stowing.
Sustainability 15 14772 g003
Figure 4. The enterprise’s optimal sales volume of tailings with c , d , and p (mode II): (a) correlation between the optimal sales volume of enterprise tail sand and c; (b) correlation between the optimal sales volume of enterprise tail sand and d; (c) the correlation between the optimal sales volume of enterprise tail sand p.
Sustainability 15 14772 g004aSustainability 15 14772 g004b
Figure 5. The change trend of expected income of mining enterprise with c , d , p , and Q   (mode I): (a) correlation between expected return of mining enterprises and c; (b) correlation between expected return of mining enterprises and d; (c) correlation between expected return of mining enterprises and p; (d) correlation between expected return of mining enterprises and Q.
Sustainability 15 14772 g005aSustainability 15 14772 g005b
Figure 6. The change trend of expected income of mining enterprise with c , d , p , and Q (mode II): (a) correlation between expected return of mining enterprises and c; (b) correlation between expected return of mining enterprises and d; (c) correlation between expected return of mining enterprises and p; (d) correlation between expected return of mining enterprises and Q.
Sustainability 15 14772 g006aSustainability 15 14772 g006b
Figure 7. The change trend of expected income of mining enterprise with c and Q (mode III): (a) correlation between expected return of mining enterprises and c; (b) correlation between expected return of mining enterprises and Q.
Sustainability 15 14772 g007aSustainability 15 14772 g007b
Table 1. The optimal sales volume of tailings in mining enterprises.
The Total Amount of TailingsThe Sales Price of Tailings Optimal Decision of Mining Enterprises
  0 < Q < F 1 ( 1 d ρ 1 p - ρ 1 c ρ 2 ) c ρ 2 ρ 1 + d 1 F ( Q ) < p < p - Q
0 < Q < F 1 ( 1 d ρ 1 p - ρ 1 c ρ 2 ) c ρ 2 ρ 1 + d < p < c ρ 2 ρ 1 + d 1 F ( Q ) 1 F 1 ( 1 d ρ 1 p ρ 1 c ρ 2 )
Q F 1 ( 1 d ρ 1 p - ρ 1 c ρ 2 ) c ρ 2 ρ 1 + d < p < p - F 1 ( 1 d ρ 1 p ρ 1 c ρ 2 )
Q 0 c ρ 2 ρ 1 < p < c ρ 2 ρ 1 + d 0
Table 2. Parameters of Penghui Mine.
SymbolParameterSymbolParameter
U 2,000,000 e 1000
Q 730,000 c 900
S 150,000 M 18,250,000
p 50 α 0.15
p ¯ 65 ρ 1 200
d 20 ρ 2 5
Disclaimer/Publisher’s Note: The statements, opinions and data contained in all publications are solely those of the individual author(s) and contributor(s) and not of MDPI and/or the editor(s). MDPI and/or the editor(s) disclaim responsibility for any injury to people or property resulting from any ideas, methods, instructions or products referred to in the content.

