Article

Spatiotemporal Variations of Water Eutrophication and Non-Point Source Pollution Prevention and Control in the Main Stream of the Yellow River in Henan Province from 2012 to 2021

1
School of Management and Economics, North China University of Water Resources and Electric Power, Zhengzhou 450046, China
2
School of Water Conservancy, North China University of Water Resources and Electric Power, Zhengzhou 450046, China
3
College of Water Resources, North China University of Water Resources and Electric Power, Zhengzhou 450046, China
4
School of Geography, Earth and Environmental Sciences, University of Birmingham, Birmingham B15 2TT, UK
*
Author to whom correspondence should be addressed.
These authors contributed equally to this work.
Sustainability 2023, 15(20), 14754; https://doi.org/10.3390/su152014754
Submission received: 12 September 2023 / Revised: 6 October 2023 / Accepted: 9 October 2023 / Published: 11 October 2023

Abstract

:
Protecting the water quality of the Yellow River is of great significance to the ecological protection of the Yellow River Basin. The identification of spatiotemporal variations of the water environment and the implementation of measures to control non-point source (NPS) pollution are both key to improving the water quality. Between 2012 and 2021, we conducted assessments of eight indicators, including water temperature, dissolved oxygen (DO) and pH, chemical oxygen demand (CODMn), five-day biological oxygen demand (BOD5), total phosphorus (TP), NO3-N, and NH3-N at six sites in the main stream of the Yellow River in Henan. We explored the causes of changes in water eutrophication using multivariate statistical analysis and formulated recommendations to improve NPS pollution through adjustments in land use patterns. The results showed that temporal water eutrophication markedly decreased and it was most spatially severe in the east. The most effective control of water eutrophication was observed between 2016 and 2018. As the transition from the flood season to the non-flood season took place, the main source of NPS pollution changed from being primarily influenced by precipitation, to being predominantly attributed to agricultural runoff. We recommend addressing the increased soil erosion in the west and controlling the discharge of agricultural effluent in the east. During the flood season, the ecological interception zones can effectively intercept NPS pollution outputs. These findings offer valuable insights for future scientific management strategies to prevent and control NPS pollution in the river.

1. Introduction

In nature, water exists in various forms, and humans primarily utilize freshwater resources, specifically groundwater and surface water. These sources constitute a relatively small portion of the total global water resources [1]. Consequently, high-quality water resources play a pivotal role in preserving the ecological integrity and fostering social and economic development. In recent years, there has been effective management and control of point source pollution; however, NPS pollution originating from planting, livestock farming, and residential life poses a significant challenge [2], as it enters rivers through runoff and precipitation, making source control difficult [3]. Nitrogen and phosphorus emerge as the primary pollutants, and their excessive presence leads to phytoplankton blooms, oxygen depletion, and the demise of aquatic organisms. This situation poses a severe threat to the environmental safety of natural water bodies and results in water eutrophication. And the eutrophication of rivers seriously jeopardizes the safety of water utilization and the stability of aquatic ecosystems [4].
The Yellow River Basin, as the second-largest river basin in China, faces problems of water scarcity, water quality deterioration, and ecological degradation. The uneven spatial distribution of water resources in the Yellow River Basin, the total amount of water resources is on a decreasing trend; industry and agriculture have led to serious problems of water pollution, the 37 percent of the Yellow River’s sewage-carrying capacity carries more than 91 percent of the basin’s incoming pollution load; and natural changes and human activities have caused the ecological functions of the Yellow River Basin to deteriorate. Therefore, the Yellow River Basin holds a pivotal role in China’s economic and social development as well as ecological security. The protection and management of the Yellow River Basin carry substantial strategic significance, encompassing flood control, water supply, food security, energy security, and ecological security [5]. At the same time, the water quality of the Yellow River directly impacts the safety of drinking water and industrial irrigation water in the provinces along its course [6]. It is necessary to conduct a scientifically rigorous analysis of the current state of water eutrophication within the Yellow River. Over the past decade, increased attention from both the state and government has been directed toward pollution prevention and control within the Yellow River Basin, leading to the implementation of numerous policy measures. But fewer studies provided systematic analyses of the spatial and temporal changes of water quality in the Yellow River over extended time series. In this paper, we analyzed, in detail, the mechanisms of spatiotemporal variations in the water environment over the past decade and identified the optimal period for water quality improvement combining the redundancy analysis (RDA) and Mann–Kendall test.
After recognizing the current status of the water trophic state, how to carry out the control of NPS pollution more effectively has become an issue that cannot be ignored. In recent years, many studies have found rational land use allocation is key to controlling NPS pollution output [7]. Ongoing human modifications to the land use system bring about changes in surface vegetation types, consequently impacting surface runoff dynamics [8,9]. For example, the presence of agriculture in the vicinity of water resources raises the concentration of sediments and nutrients in the water and accelerates the flow of NPS pollutants, ultimately affecting the water quality within the watershed [10]. Therefore, it is scientifically important to accurately quantify the complex relationship between NPS pollution and land use.
Numerous studies have examined the relationship between land use and surface water quality. Santy et al. [11] observed that nutrients were particularly responsive to land use changes, with an expansion of agricultural land being a fundamental driver of increased nutrient levels. In the research conducted by Chang et al. [12], agricultural land, tea plantations, forested areas, and orchards were identified as the primary sources of nutrients in the Shah River Reservoir. Park et al. [13] demonstrated that total nitrogen (TN) and TP had a more significant impact on surface source pollution during rainfall events. Earlier studies have shown that past rapid urbanization developments and unwise land use practices can result in soil erosion and the loss of nitrogen and phosphorus, leading to widespread NPS pollution in rivers [14]; moreover, the impact of land use on water quality is closely related to the seasons [15]. Kim et al. [7] found that NPS pollution leads to nutrient and sediment enrichment during the summer, especially in high terrain agricultural areas, where large-scale erosion causes high levels of nitrogen and phosphorus pollution discharges, severely affecting water ecosystems. Therefore, it is necessary to understand how land use and hydrological seasons affect water quality. Currently, there is a substantial body of research on the connection between land use and water quality within single years, but there is a lack of studies that investigate the long-term impact of land use on river quality. Furthermore, fewer attention has been paid to the impacts of land use on water quality during different hydrological seasons. In this paper, we also recognized the main contributing factors of NPS pollution by land use, and controlled NPS pollution by different ways in various seasons. It is of great significance for NPS pollution control and improvement of surface water quality in agricultural areas.
Henan, situated in the middle and lower reaches of the Yellow River Basin, holds a pivotal role as a significant grain-producing region in China. In recent years, the extensive use of pesticides and fertilizers has led to a notable issue of NPS pollution. From 2012 to 2021, as the state and government have progressed in their water environment protection efforts within the Yellow River Basin, it has become imperative to elucidate the underlying causes of the spatiotemporal changes of water environment in the main stream of the Yellow River in Henan and establish strategies for future NPS pollution control. Our study focused on cities situated along the main stream of the Yellow River in Henan. We divided the data into the following distinct periods: the flood season (June to August) and the non-flood season (September to May). The main aims of this study are as follows: (1) Calculating the degree of water eutrophication through the application of a universal index formula utilizing logarithmic power functions. Additionally, analyze the spatiotemporal variations in water quality indicator concentrations and water eutrophication between 2012 and 2021. (2) Utilizing the Pearson’s correlation coefficient, Mann–Kendall test, and RDA to identify the optimal period for eutrophication improvement and the drivers behind these changes. (3) Analyzing the drivers’ variations during different periods and formulating recommendations for the prevention and control of NPS pollution by adjusting the spatial land use patterns. The results of this study offered a theoretical support for the management of NPS pollution in the main stream of the Yellow River in Henan.

2. Materials and Methods
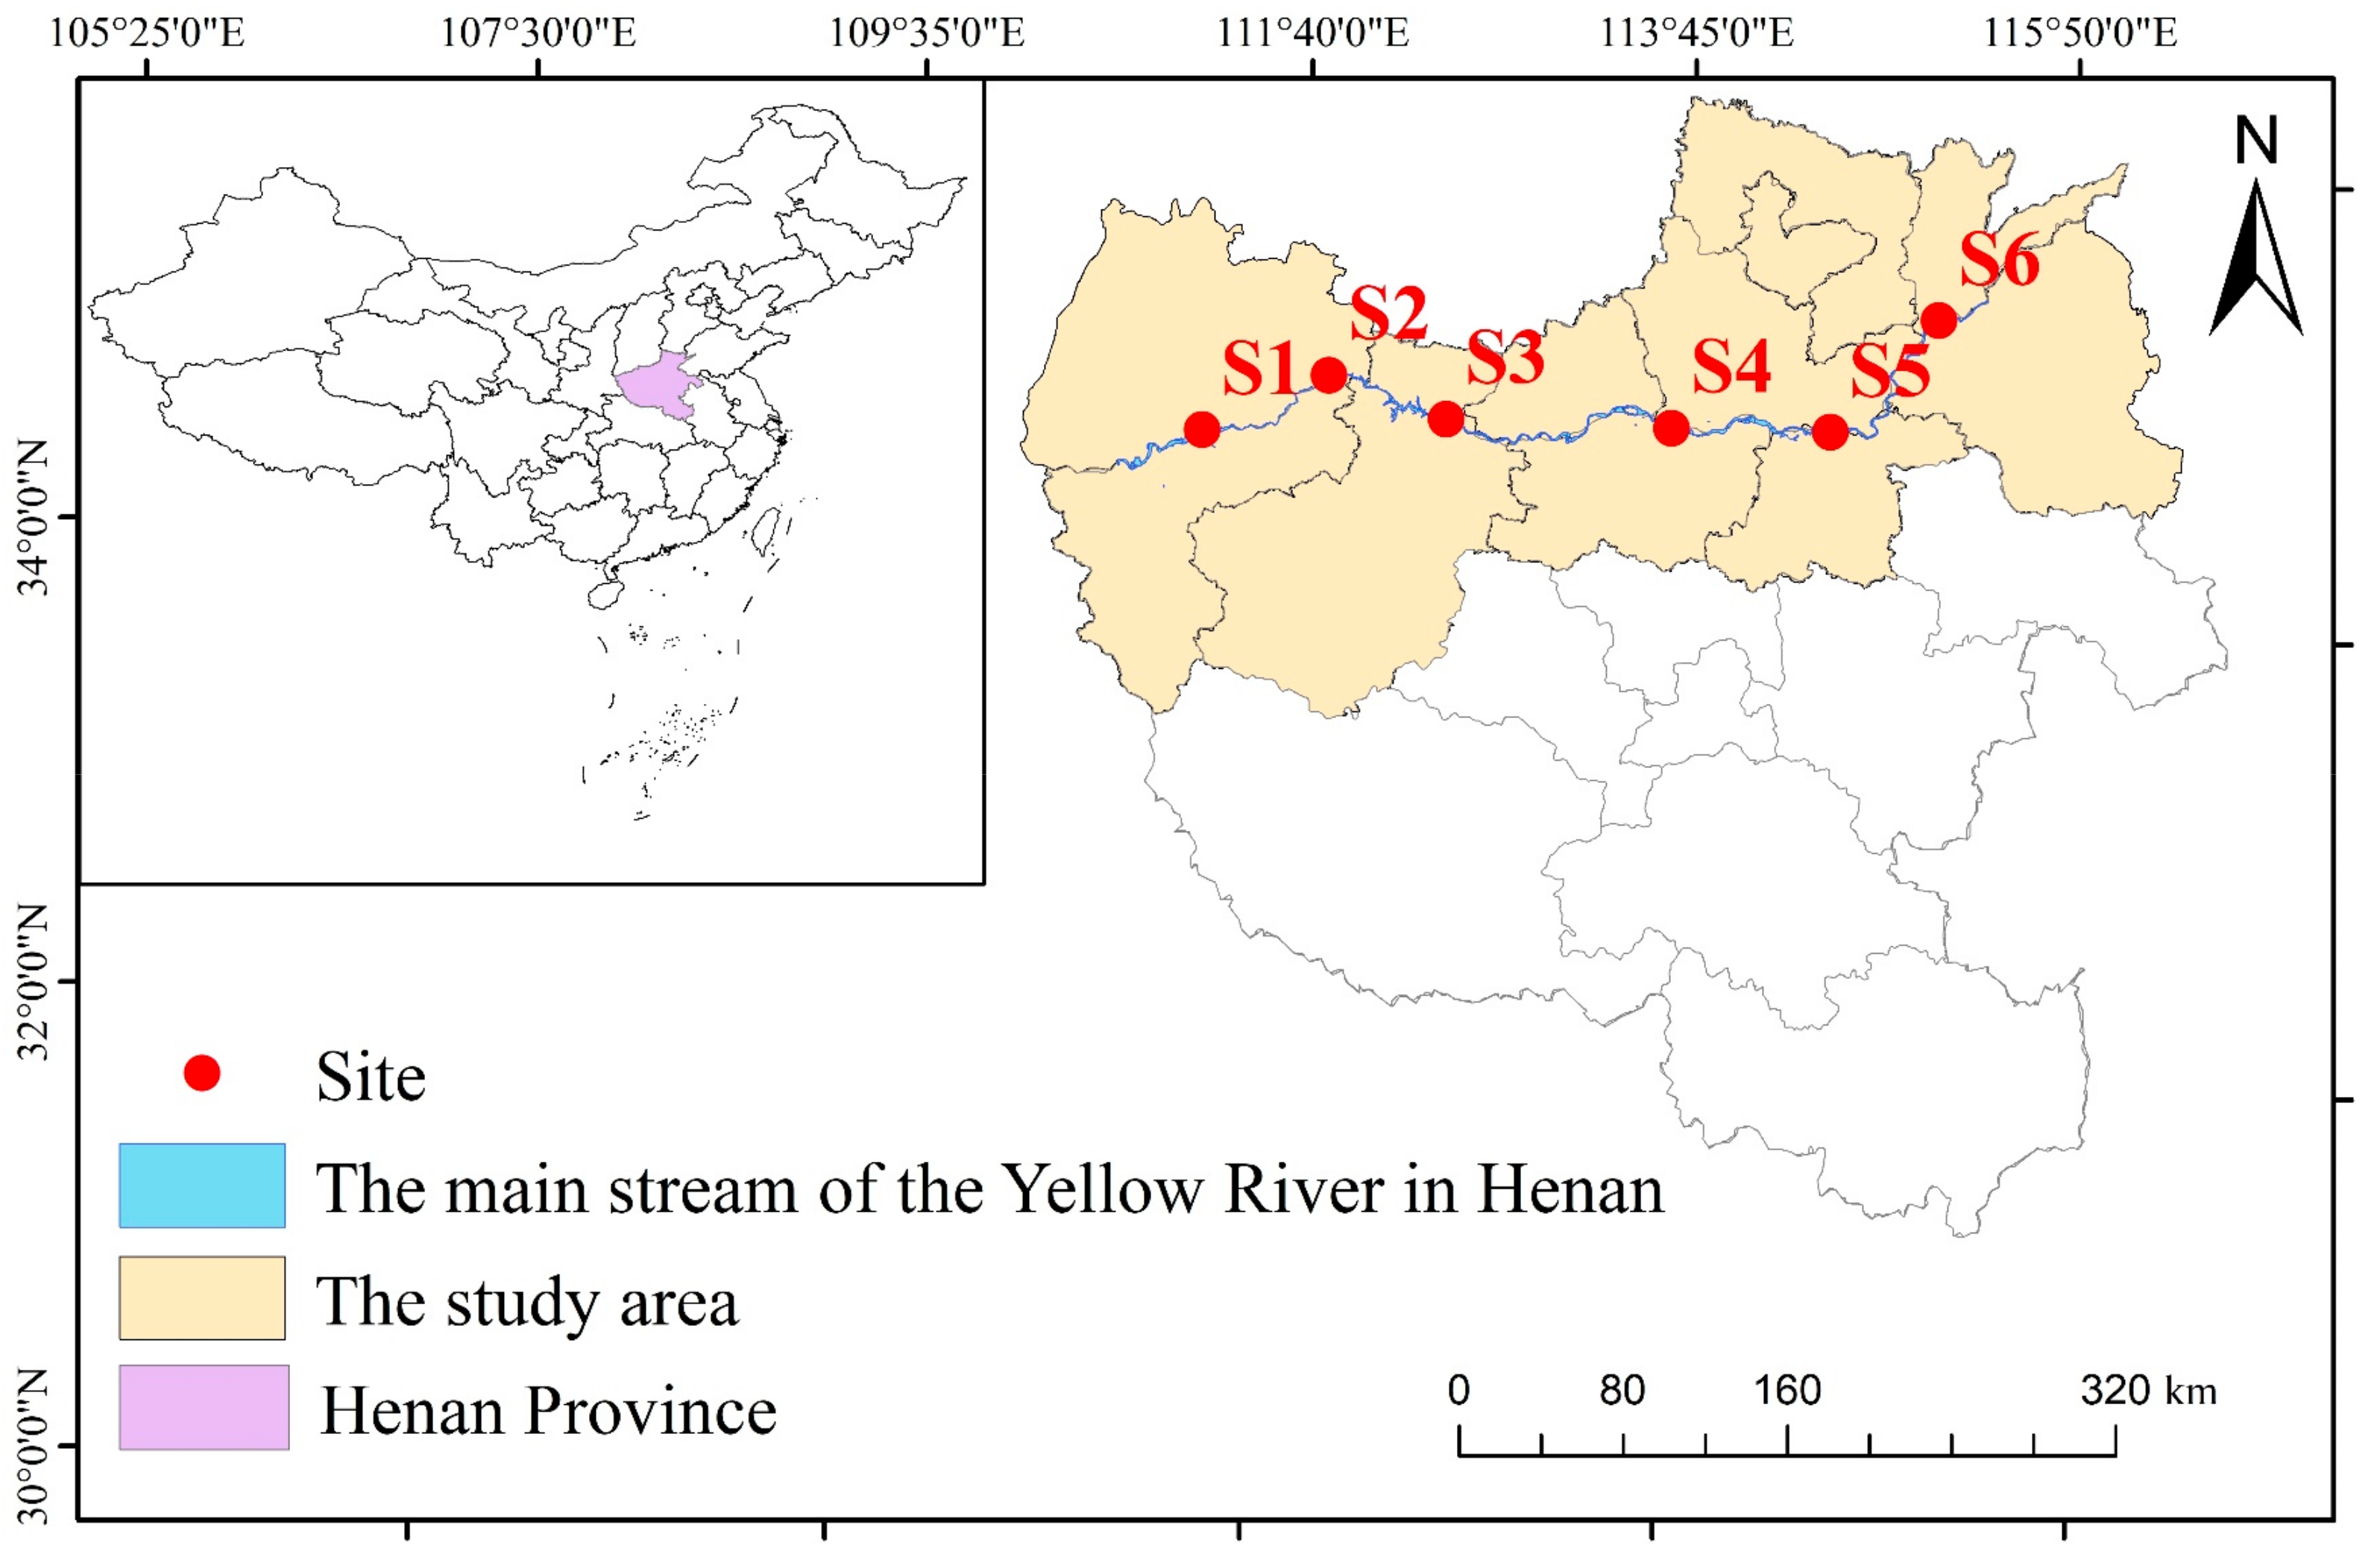
2.1. Study Area

The Yellow River originates from the Bayankala Mountains in Qinghai Province, traverses nine provinces, and ultimately discharges into the Bohai Sea in Shandong Province, covering a total distance of approximately 5464 km [16]. Water resources in Henan Province are unevenly distributed spatially, with more water resources in the western and southern regions, and less water resources in the northern, eastern, and central regions. With the development of industry, the amount of wastewater discharged in Henan Province is continuously increasing, and as a large agricultural province, the pollution caused by agricultural fertilization should not be underestimated. Overall, Henan Province is facing serious water pollution problems, and the sustainable use of water resources is threatened [17]. The main stream of the Yellow River within Henan Province is situated in the middle and lower reaches of the river. Henan Province (31°23′–36°22′ E, 110°21′–116°39′ N) holds significant historical importance as the main battleground for millennia-long Yellow River management efforts. It serves as the economic heartland of the Yellow River basin and forms a critical ecological barrier for the region [18]. In this study, we selected the cities located along the main course of the Yellow River in Henan Province as the study area. This area encompasses ten cities within Henan Province, namely, Sanmenxia, Luoyang, Zhengzhou, Kaifeng, Jiyuan, Jiaozuo, Xinxiang, Hebi, Anyang, and Puyang City. We also included Heze City in Shandong Province and Yuncheng City in Shanxi Province in the study area. The study area is shown in Figure 1.

2.2. Data Collection

The remote sensing data used in this study is the 2021 China Land Cover Dataset (CLCD), created by the research team of Yang Jie and Huang Xin at Wuhan University. This dataset provides a spatial resolution of 30 m [19]. For our analysis, we reclassified the dataset into the following six categories: cultivated land, forest land, grass, water, construction land, and unused land. In this study, we utilized land use data from the years 2012, 2014, 2016, 2018, and 2020 to explore the long-term impact of land use on water quality.
The water quality data used in this study comprise monthly monitoring data collected from six measurement stations situated along the main stream of the Yellow River in Henan from 2012 to 2021, which were offered by water environment monitoring center of the Yellow River. There are six National Water Function Zones located in the main stream of the Yellow River in Henan Province, with one station in each National Water Function Zone, namely, Sanmenxia Road Bridge (S1), Nancun (S2), Xiaolangdi (S3), Huayuankou (S4), Kaifeng Bridge (S5), and Gaocun (S6). We ensure these stations were sampled once from the 5th to 10th day of each month. The six stations are shown in Figure 1. Dissolved oxygen is one of the most important ecological parameters in water ecosystems; dissolved oxygen depletion due to water eutrophication is an important pathway leading to degradation of the water environment [20]. The growth of algae and large amounts of organic matter promote the aerobic bacteria growth, which consume large amounts of dissolved oxygen [21]. At the same time, water temperature and pH indirectly affect DO levels. And algal growth due to increased nutrients in the water is also a major factor in increased eutrophication [22]. Therefore, we selected eight indicators for analysis, encompassing physical indicators such as water temperature, DO and pH, as well as oxygen consumption indicators including CODMn and BOD5, and nutrients including TP, NO3-N, and NH3-N. The selection of these three types of indicators can more effectively explore the influence of indicators other than Chlorophyll-a on water trophic status and the internal mechanism of eutrophication.

2.3. Data Processing

The monitoring methods employed in this study adhere to the guidelines outlined in the Surface Water Environmental Quality Standard (GB 3838-2002) [23]. Specifically, DO and pH were measured using a HACH portable water quality analyzer, CODMn concentrations were assessed using the acid potassium permanganate method, BOD5 values were assessed employing the dilution and inoculation method, TP was quantified using ammonium molybdate spectrophotometry, NH3-N levels were determined nano-reagent photometric method, and NO3-N concentrations were measured via ultraviolet spectrophotometry. Furthermore, we defined the flood season as spanning from June to August [24], whereas the non-flood season was considered to extend from September to May.

2.4. Methods

2.4.1. Evaluation of Water Eutrophication

The universal index formula by logarithmic power function, as proposed by Li et al. [25], found extensive applicability in the assessment of eutrophication in lakes, reservoirs, and surface water bodies across China. In comparison to commonly utilized eutrophication evaluation methods, such as the trophic state index (TSI), this approach streamlines the number of formulas required while expanding the range of applicable indicators, thus exhibiting universal applicability. In this study, we selected several evaluation indicators, including DO, CODMn, BOD5, TP, NO3-N, and NH3-N. Firstly, the “standard value” of each index is calculated according to the normative transformation formula. Secondly, the trophic state of each index is calculated using logarithmic power function. Finally, the trophic state composite index is obtained by weighting. The trophic state composite index (EI) was calculated as follows:
E I j = 10.77 × ln x j 1.1826
E I = j = 1 n W j × E I j
X j = C j 0 / C j 2 C j C j 0   For   DO   1 C j > C j 0   For   DO   C j / C j 0 C j C j 0   For   other   indicators   1 C j < C j 0   For   other   indicators  
where EIj is the trophic state of indicator j; Wj is the weight value of indicator j, this paper sets the weight as equal weight, 1/6; EI is the trophic state composite index; Xj is the norm value of indicator j; Cj0 is the “extremely poor” nutritional value of indicator j, DO, CODMn, BOD5, NH3-N, NO3-N and TP was 40, 0.12, 0.1, 0.01, 0.1 mg/L, and 1 μg/L, respectively; Cj is the measured concentration of indicator j. Evaluation standard of eutrophication degree is shown in Table 1. The calculation process of water eutrophication was shown in Table S1.

2.4.2. Mann–Kendall Test

The Mann–Kendall test is particularly advantageous because it does not impose distribution assumptions on the samples and remains robust even in the presence of outliers. This makes it well-suited for analyzing trends and pinpointing abrupt change points within time series data, such as those related to precipitation, runoff, and water quality [26]. The Mann–Kendall test involves the calculation of the UF from the positive time series x, conversely, the calculation of the UB from the negative time series x, UB = −UF. Subsequently, UF and UB values are plotted on the same statistical graph, and the number of intersections between the UF and UB curves is scrutinized. If only one intersection is observed, and it falls within the critical confidence levels, this indicates a mutation occurring in the year corresponding to the intersection. In cases where multiple intersections or intersections outside the threshold are present, it is inconclusive that mutations occurred in those years, necessitating the application of complementary methods for further discrimination. In this study, we opted for a confidence level of α = 0.05 for the test. A positive Z value (Z > 0) signifies a significant upward trend, whereas a negative Z value (Z < 0) denotes a significant downward trend [27]. We executed the Mann–Kendall test through the software MATLAB 2021 using the water quality data to investigate the mutation period of water quality indicator concentrations and the EI between the years 2012 and 2021.
For the time series X, construct the order column Sk. where rj denotes the cumulative number of xi > xj (1 ≤ ji) in the j sample; the statistic Sk is defined as follows:
S k = j = 1 k r j
Assuming that the time series k is stochastically independent, the mean and variance of Sk are E[Sk] and Var [Sk], respectively.
E S k = k ( k 1 ) 4
V a r S k = k ( k 1 ) ( 2 k + 5 ) 72
The formula for defining the statistic UF is as follows, UF is a statistic of the standard normal distribution.
U F = S k E S k V a r S k

2.4.3. Statistical Analysis

RDA has the capability to map environmental and species factors onto a two-dimensional plane, allowing for the evaluation of correlations and contributions between these factors. In contrast to conventional linear regression techniques, this approach not only enables the analysis of the contributions of multiple explanatory variables but also facilitates the exploration of correlations between explanatory variables and their associated counterparts [28]. The length of the arrows in the resulting graphs reflects the degree of influence exerted by the environmental factors on the species. Longer arrows indicate stronger influence. When the angle between the arrow representing the species and the arrow depicting the environmental factor is less than 90°, it signifies a positive correlation between the two. Conversely, an angle exceeding 90° denotes a negative correlation. If the angle approximates or equals 90°, it suggests that there is no significant relationship between the two [29]. In this study, we employed the software Canoco 5.0 to elucidate the relationship between land use and water quality indicators. Specifically, we took the water quality indicators of the main stream of the Yellow River in Henan in 2012, 2014, 2016, 2018, and 2020 as species data, while utilizing the percentage of land use area in study area as environmental factors.
Additionally, to analyze the correlation between water eutrophication and each water quality indicators, we employed Pearson’s correlation coefficient with the software Origin 2021. Figure 2 illustrates the flow chart of the methodology followed in this paper.

3. Results and Discussion

3.1. Spatiotemporal Variations of Water Quality Indicators Concentrations

The temporal variations in the physicochemical indicator concentrations within the main stream of the Yellow River in Henan were presented in Figure 3. Figure 3a illustrates the changes in the physicochemical indicators’ concentrations from 2012 to 2021. Over this period, water temperature, DO, and pH exhibited an overall increasing trend. The respective ranges for these indicators were 14.71–18.27 °C, 7.64–9.74 mg/L, and 7.9–8.31. Additionally, when comparing the flood season with the non-flood season, it was observed that water temperatures were higher during the flood season than during the non-flood season. In contrast, the pH and DO concentrations exhibited the opposite trend, with higher values recorded during the non-flood season compared to the flood season. This phenomenon can be primarily attributed to elevated temperatures during the flood season, which promotes saturation of oxygen in the water, and oxygen escapes from the water [30]. The elevated temperatures promote the ionization of hydrogen ions in water, leading to a decrease in pH. In addition, precipitation is generally acidic, while the soil and water are mostly alkaline in the north of China, and the large amount of precipitation during the flood season has a neutralizing effect on the water and soil [31]. Figure 3b illustrates the variations in the concentration of oxygen consumption indicators. The CODMn concentration was often used as a composite index to gauge the degree of surface water contamination by organic and reductive inorganic substances. BOD5 is used to indicate the total amount of dissolved oxygen consumed in water when organic matter is oxidized and decomposed under the biochemical action of microorganisms, making it inorganic or gaseous. CODMn and BOD5 both reflect the oxygen consumption of organic matter. From 2012 to 2021, the overall fluctuation in the CODMn concentration was minimal, while the overall trend for the BOD5 concentration was an increase. The respective ranges for the CODMn and BOD5 concentration changes were 2.22–2.83 mg/L and 1.4–2.19 mg/L. Additionally, comparing the flood season with the non-flood season, it was observed that both CODMn and BOD5 exhibited higher concentrations during the flood season compared to the non-flood season. The primary reason for this phenomenon is the close relationship between the concentration of oxygen consumption indicators and the DO concentration in the water. An increase in the concentration of oxygen consumption indicators tends to intensify the decomposition process of organic matter, subsequently leading to greater oxygen consumption within the water body and, consequently, a decrease in the DO concentration [32]. Figure 3c provides an insight into the variations in nutrients concentrations. Over the period from 2012 to 2021, TP, NO3-N, and NH3-N concentrations displayed a significant decreasing trend. The concentration ranges for TP, NO3-N, and NH3-N were 0.059–0.133, 2.87–5.04, and 0.19–0.47 mg/L, respectively. When comparing the flood season to the non-flood season, it was observed that the concentration of TP was higher during the flood season as opposed to the non-flood season. This phenomenon can be attributed to the influx of phosphorus into the water due to rainfall flushing, leading to NPS pollution during the flood season. Consequently, the concentration of TP became higher compared to that during the non-flood season [33]. On the other hand, the NO3-N and NH3-N concentrations were higher during the non-flood season than in the flood season. This was mainly due to the fact that river mineralization significantly decreased with an increased flow during the flood season, and the NO3-N and NH3-N concentrations decreased when aquatic plants flourish in the summer.
In summary, over the period from 2012 to 2021, the concentrations of DO and nutrients in the main stream of the Yellow River in Henan exhibited significant improvement; however, there was an increase in the content of oxygen consumption indicators in this time. During the flood season, factors such as rising water temperatures and decreasing DO levels, along with high concentrations of oxygen-consuming organic pollutants and TP, were not conducive to the self-purification of the water body.
The spatial variations in the concentration of physicochemical indicators are depicted in Figure 4. Based on the multi-year averages from the six monitoring sites, the highest recorded water temperature was 17.04 °C at the Nancun. The lowest DO value, 7.72 mg/L, was observed at Xiaolangdi, while the highest NO3-N value (4.78 mg/L) was recorded at the same location; furthermore, Gaocun exhibited the highest values for both pH (8.19) and TP (0.17 mg/L). Sanmenxia Highway Bridge had the highest concentrations of CODMn (3.06 mg/L) and NH3-N (0.51 mg/L). Lastly, the highest concentration of BOD5 (2.26 mg/L) was observed at Kaifeng Bridge.
In summary, it is evident that the western region of the study area should prioritize the control of the CODMn and NH3-N concentrations, whereas the central and eastern regions need to focus on addressing the NO3-N and TP levels. We can elucidate the reasons for this phenomenon as follows: In the western region, the increase in CODMn concentration can be attributed to elevated organic matter content resulting from soil erosion and the decomposition of aquatic vegetation [31,34]. Additionally, the lower DO levels in the west had impeded the oxidation of NH3-N to NO3-N. However, as upstream water gradually supplies oxygen, dissolved oxygen levels recover, leading to the oxidation of NH3-N to NO3-N; moreover, the central part of the study area represented the fastest-growing urbanized region in Henan, while the eastern part experienced more frequent agricultural activities. The inflow of nitrogen and phosphorus that rich agricultural and industrial effluents, influenced by human activities, contributed to surface water via runoff. This exacerbated the concentrations of NO3-N and TP in the central and eastern regions [35]. Therefore, we recommend strengthening soil erosion control in the western region of the study area and enhancing the regulation of industrial and agricultural effluent discharge in the central and eastern regions.

3.2. Spatiotemporal Variations of the Trophic State

The temporal variations in the trophic state of the main stream of the Yellow River in Henan were depicted in Figure 5. The EI ranged from 43.44 to 49.21, consistently indicating a state of light eutrophication. The Z statistic, with a value of −3.5777, demonstrated a significant decreasing trend in EI from 2012 to 2021, and the slope of the fitting line was found to be 0.6912. Therefore, over the past decade, this result illustrated the effectiveness of water eutrophication management in the main stream of the Yellow River in Henan. However, it is noteworthy that the decreasing trend observed during this period was relatively gradual. When comparing the flood season to the non-flood season, it was observed that the EI registered higher values during the flood season in comparison to the non-flood season. This disparity can be attributed primarily to the increased rainfall and the substantial influx of water from the river during the flood season [23], resulting in elevated concentrations of TP. Simultaneously, rising temperatures and the presence of oxygen-depleting organic matter contributed to a reduction in DO, thereby exacerbating water eutrophication during the flood season. Consequently, the flood season emerged as a pivotal period of concern for government driven eutrophication management efforts.
The spatial variations in the trophic state are illustrated in Figure 6. Based on multi-year average values, all six sites fall within the category of light eutrophication. Notably, the Sanmenxia and Huayuankou exhibited the highest degrees of water eutrophication, with EI values of 50.23 and 49.59, respectively. This outcome was likely attributed to the substantial influx of nutrients into the river in these areas. Subsequently, the metabolic processes of microorganisms and aquatic organisms, which continuously oxidize and decompose organic matter, contribute to a reduction in DO levels and exacerbate water eutrophication. However, overall, the degree of water eutrophication was more severe in the eastern part of the main stream of the Yellow River in Henan. This can be primarily attributed to the significant inflow of oxygenated organic matter and nutrients from the west and central regions, largely driven by human activities. Additionally, the transportation of pollutants from the upper reaches to the lower reaches of the river, coupled with the accumulation of pollutants discharged in the east [36], had resulted in an adverse impact on the water quality in the eastern part of the main stream of the Yellow River in Henan. Therefore, the eastern region emerged as a pivotal area for government-led eutrophication control efforts.
In the past, for the main stream of the Yellow River, few studies have clarified the spatiotemporal variations characteristics of water eutrophication in the long series. In this paper, we divided the period into the flood season and the non-flood season, and explored the mechanisms by which the hydrological season affects the water quality, which has rarely been addressed in past studies. The results of this study are of great significance for the understanding the current status of eutrophication and the future formulation of the water environment protection policies for the Yellow River.

3.3. Drivers of Water Eutrophication Long Term Trends

Water environmental factors play a pivotal role in determining the trophic state of water bodies. To investigate the underlying causes of water eutrophication, this study elucidated the relationship between each of the water physicochemical indicators and the EI using Pearson’s correlation coefficient. As depicted in Figure 7, a pronounced positive correlation was observed between EI and both NO3-N and TP, with correlation coefficients of 0.92 and 0.91, respectively. Furthermore, the EI exhibited a noteworthy negative correlation with DO, which was characterized by a correlation coefficient of −0.91. This negative correlation suggested that the increase in nutrient levels fosters the proliferation of aquatic organisms, subsequently leading to increased oxygen consumption within the water [37].
In summary, water eutrophication was primarily influenced by TP, NO3-N, and DO. Lin et al. found that TP is the main factor of eutrophication in drinking water reservoirs in Taiwan based on principal component analysis. This result is consistent with the conclusion of this paper [38]. In well-aerated water conditions, NH3-N readily oxidizes into NO3-N. Both TP and NO3-N serve as nutrients for plant growth, promoting the proliferation of phytoplankton, which in turn leads to a decline in DO levels and exacerbates water eutrophication. This, in turn, contributes to the mortality of aquatic organisms. Notably, during the flood season, the already low levels of DO further deteriorate, intensifying the decline in water quality.
To investigate the reasons behind the long-term improvement in water eutrophication, we used RDA to assess the influence of land use on water quality. In general, cultivated land and grass exhibited a positive correlation with nutrient levels, whereas forest land showed a negative correlation with nutrient concentrations. The results of the effect of land use type on water quality were the same as in the study by Pei et al. [39]. However, in the past, there has been a lack of studies on the impact of land use on water quality during different seasons. In this paper, we divided the study period into flood and non-flood seasons, observing slight variations in the degree of correlation between water quality indicators and land use during different periods. As depicted in Figure 8, during the flood season, NO3-N and NH3-N were significantly and positively correlated with water. This suggests that during the flood season, water plays a significant role in transporting NO3-N and NH3-N, runoff from precipitation wash pollutants in the surface and into water bodies through hydrological cycles, the convergence of runoff is reflected in an increase in water area. During this period, based on the principles of NPS pollution formation, the increase in precipitation leads to an increase in the amount of nutrients carried by the runoff-producing processes [7], this plays a larger role in the process of NPS pollution. Thus, precipitation increases the impact of agricultural NPS pollution discharges on water quality. During the non-flood season, nutrients were not correlated with water, but were significantly positively correlated with cultivated land, and negatively correlated with forest land. This suggests that cultivated land is the main source of NPS pollutant production during runoff-producing production, and forest has a better retention of nutrients [40,41]. In summary, from flood season to non-flood season, the main contributing factor of NPS pollution shifted from precipitation to agricultural runoff. Precipitation exacerbates the effects of NPS pollution on water quality. The ability of forest land to intercept and inhibit pollutant output from water bodies plays a crucial role in enhancing water quality and preserving the ecological environment [42].
In this study, we initially employed the Mann–Kendall test to identify any potential shifts or mutations in the EI over time. However, as indicated in Figure 8, the intersection point of the EI fell outside the confidence interval. Consequently, we recognized the need for alternative methods to analyze the mutation period of water eutrophication during this decade. To address this, we combined the variations in the EI values with the mutation periods of key indicators, including DO, NO3-N, and TP, which exhibited significant correlations with water eutrophication. Around the year 2018, a noticeable upward trend in the DO concentration was observed. While NO3-N did not exhibit mutation points during this decade, it is worth noting that its concentration experienced a substantial decrease, dropping from 4.28 mg/L to 3.1 mg/L between 2017 and 2018. The mutation period for TP occurred from 2016 to 2017, displaying a marked downward trend. In summary, from 2016 to 2018, we observed a dramatic decline in the TP and NO3-N concentrations, a sharp increase in the DO concentrations, and a consistent reduction in the level of water eutrophication. Therefore, it can be concluded that the government’s efforts in managing water eutrophication were most effective during this specific time period.
Between 2016 and 2018, temporally, as presented in Table 2, there was a notable decrease in the area of cultivated land and grass, by 651.9879 km2 and 232.4916 km2, respectively. Conversely, there was a significant increase in forest area, by 240.7446 km2. Cultivated land and grass are the main sources of NH3-N, NO3-N, and TP, with forest land acting as an interceptor of pollutants. Consequently, due to the substantial reduction in cultivated land and grass and the substantial increase in forest land during this period, water eutrophication was ameliorated. Spatially, combining the Figure 9 and Table 3, between 2016 and 2018, cultivated land is mainly transferred to construction land with the area of 706.011 km2 in the east. Grassland is mainly transferred to forest land with the area of 108.286 km2, which is the main reason for the increase in the area of forest land in the south-west and north. Consequently, we discerned that the eastern part of the cities along the Yellow River in Henan featured a relatively extensive area of cultivated land, a pronounced deficiency of forested land, substantial fertilizer inputs, and low utilization efficiency. This combination of factors was the primary driver behind the heightened eutrophication observed in the eastern segment of the mainstream of the Yellow River in Henan.

3.4. Suggestions for NPS Pollution Prevention and Control

From 2012 to 2021, the DO level showed an increasing trend and the concentration of nutrients showed a decreasing trend in the main stream of the Yellow River in Henan, and both indicators were significantly improved. Water eutrophication has been effectively managed during this decade, with the most significant impact observed from 2016 to 2018. Spatially, the concentrations of CODMn and NH3-N were elevated in the western part of the Yellow River, while NO3-N and TP concentrations were higher in the central and eastern regions of the river. Eutrophication was more pronounced in the eastern segment due to the extensive cultivation of land and the scarcity of forested areas in this region. During the flood season, this phenomenon was exacerbated by reduced DO levels and increased precipitation. Hence, it is imperative for the government to pay attention to the prevention and control of NPS pollution, especially in areas with prominent agricultural activities, to ensure the continued management of water eutrophication.
In this paper, we have addressed the prevention and control of NPS pollution in the main stream of the Yellow River by proposing adjustments to the land use pattern. For the study area, our recommendations include reducing soil erosion and development of economic forests in the west, and control of cultivated land area in the east. For areas with high levels of NPS pollution in the east, not only can we control NPS pollution by adjusting land use patterns, but we can also use other measures by human intervention. For example, improving pesticide quality and ensuring that pesticides meet stringent environmental standards can significantly reduce their adverse impact on water quality. And effectively controlling quantities and routes of agricultural and rural wastewater discharges [43].
Transitioning from the flood season to the non-flood season, it is important to address the shift in NPS pollution sources. During the flood season, when precipitation plays a significant role, nitrogen and phosphorus pollutants are transported into the surface water, exacerbating water eutrophication. To combat this issue, the implementation of ecological interceptor belts and ecological interceptor ditches can be highly effective during medium to heavy rainfall conditions [44]. Specifically, ecological ridges are generally placed on both sides of the river and on the cultivated land in the banks. By raising and widening the ridges and planting plants with strong absorption capacities on the ridges, an ecological interceptor belts is formed. Ecological interceptor ditches are laid along the inside of the ridges, and various types of plants are planted at the bottom of the ditches to absorb nutrients in the water, and effectively intercept pollutants from the NPS [45]. During the non-flood season, agricultural runoff often carries a high concentration of pollutants, posing a direct threat to the water environment. To address this, we recommend implementing interception measures at the entry points of surface runoff. Chemical precipitation can be employed to treat the intercepted runoff, removal of phosphorus by applying a chemical reaction between metal ions from calcium, iron and aluminum salts, and phosphoric acid to produce phosphate deposits, before introducing the treated water into reservoirs. This approach is crucial to prevent the direct pollution of the water environment.
Few studies have studied spatiotemporal variations of the water quality of the Yellow River in the long series, and there is a lack of research on the intrinsic mechanisms of water eutrophication and the impacts of hydrological seasons on the water quality. This study provided more targeted suggestions for the management of water eutrophication in the middle and lower reaches of the Yellow River; however, the implementation of these recommendations faces several challenges. For example, Henan Province is a province with mainly agricultural production. The eastern part of the study area has a large area of cultivated land and a large proportion of rural population. With the rapid development of urbanization, this has led to a reduction in the use of cultivated land as well as the transfer of rural labor. At present, the fertilizer utilization rate in Henan Province is low, higher fertilizer input intensity will increase the emission of greenhouse gases, such as N2O, and the large enrichment of persistent organic pollutants and microplastics in farmland. Therefore, in cities with high urbanization rates, fertilizer and pesticides are a key concern when dealing with the problem of urban agricultural NPS pollution, and we need to be given to improving the efficiency of the utilization of input factors for cultivated land production.

4. Conclusions

This paper analyzed the spatiotemporal variations of water eutrophication using the universal index formula by logarithmic power function, and the internal mechanism of eutrophication in the main steam of the Yellow River from 2012 to 2021. We also explored the impact of land use on water quality in different seasons, and drivers of water eutrophication by multivariate statistical analysis. The main conclusions of this paper are as follows.
(1)
Temporally, from 2012 to 2021, there was a notable improvement in the concentrations of the DO and nutrients within the main stream of the Yellow River in Henan. The river consistently displayed a downward trend of light eutrophication. Spatially, the concentrations of CODMn and NH3-N were higher in the west. Additionally, the concentrations of NO3-N and TP were higher in the center and east. All sites indicated a state of light eutrophication. Consequently, future efforts, particularly during the flood season, should prioritize water eutrophication management in the east;
(2)
DO, NO3-N, and TP exerted the most significant influence on water eutrophication. The most effective management of water eutrophication occurred between 2016 and 2018. This success can be attributed to a substantial reduction in cultivated land and grass, alongside a significant increase in forest land area during this timeframe. Furthermore, from flood season to non-flood season, the main contributing factor of NPS pollution shifted from precipitation to agricultural runoff;
(3)
We had put forth recommendations for the prevention and control of NPS pollution. In the west, we proposed measures to reduce soil erosion and consider expanding forest land area as appropriate. In the east, we recommend the implementation of measures to control agricultural sewage discharge. During the flood season, the implementation of ecological interception zones and ecological interception ditches can effectively intercept NPS pollution outputs.
This study provided valuable insights into safeguarding river water quality and offers a theoretical foundation for the future implementation of efficient NPS pollution management strategies in cities along the main stream of the Yellow River in Henan.

Supplementary Materials

The following supporting information can be downloaded at: https://www.mdpi.com/article/10.3390/su152014754/s1. Table S1: Calculation process of water eutrophication.

Author Contributions

Conceptualization, Y.W.; methodology, Y.W.; software, Y.W.; validation, Y.W. and H.W.; formal analysis, Y.W.; investigation, H.W.; resources, H.W.; data curation, H.W.; writing—original draft preparation, Y.W.; writing—review and editing, J.L.; visualization, J.L.; supervision, X.Z.; project administration, Y.C.; funding acquisition, H.W. All authors have read and agreed to the published version of the manuscript.

Funding

This work was supported by the National Natural Science Foundation of China (No. 51979107, No. 51909091, No. 52209018), Science and Technology Projects of Water Resources Department of Henan Province, China (GG202332 and GG202334), the China Scholarship Council (No. 202108410234) and the North China University of Water Resources and Electric Power Innovation Ability Improvement Project for Postgraduates (NCWUYC-2023027).

Institutional Review Board Statement

Not applicable.

Informed Consent Statement

Not applicable.

Data Availability Statement

The data that support the findings of this study can be accessed upon reasonable request to the corresponding author.

Acknowledgments

All authors thank the water environment monitoring center of the Yellow River support.

Conflicts of Interest

The authors declare no conflict of interest.

References

  1. Buta, B.; Wiatkowski, M.; Gruss, Ł.; Tomczyk, P.; Kasperek, R. Spatio-temporal evolution of eutrophication and water quality in the Turawa dam reservoir, Poland. Sci. Rep. 2023, 13, 9880. [Google Scholar] [CrossRef] [PubMed]
  2. Zhang, Z.; Yu, N.; Zhang, Y.; Wang, Q.; Liu, D.; Deng, H.; Yao, X. Characteristics and source analysis of water pollution in dry season (November to March) of Dongping Lake (China). Agric. Water Manag. 2022, 273, 107875. [Google Scholar] [CrossRef]
  3. Liu, Y.; Li, H.; Cui, G.; Cao, Y. Water quality attribution and simulation of non-point source pollution load flux in the Hulan River basin. Sci. Rep. 2020, 10, 3012. [Google Scholar] [CrossRef]
  4. Sun, C.; Wang, S.; Wang, H.; Hu, X.; Yang, F.; Tang, M.; Zhang, M.; Zhong, J. Internal nitrogen and phosphorus loading in a seasonally stratified reservoir: Implications for eutrophication management of deep-water ecosystems. J. Environ. Manag. 2022, 319, 115681. [Google Scholar] [CrossRef] [PubMed]
  5. Lu, C.; Ji, W.; Hou, M.; Ma, T.; Mao, J. Evaluation of efficiency and resilience of agricultural water resources system in the Yellow River Basin, China. Agric. Water Manag. 2022, 266, 107605. [Google Scholar] [CrossRef]
  6. Qiu, M.; Zuo, Q.; Wu, Q.; Yang, Z.; Zhang, J. Water ecological security assessment and spatial autocorrelation analysis of prefectural regions involved in the Yellow River Basin. Sci. Rep. 2022, 12, 5105. [Google Scholar] [CrossRef]
  7. Kim, K.; Kim, B.; Eum, J.; Seo, B.; Shope, C.L.; Peiffer, S. Impacts of Land Use Change and Summer Monsoon on Nutrients and Sediment Exports from an Agricultural Catchment. Water 2018, 10, 544. [Google Scholar] [CrossRef]
  8. Dale, V.H. The relationship between land-use change and climate change. Ecol. Appl. 1997, 7, 753–769. [Google Scholar] [CrossRef]
  9. Kavhu, B.; Mashimbye, Z.E.; Luvuno, L. Detecting Connectivity and Spread Pathways of Land Use/Cover Change in a Transboundary Basin Based on the Circuit Theory. Geomatics 2022, 2, 518–539. [Google Scholar] [CrossRef]
  10. Gule, T.T.; Lemma, B.; Hailu, B.T. Implications of land use/land cover dynamics on urban water quality: Case of Addis Ababa city, Ethiopia. Heliyon 2023, 9, e15665. [Google Scholar] [CrossRef]
  11. Santy, S.; Mujumdar, P.; Bala, G. Potential Impacts of Climate and Land Use Change on the Water Quality of Ganga River around the Industrialized Kanpur Region. Sci. Rep. 2020, 10, 9107. [Google Scholar] [CrossRef]
  12. Chang, D.; Lai, Z.; Li, S.; Li, D.; Zhou, J. Critical source areas’ identification for non-point source pollution related to ni-trogen and phosphorus in an agricultural watershed based on SWAT model. Environ. Sci. Pollut. Res. 2021, 28, 47162–47181. [Google Scholar] [CrossRef] [PubMed]
  13. Park, M.; Choi, Y.S.; Shin, H.J.; Song, I.; Yoon, C.G.; Choi, J.D.; Yu, S.J. A Comparison Study of Runoff Characteristics of Non-Point Source Pollution from Three Watersheds in South Korea. Water 2019, 11, 966. [Google Scholar] [CrossRef]
  14. Wang, W.; Li, Z.; Shi, P.; Zhang, Y.; Pan, B.; Li, P.; Ding, S.; Li, J.; Bi, Z.; Wang, X. Vegetation restoration and agricultural management to mitigate nitrogen pollution in the surface waters of the Dan River, China. Environ. Sci. Pollut. Res. 2021, 28, 47136–47148. [Google Scholar] [CrossRef] [PubMed]
  15. Wang, D.; Huang, G.; Ding, H.; Zhang, X.; Wang, H.; Zhang, Z.; Li, D.; Zhao, J. Effects of Hydrological Season on the Relationship between Land Use and Surface Water Quality. Water 2023, 15, 2351. [Google Scholar] [CrossRef]
  16. Jia, X.; Li, C.; Cai, Y.; Wang, X.; Sun, L. An improved method for integrated water security assessment in the Yellow River basin, China. Stoch. Environ. Res. Risk Assess. 2015, 29, 2213–2227. [Google Scholar] [CrossRef]
  17. Gan, R.; Li, Y.N.; Yang, F.; Zhai, Y. Assessment of sustainable utilization lever of water resources in Henan Province based on a three-dimensional water footprint model. J. Water Resour. Water Eng. 2023, 34, 30–39. [Google Scholar]
  18. Chen, Z.; Zhang, Q.; Li, F.; Shi, J. Comprehensive Evaluation of Land Use Benefit in the Yellow River Basin from 1995 to 2018. Land 2021, 10, 643. [Google Scholar] [CrossRef]
  19. Yang, J.; Huang, X. The 30 m annual land cover dataset and its dynamics in China from 1990 to 2019. Earth Syst. Sci. Data 2021, 13, 3907–3925. [Google Scholar] [CrossRef]
  20. Knightes, C.D. Simulating Hypoxia in a New England Estuary: WASP8 Advanced Eutrophication Module (Narragansett Bay, RI, USA). Water 2023, 15, 1204. [Google Scholar] [CrossRef]
  21. Bai, S.; Wang, X.; Zhao, X.; Ren, N. Characterizing Water Pollution Potential in Life Cycle Impact Assessment Based on Bacterial Growth and Water Quality Models. Water 2018, 10, 1621. [Google Scholar] [CrossRef]
  22. Zhang, Y.; Chang, F.; Zhang, X.; Li, D.; Liu, Q.; Liu, F.; Zhang, H. Release of Endogenous Nutrients Drives the Transformation of Nitrogen and Phosphorous in the Shallow Plateau of Lake Jian in Southwestern China. Water 2022, 14, 2624. [Google Scholar] [CrossRef]
  23. GB 3838-2002; Environmental Quality Standards for Surface Water. State Environmental Protection Administration: Beijing, China,, 2002.
  24. Qin, G.; Liu, J.; Xu, S.; Sun, Y. Pollution Source Apportionment and Water Quality Risk Evaluation of a Drinking Water Reservoir during Flood Seasons. Int. J. Environ. Res. Public Health 2021, 18, 1873. [Google Scholar] [CrossRef] [PubMed]
  25. Li, Z.Y.; Wang, J.Y.; Guo, C. A universal index formula for eutrophic evaluation using a logarithmic power function. Acta Sci. Circumst. 2010, 30, 664–672. [Google Scholar]
  26. Wang, Y.; Guo, Y.; Zhao, Y.; Wang, L.; Chen, Y.; Yang, L. Spatiotemporal heterogeneities and driving factors of water quality and trophic state of a typical urban shallow lake (Taihu, China). Environ. Sci. Pollut. Res. 2022, 29, 53831–53843. [Google Scholar] [CrossRef]
  27. Dong, B.; Qin, T.; Wang, Y.; Zhao, Y.; Liu, S.; Feng, J.; Li, C.; Zhang, X. Spatiotemporal variation of nitrogen and phosphorus and its main influencing factors in Huangshui River basin. Environ. Monit. Assess. 2021, 193, 292. [Google Scholar] [CrossRef]
  28. Cheng, B.; Zhang, Y.; Xia, R.; Wang, L.; Zhang, N.; Zhang, X. Spatiotemporal analysis and prediction of water quality in the Han River by an integrated nonparametric diagnosis approach. J. Clean. Prod. 2021, 328, 129583. [Google Scholar] [CrossRef]
  29. Hong, Z.; Zhao, Q.; Chang, J.; Peng, L.; Wang, S.; Hong, Y.; Liu, G.; Ding, S. Evaluation of Water Quality and Heavy Metals in Wetlands along the Yellow River in Henan Province. Sustainability 2020, 12, 1300. [Google Scholar] [CrossRef]
  30. Wu, Y.; Wen, Y.; Zhou, J.; Wu, Y. Phosphorus release from lake sediments: Effects of pH, temperature and dissolved oxygen. KSCE J. Civ. Eng. 2014, 18, 323–329. [Google Scholar] [CrossRef]
  31. Bai, H.B.; Liu, S.M.; Yu, S.; Xue, B.L. Spatial-temporal evolution characteristics of water quality in Haihe River Basin. J. Beijing Norm. Univ. (Nat. Sci.) 2020, 56, 290–297. [Google Scholar]
  32. Chapra, S.C.; Camacho, L.A.; McBride, G.B. Impact of Global Warming on Dissolved Oxygen and BOD Assimilative Capacity of the World’s Rivers: Modeling Analysis. Water 2021, 13, 2408. [Google Scholar] [CrossRef]
  33. Li, S.; Wang, X.; Qiao, B.; Li, J.; Tu, J. First flush characteristics of rainfall runoff from a paddy field in the Taihu Lake watershed, China. Environ. Sci. Pollut. Res. 2017, 24, 8336–8351. [Google Scholar] [CrossRef]
  34. Zhou, X.; Wang, G. Nutrient concentration variations during Oenanthe javanica growth and decay in the ecological floating bed system. J. Environ. Sci. 2010, 22, 1710–1717. [Google Scholar] [CrossRef] [PubMed]
  35. Akhtar, N.; Ishak, M.I.S.; Bhawani, S.A.; Umar, K. Various Natural and Anthropogenic Factors Responsible for Water Quality Degradation: A Review. Water 2021, 13, 2660. [Google Scholar] [CrossRef]
  36. Qian, W.H.; Gao, Y.X.; Zhang, Y.M.; Yang, F.; Zhang, Z.W.; Zhao, Y.; Liu, Y.; Xu, D.T. Analysis of characteristics and reasons of temporal and spatial changes of Gehu Lake water quality based on multivariate statistical analysis. Water Resour. Hydropower Eng. 2021, 52, 116–128. [Google Scholar]
  37. Zhang, B.-L.; Cui, B.-H.; Zhang, S.-M.; Wu, Q.-Y.; Yao, L. Source apportionment of nitrogen and phosphorus from non-point source pollution in Nansi Lake Basin, China. Environ. Sci. Pollut. Res. 2018, 25, 19101–19113. [Google Scholar] [CrossRef]
  38. Lin, J.L.; Karangan, A.; Huang, Y.M.; Kang, S.F. Eutrophication factor analysis using Carlson trophic state index (CTSI) towards non-algal impact reservoirs in Taiwan. Sustain. Environ. Res. 2022, 32, 25. [Google Scholar] [CrossRef]
  39. Pei, L.; Wang, C.; Zuo, Y.; Liu, X.; Chi, Y. Impacts of Land Use on Surface Water Quality Using Self-Organizing Map in Middle Region of the Yellow River Basin, China. Int. J. Environ. Res. Public Health 2022, 19, 10946. [Google Scholar] [CrossRef]
  40. Fu, K.; Gao, H.J.; Li, F.D.; Wu, K.; Zhang, Q.Y.; Li, Z.; Mao, S.S.; Li, C.L.; Wang, J.Q. River water quality evaluation and analysis of influencing factors in typical agricultural areas. J. Agric. Resour. Environ. 2023, 40, 583–597. [Google Scholar]
  41. Xiao, R.; Wang, G.; Zhang, Q.; Zhang, Z. Multi-scale analysis of relationship between landscape pattern and urban river water quality in different seasons. Sci. Rep. 2016, 6, 25250. [Google Scholar] [CrossRef]
  42. Wang, R.; Wang, Y.; Sun, S.; Cai, C.; Zhang, J. Discussing on “source-sink” landscape theory and phytoremediation for non-point source pollution control in China. Environ. Sci. Pollut. Res. 2020, 27, 44797–44806. [Google Scholar] [CrossRef] [PubMed]
  43. Wang, H.; Xu, J.; Liu, X.; Sheng, L.; Zhang, D.; Li, L.; Wang, A. Study on the pollution status and control measures for the livestock and poultry breeding industry in northeastern China. Environ. Sci. Pollut. Res. 2018, 25, 4435–4445. [Google Scholar] [CrossRef] [PubMed]
  44. Fang, Z.-D.; Su, J.-J.; Zhao, H.-T.; Hu, L.; Li, X.-Y. Output Characteristics of Nitrogen and Phosphorus from Non-Point Source Pollution of Typical Land Use in A Micro-Watershed in Hilly Red Soil Region. Environ. Sci. 2021, 42, 5394–5404. [Google Scholar] [CrossRef]
  45. Li, H.B.; Liang, H.B.; Li, J.; Wang, Y.L. Research on all-process control strategy for agricultural non-point pollution. China Acad. J. Electron. Publ. House 2014, 1, 81–85. [Google Scholar]
Figure 1. Study area and sampling sites. Sanmenxia Road Bridge (S1), Nancun (S2), Xiaolangdi (S3), Huayuankou (S4), Kaifeng Bridge (S5), and Gaocun (S6).
Sustainability 15 14754 g001
Figure 2. Flow chart of the methodology.
Sustainability 15 14754 g002
Figure 3. Temporal variation in the water quality indicators concentrations.
Sustainability 15 14754 g003
Figure 4. Spatial variation in the water quality indicators concentrations.
Sustainability 15 14754 g004
Figure 5. Temporal trend of the trophic state composite index.
Sustainability 15 14754 g005
Figure 6. Spatial variations of trophic state composite index.
Sustainability 15 14754 g006
Figure 7. The results of correlation analysis between EI and water quality indicators. * denotes p ≤ 0.05, ** denotes p ≤ 0.01, which had a higher significance level; ellipse tilted to the right (red) denotes positive correlation, ellipse tilted to the left (blue) denotes negative correlation; correlation coefficient is inversely proportional to the area of the ellipse.
Sustainability 15 14754 g007
Figure 8. The results of the Mann–Kendall test and RDA.
Sustainability 15 14754 g008
Figure 9. Land use patterns in 2016 and 2018.
Sustainability 15 14754 g009
Table 1. Evaluation standard of eutrophication degree.
Trophic StateEI
OligotrophicEI ≤ 20
Mesotrophic20 < EI ≤ 39.42
Light eutrophic39.42 < EI ≤ 61.29
Middle eutrophic61.29 < EI ≤ 76.28
Hypereutrophic76.28 < EI ≤ 99.77
Table 2. The area change in the land use type from 2012 to 2020 (km2).
YearCultivated LandForest LandGrassWaterConstruction LandUnused Land
2012–2014−761.5107−9.84062.2104−33.1596803.1492−0.8487
2014–2016−630.8568−9.7641−114.1605−26.0136781.3305−0.5355
2016–2018−651.9879240.7446−232.491611.1645633.0294−0.459
2018–202082.269226.7667−839.080827.8532501.36570.8262
Table 3. Land use type transfer matrix between 2016 and 2018 (km2).
YearCultivated LandForest LandGrassWaterConstruction LandUnused LandTotal Area
Cultivated land59,019.593348.820167.29737.451706.0110.14360,279.314
Forest land249.61617,474.11330.4761.5023.268017,758.976
Grass233.915108.2862130.1921.2906.1290.2052480.017
Water41.1091.0990.744864.77315.2500.250923.224
Construction land184.1591.3300.60329.27011,926.607012,141.968
Unused land0.250000.25804.7165.224
Total area59,728.64117,933.6482329.312934.54412657.2665.31493,588.724
Disclaimer/Publisher’s Note: The statements, opinions and data contained in all publications are solely those of the individual author(s) and contributor(s) and not of MDPI and/or the editor(s). MDPI and/or the editor(s) disclaim responsibility for any injury to people or property resulting from any ideas, methods, instructions or products referred to in the content.

