
Research on Optimization of Monitoring Nodes Based on the Entropy Weight Method for Underground Mining Ventilation


Abstract
:1. Introduction
2. Methodology and Theory
2.1. The Establishment of Monitoring Node Optimization Index
2.2. Calculation of Node Importance Based on the Entropy Weight Method
2.3. Optimization Scheme of Air Pressure Monitoring Nodes
3. Example and Application
3.1. Example Ventilation Network Introduction
3.2. Optimization of Air Pressure Monitoring Node Based on the Entropy Weight Method
4. Analysis of Optimization Results
4.1. Comparative Analysis of Monitoring Range
4.2. Analysis of Optimal Layout of Air Pressure Monitoring Nodes
4.3. Analysis of Full Coverage of Air Pressure Monitoring Nodes
5. Discussion
6. Conclusions
- (1)
- The correlation between ventilation network nodes was analyzed. The process of calculating the node importance of ventilation network using the entropy weight method (EWM) was introduced. The layout scheme and specific steps of the air pressure monitoring nodes were given.
- (2)
- For the case mine ventilation network, the entropy weight method (EWM) and the cluster analysis algorithm were used to optimize the layout of air pressure-monitoring nodes. The entropy weight method (EWM) is superior to the clustering algorithm (CA) in the optimization of monitoring nodes.
- (3)
- On the basis of this study, the comparative analysis of the monitoring effect when the sensor was installed on the uncovered nodes can be further carried out, so as to improve the research on the full coverage of air pressure monitoring nodes.
Author Contributions
Funding
Institutional Review Board Statement
Informed Consent Statement
Data Availability Statement
Acknowledgments
Conflicts of Interest
References
- Song, Y.; Yang, S.; Hu, X.; Song, W.; Sang, N.; Cai, J.; Xu, Q. Prediction of gas and coal spontaneous combustion coexisting disaster through the chaotic characteristic analysis of gas indexes in goaf gas extraction. Process Saf. Environ. Prot. 2019, 129, 8–16. [Google Scholar] [CrossRef]
- Zhang, P.; Lan, H.; Yu, M. Reliability evaluation for ventilation system of gas tunnel based on Bayesian network. Tunn. Undergr. Space Technol. 2021, 112, 103882. [Google Scholar] [CrossRef]
- Wang, J.; Jia, M.; Bin, L.; Wang, L.; Zhong, D. Regulation and optimization of air quantity in a mine ventilation network with multiple fans. Arch. Min. Sci. 2022, 67, 179–193. [Google Scholar] [CrossRef]
- Lu, X.; Yin, H. The intelligent theory and technology of mine ventilation. J. China Coal Soc. 2020, 45, 2236–2247. [Google Scholar] [CrossRef]
- Zhou, F.; Wei, L.; Xia, T. Principle, key technology and preliminary realization of mine intelligent ventilation. J. China Coal Soc. 2020, 45, 2225–2235. [Google Scholar] [CrossRef]
- Yang, S.; Tang, J.; Zhao, S.; Hua, F. Early warning on coal and gas outburst with dynamic indexes of gas emission. Disaster Adv. 2010, 3, 403–406. [Google Scholar]
- Yang, S.; Tang, J.; Wen, G.; Kang, J.; Liu, C. Coal and gas outburst disaster early warning and emergency response decision support technology. Chongqing Daxue Xuebao 2012, 35, 121–125. [Google Scholar]
- Yang, S.; Li, S.; Liu, C. Coal and gas outburst disaster early warning technology based on coal mine Internet of things. Coal Sci. Technol. Mag. 2015, 3, 109–112. [Google Scholar] [CrossRef]
- Li, Q.; Wang, F.; Wang, Y.; Forson, K.; Cao, L.; Zhang, C.; Zhou, C.; Zhao, B.; Chen, J. Experimental investigation on the high-pressure sand suspension and adsorption capacity of guar gum fracturing fluid in low-permeability shale reservoirs: Factor analysis and mechanism disclosure. Environ. Sci. Pollut. Res. 2022, 29, 53050–53062. [Google Scholar] [CrossRef]
- Li, Q.; Han, Y.; Liu, X.; Ansari, U.; Cheng, Y.; Yan, C. Hydrate as a by-product in CO2 leakage during the long-term sub-seabed sequestration and its role in preventing further leakage. Environ. Sci. Pollut. Res. 2022, 29, 77737–77754. [Google Scholar] [CrossRef]
- Wang, F.; Xiao, Z.; Liu, X.; Ren, J.; Xing, T.; Li, Z.; Li, X.; Chen, Y. Strategic design of cellulose nanofibers@ zeolitic imidazolate frameworks derived mesoporous carbon-supported nanoscale CoFe2O4/CoFe hybrid composition as trifunctional electrocatalyst for Zn-air battery and self-powered overall water-splitting. J. Power Sources 2022, 521, 230925. [Google Scholar] [CrossRef]
- Huang, X.; Liu, Y. Research and design of intelligent mine ventilation construction architecture. Int. J. Low-Carbon Technol. 2022, 17, 1232–1238. [Google Scholar] [CrossRef]
- Li, J.; Li, Y.; Zhang, J.; Li, B.; Zhang, Z.; Dong, J.; Cui, Y. Accurate and real-time network calculation for mine ventilation without wind resistance measurement. Wind Eng. Ind. Aerodyn. 2022, 230, 105183. [Google Scholar] [CrossRef]
- Wallace, K.; Prosser, B.; Stinnette, J.D. The practice of mine ventilation engineering. Int. J. Min. Sci. Technol. 2015, 25, 165–169. [Google Scholar] [CrossRef]
- Jia, P.; Jia, J.; Song, L.; Li, Z.; Li, B. Theory of RPOD adjustment of air volume for mine intelligent ventilation. Int. J. Vent. 2022, 21, 316–329. [Google Scholar] [CrossRef]
- Moll, A.; Lowndes, I. Graph theory applied to mine ventilation analysis. Bull. Inst. Math. Its Appl. 1992, 28, 103–106. [Google Scholar]
- Foulds, L. Graph Theory: A Survey of Its Use in Operations Research; University of Canterbury: Christchurch, New Zealand, 1982; Volume 10, pp. 35–65. [Google Scholar]
- Wu, X.S.; Topuz, E. Analysis of mine ventilation systems using operations research methods. Int. Trans. Oper. Res. 1998, 5, 245–254. [Google Scholar] [CrossRef]
- Xie, X.; Duan, Z. Optimization of the Layout of Monitoring Points for Multi-Ventilator and Multi-Fan Station Ventilation System. Met. Mine 2009, 39, 147. [Google Scholar]
- Wang, T.; Xie, X.; Li, J.; Tan, X.; Yin, X.; Su, M.; Luo, W.; Cui, C. Optimization of monitoring points’ layout for the multi-fan and multi-station ventilation system. Appl. Mech. Mater. 2014, 614, 113–117. [Google Scholar] [CrossRef]
- Zhao, D.; Pan, J. Fault Source Diagnosis for Mine Ventilation Based on Improved Sensitivity Matrix and Its Wind Speed Sensor Setting. Zhongguo Anquan Kexue Xuebao 2011, 21, 78–84. [Google Scholar]
- Pan, J.; Li, Z.; Chen, Z. Fault source diagnosis for ventilation system and air velocity transducer placement in Daming Mine. J. China Coal Soc. 2013, 38, 153–158. [Google Scholar]
- Chen, K.; Si, J.; Zhou, F.; Zhang, R.; Shao, H.; Zhao, H. Optimization of air quantity regulation in mine ventilation networks using the improved differential evolution algorithm and critical path method. Int. J. Min. Sci. Technol. 2015, 25, 79–84. [Google Scholar] [CrossRef]
- Si, J.; He, S.; Cheng, G.; Chu, T. The real-time monitoring technology of air quantity based on the optimization of air velocity sensors location in mine ventilation network. Electr. Eng. Comput. Sci. 2019, 3, 164–169. [Google Scholar]
- Si, J.; Wang, X.; Wang, Y.; Li, L. Dynamic Monitoring Technology of Air Quantity in Mine Ventilation System Based on Optimum Location of Wind Speed Sensors. In Proceedings of the IOP Conference Series: Earth and Environmental Science; IOP Publishing: Bristol, UK, 2021; p. 042036. [Google Scholar]
- Li, Y.; Li, J.; Deng, C.; Liu, R. Improved algorithm of air quantity calculating resistance based on diagonal subnetwork. J. China Coal Soc. 2019, 44, 1147. [Google Scholar] [CrossRef]
- Liu, J.; Jiang, Q.; Liu, L.; Wang, D.; Huang, D.; Deng, L.; Zhou, Q. Resistance variant fault diagnosis of mine ventilation system and position optimization of wind speed sensor. J. China Coal Soc. 2021, 46, 8. [Google Scholar] [CrossRef]
- Ni, J.; Le, X.; Chang, L.; Deng, L. Resistance variant fault diagnosis and optimized layout of sensors for mine ventilation based on decision tree. Saf. Sci. Technol. 2021, 17, 34–39. [Google Scholar] [CrossRef]
- Liu, Y.; Liu, Z.; Gao, K.; Huang, Y.; Zhu, C. Efficient graphical algorithm of sensor distribution and air volume reconstruction for a smart mine ventilation network. Sensors 2022, 22, 2096. [Google Scholar] [CrossRef]
- Yan, Z.; Wang, Y.; Fan, J.; Huang, Y.; Zhong, Y. An Efficient Method for Optimizing Sensors’ Layout for Accurate Measurement of Underground Ventilation Networks. IEEE Access 2023, 11, 72630–72640. [Google Scholar] [CrossRef]
- Li, B.; Wang, W.; Chen, F.; Liu, N. Optimal arrangement of wind speed sensor based on directed path matrix method. Ind. Mine Autom. 2021, 47, 52–57. [Google Scholar] [CrossRef]
- Wang, F.; Liu, X.; Jiang, B.; Zhuo, H.; Chen, W.; Chen, Y.; Li, X. Low-loading Pt nanoparticles combined with the atomically dispersed FeN4 sites supported by FeSA-NC for improved activity and stability towards oxygen reduction reaction/hydrogen evolution reaction in acid and alkaline media. J. Colloid Interface Sci. 2023, 635, 514–523. [Google Scholar] [CrossRef]
- Li, Q.; Zhang, C.; Yang, Y.; Ansari, U.; Han, Y.; Li, X.; Cheng, Y. Preliminary experimental investigation on long-term fracture conductivity for evaluating the feasibility and efficiency of fracturing operation in offshore hydrate-bearing sediments. Ocean Eng. 2023, 281, 114949. [Google Scholar] [CrossRef]
- Li, Q.; Zhao, D.; Yin, J.; Zhou, X.; Li, Y.; Chi, P.; Han, Y.; Ansari, U.; Cheng, Y. Sediment instability caused by gas production from hydrate-bearing sediment in Northern South China Sea by horizontal wellbore: Evolution and mechanism. Nat. Resour. Res. 2023, 32, 1595–1620. [Google Scholar] [CrossRef]
- Wei, L.; Zhou, F.; Cheng, J.; Luo, X.; Li, X. Classification of structural complexity for mine ventilation networks. Complexity 2015, 21, 21–34. [Google Scholar] [CrossRef]
- Chen, B.; Wang, Z.; Luo, C. Integrated evaluation approach for node importance of complex networks based on relative entropy. Syst. Eng. Electron. 2016, 27, 1219–1226. [Google Scholar] [CrossRef]
- Bi, Q.; Li, Y.; Shen, C. Screening of Evaluation Index and Construction of Evaluation Index System for Mine Ventilation System. Sustainability 2021, 13, 11810. [Google Scholar] [CrossRef]
- De Souza, E. Optimization of complex mine ventilation systems with computer network modelling. IFAC Proc. Vol. 2007, 40, 323–329. [Google Scholar] [CrossRef]
- Krach, A. Node method for solving the mine ventilation networks. Arch. Min. Sci. 2011, 56, 601–620. [Google Scholar]
- Li, G.; Kocsis, C.; Hardcastle, S. Sensitivity analysis on parameter changes in underground mine ventilation systems. Coal Sci. Eng. 2011, 17, 251–255. [Google Scholar] [CrossRef]
- Duhart, A.; Enrique, I. Multiple Period Mine Ventilation and Fan Selection Optimization; Laurentian University: Sudbury, ON, Canada, 2010; Volume 71. [Google Scholar]
- Yoganathan, D.; Kondepudi, S.; Kalluri, B.; Manthapuri, S. Optimal sensor placement strategy for office buildings using clustering algorithms. Energy Build. 2018, 158, 1206–1225. [Google Scholar] [CrossRef]
- Friswell, M.I.; Castro-Triguero, R. Clustering of sensor locations using the effective independence method. AIAA J. 2015, 53, 1388–1391. [Google Scholar] [CrossRef]
- Feng, Y.; Zhao, S.; Liu, H. Analysis of network coverage optimization based on feedback K-means clustering and artificial fish swarm algorithm. IEEE Access 2020, 8, 42864–42876. [Google Scholar] [CrossRef]
- An, H.; Youn, B.D.; Kim, H.S. Optimal sensor placement considering both sensor faults under uncertainty and sensor clustering for vibration-based damage detection. Struct. Multidiscip. Optim. 2022, 65, 102. [Google Scholar] [CrossRef]
- Zhou, S.; Liu, F.; Song, W. Estimating the optimal number of clusters via internal validity index. Neural Process. Lett. 2021, 53, 1013–1034. [Google Scholar] [CrossRef]
- Xiao, J.; Lu, J.; Li, X. Davies Bouldin Index based hierarchical initialization K-means. Intell. Data Anal. 2017, 21, 1327–1338. [Google Scholar] [CrossRef]


| Monitoring Nodes | Monitored Nodes | Uncovered Nodes | |
|---|---|---|---|
| 0.10 | V38(1), V8(4), V10(4), V13(3), V17(3), V21(3), V23(3), V6(3), V30(4) | (V1), (V7, V9, V32, V27), (V9, V11, V36, V26), (V12, V14, V22), (V16, V18, V4), (V20, V34, V15), (V22, V34, V24), (V5, V35, V7), (V31, V29, V3, V5) | V37, V33, V28, V35, V19, V2, V5 |
| 0.15 | V38(1), V37(1), V36(3), V8(4), V11(3), V13(3), V17(3), V21(3), V24(3), V6(3), V30(4) | (V1), (V16), (V10, V33, V26), (V7, V9, V32, V27), (V10, V12, V25), (V12, V14, V22), (V16, V18, V4), (V20, V34, V15), (V23, V25, V12), (V5, V35, V7), (V31, V29, V3, V5) | V28, V19, V2 |
| 0.20 | V38(1), V37(1), V7(3), V36(3), V35(3), V4(3), V34(3), V32(3), V11(3), V13(3), V9(3), V30(4) | (V1), (V16), (V6, V8, V28), (V10, V33, V26), (V6, V18, V29), (V3, V5, V17), (V21, V23, V12), (V8, V33, V19), (V10, V12, V25), (V12, V14, V22), (V8, V10, V20), (V31, V29, V3, V5) | V2, V24, V27, V15 |
| 0.25 | V7(3), V4(3), V38(1), V37(1), V36(3), V35(3), V20(3), V25(3), V34(3), V31(2), V13(3) | (V6, V8, V28), (V3, V5, V17), (V1), (V16), (V33, V10, V26), (V18, V6, V29), (V19, V21, V9), (V24, V26, V11), (V21, V23, V12), (V1, V30), (V12, V14, V22) | V2, V32, V27, V15 |
| 0.30 | V38(1), V37(1), V36(3), V7(3), V34(3), V35(3), V4(3), V32(3), V31(2), V20(3), V25(3), V15(3) | (V1), (V16), (V33, V10, V26), (V6, V8, V28), (V12, V21, V23), (V6, V18, V29), (V3, V5, V17), (V8, V19, V33), (V1, V30), (V19, V9, V21), (V24, V26, V11), (V21, V22, V14) | V27, V2, V13 |
| c = 5 | Monitoring Node | Monitoring Range before Optimization | Monitoring Range after Optimization |
|---|---|---|---|
| 1 | V17 | V3, V5, V8, V14~V20, V22~V25, V32, V35, V36, V37 | V3, V14, V20, V22, V23, V24, V32, V36, V37 |
| 2 | V30 | V30 | V30 |
| 3 | V29 | V21, V26, V27, V28, V29 | V29 |
| 4 | V38 | V38 | V38 |
| 5 | V4 | V1, V2, V4, V6, V7, V9~V13, V31, V33, V34 | V6, V13, V31, V34 |
| Monitoring Nodes | Monitored Nodes | Uncovered Nodes | |||||
|---|---|---|---|---|---|---|---|
| (Number) | (Number) | (Number) | (%) | (%) | (%) | (%) | |
| 5 | 5 | 13 | 20 | 13.2 | 34.2 | 47.4 | 52.6 |
| Monitoring Nodes | Monitored Nodes | Uncovered Nodes | |||||
|---|---|---|---|---|---|---|---|
| (Number) | (Number) | (Number) | (%) | (%) | (%) | (%) | |
| 0.10 | 9 | 22 | 7 | 23.7 | 57.9 | 81.6 | 18.4 |
| 0.15 | 11 | 24 | 3 | 28.9 | 63.2 | 92.1 | 7.9 |
| 0.20 | 12 | 22 | 4 | 31.6 | 57.9 | 89.5 | 10.5 |
| 0.25 | 11 | 23 | 4 | 28.9 | 60.5 | 89.5 | 10.5 |
| 0.30 | 12 | 23 | 3 | 31.6 | 60.5 | 92.1 | 7.9 |
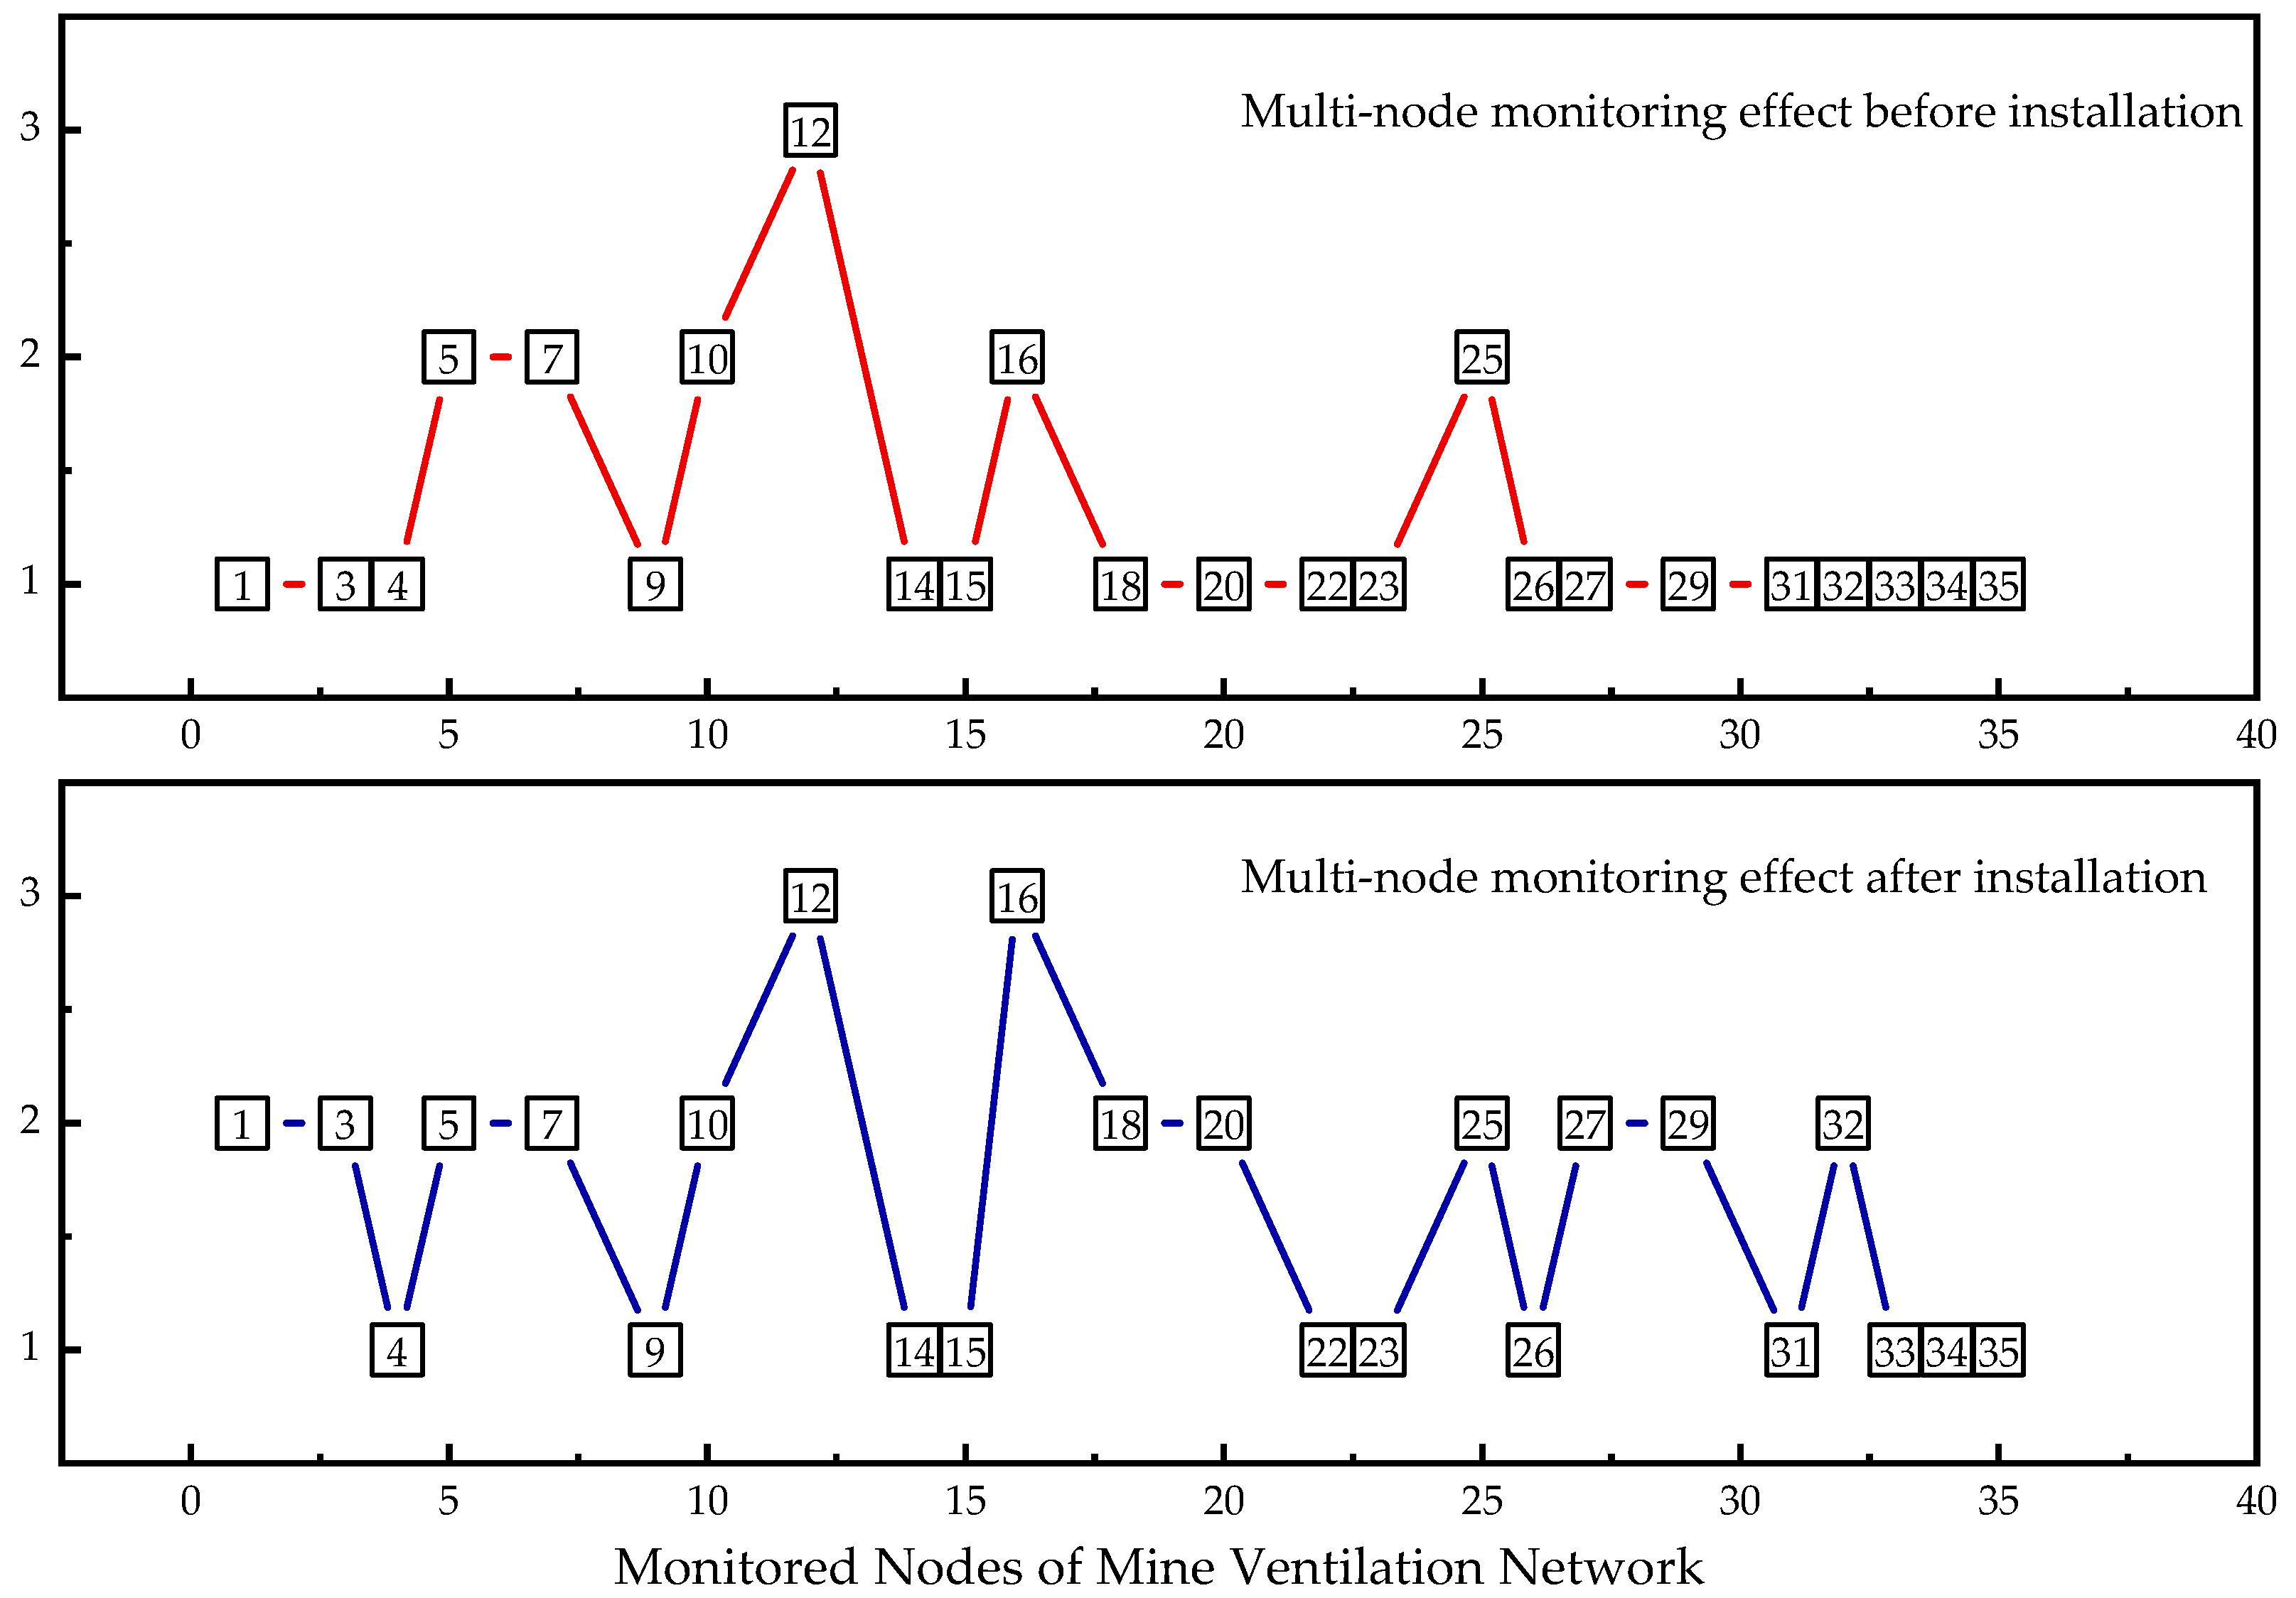
| Before the Installation | After the Installation | |||||
|---|---|---|---|---|---|---|
| Monitored Nodes | (%) | Monitored Nodes | (%) | |||
| Single | V1, V3, V4, V9, V14, V15, V18, V20, V22, V23, V26, V27, V29, V31, V32, V33, V34, V35 | 47.4 | V4, V9, V14, V15, V22, V23, V26, V31, V33, V34, V35 | 28.9 | ||
| Double | V5, V7, V10, V16, V25 | 13.2 | V1, V3, V5, V7, V10, V18, V20, V25, V27, V29, V32 | 28.9 | ||
| Three | V12 | 2.6 | V12, V16 | 5.3 | ||
Disclaimer/Publisher’s Note: The statements, opinions and data contained in all publications are solely those of the individual author(s) and contributor(s) and not of MDPI and/or the editor(s). MDPI and/or the editor(s) disclaim responsibility for any injury to people or property resulting from any ideas, methods, instructions or products referred to in the content. |
© 2023 by the authors. Licensee MDPI, Basel, Switzerland. This article is an open access article distributed under the terms and conditions of the Creative Commons Attribution (CC BY) license (https://creativecommons.org/licenses/by/4.0/).
Share and Cite
Yang, S.; Zhang, X.; Liang, J.; Xu, N. Research on Optimization of Monitoring Nodes Based on the Entropy Weight Method for Underground Mining Ventilation. Sustainability 2023, 15, 14749. https://doi.org/10.3390/su152014749
Yang S, Zhang X, Liang J, Xu N. Research on Optimization of Monitoring Nodes Based on the Entropy Weight Method for Underground Mining Ventilation. Sustainability. 2023; 15(20):14749. https://doi.org/10.3390/su152014749
Chicago/Turabian StyleYang, Shouguo, Xiaofei Zhang, Jun Liang, and Ning Xu. 2023. "Research on Optimization of Monitoring Nodes Based on the Entropy Weight Method for Underground Mining Ventilation" Sustainability 15, no. 20: 14749. https://doi.org/10.3390/su152014749
APA StyleYang, S., Zhang, X., Liang, J., & Xu, N. (2023). Research on Optimization of Monitoring Nodes Based on the Entropy Weight Method for Underground Mining Ventilation. Sustainability, 15(20), 14749. https://doi.org/10.3390/su152014749