Article

Methodology for Resilience Assessment of Oil Pipeline Network System Exposed to Earthquake

1
Institute of Safety Science & Engineering, South China University of Technology, Guangzhou 510640, China
2
Guangdong Provincial Science and Technology Collaborative Innovation Center for Work Safety, Guangzhou 510640, China
3
Guangdong Academy of Safety Science and Technology, Guangzhou 510060, China
*
Author to whom correspondence should be addressed.
Sustainability 2023, 15(2), 972; https://doi.org/10.3390/su15020972
Submission received: 24 October 2022 / Revised: 14 December 2022 / Accepted: 3 January 2023 / Published: 5 January 2023
(This article belongs to the Special Issue Urban Safety and Security Assessment)

Abstract

:
The oil pipeline network system (OPNS) is an essential part of the critical infrastructure networks (CINs), and is vulnerable to earthquakes. Assessing and enhancing the resilience of the OPNS can improve its capability to cope with earthquakes or to recover the system’s performance quickly after the disturbance. This study defines the concept of OPNS resilience in the resistive ability, the adaptive ability, and the recovery ability. Then, the quantitative resilience assessment model is established considering the earthquake intensities, the role of safety barriers, the time-variant reliability, and the importance coefficient of each subsystem via a Monte Carlo simulation. Combining the model with GIS technology, a new methodology to evaluate OPNS resilience is proposed, and the resilience partition technology platform is developed, which can visualize the results of the resilience assessment. Finally, a case study is implemented to demonstrate the developed methodology, and a discussion is provided to identify the sensitive variables. The proposed resilience methodology can provide a framework for the probabilistic resilience assessment of OPNS, and could be expanded to other lifeline network systems.

1. Introduction

The operation and development of cities depend on a continuous energy supply, such as oil and gas, and pipeline transportation provides convenient routes for them [1]. The oil pipeline network system (OPNS), as a part of critical infrastructure networks (CINs), is easily affected by large-scale geological natural disasters, such as earthquakes [2,3]. Once a high-intensity earthquake occurs, it will cause serious damage to the structure and may trigger subsequent technological disasters to increase the severity of accident loss [4]. In the 1987 Ecuador earthquake (Mw 6.9), almost 40 km of the oil pipeline was destroyed, and more than 800 million dollars were lost [5]. The 1994 Northridge earthquake in Colorado ruptured about 50 km of pipeline and caused more than 3500 barrels of oil to be released. The leaked oil triggered more than 100 cases of fires and explosions, resulting in 30 billion dollars of damage and causing severe pollution in the local environment [6].
Currently, the seismic safety research on oil pipelines mainly focuses on seismic design [7,8], vulnerability assessment [9,10], consequence mitigation [11], and mechanical response analysis [12,13]. Makhoul et al. [14] studied the seismic damage results of buried pipelines by using a series of typical fragility models, and proposed a resilient earthquake preparedness strategy for Byblos’ infrastructure network. Germoso [15] modeled the seismic responses of buried pipelines and developed a novel dynamic analytic approach by incorporating the nonlinear soil interaction, which enables the analysis of seismic pipeline safety towards an ideal design for its performance and mechanical reliability. Shabarchin [16] quantified the failure probability of oil pipelines owing to wave propagation created by earthquakes, and considered the corrosion in a seismic risk assessment. Although many researchers have analyzed and appraised the seismic safety of oil pipelines, their analysis still focused on the subsystem rather than on the system level.
Compared with the above research, resilience assessment is more dynamic and better suited to deal with complex systems after uncertain disruptions [17,18,19], and has developed rapidly in the past decade in the CINs domain. Research on CINs’ resilience can be roughly divided into the probabilistic analysis method, the expert judgment method, and the performance response function (PRF) method [20]. The PRF method was initially implemented by Bruneau et al. [21] in 2003, and has become widely adopted in this field [22,23,24]. For instance, Han [25] and Song [26] introduced the PRF method and considered the physical state, such as in terms of the hydraulic analysis, pipe damage, pipe recovery, and ground motion field, to assess the water distribution network resilience in both structural and functional dimensions, and optimized the recovery strategies of critical and general pipes by heuristic genetic algorithm. Through the PRF curve, Zong et al. [27,28] quantitatively analyzed a gas pipeline network from the technical, organizational, and social dimensions. They introduced the skew of the recovery trajectory (SRT) and total recovery time (TRT) to analyze the performance of the gas pipe network under the technical dimension.
Resilience assessment of CINs can help decision-makers improve safety strategies and reduce resources required for post-disaster recovery [29,30]. However, research on OPNS resilience is rarely reported [31,32]. Oil pipes are significantly more hazardous than gas pipes in terms of environmental pollution and accident-related consequences because any abnormality could affect another area of the oil pipe and start a domino effect. These differences can be seen in the structure, safety accessories, distribution form, and material properties of the two types of pipes [11]. The intricacy of these characteristics makes it difficult to assess and analyze the resilience of OPNS, and the quantitative resilience assessment approach for CINs under earthquakes is not yet available for OPNS.
Therefore, the present work aims to establish a comprehensive approach for the quantitative resilience assessment of OPNS exposed to earthquakes, including the novel resilience quantified model and the resilience partitioning platform. Inspired by the PRF method in CINs, this model takes the intensity of disasters, safety barriers, important coefficient of subsystems, and the recovery strategy into consideration, calculates the subsystem reliability under different times via Monte Carlo simulations, then constructs the metrics from three main compositions of resilience based on the PRF curve. Additionally, by combining the resilience assessment model with GIS technology, a GIS-based OPNS resilience partitioning platform is developed to realize the rapid assessment and visualization of OPNS resilience.
This paper is organized as follows. Section 2 defines the concepts of OPNS resilience and elaborates the resilience metrics. The methodology procedures, the quantitative resilience assessment model, the developed resilience partitioning platform, and the corresponding algorithm are all elaborated on and explained in Section 3 and Section 4, respectively. Next, the application of the developed methodology to a real OPNS is provided, and a discussion based on the case study is illustrated in Section 5. Finally, the conclusions drawn from this study are presented in Section 6. In attention, the explanation of notations in the manuscript can be found in Supplementary Materials.

2. Resilience of OPNS

2.1. Connotation of Resilience

Resilience can be defined in various ways, and the general definition is the ability of a system to prepare and adapt to the changing conditions and to withstand and recover from disruptive events [33,34,35]. The above definition shows three abilities of system resilience, as follows:
  • The resistive ability—refers to the power of the system to resist disaster damage and maintain structural stability [36].
  • The adaptive ability—refers to how a system adapts to the process of disaster evolution and ensures its function is stable [37].
  • The recovery ability—the ability of system performance to recover to a certain level after a disaster under the action of recovery measures [38].

2.2. Definition of OPNS Resilience

The OPNS is a network system composed of multiple pipeline subsystems and, thus, the resilience of OPNS is affected by each subsystem, and can be quantified by their resilience. However, the importance of each pipe is not the same in the network and these differences must be fully considered to quantify the system resilience accurately.
The importance coefficient of pipe segment (Ic), defined as the influence degree of pipe segment on the overall performance of OPNS, is introduced to optimize the system’s resilience. The Ic of the pipeline is a metric that completely takes into account the significant relationship between subsystems and systems, focusing primarily on the state before the disaster, and which will not change with the occurrence of disasters. The larger the Ic is, the higher the influence degree of the pipe is.
As shown in Figure 1, it is assumed that the total flow rate of the pipe network in regular operation is Q and that the flow rate of each pipe section is qi (i = 1,2…n). The Ic of each pipe segment can be calculated according to Equation (1), as follows:
I c i = q i / Q i = 1 n q i / Q = q i i = 1 n q i
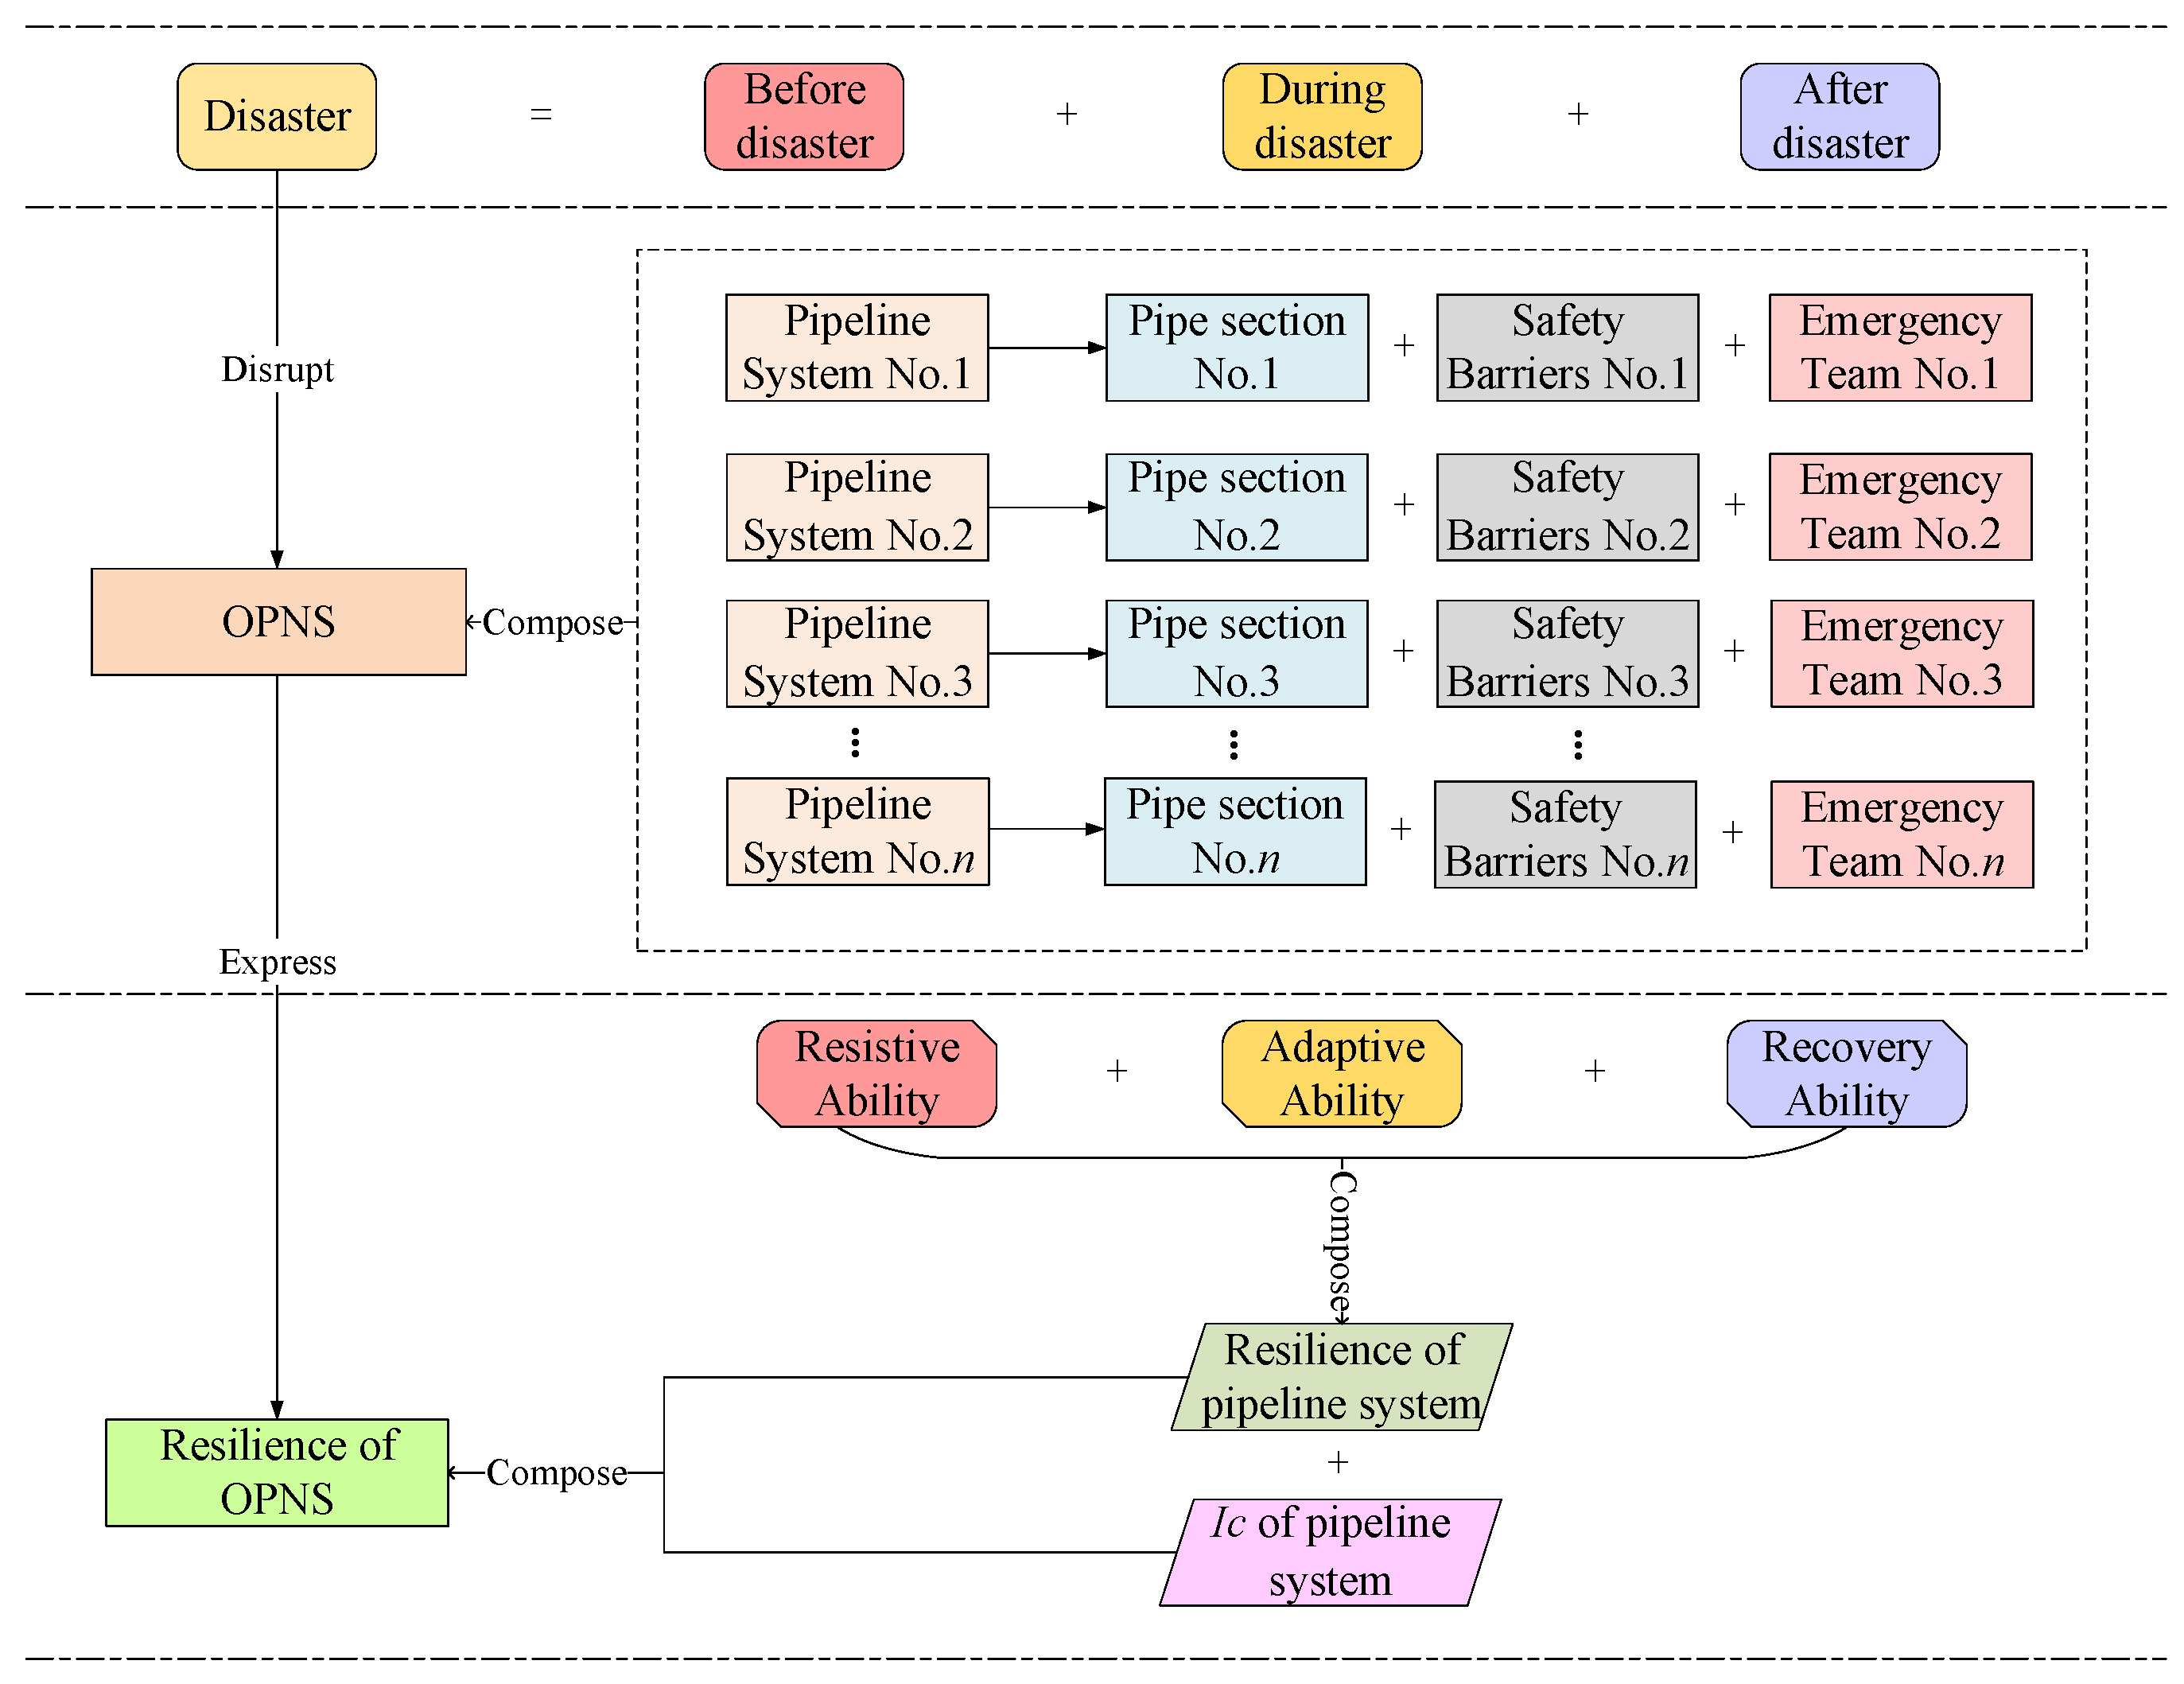
Figure 2 illustrates the logical relation of OPNS and subsystem resilience, and the OPNS resilience can be obtained as follows in Equation (2):
R = i = 1 n I c i × R e s
where R is the resilience of the OPNS, and Res is the pipeline subsystem resilience.
The measurement of system performance is assumed to be system reliability for convenience. As shown in Figure 3, the pipeline reliability varies over time. Before the occurrence of an earthquake, the initial state reliability of pipes is the maximum value P0, and this decreases immediately to P1 due to the disaster (earthquake) occurring at time t0. With the evolution of primary accident scenarios and the adaption of the pipeline, reliability will further reduce to the minimum value P2 at time t1. In addition, the recovery strategy is prepared during the time from t0 to t1 and applied at time t1, and the pipeline reliability begins to recover at time t2 and fully recovers to P3 at time t3.

2.3. Resilience Metrics

The general approach to quantifying resilience is shown in Equation (3), as follows:
R e s i l i e n c e = t 0 t 3 P ( t ) d t P ( t 0 ) ( t 3 t 0 )
where P(t) is the performance of a system, t0 is the time when the disaster event occurs, and tf is the time to complete restoration of system performance. The numerator of Equation (3) indicates the accumulation of system performance P(t) between t0 (disruption) and t3 (fully recovered). The denominator represents the accumulation of initial system performance P(t0) between t0 and t3. Although the resilience metric is illustrated by the case of system reliability, it may be applied to other fields by substituting other performance functions for the system function P(t).
However, to assess the resilience of the OPNS exposed to an earthquake, a more robust approach is needed to define system performance on a resilience metric. Combined with the logical relation of resilience in Section 2.2, the OPNS resilience (Res) is quantified as the function among resistive, adaptive, and recovery abilities of the system, as follows in Equation (4).
R e s = f ( R e , A d , R e c )
where Re is the quantification of resistive ability, which is defined as the ability of the pipe section to resist external disaster (earthquake) disturbance to a certain extent to ensure normal function. It can be estimated as the ratio of residual reliability to the initial reliability at the time of the disruptive event [39] as follows in Equation (5):
R e = P 1 P 0
Ad is the quantification of adaptive ability, which is defined as the power of a pipe segment to effectively adapt to the evolution process of primary accident scenarios caused by disasters (earthquakes) to avoid the functional reliability reduction. It can be quantified as the ratio of the lowest reliability to residual reliability during the period before recovery action starts, as follows in Equation (6):
A d = P 2 P 1
Rec is the quantification of recovery ability, which is defined as the ability of the pipe section to reach the minimum performance level after emergency repair quickly, and can be quantified as the slope of the recovery and estimated using the following Equation (7):
R e c = arctan ( P 3 P 2 t 3 t 2 ) π / 2
Therefore, based on Figure 3 and Equations (3)–(7), the resilience metrics can be transformed as follows in Equation (8):
R e s = [ ( P 1 + P 2 ) ( t 1 t 0 ) + 2 P 2 ( t 2 t 1 ) + ( P 2 + P 3 ) ( t 3 t 2 ) ] 2 P 0 ( t 3 t 0 )

3. Quantification Model of OPNS Resilience

3.1. Quantification of Resistive Ability

According to the definition of resistive ability in Section 2.3, the R1 can be quantified through Equation (9), as follows:
P 1 = 1 P d a m a g e
where Pdamage is the probability of pipeline damage under disasters. For a pipeline, it can be considered that the damage to the pipe is random and independent along its length, and that it obeys the Poisson distribution. Therefore, the Pdamage can be calculated by Equation (10), as follows:
P d a m a g e = 1 e R r × L
where L is the length of a pipe segment, and Rr is the damage rate of the pipe exposed to disaster, which refers to the number of damaged areas per kilometer of a pipeline under a certain kind of disaster. For an earthquake, it contains pipe diameter, materials, site conditions, soil liquefaction degree, and other factors, and it can be obtained as follows in Equations (11) and (12) [40]:
R r = C p C d C g C l R 0
R 0 { = 2.88 × 10 6 × ( P G A 100 ) 1.97 = 3.11 × 10 3 × ( P G V 15 ) 1.3
where Cp is the influence coefficient of the pipeline, Cd is the influence coefficient of diameter, Cg is the influence coefficient of geological topography, Cl is the influence coefficient of soil liquefaction, R0 is the standard damage rate of the pipeline, PGA is the peak ground motion acceleration, PGV is the peak ground motion velocity, and the quantification of these coefficients can be found in [40].

3.2. Quantification of Adaptive Ability

In the adaptation stage, the pipeline structure damage caused by a disaster (earthquake) can lead to oil leakage and may occur in the subsequent accident, such as a fire and explosion, which will further reduce the reliability of a system to the minimum level (P2 in Figure 3) before it finally reaches a stable state before restoration.
The involvement of safety barriers can prevent and mitigate these subsequent scenarios, which will increase R2 and reduce the pipeline reliability loss, thus, improving the adaptive ability and restraining the reliability decline. A technical safety barrier can be generically defined as a physical means to prevent, mitigate, or control undesired events or accidents [41,42]. This paper classified technical safety barriers into the following two categories [43]:
  • Active barriers, which require automatic/external activation [44], such as PSVs and emergency shutdowns;
  • Passive barriers which are already in place and do not require external activation [45] (e.g., PFP and flexible connections).
The quantification of safety barrier performance mainly considers two indicators, namely reliability and effectiveness [46], and, thus, the probability of failure on demand PFD and effectiveness η [47] were used to characterize the performance of different safety barriers in various scenarios in this article, as is shown in the following Equation (13):
{ P F D = 1 + ( ϕ 1 ) ( 1 P F D 0 ) ; η = η 0 ( Active barriers ) P F D = P F D 0 ; η = η 0 ( 1 ϕ ) ( Passive barriers )
where PFD0 is the baseline value for barrier probability of failure on demand, η0 is the baseline value for barrier effectiveness, ϕ is the modification factor that is used to determine a tailored value of PFD, and η, which can be interpreted as the likelihood that barrier systems are impaired or damaged by natural hazards, hence, a higher value (i.e., closer to 1) indicates a higher probability that the barrier will fail in providing a successful protection action.
Table 1 shows the common types of safety barriers in OPNS [47,48,49].
Then, P2 can be calculated as follows in Equation (14):
P 2 = P 1 ( 1 P e )
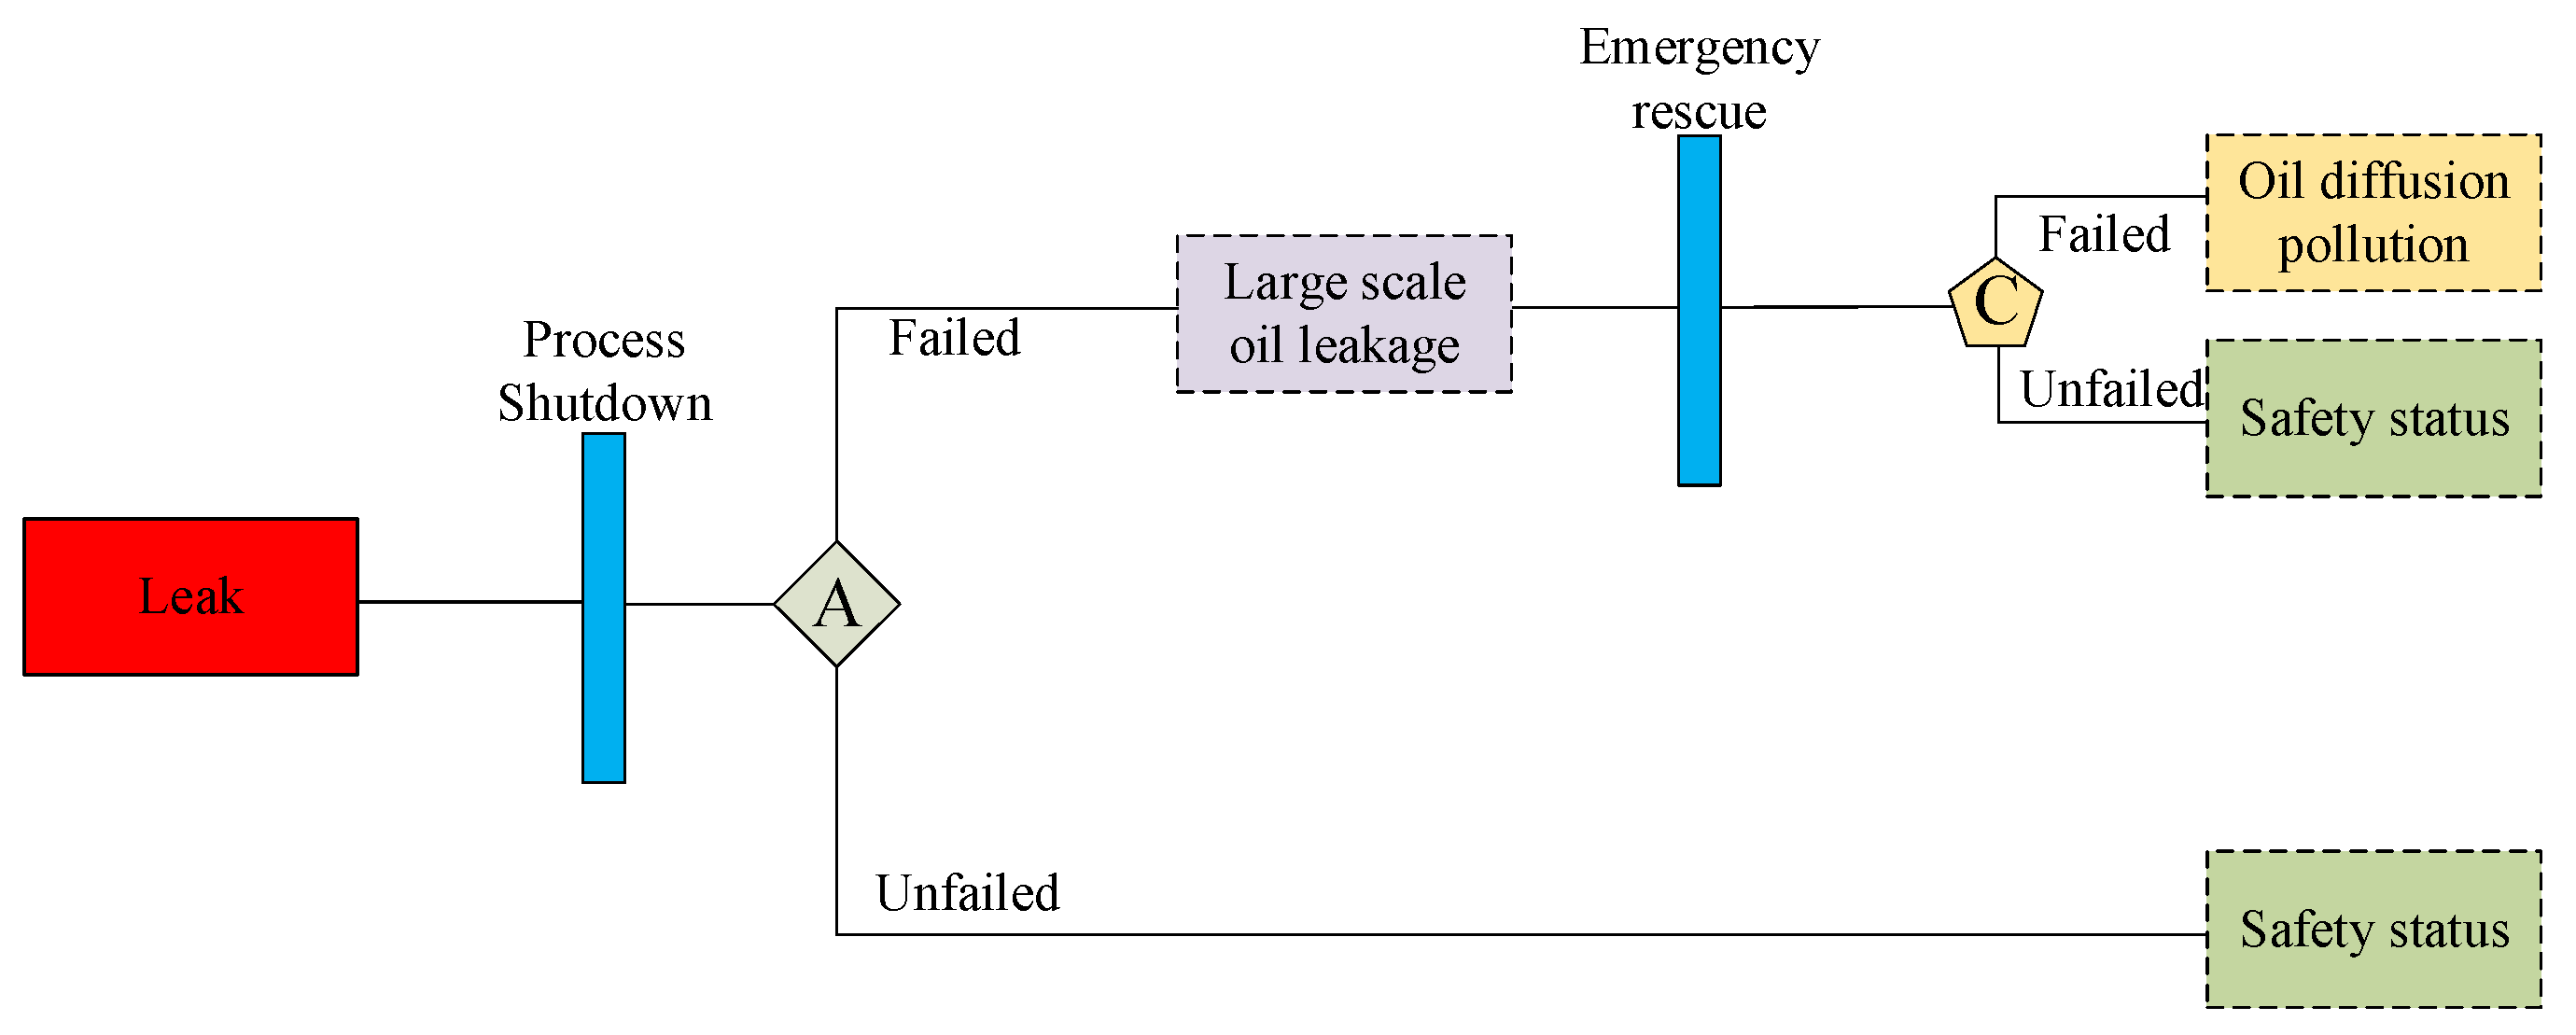
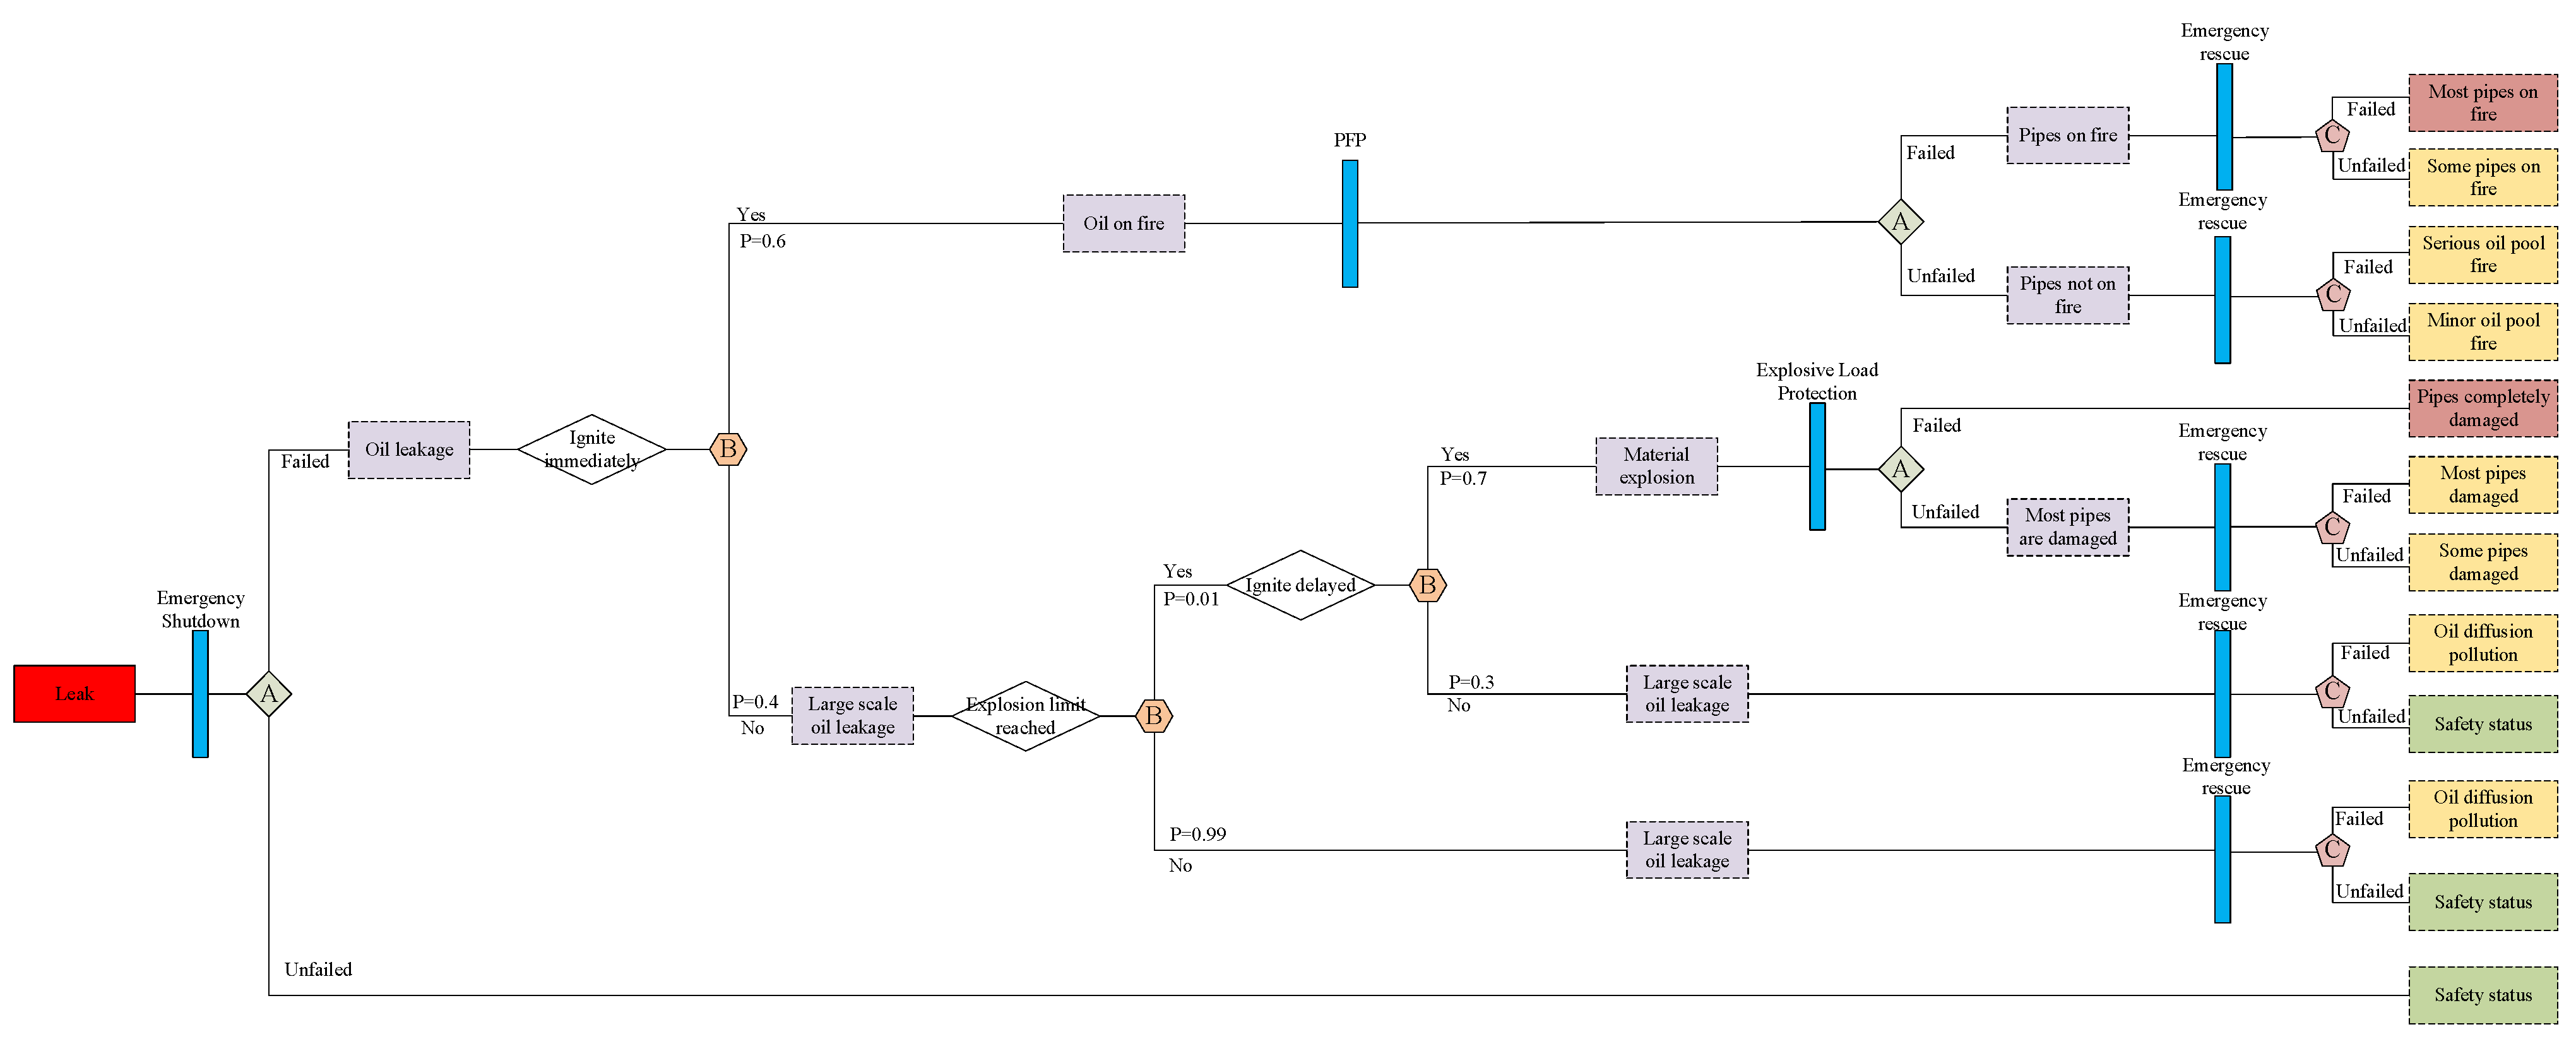
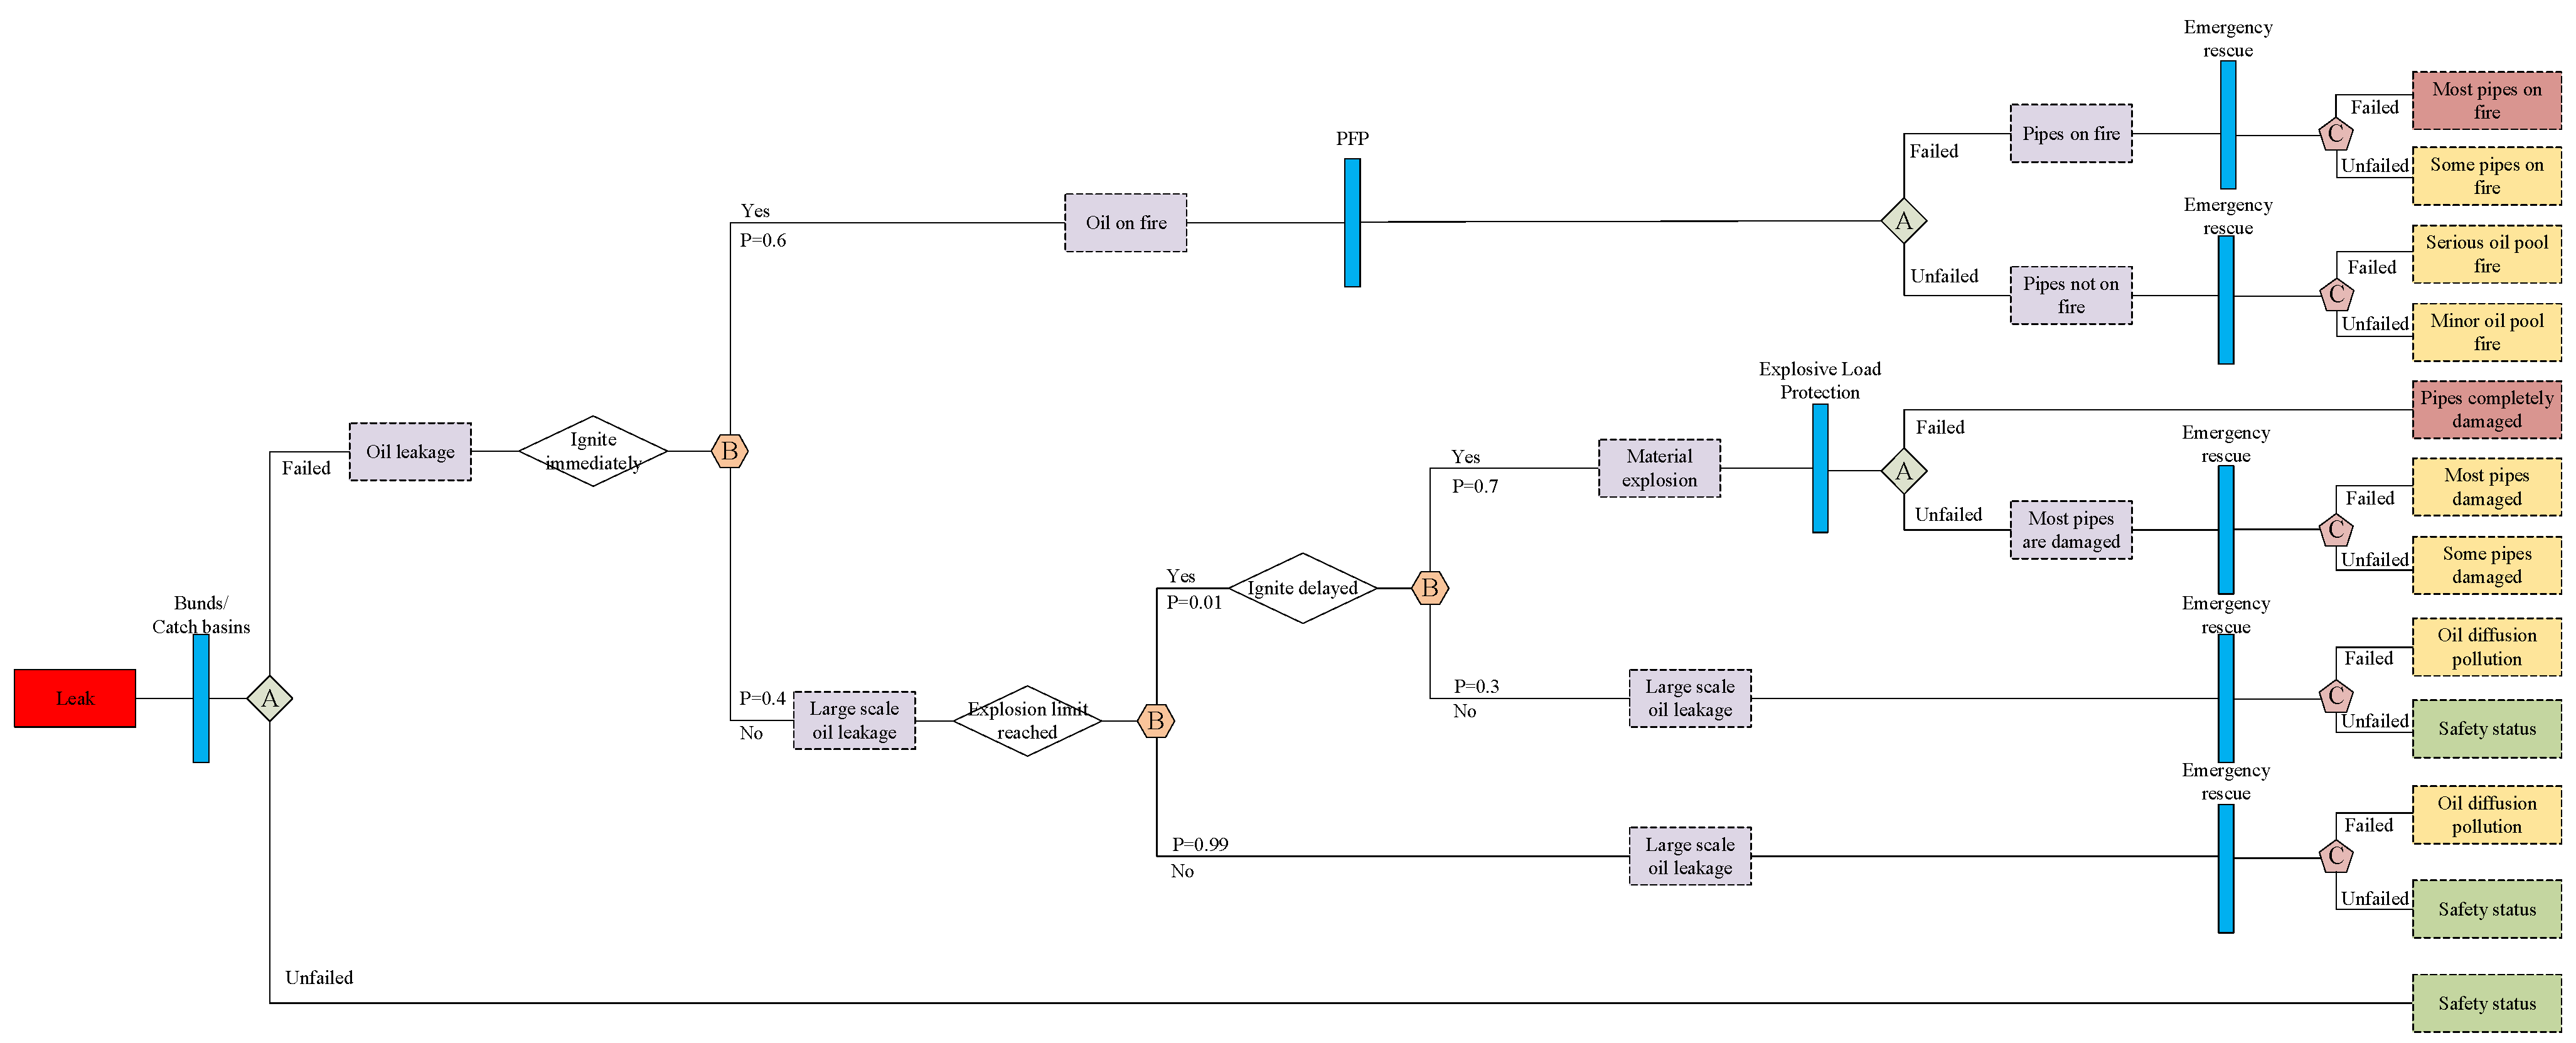
where Pe is the probability of subsequent accidents triggered by disaster, and the event tree representing the evolution process of disaster must be built to calculate Pe. For the OPNS, the parameters of each part of the segment and the barrier resettlement are different and it is necessary to create an event tree. Then, the probability can be quantified using the following Equation (15):
P e = 1 x = 1 n P s a f e
where Psafe is the probability that the final state is safe in the development of the event tree, and x is the number of the safe state in the evolution of the event tree. Figure 4 shows the event tree as an example.
The logical operators described as gates can be obtained in Figure 5, adapted from a previous study [50].

3.3. Quantification of Recovery Ability

Many factors, such as daily usage of hazardous substances, equipment value, the degree of change in system performance, and the cost of recovery need to be considered to quantify the recovery ability. Due to the duration of an earthquake disaster being concise and aftershocks making the post-earthquake recovery mechanism very complicated, it is reasonable to simplify the recovery ability in the cross-regional level energy transmission system [51]. By assuming the damage of each pipe section in the OPNS subject to the Poisson distribution with the parameter Rr along the pipeline [52], the distance Di between two consecutive rupture points in each pipe section system in the OPNS exposed to earthquake can be calculated according to Equation (16), as follows:
D i = ln ( U D ) R r
where UD is a random variable subject to the uniform distribution of 0–1, and Di are randomly generated according to Equation (15). For a single pipeline, when i = 1 m D i > L , m-1 is the maximum number of rupture points.
Typically, the oil station at both ends of the pipeline is equipped with corresponding emergency teams to repair the damaged parts of the pipe in time after the disaster occurs. The repair performance of the pipe is defined as the ratio of the number of rupture points repaired per unit of time to the total number of them. Assuming that all emergency teams will immediately fix the damaged parts when the pipe is damaged and the rescue time needed to repair each rupture point is subject to N~(6h,3h) according to the HAZUS-MHMR4 [53], the performance recovery curve of each pipe section at different times can be obtained by a Monte Carlo simulation, which is shown in Figure 6.
Based on Figure 6, the time begins to recover (t2 in Figure 3) and the time to fully recover (t3 in Figure 3) can be obtained as the average time through the simulation, and a shorter t3 indicates that more rupture points can be repaired per unit time and the pipe section can reach the minimum operation level earlier.

4. Methodology of OPNS Resilience Exposed to Earthquake and the Resilience Partitioning Platform

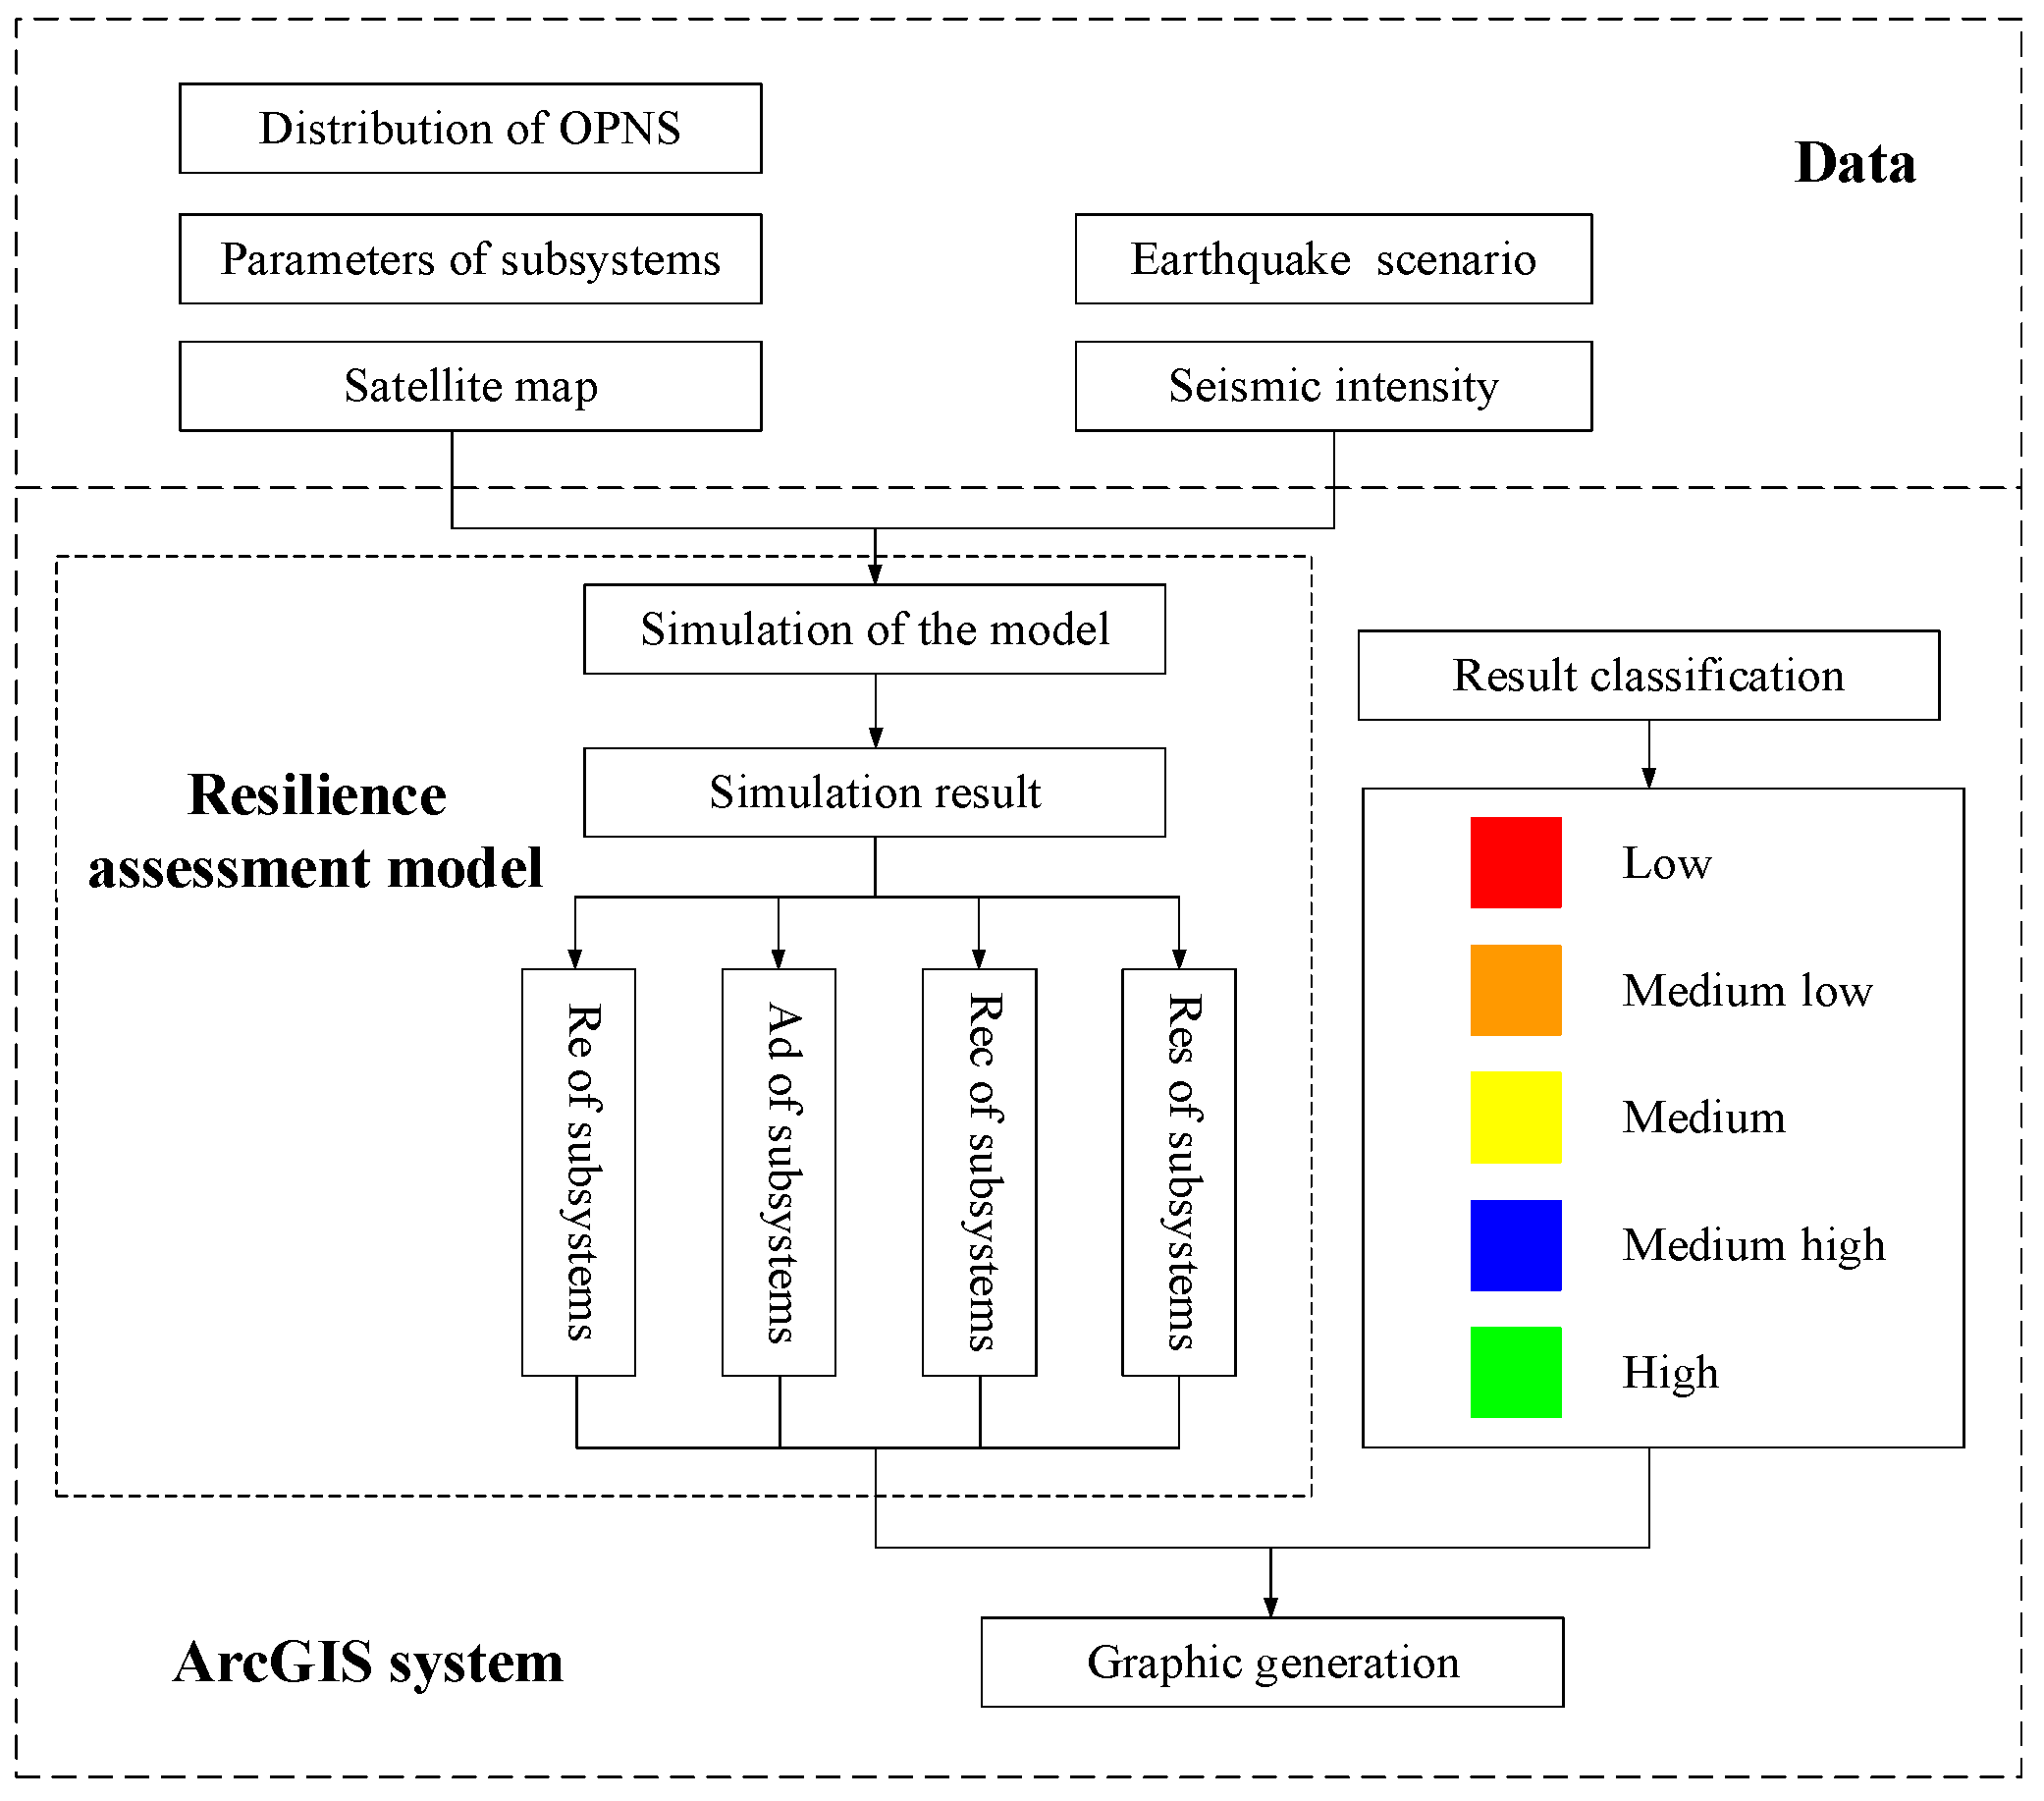
In the present study, the quantification result of the pipe section was visualized using ArcGIS 10.9 by utilizing natural breaks to separate each index into five assessment grades. The higher the score for each index, the stronger each system’s abilities are, and the more resilient the OPNS is. The combination of resilience model and GIS technology adopts the source code programming method. This method takes ArcGIS as an integration platform and uses the Java programming language and SQL statements, which connect resilience as an analysis module with ArcGIS to provide a unified user interface. Combined with the proposed model framework, an OPNS resilience partitioning platform is developed. The spatial analysis and visualization function of the rasterized ArcGIS can partition the subsystem’s resistive ability, adaptive ability, recovery ability, and resilience of OPNS accurately, efficiently, and conveniently, and realize the visualization of results partitioning. The framework for the OPNS resilience partition platform is shown in Figure 7.
Combining the developed partitioning platform and the quantitative resilience assessment model of OPNS, a six-step methodology is further proposed (see Figure 8) to analyze the resilience of OPNS under an earthquake. First, data is collected related to the OPNS, including geographic details, the kind of safety barrier, the pipe diameter, length, and material of each pipe segment. Second, we confirm the earthquake frequency and intensity parameters in the region where each pipe segment is located according to the catastrophes that need to be evaluated. The next step ensures the maintenance plan according to the severity of the disaster, and Step 4 calculates three assessment indexes of pipeline resilience combined with the determined parameters, respectively. Step 5 calculates the resilience of the pipeline segment, and the OPNS resilience is then obtained after weighting. Finally, the last step achieves the partition and visualization of the results based on the OPNS resilience partitioning platform.

5. Case Study Description

5.1. Data Collection

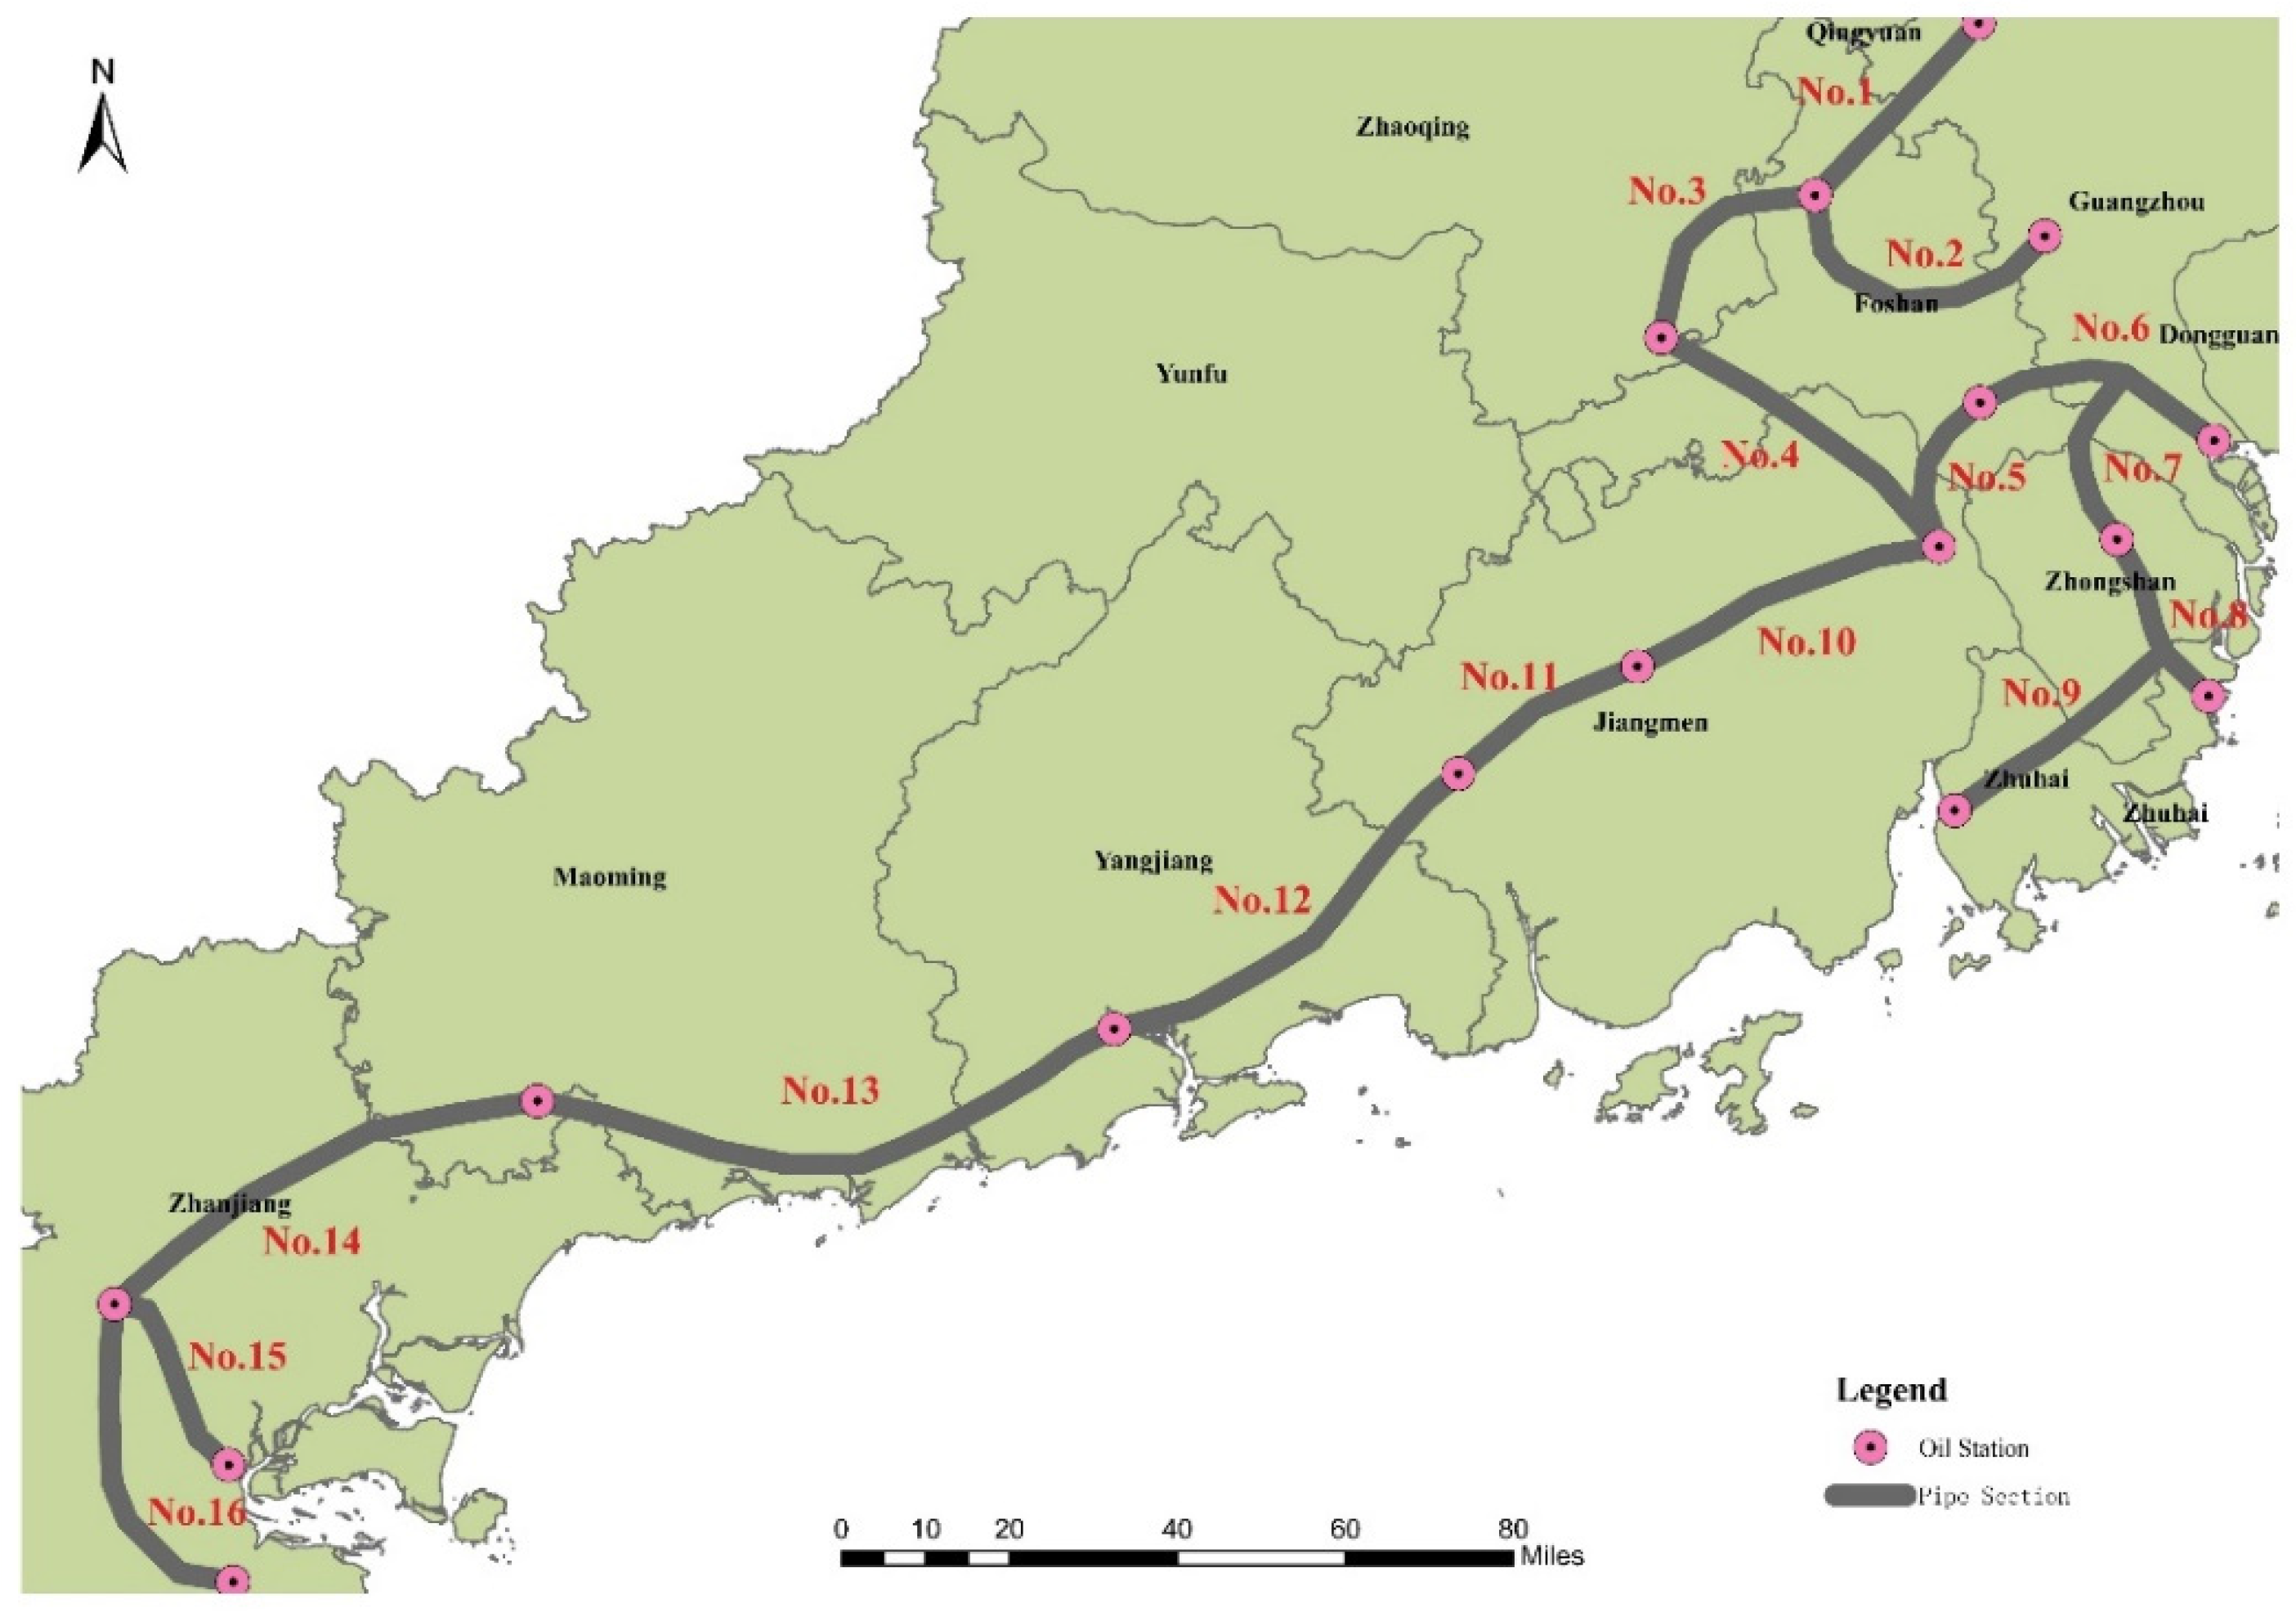
This paper uses the buried OPNS in Guangdong Province, China, as a case study. Analysis reveals that the total length of this network is 1000.776 km, the flow direction of the material is from west to east, and the entire flow of the pipe network is 700 m3/h. Table 2 and Figure 9 detail each pipe section’s parameters and network topology.
According to history, the seismic intensity of this province is basically between VI and VII, and the recurrence period of an earthquake is between 80 years and 100 years, respectively. Based on the Chinese seismic intensity scale (GB/T 17742-2020) [54], the PGA = 1.35 m/s2 and PGV = 0.12 m/s earthquake was selected as the natural disaster case study based on the most adverse principle. Assuming partial soil liquefaction for all pipes, Table 3 summarizes the several types of safety barriers that can be set up for each pipe section.

5.2. Calculation of Resilience Assessment Indexes

Set the number of simulations in the quantification of Rec to 10000, and prepare for restoration by assuming a suspended time (t0t1) of 0.5 weeks [28]. The event trees required by the calculation of Paccident are listed in Figure 10, Figure 11, Figure 12 and Figure 13, and Figure 14a depicts the resilience curve of pipe subsystems for the reliability level at various times. The results of the resilience indexes of each pipeline are summarized in Table 4, and Table 5 presents the resilience Res and Ic of subsystems.
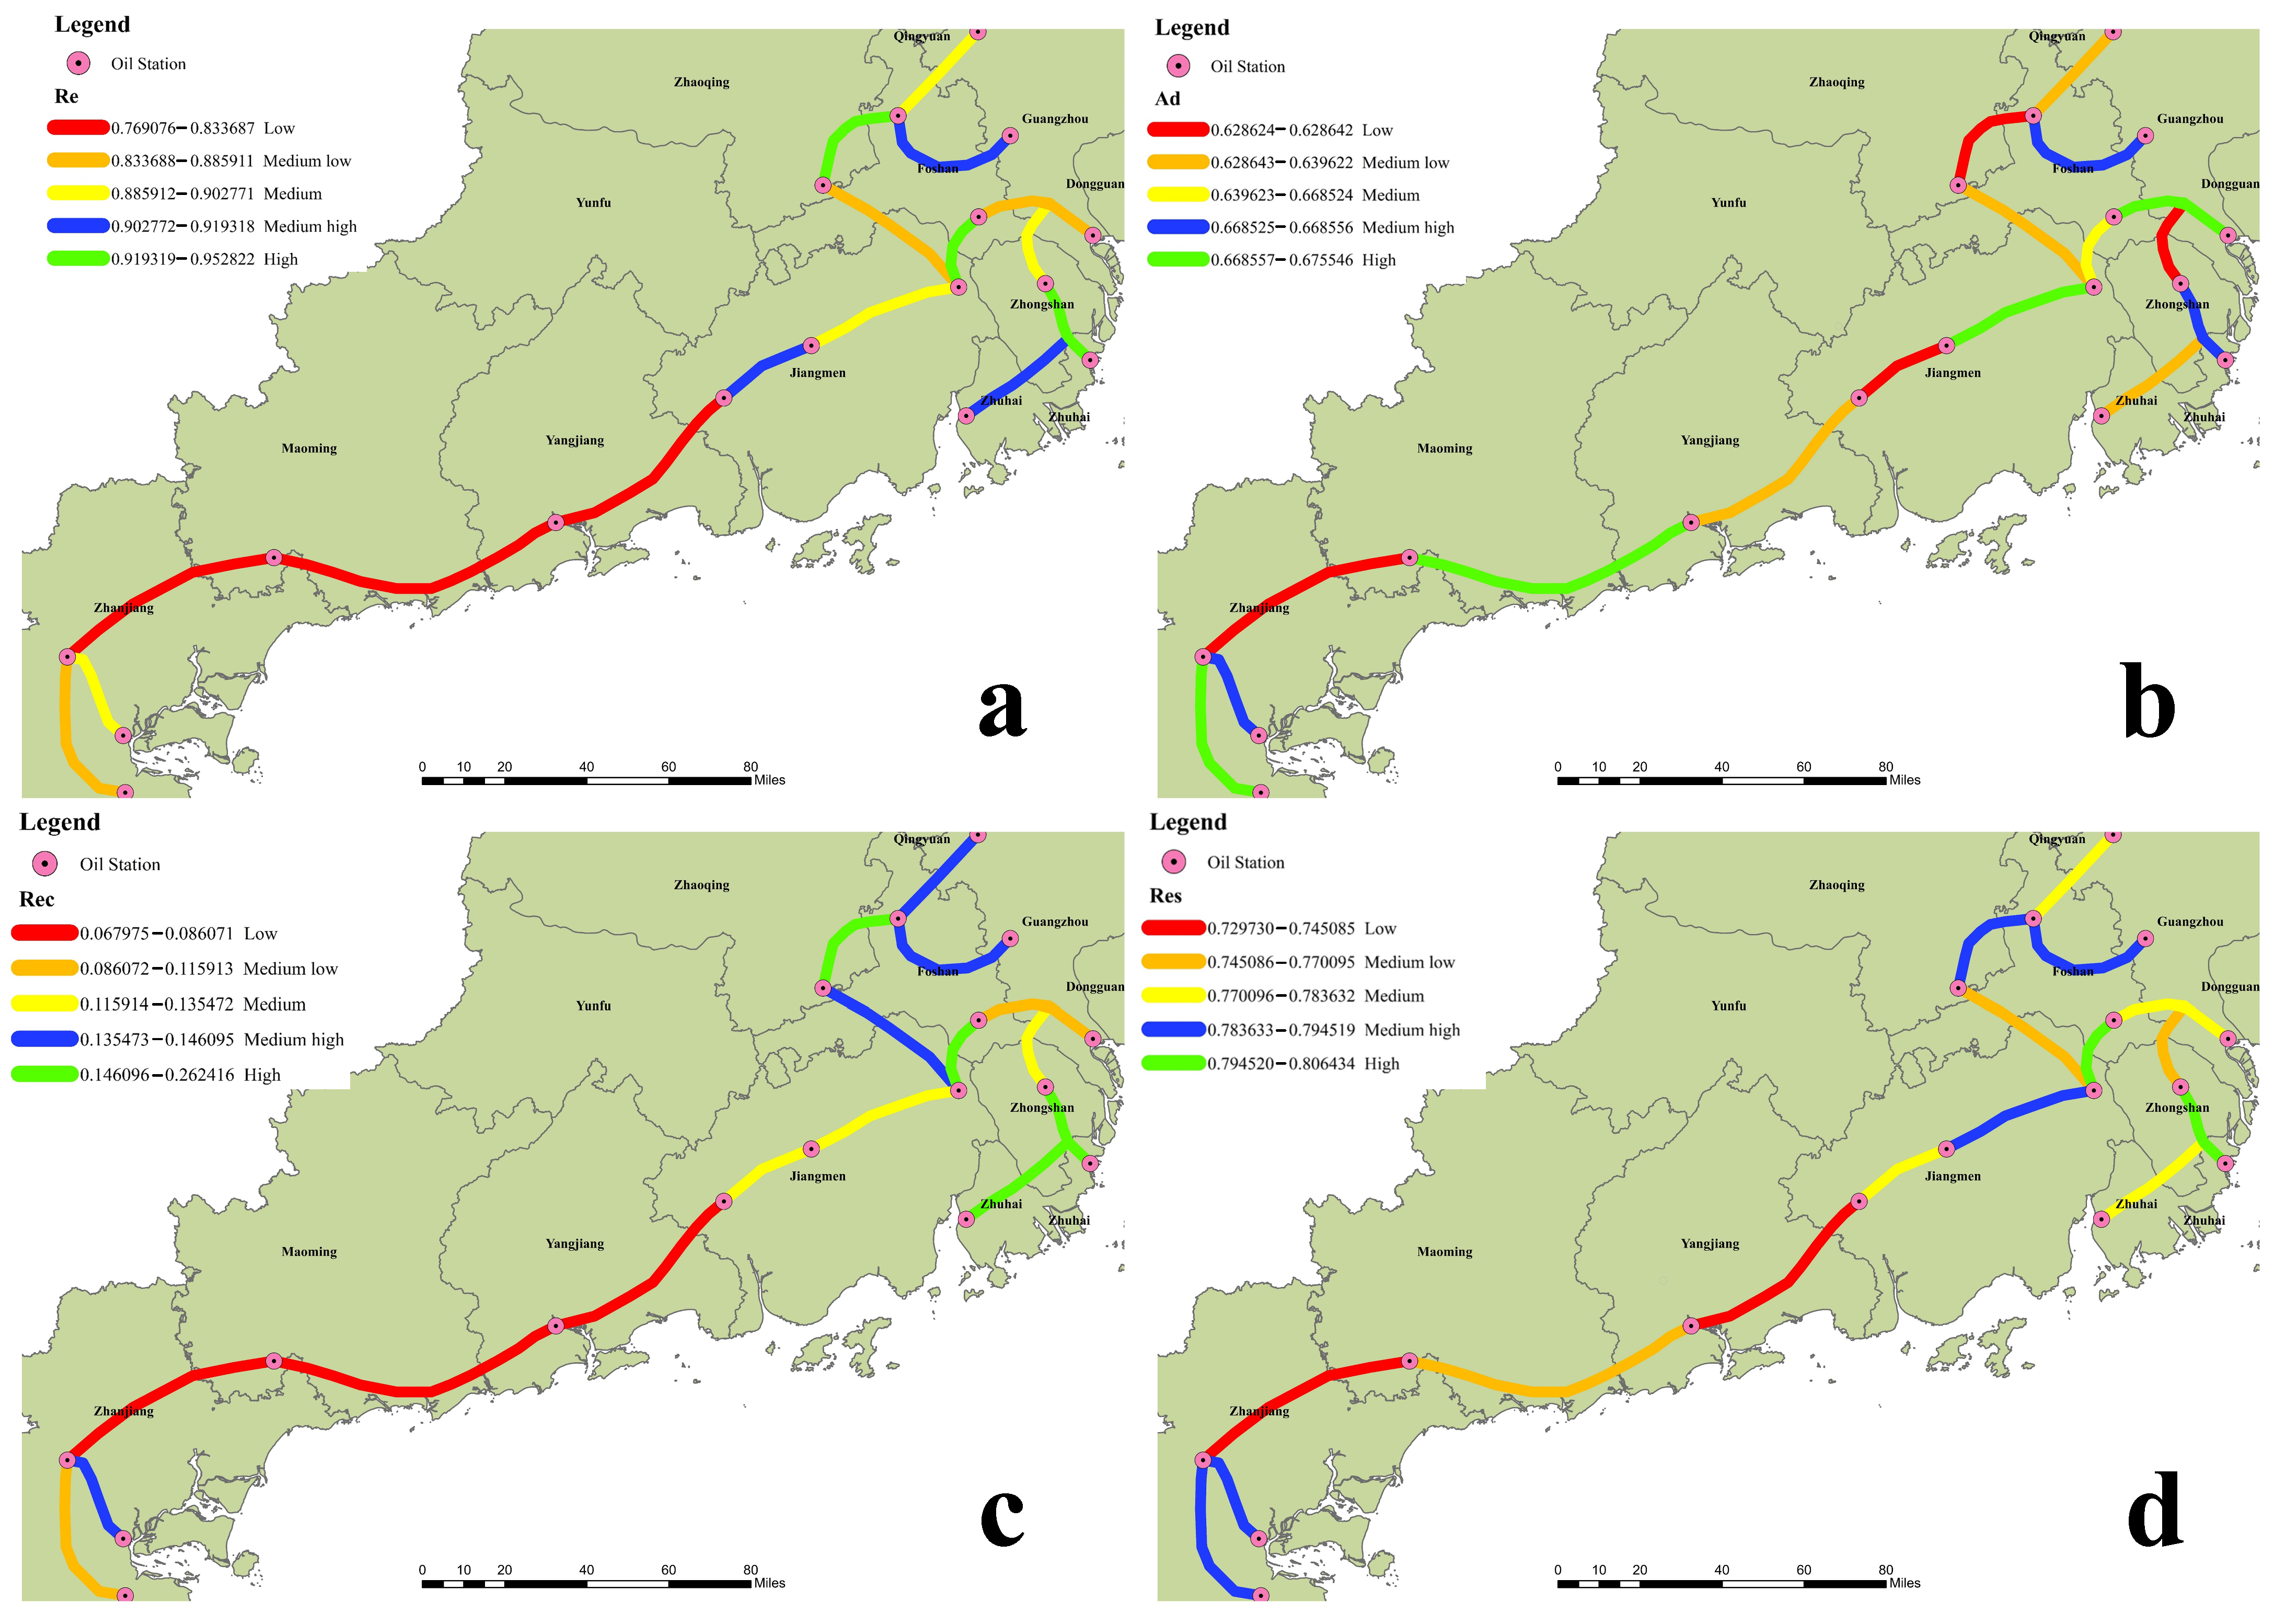
Figure 15 shows the visualization results of grade division for each index. From Figure 15a, the distribution of the Re in each pipe section in the OPNS tends to decrease from west to east when facing an earthquake of VII intensity, and the quantification of pipes 12, 13, and 14 is relatively low. This is because the length of these pipes is longer than others and spans a more extensive geological range, resulting in a broader range of disturbances affected by the earthquake, and it is even more challenging to maintain the stability of its functions in the event of disasters.
As for the adaptive ability, Figure 15b shows that all the pipes in this network can adapt to the accident evolution under earthquake disasters to a certain extent and reduce accidents after damages caused by subsequent disasters due to the involvement of safety barriers. However, pipes 3, 7, 11, and 14 are on a low level compared with other pipes, which means that these pipes are at greater risk of fire or explosion accidents influenced by the system performance and further damage to the structure caused by the earthquake. Therefore, setting up an emergency team near these sections in the deployment of an emergency rescue force can reduce the system’s deterioration risk and prevent further expansion of subsequent accidents.
Regarding recovery ability, it can be seen in Figure 15c that the spatial distribution trend is the same as that of Re (a gradually decreasing trend from west to east). Furthermore, the Rec level for pipes 12, 13, and 14 are also lower than the others according to Figure 14b and Figure 15c, mainly because a longer pipeline will generate more rupture points and requires more recovery time under the same repair efficiency. Therefore, by increasing the number of emergency teams and the daily maintenance frequency of pipes 12, 13, and 14, the repair rate of the pipeline section can be further improved so that the OPNS can quickly reach the lowest performance level to meet the daily needs after the disaster.

5.3. Calculation of Network Resilience

Table 5 shows the quantification of resilience under an earthquake of each pipe calculated by Equation (8). Figure 15d deploys the differentiated and expressed results spatially.
From Figure 15d, it can be obtained that resilience still decreases gradually from west to east. For single pipe sections, the resilience of pipes 12, 13, and 14 is lower than others due to the low Re and Rec, which means that they are more likely to be damaged and cause fires, explosions, or other dangerous accidents in the face of the VII earthquake. Furthermore, the length of these pipes is too long, and it takes longer to recover to the minimum performance level, which turned these pipes into objects requiring special attention in OPNS.
When it comes to the OPNS, the quantification of resilience is 0.7753, as in Equation (2). The result means that this network can resist an earthquake of seismic intensity VII, adapt to the evolution of the post-earthquake scene after the quake, and simultaneously avoid all kinds of derivative accidents. Meanwhile, it would take nearly five and a half weeks to recover to the optimal overall performance level to meet the city’s daily needs.

5.4. Discussion

The method proposed in this paper is used to quantitatively evaluate the resilience of OPNS under different intensities. Considering that the OPNS seismic fortification intensity is VI and above, the content of Section 3.1 shows that the Re of the pipeline has tended to 0 when the earthquake scene is above VIII degrees, indicating that the pipeline has been completely destroyed and that the research value is limited, so an earthquake with an intensity of VI ~ VIII is selected for the initial disaster scenarios. Assume that the ground motion parameters in the case area are the same for simplification and that all the subsystems can be fully recovered. The resilience evaluation results under different intensities are shown in Table 6.
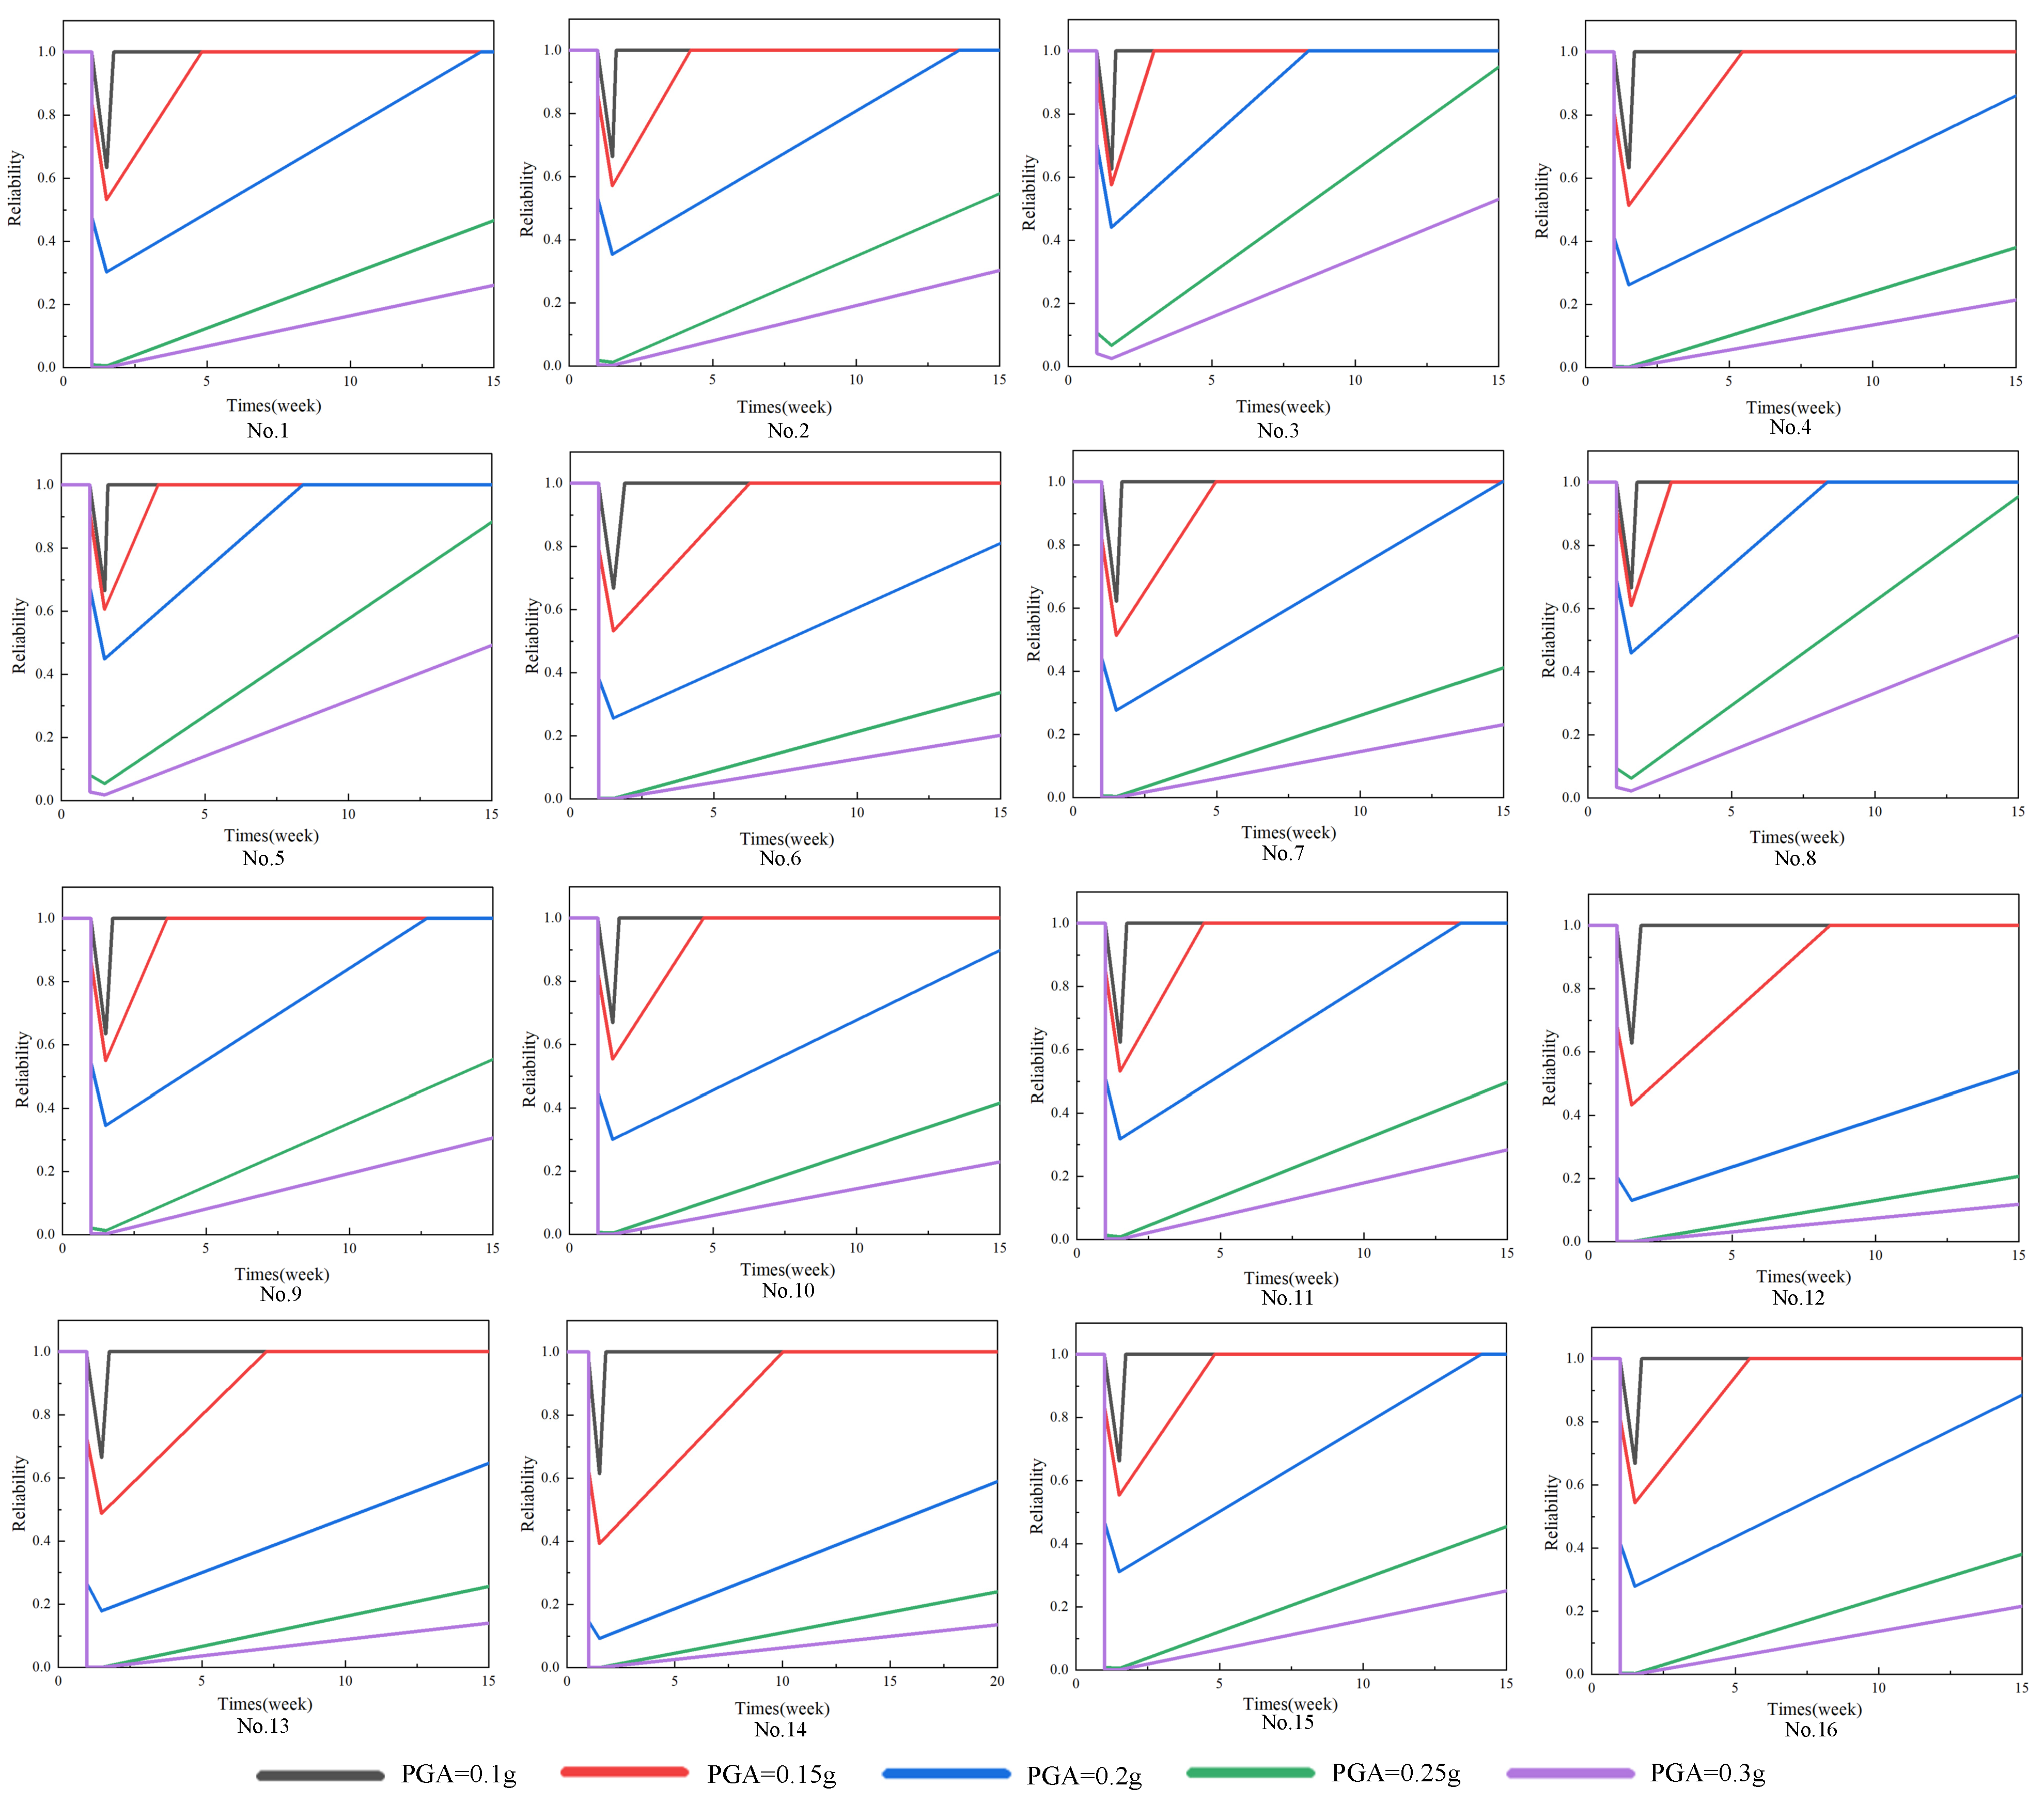
Figure 16 depicts the resilience curve of pipe subsystems for the reliability level at various times under different disaster scenarios. When PGA exceeds 0.2 g, almost all subsystems cannot achieve a complete performance-recovery within 3 months, indicating that the earthquake of intensity VIII is fatal to the OPNS, which will not only cause severe damage to the structure but also exponentially prolong the repair time of the subsystem. As a result, the OPNS cannot effectively obtain its original state recovery to fulfill the daily demand in this scenario. Furthermore, when the PGA is less than 0.2g, although the performance of each subsystem will be degraded to a certain extent when earthquake damage comes, the system can be repaired quickly and restored to the initial state due to the high efficiency of the repair scheme, so that OPNS can be maintained at a high resilience level.
As for the three abilities of resilience, considering that the Ad is reflected in the system and prevents the scenario from evolving to an unsafe state through the configuration of the safety barrier, the change in the Ad is mainly related to the configuration and quantity of the barrier. Furthermore, according to Section 3.2 and Figure 3, the involvement of barriers can improve P2 significantly by mitigating and preventing accident scenarios, making the system more adaptable when facing an earthquake.
Moreover, the Re and Rec decrease with the increase in PGA, as shown in Figure 17a,b, indicating that Re and Rec depend on the severity of earthquake. Interestingly, the Rec decreases rapidly before Re, mainly due to the restoration time vastly increasing when the PGA increases from 0.1g to 0.15g. As a result, shortening the restoration time by applying a more efficient strategy can be a great measure of resilience enhancement.
Additionally, with increasing the severity of earthquake, the resilience rapidly decreases and then approaches the minimal resilience value, as shown in Figure 17c,d. The minimal resilience is close to 0.5 for the assumption that all the systems can achieve a complete restoration without considering the repair time, indicating that the OPNS can resist the disturbance of disasters to a certain extent and keep its performance stable in the seismic scenarios with VII and below. When the intensity is above VII, the resilience decreases rapidly due to the possibility, and the degree of structural damage to the system increase sharply, which will prolong the system’s recovery time and make it difficult to restore to a specific performance level in time.
Furthermore, the inflection point for the rest of the pipes appears at PGV = 0.2g, whereas the resilience of pipes 12, 13, and 14 starts to decline quickly at PGV = 0.15g and slowly at PGV = 0.2g (see Figure 17c), indicating that these pipes are more sensitive to changes in PGV and are more susceptible to losing resilience when confronted with earthquakes. This result is similar to the above assessment, demonstrating that the most vulnerable part in this OPNS is pipes 12, 13, and 14. As such, the OPNS can be made more resilient by enhancing the resilience of these parts.
Finally, comparing the change curves of Re and Rec with PGA (see Figure 17c,d), it can be seen that the variation trend of resilience is compatible with the variation trend of Re, indicating that Re can significantly influence the variation trend of resilience. This result demonstrates that the resistive ability is considered the primary index that contributes to system resilience [39], and reasonably improving the system’s Re will be the most efficient strategy to increase resilience.

6. Conclusions

The present study aimed to develop a systematic quantitative resilience assessment approach for OPNS exposed to earthquakes. Through the case study application, the following conclusions are obtained:
(1) The resistive ability, the adaptive ability, the recovery ability, and the importance coefficient of each subsystem play a significant role in the resilience of OPNS. The damage severity and recovery time may increase with seismic intensity, resulting in the reduced resistive ability and recovery ability of the investigated system. Furthermore, removing safety barriers can significantly exacerbate the decline in reliability, reducing the adaptive ability of the system. Considering that the importance of each subsystem is different, underestimating the importance coefficient and the indexes mentioned above will lead to an inaccurate assessment of OPNS resilience;
(2) The case study demonstrates that the recovery ability is the most sensitive ability index among the three indexes in resilience. In contrast, the resistive ability is recognized as the primary index contributing to system resilience, since it can influence the fluctuation trend of resilience;
(3) Under different seismic intensities, the OPNS resilience can vary considerably. In an earthquake scenario with an intensity below VII, the pipe network belongs to the resilient OPNS. When the intensity exceeds VII, the resilience decreases rapidly with the increase in PGA, and the OPNS will not belong to the resilience system when the PGA is more significant than 0.2g;
(4) By combining the resilience assessment model with GIS technology, it is possible to visualize resilience partitioning and increase the application efficiency of this methodology. The outcome of this research can be used to support the decision-making of regional planning, emergency management, disaster prevention, and mitigation in OPNS.
In order to improve and evolve the proposed methodology, future research should adopt the assessment parameters of system resilience most coinciding with the facts. For example, the system’s functionality should be considered more comprehensively, including the users’ satisfaction, the network connectivity, and the efficiency of oil transportation. In addition, calculating the ground motion parameters using the ground motion prediction equation is meaningful for assessing OPNS resilience. Further efforts are also required to quantify the effect of resilience-strengthening strategies, which can optimize the system’s resilience and reduce the impact of the disaster.

Supplementary Materials

The following supporting information can be downloaded at: https://www.mdpi.com/article/10.3390/su15020972/s1, Table S1: Explanation of notations in the manuscript.

Author Contributions

J.M. developed the methodology and its application, analyzed the results, drafted the manuscript, and finalized it; G.C. and Y.Z. administrated and supervised this study, acquired funding and data, and provided suggestions on the manuscript; T.Z. provided support for the assessment model and contributed to manuscript writing; L.Z. and J.Z. provided suggestions on the manuscript and polished the manuscript. All authors have read and agreed to the published version of the manuscript.

Funding

This work was supported by the Science and Technology Planning Project of Guangdong Province (Number: 2019B020208012) and the National Natural Science Foundation of China (22078109).

Data Availability Statement

The data presented in this study are available on request from the corresponding author and are not publicly available due to confidentiality.

Acknowledgments

Acknowledgment is due to the local authorities and expert groups of Area P, as well as to all contributors.

Conflicts of Interest

This manuscript has not been published or presented elsewhere in part or in its entirety and is not under consideration by another journal. There are no conflict of interest to declare.

References

  1. Urlainis, A.; Shohet, I.M.; Levy, R. Probabilistic Risk Assessment of Oil and Gas Infrastructures for Seismic Extreme Events. Procedia Eng. 2015, 123, 590–598. [Google Scholar] [CrossRef] [Green Version]
  2. Girgin, S.; Elisabeth, K. Lessons Learned from Oil Pipeline Natech Accidents and Recommendations for Natech Scenario Development Final Report; Institute for the Protection and Security of the Citizen, Joint Research Centre: Luxembourg, 2015; Volume 2749, p. 21027. [Google Scholar] [CrossRef]
  3. Wang, X.; Guo, E.; Zhang, M. Analysis and Countermeasures on Seismic Damages to Gas Pipeline in Wenchuan Earthquake. World Inf. Earthq. Eng. 2012, 194, 1938–1942. [Google Scholar] [CrossRef]
  4. Psyrras, N.K.; Sextos, A.G. Safety of Buried Steel Natural Gas Pipelines under Earthquake-Induced Ground Shaking: A Review. Soil Dyn. Earthq. Eng. 2018, 106, 254–277. [Google Scholar] [CrossRef] [Green Version]
  5. Schuster, R. The March 5, 1987, Ecuador Earthquakes: Mass Wasting and Socioeconomic Effects; National Academies Press: Washington, DC, USA, 1991; ISBN 9780309044448. [Google Scholar]
  6. Leveille, T.P.; Shane, D.; Morris, J. Northridge earthquake pipeline rupture into the santa clara river. Int. Oil Spill Conf. Proc. 1995, 1995, 489–494. [Google Scholar] [CrossRef]
  7. Pasquarè, F.A.; Tormey, D.; Vezzoli, L.; Okrostsvaridze, A. Mitigating the Consequences of Extreme Events on Strategic Facilities: Evaluation of Volcanic and Seismic Risk Affecting the Caspian Oil and Gas Pipelines in the Republic of Georgia. J. Environ. Manag. 2011, 92, 1774–1782. [Google Scholar] [CrossRef]
  8. Liu, A.; Chen, K.; Wu, J. State of Art of Seismic Design and Seismic Hazard Analysis for Oil and Gas Pipeline System. Earthq. Sci. 2010, 23, 259–263. [Google Scholar] [CrossRef] [Green Version]
  9. Zhong, Z.; Filiatrault, A.; Aref, A. Numerical Simulation and Seismic Performance Evaluation of Buried Pipelines Rehabilitated with Cured-in-place-pipe Liner under Seismic Wave Propagation. Earthq. Eng. Struct. Dyn. 2017, 46, 811–829. [Google Scholar] [CrossRef]
  10. Jahangiri, V.; Shakib, H. Seismic Risk Assessment of Buried Steel Gas Pipelines under Seismic Wave Propagation Based on Fragility Analysis. Bull. Earthq. Eng. 2018, 16, 1571–1605. [Google Scholar] [CrossRef]
  11. Chen, C.; Li, C.; Reniers, G.; Yang, F. Safety and Security of Oil and Gas Pipeline Transportation: A Systematic Analysis of Research Trends and Future Needs Using WoS. J. Clean. Prod. 2021, 279, 123583. [Google Scholar] [CrossRef]
  12. Sarvanis, G.C.; Karamanos, S.A. Analytical Model for the Strain Analysis of Continuous Buried Pipelines in Geohazard Areas. Eng. Struct. 2017, 152, 57–69. [Google Scholar] [CrossRef] [Green Version]
  13. Wu, X.N.; Lu, H.F.; Wu, S.J.; Kun, H.; Chen, X.; Kang, F.X.; Liu, Z.L. Analysis of Suspended Pipeline Stress Sensitivity. Appl. Mech. Mater. 2014, 501, 2331–2334. [Google Scholar] [CrossRef]
  14. Makhoul, N.; Navarro, C. A Comparative Study of Buried Pipeline Fragilities Using the Seismic Damage to the Byblos Wastewater Network. Int. J. Disaster Risk Reduct. 2020, 51, 101775. [Google Scholar] [CrossRef]
  15. Germoso, C.; Gonzalez, O.; Chinesta, F. Seismic Vulnerability Assessment of Buried Pipelines: A 3D Parametric Study. Soil Dyn. Earthq. Eng. 2021, 143, 106627. [Google Scholar] [CrossRef]
  16. Shabarchin, O.; Tesfamariam, S. Risk Assessment of Oil and Gas Pipelines with Consideration of Induced Seismicity and Internal Corrosion. J. Loss Prev. Process Ind. 2017, 47, 85–94. [Google Scholar] [CrossRef]
  17. Tserng, H.P.; Cho, I.C.; Chen, C.H.; Liu, Y.F. Developing a Risk Management Process for Infrastructure Projects Using Idef0. Sustainability 2021, 13, 6958. [Google Scholar] [CrossRef]
  18. Lin, G.; Wang, S.; Lin, C.; Bu, L.; Xu, H. Evaluating Performance of Public Transport Networks by Using Public Transport Criteria Matrix Analytic Hierarchy Process Models—Case Study of Stonnington, Bayswater, and Cockburn Public Transport Network. Sustainability 2021, 13, 6949. [Google Scholar] [CrossRef]
  19. Pajek, L.; Košir, M. Exploring Climate-Change Impacts on Energy Efficiency and Overheating Vulnerability of Bioclimatic Residential Buildings under Central European Climate. Sustainability 2021, 13, 6791. [Google Scholar] [CrossRef]
  20. Assad, A.; Bouferguene, A. Resilience Assessment of Water Distribution Networks–Bibliometric Analysis and Systematic Review. J. Hydrol. 2022, 607, 127522. [Google Scholar] [CrossRef]
  21. Cimellaro, G.P.; Villa, O.; Bruneau, M. Resilience-Based Design of Natural Gas Distribution Networks. J. Infrastruct. Syst. 2015, 21, 5014005. [Google Scholar] [CrossRef]
  22. Zhao, X.; Chen, Z.; Gong, H.; Qiang, L. Review on the Study of Disaster Resilience of Critical Infrastructure Systems. China Civ. Eng. J. 2017, 50, 62–71. [Google Scholar] [CrossRef]
  23. Li, X.; Su, H.; Zhang, J. A Systematic Assessment Method of Supply Resilience for Natural Gas Supply Systems. Chem. Eng. Res. Des. 2022, 182, 207–215. [Google Scholar] [CrossRef]
  24. Cimellaro, G.P.; Reinhorn, A.M.; Bruneau, M. Framework for Analytical Quantification of Disaster Resilience. Eng. Struct. 2010, 32, 3639–3649. [Google Scholar] [CrossRef]
  25. Han, L.; Zhao, X.D.; Chen, Z.L. Seismic Resilience Assessment and Optimization of Urban Water Distribution Network. China Saf. Sci. J. 2021, 31, 135–142. [Google Scholar]
  26. Song, Z.; Liu, W.; Shu, S. Resilience-Based Post-Earthquake Recovery Optimization of Water Distribution Networks. Int. J. Disaster Risk Reduct. 2022, 74, 102934. [Google Scholar] [CrossRef]
  27. Bi, X.; Ji, K.; Wen, R.; Zong, C.; Zhang, X. Seismic Resilience Quantification Assessment of Urban Gas Network Considering Recovery Efficiency and Methods. Yingyong Jichu Yu Gongcheng Kexue Xuebao/J. Basic Sci. Eng. 2021, 29, 1561–1575. [Google Scholar] [CrossRef]
  28. Zong, C.C.; Ji, K.; Wen, R.Z.; Bi, X.R.; Zhang, X.R. Three-Dimensional Seismic Resilience Quantification Framework for the Urban Gas Network. Gongcheng Lixue/Eng. Mech. 2021, 38, 146–156. [Google Scholar] [CrossRef]
  29. Vairo, T.; Gualeni, P.; Reverberi, A.P.; Fabiano, B. Resilience Dynamic Assessment Based on Precursor Events: Application to Ship Lng Bunkering Operations. Sustainability 2021, 13, 6836. [Google Scholar] [CrossRef]
  30. Ptak-Wojciechowska, A.; Januchta-Szostak, A.; Gawlak, A.; Matuszewska, M. The Importance of Water and Climate-Related Aspects in the Quality of Urban Life Assessment. Sustainability 2021, 13, 6573. [Google Scholar] [CrossRef]
  31. Liu, W.; Song, Z. Review of Studies on the Resilience of Urban Critical Infrastructure Networks. Reliab. Eng. Syst. Saf. 2020, 193, 106617. [Google Scholar] [CrossRef]
  32. Zhang, J.; Su, H.; Gao, P. Resilience-Based Supply Assurance of Natural Gas Pipeline Networks and Its Research Prospects. Shiyou Xuebao/Acta Pet. Sin. 2020, 41, 1665–1678. [Google Scholar] [CrossRef]
  33. Brunner, R.D.; Gunderson, L.H.; Holling, C.S.; Light, S.S. Barriers and Bridges to the Renewal of Ecosystems and Institutions. J. Wildl. Manag. 1997, 61, 1437. [Google Scholar] [CrossRef]
  34. Allenby, B.; Fink, J. Social and Ecological Resilience: Toward Inherently Secure and Resilient Societies. Science 2005, 309, 1034–1036. [Google Scholar] [CrossRef] [Green Version]
  35. Sharifi, A.; Yamagata, Y. On the Suitability of Assessment Tools for Guiding Communities towards Disaster Resilience. Int. J. Disaster Risk Reduct. 2016, 18, 115–124. [Google Scholar] [CrossRef] [Green Version]
  36. Bi, W.; Tang, Y.; Mao, T.T.; Sun, X.H.; Li, Q.M. Review on Resilience Management of Urban Infrastructure System. China Saf. Sci. J. (CSSJ) 2021, 31, 14–28. [Google Scholar] [CrossRef]
  37. Ji, C.; Wei, Y.; Poor, H.V. Resilience of Energy Infrastructure and Services: Modeling, Data Analytics, and Metrics. Proc. IEEE 2017, 105, 1354–1366. [Google Scholar] [CrossRef]
  38. Liu, Y.P.; He, J.X. Review on Infrastructure Resilience Assessment and Future Direction. J. Catastrophology 2021, 36, 153. [Google Scholar] [CrossRef]
  39. Yarveisy, R.; Gao, C.; Khan, F. A Simple yet Robust Resilience Assessment Metrics. Reliab. Eng. Syst. Saf. 2020, 197, 106810. [Google Scholar] [CrossRef]
  40. Ryûji, I.; Êsuke, I.; Sêji, Y.; Nobu, S. Research on Earthquake Damage Prediction of Water Pipes. J. Watercourse Assoc. 1998, 67, 25–40. [Google Scholar]
  41. Hollnagel, E. Barriers and Accident Prevention; Routledge: London, UK, 2016. [Google Scholar] [CrossRef]
  42. Hollnagel, E. Risk + Barriers = Safety? Saf. Sci. 2008, 46, 221–229. [Google Scholar] [CrossRef]
  43. Wei, C.; Rogers, W.J.; Mannan, M.S. Layer of Protection Analysis for Reactive Chemical Risk Assessment. J. Hazard. Mater. 2008, 159, 19–24. [Google Scholar] [CrossRef] [PubMed]
  44. Lees, F.P. Loss Prevention in the Process Industries (Partially Updated by S. Mannan); Butterworths: Burlington, NJ, USA, 2015; Volume 1. [Google Scholar]
  45. Frank, K.; Gravestock, N.; Spearpoint, M.; Fleischmann, C. A Review of Sprinkler System Effectiveness Studies. Fire Sci. Rev. 2013, 2, 6. [Google Scholar] [CrossRef] [Green Version]
  46. SINTEF. Guidance for Barrier Management in the Petroleum Industry. SINTEF Rep. A 2016, 27623, 62. [Google Scholar]
  47. Misuri, A.; Landucci, G.; Cozzani, V. Assessment of Safety Barrier Performance in the Mitigation of Domino Scenarios Caused by Natech Events. Reliab. Eng. Syst. Saf. 2021, 205, 107278. [Google Scholar] [CrossRef]
  48. Misuri, A.; Landucci, G.; Cozzani, V. Assessment of Risk Modification Due to Safety Barrier Performance Degradation in Natech Events. Reliab. Eng. Syst. Saf. 2021, 212, 107634. [Google Scholar] [CrossRef]
  49. Landucci, G.; Argenti, F.; Tugnoli, A.; Cozzani, V. Quantitative Assessment of Safety Barrier Performance in the Prevention of Domino Scenarios Triggered by Fire. Reliab. Eng. Syst. Saf. 2015, 143, 30–43. [Google Scholar] [CrossRef]
  50. Landucci, G.; Argenti, F.; Spadoni, G.; Cozzani, V. Domino Effect Frequency Assessment: The Role of Safety Barriers. J. Loss Prev. Process Ind. 2016, 44, 706–717. [Google Scholar] [CrossRef]
  51. Ramadhani, A.; Khan, F.; Colbourne, B.; Ahmed, S.; Taleb-Berrouane, M. Resilience Assessment of Offshore Structures Subjected to Ice Load Considering Complex Dependencies. Reliab. Eng. Syst. Saf. 2022, 222, 108421. [Google Scholar] [CrossRef]
  52. Wang, Y. Seismic Risk Assessment of Water Supply Systems. In Handbook of Seismic Risk Analysis and Management of Civil Infrastructure Systems; Woodhead Publishing: London, UK, 2013; Volume 26, pp. 659–684, 682e–684e. [Google Scholar] [CrossRef]
  53. Mr, H.-M. Multi-Hazard Loss Estimation Methodology: Earthquake Model; Department of Homeland Security, Federal Emergency Management Agency: Washington, DC, USA, 2003; pp. 235–260.
  54. China Seismological Bureau; Institute of Engineering Mechanics; China Earthquake Administration. Chinese Seismic Intensity Scale; Standardization Administration of the People’s Republic of China: Beijing, China, 2020.
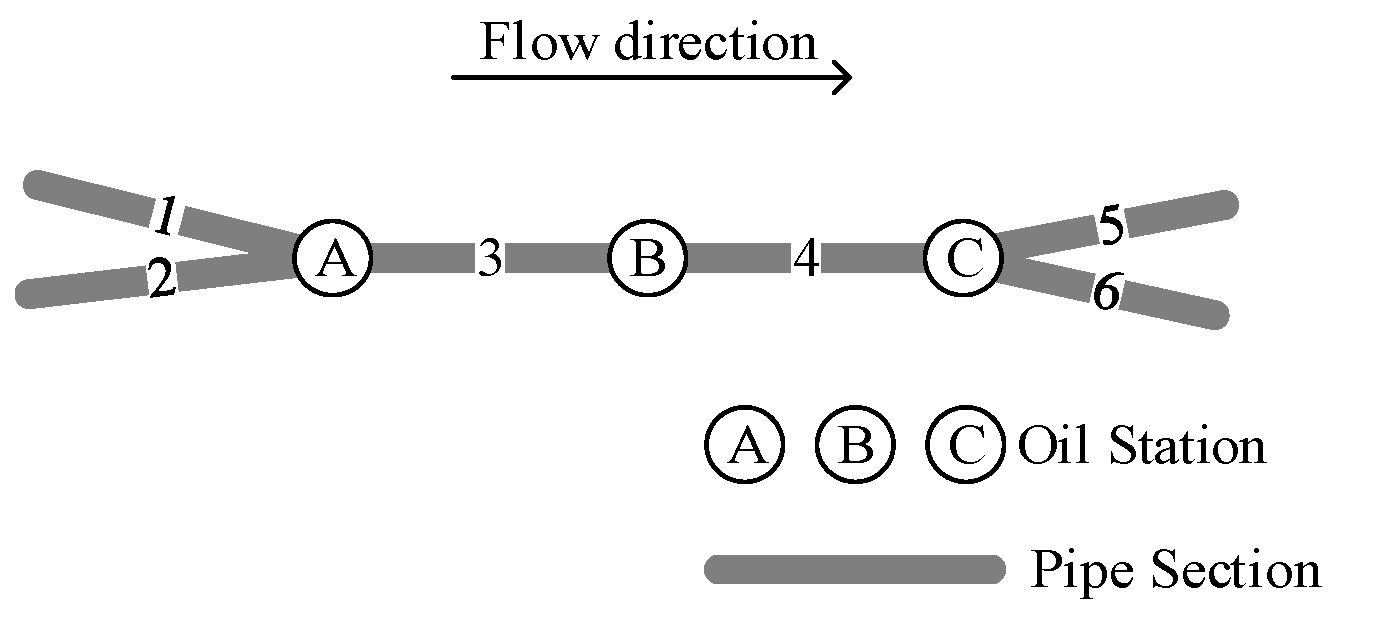
Figure 1. Simplified diagram for calculating Ic.
Sustainability 15 00972 g001
Figure 2. Logical relation of OPNS and subsystem resilience.
Sustainability 15 00972 g002
Figure 3. Resilience metric in terms of pipeline reliability.
Sustainability 15 00972 g003
Figure 4. Event tree of pipeline system considered safety barriers.
Sustainability 15 00972 g004
Figure 5. Definition of operators to be used in ETA [49].
Sustainability 15 00972 g005
Figure 6. Recovery performance curve of pipeline. (a) single iteration; (b) 5000 iterations.
Sustainability 15 00972 g006
Figure 7. Framework of the OPNS resilience partitioning platform.
Sustainability 15 00972 g007
Figure 8. Resilience analysis methodology under an earthquake in OPNS.
Sustainability 15 00972 g008
Figure 9. Layout of the case study OPNS.
Sustainability 15 00972 g009
Figure 10. Event tree for pipes No.1, 4, 9, and 12.
Sustainability 15 00972 g010
Figure 11. Event tree for pipes No.2, 5, 8, and 15.
Sustainability 15 00972 g011
Figure 12. Event tree for pipes No.3, 7, 11, and 14.
Sustainability 15 00972 g012
Figure 13. Event tree for pipes No.6, 10, 13, and 16.
Sustainability 15 00972 g013
Figure 14. Resilience curve and recovery performance curve of OPNS. (a) Resilience curve with reliability at different times; (b) Recovery performance curve of pipes in OPNS.
Sustainability 15 00972 g014
Figure 15. Distribution of the results in the pipeline network. (a) Distribution of Re; (b) Distribution of Ad; (c) Distribution of Rec; (d) Distribution of Res.
Sustainability 15 00972 g015
Figure 16. Resilience curve with reliability at different times under different PGAs.
Sustainability 15 00972 g016
Figure 17. Tendency of Re and Rec under different intensities. (a) Index of Re; (b) Index of Rec; (c) Resilience of pipes; (d) Resilience of OPNS.
Sustainability 15 00972 g017
Table 1. Safety barriers considered in OPNS.
IDNameClassificationIDNameClassification
aFire retardant valveActiveiRegular patrolActive
bIsolating valvesActivejEmergency teamsActive
cBlowdown valvesActiveAPassive fireproofing (PFP)Passive
dOverpressure detectionActiveBFlood control measuresPassive
eClogging detectionActiveCExplosive load protectionPassive
fPressure reducing valveActiveDAnticorrosive coatingsPassive
gEmergency shutdownActiveEBunds/ catch basinsPassive
hProcess shutdownActiveFEmergency blowdown line to flare stackPassive
Table 2. Detailed information on pipe sections used for the case study.
No.Diameter
(mm)
Thickness
(mm)
Length
(km)
Geological
Topography
MaterialFlow
(m3/h)
1219.15.644.8HillQ235116
2219.15.652MountainQ235116
32195.631.75Alluvial plainQ235116
4273.16.472.94MountainQ235179
5323.99.535.79Alluvial plainQ235250
6323.96.458.079HillQ235250
72195.649.233HillQ235116
82195.633.7Alluvial plainQ235116
92195.655.267Alluvial plainQ235116
10406.47.148.535HillQ235397
11406.47.140.775HillQ235397
12406.47.195.177HillQ235397
13406.47.1119.503Alluvial plainQ235397
14406.47.1115HillQ235397
15406.47.168.741Alluvial plainQ235397
16406.47.179.486Alluvial plainQ235397
Table 3. Barrier consideration of each pipe in the case study.
No.Active BarrierPassive BarrierNo.Active BarrierPassive BarrierNo.Active BarrierPassive BarrierNo.Active BarrierPassive Barrier
1c, d, e, g, i, jA, C, D, G5a, b, e, f, i, jC, D, G9c, d, e, g, i, jA, C, D, G13c, d, e, i, jA, C, D, E, G
2a, b, e, f, i, jC, D, G6c, d, e, i, jA, C, D, E, G10c, d, e, i, jA, C, D, E, G14c, f, g, i, jC, D, F, G
3c, f, g, i, jC, D, F, G7c, f, g, i, jC, D, F, G11c, f, g, i, jC, D, F, G15a, b, e, f, i, jC, D, G
4c, d, e, g, i, jA, C, D, G8a, b, e, f, i, jC, D, G12c, d, e, g, i, jA, C, D, G16c, d, e, i, jA, C, D, E, G
Table 4. Quantification results of resilience indexes in the pipeline network.
No.P0P1P2P3t0t1t2t3ReAdRec
110.9027710.577416100.50.5113472.3351560.9027710.6396040.144950
210.9166170.61281100.50.526412.1838990.9166170.6685560.146095
310.9528220.598968100.50.5284371.4456010.9528220.6286250.262416
410.8850370.566073100.50.5110912.4067490.8850370.6396040.143258
510.9469810.63311100.50.5138481.5607260.9469810.6685560.214595
610.8758110.591651100.50.5138892.7788280.8758110.6755460.113557
710.893680.56179100.50.5060922.5341910.8936800.6286250.135472
810.9499980.635127100.50.5248661.4365390.9499980.6685560.242361
910.9193180.588100.50.519251.7996790.9193180.6396040.198183
1010.8951050.604685100.50.5221842.5171260.8951050.6755460.124538
1110.9111060.572744100.50.5197782.6301410.9111060.6286250.127169
1210.8046840.514679100.50.5179934.3408350.8046840.6396040.080391
1310.8336870.563194100.50.5157113.7268150.8336870.6755460.086071
1410.7690760.483461100.50.5247725.3439920.7690760.6286250.067975
1510.9006560.602139100.50.5224952.2606260.9006560.6685560.143255
1610.8859110.598473100.50.5158392.6966890.8859110.6755460.115913
Table 5. Quantification results of Res and Ic in the pipeline network.
No.ResIcNo.ResIcNo.ResIcNo.ResIc
10.7772722.79%50.8064346.02%90.7805892.79%130.769529.56%
20.7945192.79%60.7836326.02%100.7901829.56%140.729739.56%
30.7873812.79%70.769882.79%110.7763169.56%150.7881049.56%
40.7700954.31%80.8057042.79%120.7450859.56%160.7874819.56%
Table 6. Res of pipes under different PGAs.
No.0.1 g0.15 g0.2 g0.25 g0.3 g
10.811390.754730.641580.494280.49408
20.822160.773250.667050.495820.49526
30.803570.774980.709750.517690.50328
40.809900.745510.622290.494080.49208
50.827130.792330.713020.512090.50029
60.828300.755830.619710.494430.49224
70.806250.745250.628180.494220.49390
80.825510.791020.718350.515010.50192
90.810500.760360.662730.496430.49545
100.826520.763540.641460.494180.49283
110.804200.753600.648810.495050.49127
120.804470.705330.558410.496070.49374
130.824250.732270.581680.495230.49134
140.794700.685390.539690.496620.49108
150.823240.764850.644990.494130.49225
160.827300.760410.630310.494130.49203
Disclaimer/Publisher’s Note: The statements, opinions and data contained in all publications are solely those of the individual author(s) and contributor(s) and not of MDPI and/or the editor(s). MDPI and/or the editor(s) disclaim responsibility for any injury to people or property resulting from any ideas, methods, instructions or products referred to in the content.